Abstract
Effective wildfire prevention and suppression demand spatially targeted fuel management strategies, particularly in fire-prone regions. Despite advances in fire modelling, limited attention has been given to participatory approaches that integrate stakeholder knowledge into spatial prioritization frameworks. This study addresses this gap by developing a spatial decision-support framework that incorporates stakeholder preferences into wildfire prevention planning through a participatory Multi-Criteria Decision Analysis (MCDA) approach. The methodology was applied in Vale do Sousa, a high wildfire-risk region in northern Portugal, where expert knowledge and stakeholder input were combined to prioritize fuel treatment areas. The Ecosystem Management Decision Support (EMDS) system was used to implement the decision model across 2,429 afforested management units. Stakeholder performance in pairwise comparisons was evaluated using three complementary measures: Consistency Ratio (CR), Spearman’s rank correlation coefficient (S), and Euclidean Distance (ED). The results of this performance analysis were integrated into a composite weighting scheme to reflect both the coherence and the level of agreement of individual judgments. These adjusted stakeholder weights were then used to aggregate the AHP-derived criterion and sub-criterion weights, ensuring a balanced representation of diverse perspectives in the final prioritization. The results showed that 1.2% of the study area was classified as ‘very high’ priority and an additional 7.9% as ‘high’ priority, identifying locations where management resources should be concentrated to maximize preventive impact. This approach enhances the transparency, and scalability of participatory planning and supports the spatial prioritization of areas where to allocate resources to enhance wildfire suppression efforts at the landscape scale.
1 Introduction
About two million wildfires are reported worldwide every year and, although most of them are small in terms of burned area, there is a significant growth in the number of occurrences of extreme wildfire events (EWE) (Tedim et al., 2018). In Portugal, the negative impact of such EWEs on environmental, social and economic aspects has increased over time (Marques et al., 2011). The country evinces the highest ignition ratio and burned area density among south-European regions (Fernández-Guisuraga et al., 2023). Indeed, Spain and Portugal account for 50% of all fires reported in Europe (Kraus et al., 2022). This scenario calls for innovative approaches to cope with wildfires that may take into account prevention, suppression and restoration (McWethy et al., 2019).
Suppression is a critical component in addressing fire regimes, as the speed and strength of the initial attack can determine whether a wildfire becomes extreme (Kreider et al., 2024). The efficiency of initial attacks depends on factors such as fire danger ratings, fuel hazard, and forest type (Fernandes et al., 2016). However, there is a growing recognition that focusing solely on fire suppression diverts attention from preventive measures, potentially leading to unsuccessful outcomes (Xanthopoulos et al., 2020). For example, increasing fire-suppression resources does not significantly reduce the area burned in large wildfires. Instead, prevention through fuel management can lead to quicker containment and more effective identification of containment opportunities (Fernandes et al., 2016; Reis, 2016). This highlights the need to prioritize criteria such as area accessibility, availability of firefighting resources, and fuel conditions when defining prevention strategies that may facilitate suppression (Vigna et al., 2021).
In this context, both Gonzalez-Olabarria et al. (2019) and Krsnik et al. (2024) presented similar spatial MCDA approaches for prioritizing forest management zones to prevent large fires in Catalonia, Spain. MCDA has often been used to support the assessment of multiple objectives, and the diverse interests of different actors (Marques et al., 2021). To gather the necessary information from stakeholders for subsequent integration into the MCDA, various participatory techniques can be utilized, including Focus Groups (FG), workshops, in-depth interviews, the Delphi method, questionnaires, surveys, key informants, and consensus matrices (Borges et al., 2017; Campbell, 2002; Marques et al., 2021; Martins and Borges, 2007; Nordström et al., 2010; Salter et al., 2010; de Sousa Xavier et al., 2015). The literature also reports the experience of using questionnaires and surveys to conduct pairwise comparisons (Thurstone, 1927) of criteria (Ananda and Herath, 2003; Kangas, 1994; Schmoldt, 2001; Vaidya and Kumar, 2006) in the framework of the application of the Analytic Hierarchy Process (AHP) method (Saaty, 1980).
In Portugal, few studies have combined MCDA with participatory processes in forest management, and even fewer in wildfire management. Notable examples include de Sousa Xavier et al. (2015), who conducted stakeholder consultations to define criteria weights for mitigating fire risk in Algarve, Southern Portugal; Borges et al. (2017), who used participatory workshops alongside MCDA for ecosystem service provision planning; and Marques et al. (2021), who used cognitive mapping, multi-criteria questionnaires, and the Delphi survey for criteria identification and weighting. These studies underscore the potential of combining MCDA with participatory techniques to incorporate diverse stakeholder perspectives and enhance the decision-making process. However, national and municipal planning efforts―such as the wildfire risk map developed by the Institute for the Conservation of Nature and Forests (ICNF) and the Municipal Forest Fire Protection and Management Plans (PMDFCI)―often lack mechanisms to integrate local-scale knowledge or preferences from diverse stakeholder groups.
Furthermore, the integration of MCDA into Geographical Information Systems (GIS) improves decision-making structures by leveraging spatial mapping, analysis, and visualization capabilities. This geographical functionality offers a significant advantage over traditional MCDA methods (Malczewski et al., 2015; Uhde et al., 2015). Previous research has demonstrated the effectiveness of combining MCDA with GIS within the framework of forest planning (Takam Tiamgne et al., 2022; Gigović et al., 2018; Abedi Gheshlaghi et al., 2020). Despite these advancements, there is a notable absence of studies that develop a participatory GIS-based MCDA process specifically for designing spatial prevention strategies to facilitate wildfire suppression efforts, with a detailed and structured participative process.
The research conducted by Gonzalez-Olabarria et al. (2019) and Krsnik et al. (2024) highlighted the use of spatial MCDA approaches for prioritizing forest management zones, while Santana et al. (2022) applied an AHP-GIS method for wildfire risk reduction based on burning susceptibility modelling. However, these approaches largely relied on expert input and did not develop a structured participatory process integrating GIS-based MCDA for the joint design of a spatial prevention strategy with explicit focus on wildfire suppression perspectives. This gap indicates a need for methodologies that can address the complexities and challenges associated with joint forest management planning, which often involves negotiations among multiple actors with diverse interests. This study seeks to design a prevention strategy involving representatives of local forest owners, firefighters, and other stakeholders to prioritize fuel management areas based on stakeholder concerns and landscape needs. Specifically, it integrates MCDA, GIS, participatory AHP, and the Ecosystem Management Decision Support (EMDS) system (Reynolds and Hessburg, 2014) to identify strategic priority areas within the management units of the case study area (CSA). By prioritizing these areas, forest management activities can enhance the effectiveness, efficiency, and safety of firefighting operations, contributing to both wildfire prevention and suppression. The EMDS functionalities, namely the ones provided by the MCDA software Criterium Decision Plus (CDP) from InfoHarvest (Seattle, WA, USA), may help address inconsistency issues related to stakeholders’ preferences when building a hierarchical decision tree model (e.g., Reynolds et al., 2009; Abelson et al., 2021; Gonzalez-Olabarria et al., 2019). By integrating diverse decision-support tools and stakeholder perspectives, this approach strengthens strategic fuel management planning to support wildfire prevention and suppression.
The integral methodology proposed in this study (Figure 1) is expected to contribute to improving forest fire management and its acceptance, as well as maximizing the utility of resources in areas where they are limited. To this end, we consider it essential to enhance the integration of the diverse perspectives of stakeholders, improve decision-making processes in areas of joint management, and ultimately reduce the occurrence and impact of extreme wildfire events.
Figure 1

Flowchart describing the methodological steps of the study.
2 Materials and methods
2.1 Case study area
The CSA for this research is Vale do Sousa, located in northwestern Portugal, approximately 50 km east of Porto. This region extends over 28,941 hectares and includes joint collaborative management areas (ZIFs): Entre-Douro-e-Sousa (north of the Douro River) and Paiva (south of the Douro River). The primary land use in Vale do Sousa is forestry (Figure 2). The predominant species are eucalypt and maritime pine (Eucalyptus globulus Labill and Pinus pinaster Ait) while other species include pedunculate oak, chestnut and cork oak (Quercus robur L, Castanea sativa Mill, and Quercus suber L). These species, along with shrublands, cover an area of 20,318 hectares in Vale do Sousa, which is the focus of this study.
Figure 2
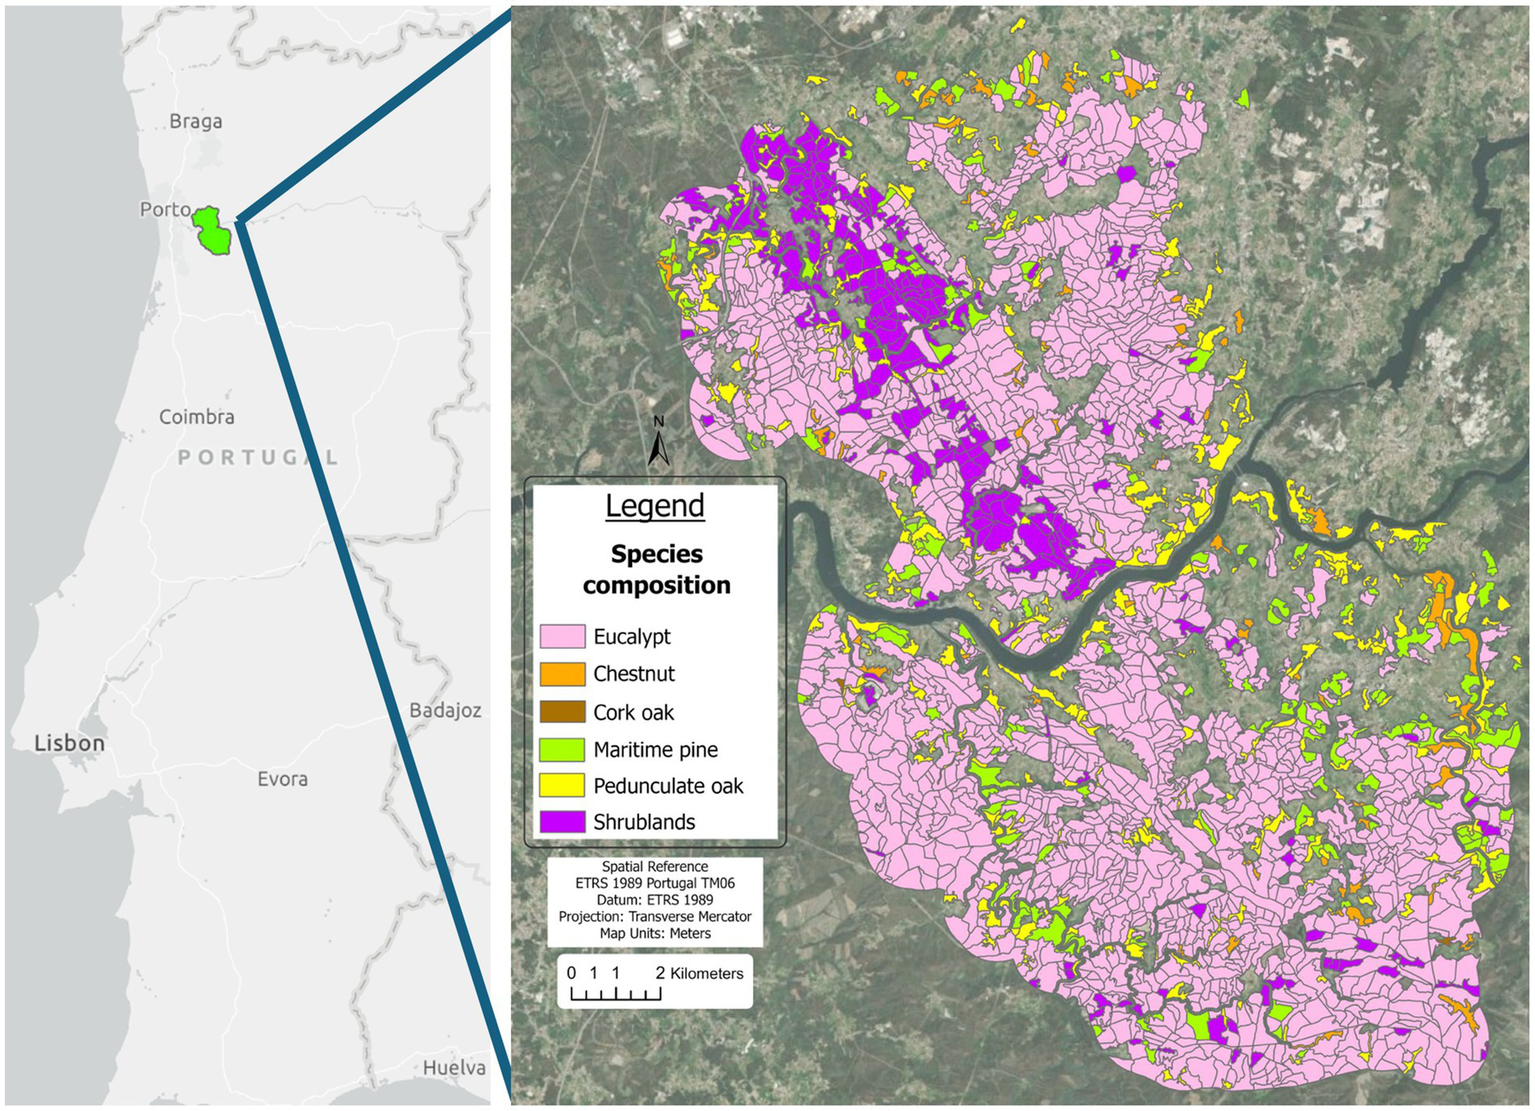
Case study area in Vale do Sousa (Portugal).
Vale do Sousa has faced significant wildfire challenges. Notable extreme wildfire events include those in 2016, which burned 2,923 hectares (10.1% of the total area), and in 2017, which burned 7,428 hectares (25.7% of the total area). These recurrent wildfires underscore the critical need for effective forest management and wildfire risk reduction strategies in the region.
The area is characterized by a fragmented forest ownership structure, with predominantly small, privately-owned forest holdings. Previous studies (Borges et al., 2017; Marques et al., 2021) have highlighted a strong stakeholder interest in wildfire risk reduction, making Vale do Sousa an ideal location for this research. The local stakeholders include a diverse group of actors with varied interests and goals, ranging from timber production to wildfire risk reduction. This fragmented ownership and diversity of interests complicates forest management and necessitates collaborative approaches.
For this study, we focused on 2,429 afforested management units (MUs) within a total of 3,205 units in the landscape. These MUs serve as the spatial basis for decision-making, and they are designed based on homogeneity of species, age, rotation, site index and topographic conditions. These MUs represent distinct forested areas within the CSA, allowing for the prioritization of fuel management efforts based on multiple ecological and socio-economic criteria. The identification and assessment of these units are fundamental to the MCDA approach applied in this research.
To address these challenges, the forest association ‘Associação Florestal do Vale do Sousa’ (AFVS) was established 29 years ago and leads the development of forest management plans within a complex decision-making context. This research took advantage of the existence of a Community of Wildfire Innovation (CWI) that includes a diverse group of stakeholders with representatives from the two AFVS local firefighters’ brigades, eight municipalities, NGOs, forest industry, government and non-governmental organizations (D9.4 Technical Periodic Report 1, FIRE-RES Project).
2.2 Participatory process
2.2.1 Definition of criteria and sub-criteria
A systematic approach was used to identify and engage a reliable and heterogeneous group of key stakeholders in wildfire prevention, suppression, and forest management from the Vale do Sousa CWI. Firstly, a snowball sampling technique was employed. A knowledgeable individual familiar with the CSA was asked to recommend other potential participants who would be valuable contributors to the study, leveraging their expertise and networks (Atkinson and Flint, 2001).
Selected stakeholders were contacted via email, receiving a detailed explanation of the study’s objectives and the importance of their participation. The email outlined what would be required, including participation in online surveys and in-person FG sessions, along with the approximate dates and deadlines for these activities. Clear communication ensured that participants were fully informed and could commit to the study’s timeline and requirements.
Once the actors were identified, the first interaction took place through an online survey sent as an attachment to the initial contact email. The survey was conducted using the free platform ‘Google Forms’ (Supplementary material 2). In addition to its open-source nature, it was chosen because of its ease of use with common electronic devices (e.g., laptop, tablet, smartphone). As an innovative feature, a video was included in the survey to support the participation by the actors. The survey included four main obligatory-response questions, each regarding agreement or disagreement with four proposed criteria. Participants were only required to respond with ‘Yes’ or ‘No’ in this section. If the answer was positive, the respondent was then directed at a sub-question regarding the elicitation of further sub-criteria for that specific criterion. In this question, the respondent was asked to mark the sub-criteria they considered relevant, with an option to suggest new ones, always making it clear that their use would depend on the availability of spatial data and the consensual discussion of these new proposals in the next phase of interaction. A final section informed participants about the upcoming interactions, explaining the FG, how they should prepare for it, and which topics it would cover. The survey concluded with a query about their availability to participate in the FG during a specified week and an acknowledgment message. Participants had up to seven working days to reply to the survey, which could be completed in a minimum of 15 min. To ensure maximum participation, a reminder email was sent to stakeholders who had not yet replied 3 days before the survey deadline.
2.2.2 Multi-criteria decision analysis characterization
The definition of sub criteria parameters was built from a FG. By parameters we mean the values for which the utility of a sub-criterion takes maximum or minimum values. In this MCDA model, a higher score corresponds to a higher priority for management. For example, a lower distance between a MU and the nearest road results in a higher priority score, as areas closer to roads are more accessible for fuel management or fire suppression activities.
The FG discussion took place over a period of 2 h in a meeting room in Penafiel (Vale do Sousa). The lead researcher acted as facilitator and was supported in this role by a local actor. Firstly, the results of the online survey conducted a few weeks before were presented. Secondly, the list of criteria and sub-criteria was discussed. Afterwards, the sub-criteria were displayed to highlight a sample range of existing values (Supplementary material 3). Each participant then had the opportunity to share their opinions and professional experiences, which were instrumental in assigning the parameters for each sub-criterion.
The final step in the participatory process involved assigning importance levels to each criterion and sub-criterion using the AHP (Saaty, 1980). This was accomplished in the last stage of the (FG) for two main reasons: to avoid burdening participants with another online survey and to allow for immediate clarification of any doubts about the pairwise comparison method by the facilitator. Participants used the pairwise comparison method (Thurstone, 1927) to rank the importance of each criterion against the others on a scale from one to nine, where one indicates equal importance and nine indicates an absolute difference in priority (Saaty, 1980) (Supplementary material 4). The same process was applied to the sub-criteria within each criterion. This was influential to develop the pairwise comparison matrix, normalize the weights, and calculate the consistency ratio (CR) for each participant.
2.3 Participants’ contribution analysis
As part of the quest to elaborate a consensual order of priorities, in which the opinion of all participants is taken into account, but seeking a group opinion, the preferences of each participant and their performance in the pairwise comparison are analysed.
To assess the quality and alignment of participants’ inputs, we used a combination of Euclidean distance (ED), Spearman rank correlation (S), and CR, similarly to Srđević et al. (2008). Each metric captures a different dimension: ED measures divergence from the priorities of one individual to each of the others, S captures ordinal agreement in priorities, and the CR evaluates the internal coherence of judgments. This combined approach provides a more nuanced evaluation than any single metric alone. Additionally, we calculated the consensus convergence algorithm (Regan et al., 2006) implemented with Python for the dataset (Supplementary material 5), and the results closely matched those obtained from our selected measures, supporting the robustness and reliability of this approach.
2.3.1 Consistency ratios
Analysing participants’ performance when making the pairwise comparisons is instrumental to ensuring the reliability and validity of the participatory weighting process. CR values in an AHP model express the overall consistency in a set of pairwise comparisons among criteria (with respect to the model goal) or among sub-criteria with respect to their respective criterion (Saaty, 1980). A CR value is considered acceptable if it is ≤0.10, with values greater than 0.10 indicating progressively worse consistency in the set of comparisons. High CR values in participants’ responses can arise for several reasons, including misunderstanding of the pairwise comparison process. However, given the participatory nature of this study and the relatively small group of stakeholders to involve, a strict exclusion based on CR thresholds was intentionally avoided. While high inconsistency can introduce noise into the decision process, completely disregarding a participant’s input risks undermining the consensus and stakeholder agreement on the final priorities (Temesi, 2006; Nordström et al., 2010; Kazibudzki, 2016). In inclusive decision-making contexts, particularly those aimed at fostering shared ownership of the outcomes, it is essential to preserve all contributions.
To address participant inconsistencies, we assigned weights to participants based on the normalization of inverse values of their CR scores (Equation 1) By doing so, participants with greater consistency exert a stronger influence on the final aggregated results, while those with higher inconsistencies are proportionally down weighted.
Where is the weight assigned to participant , is the consistency ratio of participant , is the total number of participants.
Weights for participants were calculated for the different pairwise comparisons they made, both across criteria and within each group of sub-criteria associated with each criterion. These different CRs were then combined into a single ratio for each participant with an arithmetic mean.
2.3.2 Spearman’s rank correlation
The second measure used to evaluate and assign weights to participants is the S (Equation 2). This non-parametric measure assesses the strength and direction of the monotonic relationship between a participant’s individual assessment and the collective group’s opinion. In this study, each participant’s pairwise comparisons resulted in a set of priority scores for each Management Unit (MU) after running the model independently. However, because S is based on ranked data rather than absolute values, these priority scores were converted into ranks before computing the correlation.
Where is Spearman’s rank correlation coefficient, is the difference between the ranks of the MU in the participant’s ranking and the group ranking, is the total number of MUs.
To establish a reference group opinion, the geometric mean of all participants’ preferences was computed for each phase of the process (criteria and sub-criteria comparisons), and the corresponding group ranking of the MUs was determined. S was then calculated to quantify the agreement between each participant’s ranking and the group ranking. By incorporating this measure, we ensured that greater weight was assigned to participants whose judgments were more aligned with the broader stakeholder group, enhancing the robustness and representativeness of the decision-making process.
2.3.3 Euclidean distances
The third measure used to evaluate and assign weights to participants is the ED, which quantifies the degree of alignment between an individual participant’s assessments and those of the other participants (Equation 3). Unlike S, which is based on rankings, ED is computed directly from the scores assigned by each participant to the MUs. To assess agreement, the ED was calculated between each participant’s scores and those of every other participant, individually. This process was repeated for all participants and for each phase of the analysis (criteria weighting and sub-criteria weighting within each criterion). The final ED value assigned to each participant was the average of all pairwise distances computed for them in a given phase. A lower ED indicates that a participant’s evaluations were more closely aligned with those of other participants, while a higher value suggests greater deviation in judgment.
Where is the score given by participant to management unit , is the score given by participant to the same management unit . is the total number of management units.
To derive the final participant weights from ED and S, the inverse of each ED and S value was computed and then normalized (Equation 4) across all participants for each phase, ensuring that those whose evaluations were more aligned with all the others had higher assigned weights.
Where is the final weight assigned to participant , is the ED or S of participant to all others. is the total number of participants.
The final weights assigned to each participant were derived from the average of the three measures: CR, ED, and S. These weights varied across different phases of the evaluation; one set was assigned for the criteria weighting phase, and separate sets were assigned for each sub-criteria group. CR was computed only once per participant, as it reflects the internal coherence of responses and, consequently, the participant’s understanding of the pairwise comparison exercise. Since the nature of the task remains the same across phases, a participant’s level of understanding is assumed to be consistent throughout. Conversely, ED and S were recalculated for each phase, as a participant’s alignment with the group consensus may fluctuate depending on the specific comparisons being made. This approach ensures that a participant whose responses diverge from the group in one phase (leading to a lower weight) can still receive a higher weight in another phase if their judgments align more closely with the group’s preferences in that context.
By incorporating this method, the MCDA model aimed to achieve a balanced and representative aggregation of participant inputs, enhancing the robustness and reliability of the final prioritization outcomes.
2.4 Hierarchical decision model and priority maps
The spatial data processing work took advantage of Geographical Information Systems (GIS), and Decision Support Systems (DSS) functionalities. Data acquisition involved a forest field inventory and publicly available spatial information for the Vale do Sousa classification into MUs. Biometric variables were processed by DSS growth and yield functionalities (e.g., Nunes et al., 2022). Additionally, the ‘FlamMap’ software (Finney, 2006) was used to estimate two fire behaviour variables using available biometric information, predominant wind directions, and the Portuguese fuel model (Fernandes et al., 2009). The decision support software CDP was used to build a hierarchical model to characterize the problem and the structure of its solution. The software facilitated the structuring of the model by organizing its overall objective (or goal), criteria, and sub-criteria levels, the alternatives (the MUs), and participants’ performance weights. This approach ensured that each participant’s preference was reflected in the MCDA model, rather than simply averaging the group’s preferences. The EMDS system, integrated within ArcGIS Pro (Reynolds et al., 2023), applied the MCDA model developed in the CDP software to each afforested MU. This process generated priority maps for each criterion, as well as a final composite map that integrates all criteria.
The symbology chosen for these maps utilized five equal intervals, spanning the minimum (‘Very low’) to maximum (‘Very high’) priority values assigned to each MU. Each class represents a constant data range, ensuring a straightforward and consistent interpretation of priorities (Milic et al., 2019).
Moreover, representative maps were developed for each of the 17 sub-criteria included in the study. The symbology of these maps was generated by using the Jenks Natural Breaks algorithm, which creates class breaks that group similar values together while maximizing differences between classes. This method enhances visualization by avoiding unrealistic class distributions caused by extreme values in the dataset (Chen et al., 2013).
2.5 Agreement and sensitivity analysis
To evaluate the reliability and robustness of the group-based prioritization, two complementary analyses were conducted: a consistency check comparing individual and group outputs, and a sensitivity analysis exploring the impact of weight changes on the prioritization results.
For the consistency analysis, the spatial priority maps generated using the weight vectors provided by each of the eight individual stakeholders were compared to the map obtained from the aggregated group weights. Priority values were grouped into five equal-interval classes, consistent with the visualization approach used in the results. For each MU, the number of individual maps that assigned the same class as the group scenario was recorded. The average number of matches per MU across all participants was calculated to quantify the overall level of agreement between individual and group prioritizations.
Sensitivity was assessed through a local perturbation approach in which each weight was adjusted independently by a fixed percentage (±10%), with the remaining weights proportionally rescaled to preserve the overall structure. This approach aligns with the crossover value suggested by Saaty (1994) to assess criticality, and applied in similar studies (Marto et al., 2018; Abelson et al., 2021). For each perturbed scenario, the Mean Absolute Deviation (MAD) of the priority scores across all MUs, relative to the base (group) scenario, was computed to provide a summary measure of average change per unit. In addition, the number of classification changes per MU across all scenarios was recorded.
3 Results
3.1 Definition of criteria and sub-criteria
A total of 22 people were contacted, with 19 ultimately participating in the first stage of the study. The participants represented a broad range of entities, including four town councils, the National Republican Guard, two public agencies responsible for environmental protection, a company specializing in forest fire protection and rural firefighting, two pulp and paper companies, an electric utility company overseeing powerline management, two local forest associations, three local firefighting organizations, and the National Authority for Emergency and Civil Protection. The responses from the 19 participants were evaluated, and the final criteria and sub-criteria were selected as outlined in the methodology.
The criteria are composed of four groups, originating from the initially proposed ones, all of which were accepted by the respondents in the first survey. A total of 17 measurable sub-criteria were selected (see Supplementary material 1 for individual sub-criteria maps), reduced from the 22 originally proposed. The five sub-criteria that were not retained were excluded based on limited support from stakeholders during the first survey. At the same time, other sub-criteria were added based on their suggestions, such as the wildfire resistance indicator and shrub biomass. These new sub-criteria were analysed, discussed during the FG meeting, and included in the study once it was determined that spatial data could be obtained to characterize them.
The criterion ‘Fuels’ assesses the status of the vegetation in the area by analysing the elected sub-criteria. Understanding the current vegetation condition, specifically those variables that can be modified by human actions (e.g., canopy cover, crown base height) allows for effective management. To obtain the values for the five sub-criteria selected, a set of previous studies, software and models were used (Nunes et al., 2022; Faias et al., 2012; Gómez-García et al., 2016; Mönkkönen et al., 2014).
The criterion ‘Potential for extreme fires’ incorporates maps from the ICNF (ICNF, n.d.-b): ‘Territories with potential for large fires’ (areas of more than 500 hectares that have not burned for more than 10 years in the ‘High’ or ‘Very High’ danger classes) and the ‘Short-term danger map of rural fires’. It also includes two other sub-criteria: a simulated spread rate map using FLAMMAP software (Finney, 2006) and a sub-criterion that addresses the resistance of the forest to the fire when it occurs, that is Wildfire Resistance Indicator (Ferreira et al., 2015).
‘Suppression drivers’ refers to characteristics of a MU that would maximize the combination of accessibility, availability of suppression infrastructures, optimal locations or adequate topographic conditions. The sub-criterion accessibility from the forest road network (ICNF, n.d.-a)., refers to the distance firefighters would need to cover on foot to reach the area from their vehicles. The slope (Agência para a Modernização Administrativa, n.d.), distance to water points (ICNF, n.d.-a) and proximity to the designed firebreak network (ICNF, n.d.-a) are also included, as they are considered to have an influence in the effectiveness of suppression efforts.
The Vulnerability criterion attempts to identify areas that are particularly threatened by fire and that hold significant cultural, social, or environmental value. These are often referred to as ‘high values at risk’. Specifically, the sub-criteria include urbanized areas (Direção-Geral do Território, 2020), which focus on protecting humans and their infrastructure. Another sub-criterion targets conservation corridors (ICNF, n.d.-c), which addresses key environmental assets, and the aspect (Agência para a Modernização Administrativa, n.d.), which represents specific in-risk locations based on their orientation. The inclusion of aspect was controversial during the participatory process, and its relevance was discussed during the FG. Nevertheless, other related studies have incorporated this type of sub-criterion (Abedi Gheshlaghi et al., 2020; Arca et al., 2020; Gigović et al., 2018; Sivrikaya and Küçük, 2022; Van Hoang et al., 2020). The fourth is a map with population density by municipality (Eurostat, 2021).
3.2 Sub-criteria scale parameters
During the FG discussion, nine participants representing a range of organizations and expertise—including ICNF-GFR (forest and fire policy), Navigator (industrial forest management), CIM Tâmega e Sousa & CM Penafiel (local wildfire prevention and land management), AFEDV & AFVS (private forest owners and technical assistance), BV Penafiel (wildfire suppression), AGIF (national fire management strategy), and NPC-GNR Penafiel (law enforcement and environmental monitoring)—came together to discuss the relevant criteria and sub-criteria for the study. In our model, these sub-criteria are also the attributes that read spatial and tabular data, and the “parameters” we refer to are in fact the bounds used to define CDP utility-function curves, which translate raw attribute values into a 0–1 priority score.
Although the online survey had engaged 19 participants, having nine for the FG was considered appropriate, since every stakeholder sector was present for this phase. The FG took place in a town within the CSA. Most of the parameters for the sub-criteria were assigned there, and the remaining ones were determined post-FG by consulting local datasets (Table 1).
Table 1
| Criteria | Sub-criteria | Scale parameters (min–max) | Units |
|---|---|---|---|
| Potential for extreme fires | Wildfire resistance indicator | 5–1 | Class (1–5) |
| Rate of spread | 2–6 | m/min | |
| Hazard map | 1–5 | Classes (1–5) | |
| Potential large fires map | 20–90 | % of MU area | |
| Fuels | Canopy cover | 20–60 | % |
| Above ground biomass | 5–300 | tn/ha | |
| Resprouters | 90–10 | % | |
| Shrubs biomass | 1–10 | m3/ha | |
| Crown base height | 4–2.5 | m | |
| Suppression drivers | Accessibility for fire trucks | 100–80 | m |
| Slope | 40–5 | % | |
| In touch with fire breaks | 15–60 | % of MU area | |
| Distance to water point | 1,000–500 | m | |
| Vulnerability | Distance to urbanized areas | 300–50 | m |
| Aspect | 1–4 | Classes (1–4) | |
| Conservation corridors | 20–60 | % of MU area | |
| Population density | 20–250 | People/km2 |
Elicited criteria and sub-criteria and their corresponding parameters and units.
‘min–max’ refers to the endings sides of the scale that contributes to the minimum and maximum values to overall priorities.
It is necessary to explain the definition of certain sub-criteria parameters. For example, in the case of the ‘Aspect’ sub-criterion, the parameters are expressed by classes based on slope orientation, with Class one representing North, Class two representing South, Class three representing West, and Class four representing East. Additionally, some sub-criteria have parameters expressed as percentages. For instance, ‘In touch with fire breaks’ refers to the percentage of the area of a Management Unit that overlaps with firebreaks. Similarly, for the ‘Resprouters’ sub-criterion, the parameter represents the percentage by area of resprouting species relative to seeders. This distinction is significant, as studies, including Botequim et al. (2015), have demonstrated that biomass accumulation following disturbance is slower in areas where the percentage of resprouting species is higher compared to seeders.
3.3 Criteria and sub-criteria weighting
After the FG and the definition of utility function parameters for the sub-criteria, the remaining step was to assign to each a weight to each criterion and sub criterion (the relative importance of each to setting the priority for management). That information was obtained from a survey utilizing the AHP’s pairwise preference elicitation approach (Supplementary material 4), collected during the last step of the FG. The responses from eight out of the nine FG initial participants were collected. First, the responses were used to calculate each participant’s weight related to their performance and alignment with the group as measured by their CR, ED and S (Section 3.4). Then, the final weights were obtained for the overall group (Tables 2, 3).
Table 2
| Criteria weights (0–1) | |||
|---|---|---|---|
| Fuels | Potential for extreme fires | Suppr. drivers | Vulnerab. |
| 0.398 | 0.344 | 0.077 | 0.181 |
Final criteria weights.
Table 3
| Criteria | Sub-criteria | Weights (0–1) per criteria group |
|---|---|---|
| Potential for extreme fires | Wildfire resistance indicator | 0.108 |
| Rate of spread | 0.398 | |
| Hazard map | 0.16 | |
| Potential large fires map | 0.334 | |
| Fuels | Canopy cover | 0.126 |
| Above ground biomass | 0.317 | |
| Resprouters | 0.106 | |
| Shrubs biomass | 0.307 | |
| Crown base height | 0.144 | |
| Suppression drivers | Accessibility for fire trucks | 0.48 |
| Slope | 0.247 | |
| In touch with fire breaks | 0.156 | |
| Distance to water point | 0.112 | |
| Vulnerability | Distance to urbanized areas | 0.254 |
| Aspect | 0.337 | |
| Conservation corridors | 0.188 | |
| Population density | 0.221 |
Final sub-criteria weights.
3.4 Participant’s contribution weights
The CR values for each participant were calculated to illustrate their consistency in making pairwise comparisons (Figure 3). Considering the findings of Saaty (1980), some participants exhibited CR values slightly above the 0.1 CR threshold, highlighting potential challenges in accurately comparing the criteria or sub-criteria.
Figure 3

Representation of the consistency ratios obtained per participant and per phase.
To account for these inconsistencies, performance weights were assigned to participants based on the normalized inverse values of their CR scores (Equation 1). Participants with lower CR values, (indicating higher consistency) had a greater influence on the final prioritization. Conversely, participants with higher CR values were appropriately down weighted to ensure the robustness of the aggregated results (Table 4).
Table 4
| p1 | p2 | p3 | p4 | p5 | p6 | p7 | p8 |
|---|---|---|---|---|---|---|---|
| 0.143 | 0.158 | 0.032 | 0.081 | 0.056 | 0.096 | 0.317 | 0.117 |
Distribution of weights assigned to each participant’s performance based on CRs.
The S and ED measures highlighted the strong alignment of participant one’s preferences with those of the others (Table 5). Participants seven and eight also scored positively on these measures at different stages of the exercise. Noteworthy are participants three, four, five and six, whose S and ED scores highlight discrepancies in opinion on the weights of importance with the rest of the group. This means that the opinion of these participants, when combined with their CR, is taken into account but has less relevance in the final priority scores.
Table 5
| Criterion | Measure | P1 | P2 | P3 | P4 | P5 | P6 | P7 | P8 |
|---|---|---|---|---|---|---|---|---|---|
| General criteria | S | 0.132 | 0.130 | 0.127 | 0.129 | 0.129 | 0.102 | 0.124 | 0.127 |
| ED | 0.148 | 0.131 | 0.142 | 0.110 | 0.078 | 0.119 | 0.138 | 0.133 | |
| CR | 0.143 | 0.158 | 0.032 | 0.081 | 0.056 | 0.096 | 0.317 | 0.117 | |
| Avg. | 0.141 | 0.140 | 0.100 | 0.107 | 0.088 | 0.106 | 0.193 | 0.126 | |
| Fuels | S | 0.132 | 0.131 | 0.118 | 0.105 | 0.126 | 0.131 | 0.126 | 0.130 |
| ED | 0.148 | 0.091 | 0.151 | 0.117 | 0.132 | 0.094 | 0.128 | 0.139 | |
| CR | 0.143 | 0.158 | 0.032 | 0.081 | 0.056 | 0.096 | 0.317 | 0.117 | |
| Avg. | 0.141 | 0.127 | 0.100 | 0.101 | 0.105 | 0.107 | 0.190 | 0.129 | |
| Suppression drivers | S | 0.142 | 0.128 | 0.136 | 0.100 | 0.140 | 0.135 | 0.111 | 0.108 |
| ED | 0.153 | 0.132 | 0.112 | 0.117 | 0.128 | 0.108 | 0.119 | 0.131 | |
| CR | 0.143 | 0.158 | 0.032 | 0.081 | 0.056 | 0.096 | 0.317 | 0.117 | |
| Avg. | 0.146 | 0.139 | 0.093 | 0.099 | 0.108 | 0.113 | 0.182 | 0.119 | |
| Vulnerability | S | 0.129 | 0.131 | 0.098 | 0.129 | 0.132 | 0.130 | 0.124 | 0.127 |
| ED | 0.121 | 0.156 | 0.119 | 0.135 | 0.050 | 0.126 | 0.146 | 0.148 | |
| CR | 0.143 | 0.158 | 0.032 | 0.081 | 0.056 | 0.096 | 0.317 | 0.117 | |
| Avg. | 0.131 | 0.148 | 0.083 | 0.115 | 0.079 | 0.117 | 0.196 | 0.131 | |
| Potential for extreme fires | S | 0.127 | 0.095 | 0.136 | 0.136 | 0.125 | 0.111 | 0.134 | 0.137 |
| ED | 0.149 | 0.127 | 0.110 | 0.094 | 0.143 | 0.124 | 0.132 | 0.121 | |
| CR | 0.143 | 0.158 | 0.032 | 0.081 | 0.056 | 0.096 | 0.317 | 0.117 | |
| Avg. | 0.140 | 0.127 | 0.093 | 0.104 | 0.108 | 0.110 | 0.194 | 0.125 |
Participants weights based on the three measures averaged (Avg.); S, ED, and CR.
3.5 Hierarchical model
The hierarchical model (Figure 4), developed in the CDP software, integrates participants’ preferences while adjusting for the CR, S and ED of their assessments. No participant’s input is excluded, but their individual CR and level of alignment with the group’s preferences values are used to adjust the weight of their contributions. Therefore, the weights for their participation (Table 5) are included in the CDP model that contains the MCDA. Figure 5 illustrates a simplified version of the model with the criteria and sub-criteria.
Figure 4
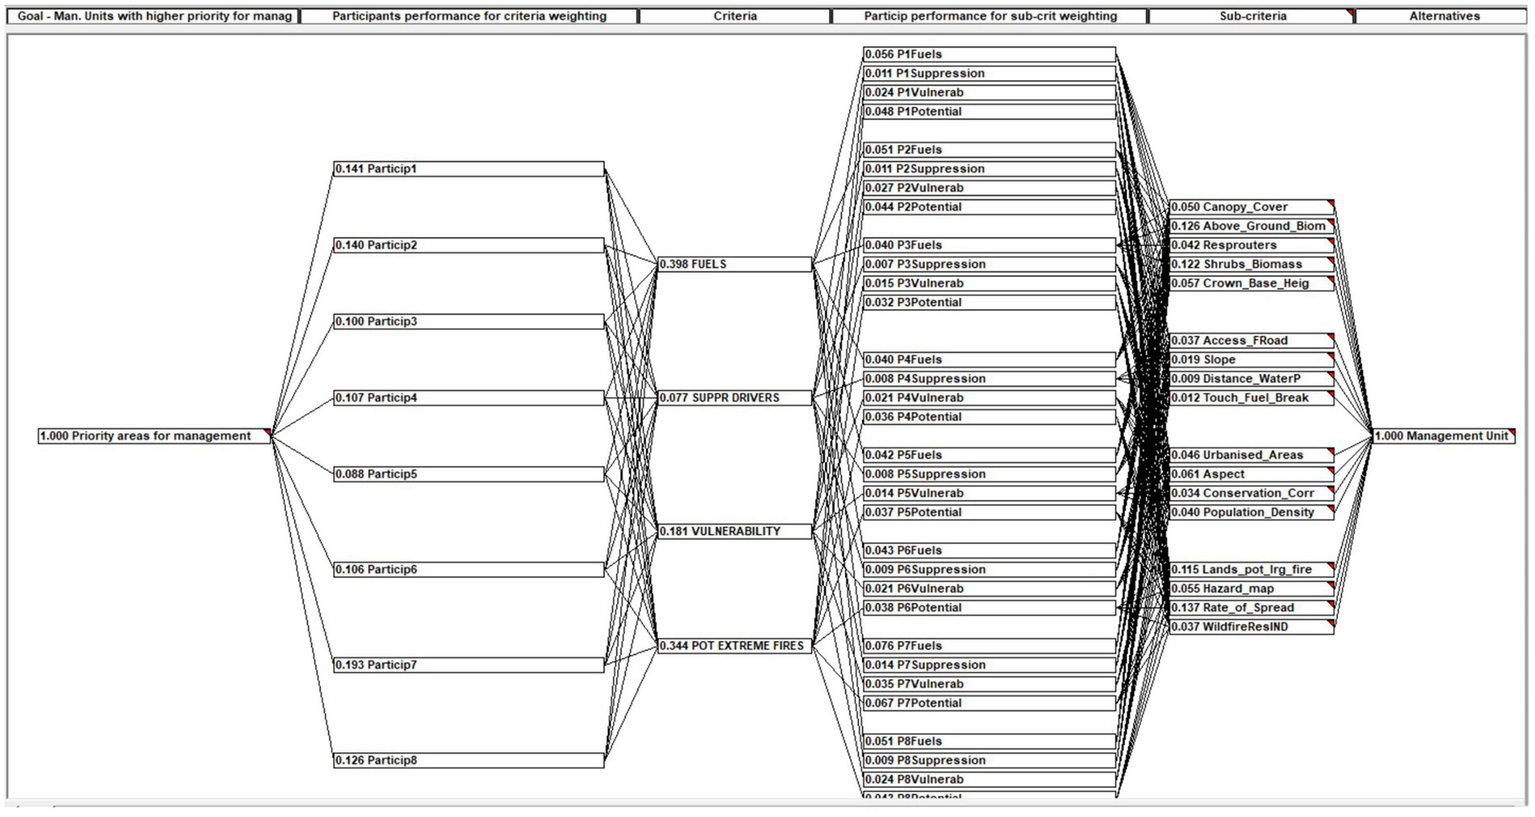
Hierarchical prioritization model in CDP integrating the participants performance and their weights of importance.
Figure 5
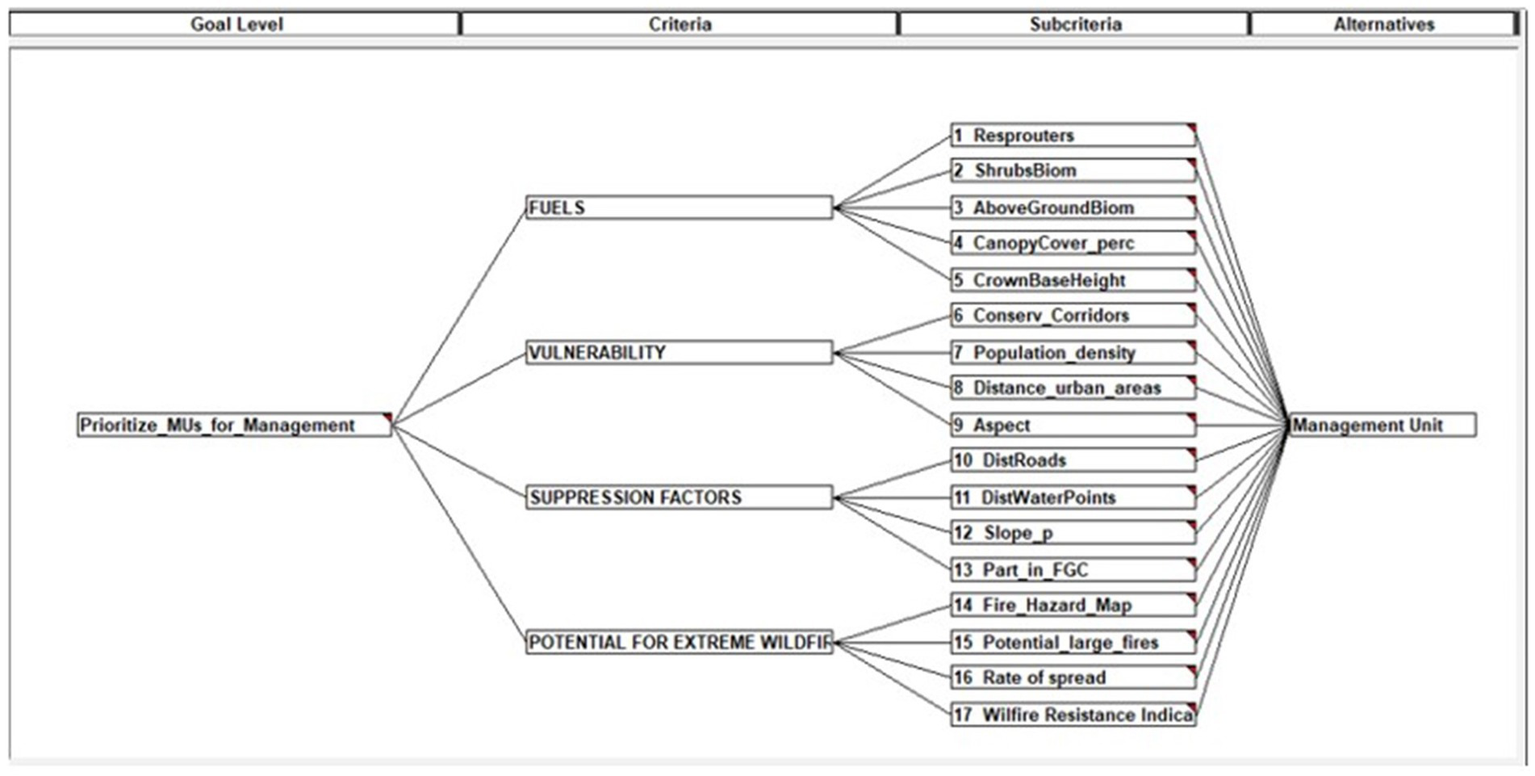
Structure of the MCDA model in the CDP software.
The model begins by incorporating each participant’s evaluation of the relative importance of the main criteria groups. For example, the weight of the criterion ‘Fuels’ is calculated as a weighted summation of each participant’s preferences, adjusted by their individual weights of performance.
The same approach applies to the sub-criteria. Participants’ evaluations of relative importance of the sub-criteria within each criterion group are weighted based on their CR, S and ED weights, reflecting the level titled “Participant performance for sub-criteria weighting.” The final weights for each sub-criterion are calculated by aggregating the weighted inputs from all participants, ensuring that both the criteria and sub-criteria reflect a balanced consensus, while accounting for individual inconsistencies or large differences with the group’s preferences. This phase-specific approach ensured that different preferences in one phase did not disproportionately impact their overall contribution to the prioritization process.
3.6 Maps of priorities
The final output of the MCDA process is a set of spatially explicit priority maps, generated to aid decision-making in the CSA. These maps were produced using ArcGIS Pro and the EMDS software, applying the CDP model described in the previous section individually to each MU. For each MU, its lowest criteria values are converted to normalized priorities (scores) using AHP’s direct method based on the scale parameters (Table 1).
Four maps for the criteria ‘Fuels’, ‘Suppression drivers’, ‘Potential for extreme fires’, and ‘Vulnerability’ (Figure 6), were obtained, pointing out the five classes of priority for management based on each sub-criteria defined in the hierarchical model. A final map of priorities for management aligning with the objectives of this study is produced from the weighted combination of the other four criteria maps (Figure 7). From this map we can extract the following information regarding the area distribution for each priority class (Table 6).
Figure 6
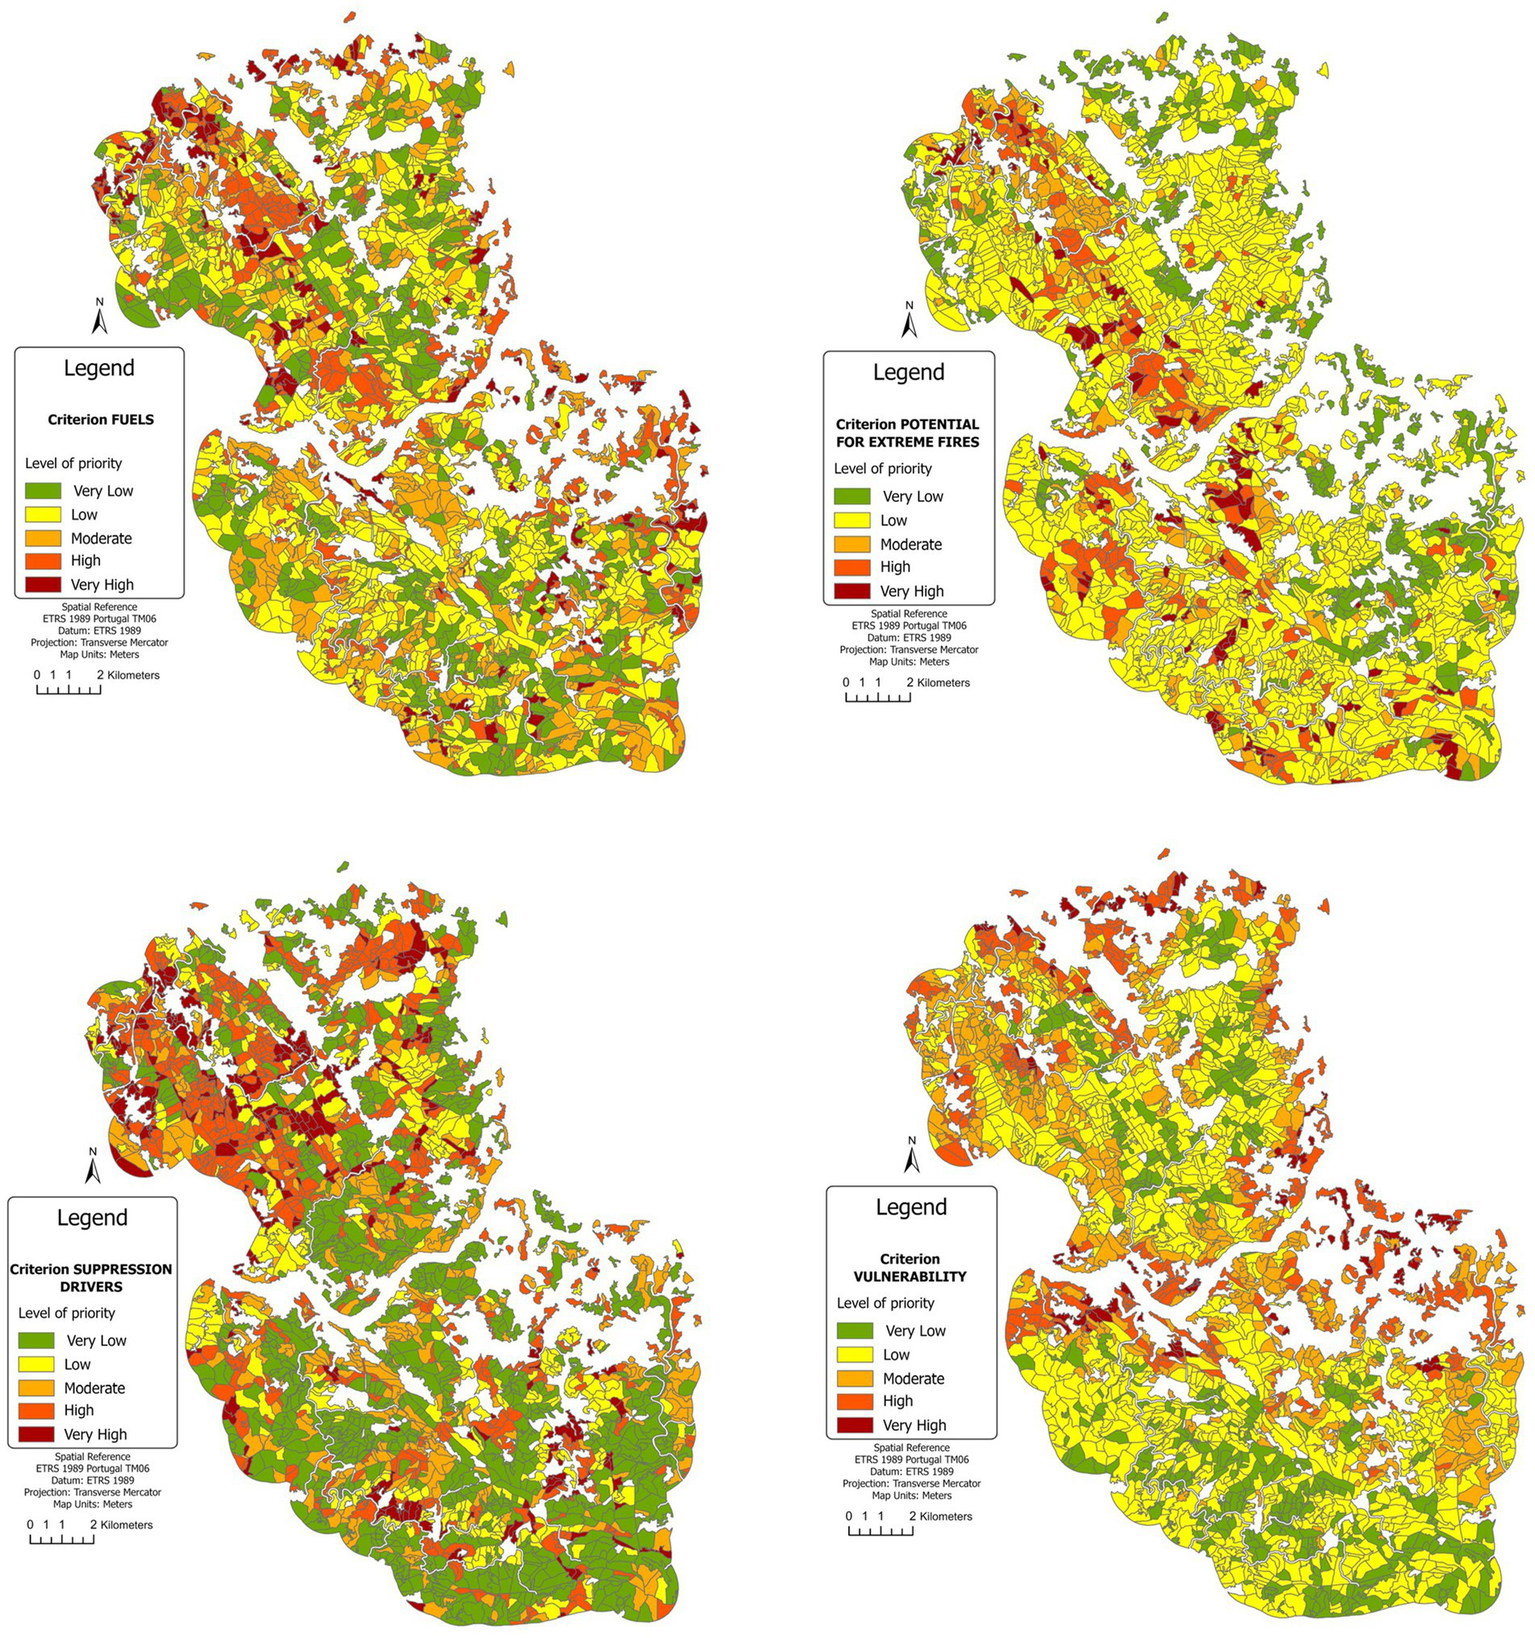
Maps characterizing the four criteria groups after combining each corresponding sub-criteria and weights.
Figure 7
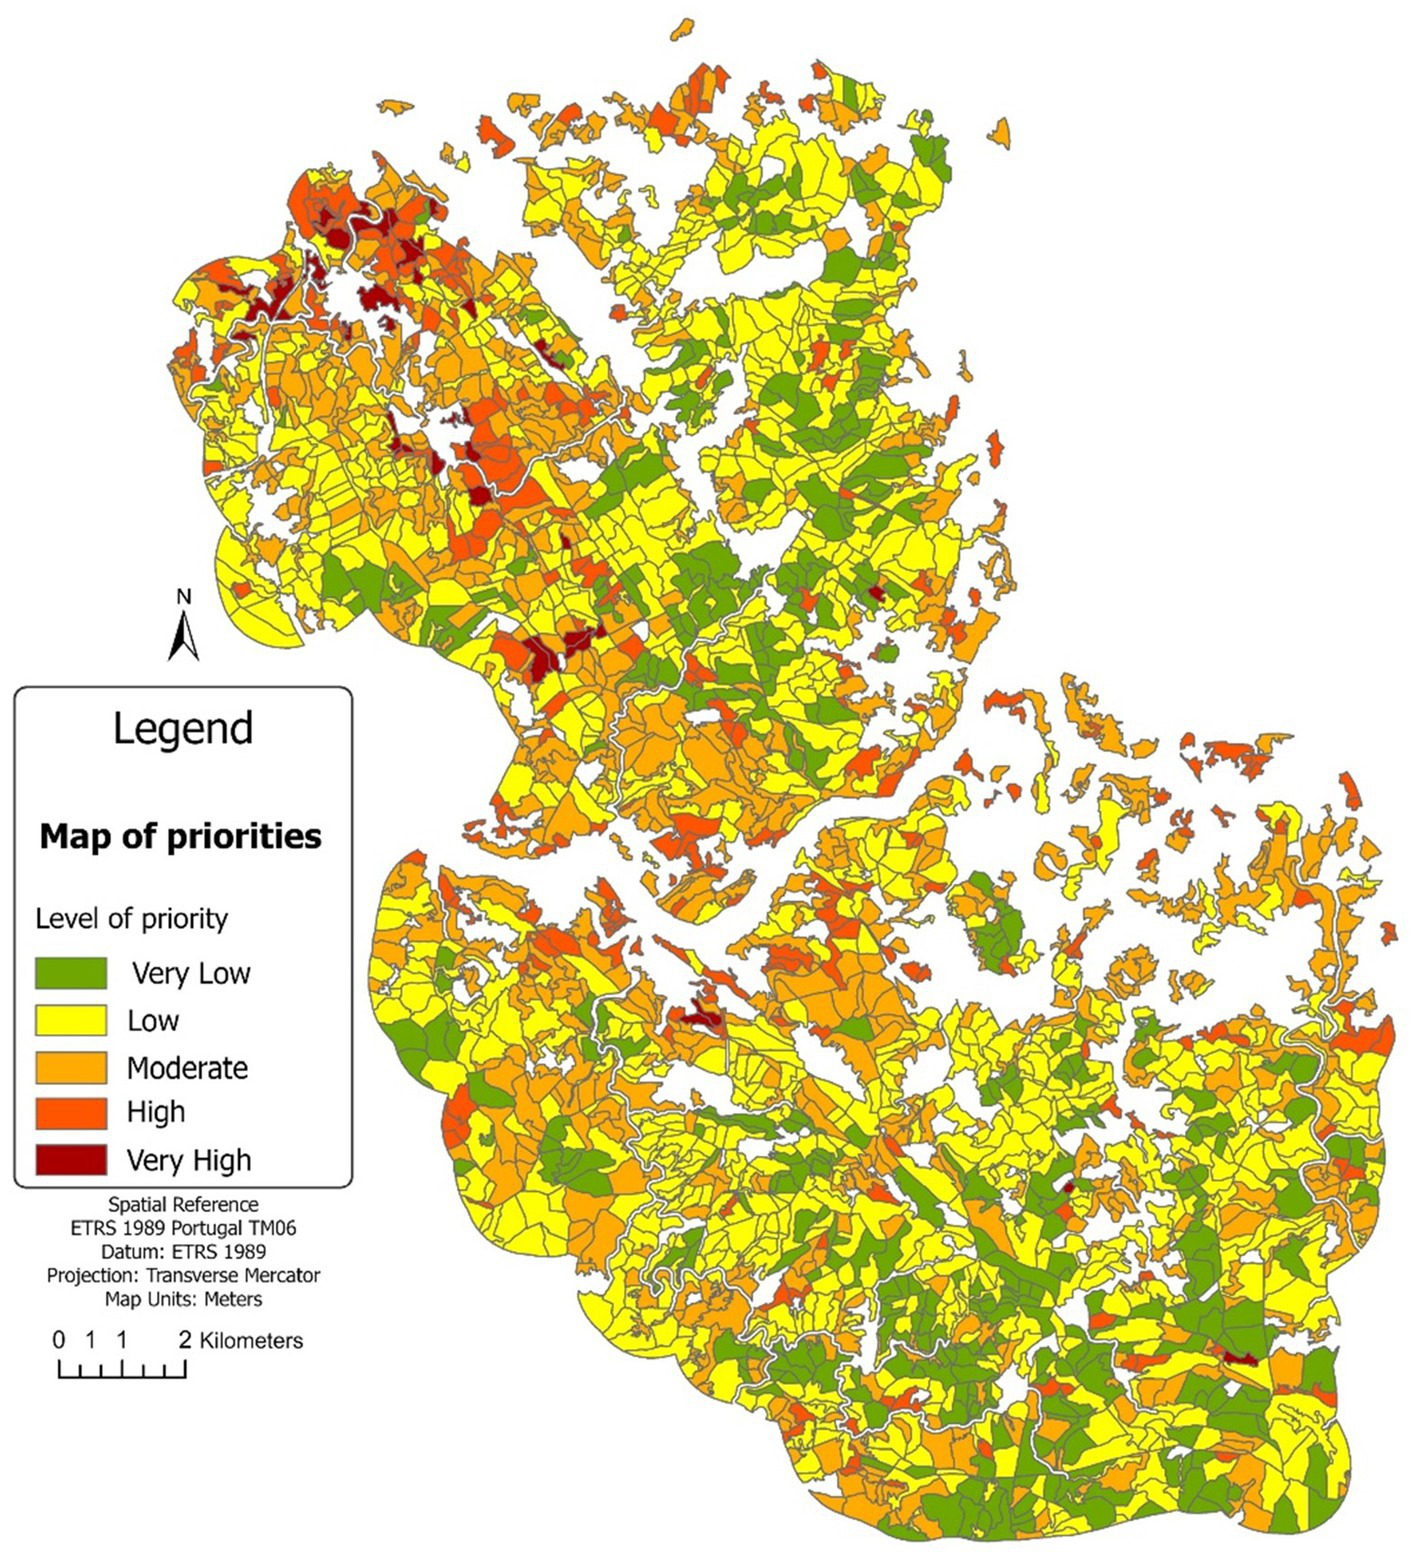
Final map of priorities combining the four criteria maps with the corresponding weights.
Table 6
| Priority class | Area (ha) | Percentage |
|---|---|---|
| Very Low | 3,636 | 17.9 |
| Low | 8748.1 | 43.1 |
| Moderate | 6074.6 | 29.9 |
| High | 1611.7 | 7.9 |
| Very high | 247.3 | 1.2 |
Visualization of the area distribution per priority class.
Using equal intervals to visualize the maps of priorities we see that a smaller number of MUs fall in the higher classes regarding priority for management. For a MU to score in the ‘Very High’ class, it has to have high priority scores across all four criteria groups, and it can be observed how rarely that occurs (Table 6). It can be seen how most of the areas with very high management priority are located in the northwestern part of the CSA, creating a sort of priority band stretching from the Douro River to the far north. This aligns with the priority of three of the four priority maps by criteria, where we can see that both ‘Fuels’, ‘Suppression Drivers’ and ‘Potential for Extreme Fires’ have the highest priority areas in those zones. In Supplementary material 1, it is possible to see the 17 maps of each sub-criterion that characterize these four criteria maps and that visually illustrate the basis of the result obtained.
While the resulting priority map identifies areas of strategic interest for fuel management, it is important to note that this framework is prescriptive rather than predictive. Its purpose is not to forecast wildfire occurrence, but to support decision-making by structuring and spatially representing stakeholder preferences, expert knowledge, and contextual criteria. Therefore, traditional statistical validation techniques such as ROC curves or F1-scores are not applicable. Instead, a practical form of validation was conducted through visual inspection of high-priority areas using satellite imagery, confirming consistency with expected criteria combinations (e.g., fuel accumulation near populated zones and road networks). This validation was documented in a video shared with stakeholders for confirmation.
3.7 Agreement and sensitivity outcomes
The analysis of agreement between individual stakeholders and group prioritization revealed an average match of 4.79 out of 8, indicating that, for each MU, nearly 60% of the individual classifications aligned with the group-based result.
To assess sensitivity, 42 weight perturbation scenarios were tested: one ±10% perturbation for each of the 17 sub-criteria and 4 main criteria. For each scenario, the MAD was computed across all MU relative to the group scenario. The MAD values ranged from near-zero up to a maximum of 0.00425, corresponding to less than 0.5% of the full priority scale. The five scenarios that resulted in the highest deviations corresponded to adjustments in the following weights: Potential for Extreme Fires (±10%), Fuels (−10%), Rate of Spread (+10%), and Above Ground Biomass (+10%). The number of MUs that experienced a class change under the most sensitive scenario was 78, representing 3.2% of the 2,429 MUs in the study, and highlighting the model’s general stability under perturbation.
4 Discussion
The research aimed at integrating a robust prioritization framework for landscape and wildfire management in the Vale do Sousa region by integrating stakeholder input through a participatory MCDA process. Using the AHP we evaluated criteria and sub-criteria that influence wildfire risk and suppression strategies. A total of 19 participants contributed to an online survey, and a FG discussion with nine participants refined the sub-criteria parameters and obtained the corresponding weights. The FG size adhered to recommended guidelines of six to 12 participants for effective discourse (Krueger and Casey, 2015). While other wildfire prioritization studies do not detail the rationale behind FG composition (Krsnik et al., 2024), this research addresses representativeness by including stakeholders from municipalities, firefighting units, public corporations, private enterprises, and representatives of the forest owners It is acknowledge that small group dynamics may introduce bias due to dominant voices or pressure to conform. To mitigate these risks, the session followed a structured format, with targeted prompts to quieter participants and individual elicitation of preferences both for the criteria and sub-criteria elicitation and for their respective weights. These measures helped ensure balanced input across all stakeholder perspectives.
Representativeness was also considered during the participatory process in which stakeholders were involved in up to three stages. Moreover, the process ensured that no opinion was excluded from the analysis while applying a range of techniques to synthesize diverse individual opinions into a group opinion. CR, S and ED were calculated for each participant to address the reliability of their pairwise comparisons, and their alignment as a group, and their performance was weighted accordingly, as per Srđević et al. (2008). Many MCDA-based prioritization studies disregard the process of weighting the participation of each stakeholder involved when aggregating preferences (Gonzalez-Olabarria et al., 2019), potentially reducing decision reliability when participants have varied preferences and knowledge of the tools used. The two-step weighting adjustment for different decision phases enhances robustness and addresses flexibility across decision points, a methodological refinement rarely employed in wildfire management research. This refinement mitigates the risk of over-penalizing participants who may have shown lower alignment with the group in one phase but aligned more in another, thus maintaining inclusivity while addressing methodological rigor. One limitation of this study is the absence of sensitivity analysis across different stakeholder groups. While a group consensus approach was adopted, future research could explore variations by clustering stakeholders with similar backgrounds to assess the impact of divergent weightings on prioritization outcomes. Such analysis could enhance the robustness and adaptability of the decision-support process.
The FG discussion provided valuable qualitative insights into the contextual relevance of selected sub-criteria, complementing the quantitative AHP process. Assigning thresholds for parameters such as population density based on local data ensured that prioritization remained context-sensitive. This approach is consistent with regional planning frameworks that advocate localized calibration of decision criteria (Geneletti, 2013). The prioritization results reveal significant variability in wildfire management needs across the study area. The smaller proportion of the area (1.2%) represented by Class five (‘Very High Priority’) indicates a concentration of extreme need for management in localized zones. This distribution aligns with expectations in landscapes in this area, where wildfire threat varies markedly due to heterogeneity in fuel load and composition, topography, and human factors (Moreira et al., 2011). The relatively small area assigned to very high priority zones underscores the importance of targeted interventions rather than widespread management actions. The fact that the highest priority areas are located in the northwestern part of the CSA is not the result of chance since several factors are aligned in that area to drive the result obtained. First, much of that mountain range had not burned in the large fires of 2017, so the accumulation of fuels is greater than in other areas. In addition, the orientation of the slopes is predominantly east and west, which was chosen by stakeholders as more vulnerable orientations for fire. Also, the road network is dense in the area, the number of water points is extensive and the relative proximity to populations suggest a higher priority to carry out management actions in the area. The resulting maps are intended to support strategic decision-making by identifying priority areas for fuel management interventions that align with stakeholder-defined knowledge. These visual tools provide a spatially explicit overview of where management actions can have the greatest impact. Decision-makers can use the maps to allocate resources more efficiently, inform funding proposals, and coordinate actions across agencies, ensuring interventions are both locally relevant and aligned with regional fire management goals.
It is important to emphasize that the framework developed here is prescriptive rather than predictive. MCDA-based prioritization does not aim to to forecast the occurrence or spread of wildfires. Instead, the outputs represent negotiated priorities rather than probabilistic events, and validity lies in transparency of the decision process, inclusiveness of stakeholder perspectives, and the consistency with which spatial outputs reflect the agreed criteria.
The consistency analysis indicates that the prioritization derived from group weights is broadly representative of individual stakeholder perspectives. The observed agreement suggests that the aggregation process preserved key preferences while providing a coherent collective outcome.
The sensitivity analysis further confirms the structural stability of the model. Following the ±10% perturbation approach described by Marto et al. (2018), Abelson et al. (2021), and originally proposed in the AHP context by Saaty (1994), variations in both priority scores and class assignments remained limited. This suggests that the prioritization framework is not overly sensitive to moderate changes in input weights and supports its application in participatory contexts where some degree of variability in preferences is expected. The limited number of management units showing frequent class changes further underscores the model’s robustness for strategic decision-making in wildfire management.
Compared to existing prioritization efforts in Portugal, which typically rely on historical fire occurrence and static risk mapping (such as ICNF’s national fire hazard maps or the PMDFCI plans at the municipal level) this participatory MCDA approach provides a more flexible, spatially explicit, and stakeholder-informed framework. While tools like the PMDFCI emphasize fixed zoning criteria, the method presented here enables local calibration of thresholds, the integration of suppression concerns, and group-based weighting. This complements spatial optimization efforts like those of Santana et al. (2022) by embedding participatory legitimacy. Although some studies in Portugal have integrated participatory MCDA for forest planning (de Sousa Xavier et al., 2015; Borges et al., 2017; Marques et al., 2021) they did not focus on wildfire prevention or suppression needs.
Similarly, Gonzalez-Olabarria et al. (2019) and Krsnik et al. (2024) applied spatial MCDA to wildfire management in southern Europe, identifying prioritization criteria groups, mainly described by fuel-related variables (e.g., canopy cover, fuel load), proximity to vulnerable assets (e.g., settlements, roads), and fire behaviour metrics (e.g., rate of spread). These criteria closely align with those elicited in the present study. However, unlike those studies, the present work integrates a structured and inclusive participatory process explicitly tailored to suppression requirements, ensuring that the final weighting of these criteria reflects stakeholder perspectives across strategic and tactical planning needs.
This work provides a transferable framework for wildfire management prioritization that can be replicated in other regions. The integration of AHP-based participatory approaches with MCDA and spatial decision-support tools like CDP and EMDS in ArcGIS Pro establishes a clear methodological pathway adaptable to various contexts. By incorporating stakeholder-driven weighting, the approach enhances social acceptance and engagement, addressing the growing need for participatory governance. This structure offers a scalable model for future applications, allowing customization of criteria to regional challenges while ensuring robust, transparent, and inclusive decision-making processes in joint management areas.
5 Conclusion
This study presents a robust, participatory framework for wildfire management prioritization in the Vale do Sousa region, addressing both methodological rigor and practical applicability. The integration of participant performance weighting, diverse stakeholder input, and locally relevant data thresholds enhances decision-making accuracy. The priority maps generated offer actionable insights for strategic management, highlighting areas for focused intervention, and for reducing the risk and severity of extreme wildfires. Future research should explore how frequently these prioritization exercises should be revisited, since landscape conditions, stakeholder preferences, and management priorities evolve over time. Iterative updates, particularly after major disturbance events such as large wildfires or significant land-use changes, would ensure that the framework, and its output, remains relevant and robust. Moreover, testing scalability to other regions could strengthen the adaptability and long-term applicability of the approach.
Statements
Data availability statement
The original contributions presented in the study are included in the article/Supplementary material, further inquiries can be directed to the corresponding author.
Author contributions
SR-F: Conceptualization, Data curation, Formal analysis, Investigation, Methodology, Software, Validation, Visualization, Writing – original draft, Writing – review & editing. PM: Conceptualization, Formal analysis, Methodology, Software, Writing – review & editing. KR: Conceptualization, Resources, Software, Writing – review & editing. SP: Conceptualization, Validation, Writing – review & editing. JG-O: Conceptualization, Methodology, Project administration, Resources, Supervision, Writing – review & editing. JB: Funding acquisition, Project administration, Resources, Supervision, Validation, Writing – review & editing.
Funding
The author(s) declare that financial support was received for the research and/or publication of this article. This research was supported by two key projects: H2020-LCGD-2020-3/101037419, titled “FIRE-RES - Innovative technologies and socio-ecological economic solutions for fire resilient territories in Europe,” funded by the EU Horizon 2020 — Research and Innovation Framework Programme; and H2020-MSCA-RISE-2020/101007950, titled “DecisionES – Decision Support for the Supply of Ecosystem Services under Global Change,” funded by the Marie Curie International Staff Exchange Scheme.
Acknowledgments
This research was supported by FCT – Fundação para a Ciência e Tecnologia, I.P. through project reference UID/00239/2025: Centro de Estudos Florestais, and TERRA Associate Laboratory (LA/P/0092/2020). We would like to extend our gratitude to colleagues from the FIRE-RES project team at the School of Agriculture, University of Lisbon, for their invaluable support throughout this research, and to Sandra Pinto from the AFVS for the support during the participatory process of this study.
Conflict of interest
PM was employed by Info Harvest, Inc.
The remaining authors declare that the research was conducted in the absence of any commercial or financial relationships that could be construed as a potential conflict of interest.
Generative AI statement
The authors declare that Gen AI was used in the creation of this manuscript. Generative AI was used during the preparation of this work, the author(s) used ChatGPT (OpenAI) to support the refinement of text segments, including clarity and language editing. After using this tool, the author(s) reviewed and edited the content as needed and take(s) full responsibility for the content of the publication.
Any alternative text (alt text) provided alongside figures in this article has been generated by Frontiers with the support of artificial intelligence and reasonable efforts have been made to ensure accuracy, including review by the authors wherever possible. If you identify any issues, please contact us.
Publisher’s note
All claims expressed in this article are solely those of the authors and do not necessarily represent those of their affiliated organizations, or those of the publisher, the editors and the reviewers. Any product that may be evaluated in this article, or claim that may be made by its manufacturer, is not guaranteed or endorsed by the publisher.
Supplementary material
The Supplementary material for this article can be found online at: https://www.frontiersin.org/articles/10.3389/ffgc.2025.1654107/full#supplementary-material
References
1
Abedi Gheshlaghi H. Feizizadeh B. Blaschke T. (2020). GIS-based forest fire risk mapping using the analytical network process and fuzzy logic. J. Environ. Plan. Manag.63, 481–499. doi: 10.1080/09640568.2019.1594726
2
Abelson E. S. Reynolds K. M. Manley P. Paplanus S. (2021). Strategic decision support for long-term conservation management planning. For. Ecol. Manag.497:119533. doi: 10.1016/j.foreco.2021.119533
3
Agência para a Modernização Administrativa . (n.d.). Mapa de declives de Portugal Continental (EU DEM). Available online at: https://dados.gov.pt/pt/datasets/mapa-de-declives-de-portugal-continental-eu-dem/ (accessed January 15, 2024)
4
Ananda J. Herath G. (2003). The use of analytic hierarchy process to incorporate stakeholder preferences into regional forest planning. Forest Policy Econ.5, 13–26. doi: 10.1016/S1389-9341(02)00043-6
5
Arca D. Hacısalihoğlu M. Kutoğlu Ş. H. (2020). Producing forest fire susceptibility map via multi-criteria decision analysis and frequency ratio methods. Nat. Hazards104, 73–89. doi: 10.1007/s11069-020-04158-7
6
Atkinson R. Flint J. (2001). Accessing hidden and hard-to-reach populations: snowball research strategies. Soc. Res.33, 1–4.
7
Borges J. G. Marques S. Garcia-Gonzalo J. Rahman A. U. Bushenkov V. Sottomayor M. et al . (2017). A multiple criteria approach for negotiating ecosystem services supply targets and forest owners' programs. For. Sci.63, 49–61. doi: 10.5849/FS-2016-035
8
Botequim B. Zubizarreta-Gerendiain A. Garcia-Gonzalo J. Silva A. Marques S. Fernandes P. M. et al . (2015). A model of shrub biomass accumulation as a tool to support management of Portuguese forests. iForest Biogeosci. Forest.8, 114–125. doi: 10.3832/ifor0931-008
9
Campbell J. (2002). A critical appraisal of participatory methods in development research. Int. J. Soc. Res. Methodol.5, 19–29. doi: 10.1080/13645570110098046
10
Chen J. Yang S. T. Li H. W. Zhang B. Lv J. R. (2013). Research on geographical environment unit division based on the method of natural breaks (Jenks). Int. Arch. Photogramm. Remote. Sens. Spat. Inf. Sci.40, 47–50. doi: 10.5194/isprsarchives-XL-4-W3-47-2013
11
de Sousa Xavier A. M. Freitas M. D. B. C. de Sousa Fragoso R. M. (2015). Management of Mediterranean forests—a compromise programming approach considering different stakeholders and different objectives. Forest Policy Econ.57, 38–46. doi: 10.1016/j.forpol.2015.03.012
12
Direção-Geral do Território . (2020). Carta de Áreas Edificadas 2018. Dados abertos. Available online at: https://www.dgterritorio.gov.pt/dados-abertos (accessed January 17, 2024)
13
Eurostat (2021). GEOSTAT – Population distribution. European Commission. Available online at: https://ec.europa.eu/eurostat/web/gisco/geodata/population-distribution/geostat (accessed January 24, 2024)
14
Faias S. P. Palma J. H. N. Barreiro S. Paulo J. A. Tomé M. (2012). Resource communication. sIMfLOR – platform for the Portuguese forest simulators. For. Syst.21, 543–548. doi: 10.5424/fs/2012213-02951
15
Fernandes P. Gonçalves H. Loureiro C. Fernandes M. Costa T. Cruz M. G. et al . (2009). “Modelos de combustível florestal para Portugal” in Actas do 6o Congresso Florestal Nacional. SPCF (Lisboa, Portugal), 348–354.
16
Fernandes P. M. Pacheco A. P. Almeida R. Claro J. (2016). The role of fire-suppression force in limiting the spread of extremely large forest fires in Portugal. Eur. J. Forest Res.135, 253–262. doi: 10.1007/s10342-015-0933-8
17
Fernández-Guisuraga J. M. Martins S. Fernandes P. M. (2023). Characterization of biophysical contexts leading to severe wildfires in Portugal and their environmental controls. Sci. Total Environ.875:162575. doi: 10.1016/j.scitotenv.2023.162575
18
Ferreira L. Constantino M. F. Borges J. G. Garcia-Gonzalo J. (2015). Addressing wildfire risk in a landscape-level scheduling model: an application in Portugal. For. Sci.61, 266–277. doi: 10.5849/forsci.13-104
19
Finney M. A. (2006). An overview of FlamMap fire modeling capabilities. In: AndrewsPatricia L.; ButlerBret WComps. 2006. Fuels management-how to measure success: Conference proceedings. 28–30 March 2006; Portland, OR. Proceedings RMRS-P-41. Fort Collins, CO: US Department of Agriculture, Forest Service, Rocky Mountain Research Station. p. 213–220 (Vol. 41).
20
Geneletti D. (2013). Assessing the impact of alternative land-use zoning policies on future ecosystem services. Environ. Impact Assess. Rev.40, 25–35. doi: 10.1016/j.eiar.2012.12.003
21
Gigović L. Jakovljević G. Sekulović D. Regodić M. (2018). GIS multi-criteria analysis for identifying and mapping forest fire hazard: Nevesinje. Bosnia Herzegovina. Tehnički vjesnik25, 891–897. doi: 10.17559/TV-20151230211722
22
Gómez-García E. Diéguez-Aranda U. Cunha M. Rodríguez-Soalleiro R. (2016). Comparison of harvest-related removal of aboveground biomass, carbon and nutrients in pedunculate oak stands and in fast-growing tree stands in NW Spain. For. Ecol. Manag.365, 119–127. doi: 10.1016/j.foreco.2016.01.021
23
Gonzalez-Olabarria J. R. Reynolds K. M. Larrañaga A. Garcia-Gonzalo J. Busquets E. Pique M. (2019). Strategic and tactical planning to improve suppression efforts against large forest fires in the Catalonia region of Spain. For. Ecol. Manag.432, 612–622. doi: 10.1016/j.foreco.2018.09.039
24
ICNF . (n.d.-a). Planos municipais de defesa da floresta contra incêndios (PMDFCI). Available online at: https://fogos.icnf.pt/infoPMDFCI/PMDFCI_PUBLICOlist.asp (accessed January 18, 2024)
25
ICNF . (n.d.-b). GeoCatálogo – Rede Nacional de Defesa da Floresta Contra Incêndios (Tema 5). Available online at: https://geocatalogo.icnf.pt/catalogo_tema5.html (accessed January 21, 2024)
26
ICNF . (n.d.-c). GeoCatálogo – Rede de Perímetros Florestais e Áreas Protegidas (Tema 1). Available online at: https://geocatalogo.icnf.pt/catalogo_tema1.html (accessed January 21, 2024)
27
Kangas J. (1994). An approach to public participation in strategic forest management planning. For. Ecol. Manag.70, 75–88. doi: 10.1016/0378-1127(94)90076-0
28
Kazibudzki P. T. (2016). An examination of performance relations among selected consistency measures for simulated pairwise judgments. Ann. Oper. Res.244, 525–544. doi: 10.1007/s10479-016-2131-6
29
Kraus D. Wohlgemuth T. Castellnou M. Conedera M. (2022). “Fire in Forest ecosystems: processes and management strategies” in Disturbance ecology (Cham: Springer International Publishing), 143–171.
30
Kreider M. R. Higuera P. E. Parks S. A. Rice W. L. White N. Larson A. J. (2024). Fire suppression makes wildfires more severe and accentuates impacts of climate change and fuel accumulation. Nat. Commun.15:2412. doi: 10.1038/s41467-024-46702-0
31
Krsnik G. Olivé E. B. Nicolau M. P. Larrañaga A. Terés J. Á. Garcia-Gonzalo J. et al . (2024). Spatial multi-criteria analysis for prioritising forest management zones to prevent large forest fires in Catalonia (NE Spain). Environ. Challenges15:100959. doi: 10.1016/j.envc.2024.100959
32
Krueger R. A. Casey M. A. (2015). “Focus group interviewing” in Handbook of practical program evaluation, 506–534.
33
Malczewski J. Rinner C. Malczewski J. Rinner C. (2015). Introduction to GIS-mcda. Multicriteria decision analysis in geographic information science, 23–54.
34
Marques S. Borges J. G. Garcia-Gonzalo J. Moreira F. Carreiras J. M. B. Oliveira M. M. et al . (2011). Characterization of wildfires in Portugal. Eur. J. Forest Res.130, 775–784. doi: 10.1007/s10342-010-0470-4
35
Marques M. Reynolds K. M. Marto M. Lakicevic M. Caldas C. Murphy P. J. et al . (2021). Multicriteria decision analysis and group decision-making to select stand-level forest management models and support landscape-level collaborative planning. Forests12:399. doi: 10.3390/f12040399
36
Martins H. Borges J. G. (2007). Addressing collaborative planning methods and tools in forest management. For. Ecol. Manag.248, 107–118. doi: 10.1016/j.foreco.2007.02.039
37
Marto M. Reynolds K. M. Borges J. G. Bushenkov V. A. Marques S. (2018). Combining decision support approaches for optimizing the selection of bundles of ecosystem services. Forests9:438. doi: 10.3390/f9070438
38
McWethy D. B. Schoennagel T. Higuera P. E. Krawchuk M. Harvey B. J. Metcalf E. C. et al . (2019). Rethinking resilience to wildfire. Nat. Sustain.2, 797–804. doi: 10.1038/s41893-019-0353-8
39
Milic N. Popovic B. Mijalkovic S. Marinkovic D. (2019). The influence of data classification methods on predictive accuracy of kernel density estimation hotspot maps. Int. Arab J. Inf. Technol.16, 1053–1062.
40
Mönkkönen M. Juutinen A. Mazziotta A. Miettinen K. Podkopaev D. Reunanen P. et al . (2014). Spatially dynamic forest management to sustain biodiversity and economic returns. J. Environ. Manag.134, 80–89. doi: 10.1016/j.jenvman.2013.12.021
41
Moreira F. Viedma O. Arianoutsou M. Curt T. Koutsias N. Rigolot E. et al . (2011). Landscape–wildfire interactions in southern Europe: implications for landscape management. J. Environ. Manag.92, 2389–2402. doi: 10.1016/j.jenvman.2011.06.028
42
Nordström E. M. Eriksson L. O. Öhman K. (2010). Integrating multiple criteria decision analysis in participatory forest planning: experience from a case study in northern Sweden. Forest Policy Econ.12, 562–574. doi: 10.1016/j.forpol.2010.07.006
43
Nunes L. Pasalodos-Tato M. Alberdi I. Sequeira A. C. Vega J. A. Silva V. et al . (2022). Bulk density of shrub types and tree crowns to use with forest inventories in the Iberian Peninsula. Forests13:555. doi: 10.3390/f13040555
44
Regan H. M. Colyvan M. Markovchick-Nicholls L. (2006). A formal model for consensus and negotiation in environmental management. J. Environ. Manag.80, 167–176. doi: 10.1016/j.jenvman.2005.09.004
45
Reis C. S. V. (2016). Addressing wildfire risk in forest management with a wildfire resistance indicator (Master’s thesis). Portugal: Universidade de Lisboa.
46
Reynolds K. M. Hessburg P. F. (2014). An overview of the ecosystem management decision-support system. Making transparent environmental management decisions: Applications of the ecosystem management decision support system, 3–22.
47
Reynolds K. M. Hessburg P. F. Keane R. E. Menakis J. P. (2009). National fuel-treatment budgeting in US federal agencies: capturing opportunities for transparent decision-making. For. Ecol. Manag.258, 2373–2381. doi: 10.1016/j.foreco.2009.08.011
48
Reynolds K. M. Paplanus S. Murphy P. J. Druzdzel M. J. Spenser C. Miller B. J. (2023). Latest features of the ecosystem management decision support system, version 8.0. Front. Environ. Sci.11:1231818. doi: 10.3389/fenvs.2023.1231818
49
Saaty T. (1980). The analytic hierarchy process (AHP) for decision making, vol. 1. Kobe, Japan, 69.
50
Saaty T. L. (1994). How to make a decision: the analytic hierarchy process. Interfaces 24, 19–43.
51
Salter J. Robinson J. Wiek A. (2010). Participatory methods of integrated assessment—a review. Wiley Interdiscip. Rev. Clim. Chang.1, 697–717. doi: 10.1002/wcc.73
52
Santana V. P. Leite R. V. Santos V. J. D. Alves S. D. C. Castro J. D. S. Torres F. T. P. et al . (2022). Burning susceptibility modeling to reduce wildfire impacts: a GIS and multivariate statistics approach. Floresta e Ambiente29:e20210078. doi: 10.1590/2179-8087-FLORAM-2021-0078
53
Schmoldt D. L. (2001). The analytic hierarchy process in natural resource and environmental decision making, vol. 3: Springer Science & Business Media.
54
Sivrikaya F. Küçük Ö. (2022). Modeling forest fire risk based on GIS-based analytical hierarchy process and statistical analysis in Mediterranean region. Ecol. Inform.68:101537. doi: 10.1016/j.ecoinf.2021.101537
55
Srđević B. Suvočarev K. Srđević Z. (2008). AHP grupno odlučivanje bez konsenzusa: primer planiranja segmentacije mokrog polja. Vodoprivreda40, 51–58.
56
Takam Tiamgne X. Kanungwe Kalaba F. Raphael Nyirenda V. Phiri D. (2022). Modelling areas for sustainable forest management in a mining and human dominated landscape: a geographical information system (GIS)-multi-criteria decision analysis (MCDA) approach. Ann. GIS28, 343–357. doi: 10.1080/19475683.2022.2026469
57
Tedim F. Leone V. Amraoui M. Bouillon C. Coughlan M. R. Delogu G. M. et al . (2018). Defining extreme wildfire events: difficulties, challenges, and impacts. Fire1:9. doi: 10.3390/fire1010009
58
Temesi J. (2006). Consistency of the decision-maker in pair-wise comparisons. Int. J. Manag. Decis. Mak.7, 267–274. doi: 10.1504/IJMDM.2006.009148
59
Thurstone L. L. (1927). Psychophysical analysis. Am. J. Psychol.38, 368–389. doi: 10.2307/1415006
60
Uhde B. Andreas Hahn W. Griess V. C. Knoke T. (2015). Hybrid MCDA methods to integrate multiple ecosystem services in forest management planning: a critical review. Environ. Manag.56, 373–388. doi: 10.1007/s00267-015-0503-3
61
Vaidya O. S. Kumar S. (2006). Analytic hierarchy process: an overview of applications. Eur. J. Oper. Res.169, 1–29. doi: 10.1016/j.ejor.2004.04.028
62
Van Hoang T. Chou T. Y. Fang Y. M. Nguyen N. T. Nguyen Q. H. Xuan Canh P. et al . (2020). Mapping forest fire risk and development of early warning system for NW Vietnam using AHP and MCA/GIS methods. Appl. Sci.10:4348. doi: 10.3390/app10124348
63
Vigna I. Besana A. Comino E. Pezzoli A. (2021). Application of the socio-ecological system framework to forest fire risk management: a systematic literature review. Sustainability13:2121. doi: 10.3390/su13042121
64
Xanthopoulos G. Leone V. Delogu G. M. (2020). “The suppression model fragilities: the “firefighting trap”” in Extreme wildfire events and disasters. eds. F. Tedim, V. Leone, and T. K. Mcgee (Elsevier), 135–153.
Summary
Keywords
wildfire prevention, multi-criteria decision analysis, stakeholder involvement, spatial prioritization, pairwise comparisons, decision support systems, participatory planning
Citation
Rodríguez-Fernández S, Murphy PJ, Reynolds KM, Poudel S, González-Olabarria JR and Borges JG (2025) Participatory multi-criteria decision analysis to prioritize management areas that help suppress wildfires. Front. For. Glob. Change 8:1654107. doi: 10.3389/ffgc.2025.1654107
Received
25 June 2025
Accepted
26 September 2025
Published
14 October 2025
Volume
8 - 2025
Edited by
Mohammad Imam Hasan Reza, Presidency Education, Bangladesh
Reviewed by
Ismail Ekmekci, Istanbul Commerce University, Türkiye
Diogo M. Pinto, Centro de Estudos de Geografia e Ordenamento do Territorio, Portugal
Updates
Copyright
© 2025 Rodríguez-Fernández, Murphy, Reynolds, Poudel, González-Olabarria and Borges.
This is an open-access article distributed under the terms of the Creative Commons Attribution License (CC BY). The use, distribution or reproduction in other forums is permitted, provided the original author(s) and the copyright owner(s) are credited and that the original publication in this journal is cited, in accordance with accepted academic practice. No use, distribution or reproduction is permitted which does not comply with these terms.
*Correspondence: Sergio Rodríguez-Fernández, sergiorf@isa.ulisboa.pt; sergiofernandez@edu.ulisboa.pt
Disclaimer
All claims expressed in this article are solely those of the authors and do not necessarily represent those of their affiliated organizations, or those of the publisher, the editors and the reviewers. Any product that may be evaluated in this article or claim that may be made by its manufacturer is not guaranteed or endorsed by the publisher.