Abstract
As one of the most destructive and aggressive exotic harmful species, Solenopsis invicta Buren has spread rapidly in China, posing serious threats to biodiversity as well as human production and life. To formulate effective prevention and control measures, we first compared the bioclimatic variables of S. invicta between China and the USA. Subsequently, we employed the MaxEnt model and the “ecospat” package to predict the potential distribution and niche shift of S. invicta. The similar average annual temperature and annual precipitation between China and the USA serve as crucial ecological and environmental foundations for the successful invasion of S. invicta. Under the current climate, S. invicta is primarily distributed in the eastern and southern coastal regions of China and the USA. Under future climate scenarios, the suitable habitat area for S. invicta is projected to continue increasing in China, while it is expected to decrease in the USA. Mean diurnal range (Bio2), precipitation seasonality (Bio15), and other climatic factors exhibited vital niche differentiation. The niche of S. invicta has significant shifted in both climatic and geographic spaces, while maintaining niche conservatism during the invasion process. S. invicta can effectively adapt to new habitats through niche shifts during the invasion process. It is not advisable to directly apply the prediction experiences and threshold values from the United States to guide the prevention and control of S. invicta in China in the future. Overall, the analysis provided a scientific basis for the government and local organizations to prevent and control S. invicta.
1 Introduction
Biological invasion is considered the second greatest global threat contributing to biodiversity loss after habitat destruction (Clement et al., 2025; Liao et al., 2025). With the development of trade, transportation, and tourism, invasive alien species has become a pressing global ecological and environmental issue (Zhu, 2012; Yan et al., 2017). Animal invasion, defined as the introduction of an alien species into new habitats via human activities or natural processes, represents a significant area of research within the broader field of biological invasions (Zhang et al., 2021; Lee et al., 2022). It can not only lead to ecological and environmental problems, such as the loss of native biodiversity and ecosystem collapse, but also result in significant economic losses and pose risks to human health (Vasconcelos et al., 2024; Li et al., 2025). China’s vast territory and diverse climatic provide favorable environments for the establishment and spread of alien species. Over half of the 100 most threatening invasive species identified by the International Union for Conservation of Nature (IUCN) in 2000 are currently established in China (Cárdenas et al., 2023). China has become one of the countries most severely affected by biological invasions worldwide, and the challenges associated with their prevention and control are intensifying (Abdedayem et al., 2023; Jiang et al., 2024). Undoubtedly, substantially increasing investment in the prevention and control of invasive species is both a prudent and necessary strategy (Lorenzo and Morais, 2023). However, the growing diversity and abundance of alien species, the complex mechanisms underlying invasions, and the unique environmental attributes of recipient regions collectively impede effective prevention and control (Haubrock et al., 2023). Therefore, understanding the environmental factors that affect biological invasion is essential for protecting ecosystems and human well-being.
Environmental factors are intrinsically dynamic, exhibiting continuous shifting across both time and space, with climate change now the main force propelling those shifts. Global change and associated anthropogenic drivers alter environmental conditions that facilitate the establishment of alien species. The overall invasive potential of alien species are also jointly shaped by ongoing shifts in both climatic and socioeconomic regimes (Bellard et al., 2013; Tingley et al., 2014). Recent syntheses indicate that climate-driven global change concurrently (i) alters the reproduction, growth, and inter-specific competitiveness of invasive species and (ii) reshapes geographic ranges and impact of invasive species by eroding ecosystem stability (Teles et al., 2022). Consequently, biological invasion is often viewed as a dynamic, continually expanding and shifting process whose realized distribution is inseparably coupled to the invader′s ongoing range expansion (Dormann et al., 2012). As species distribution changes across time and space, its niche is continually reshaped by climate and human factors, making such niche dynamics especially noteworthy during the invasion process (Peterson et al., 2017; Santamarina et al., 2023). Therefore, prior to forecasting the environmental factors and potentially suitable ranges of an invasive species, it is imperative to test for niche shifts within the invaded region. A growing body of literature now recognizes that quantifying niche shifts is essential for accurately projecting the potential distributions of alien species (Wei et al., 2017; Atwater et al., 2018; Tang et al., 2021). By comparing climatic conditions between native and invaded ranges, these studies have elucidated the mechanisms driving the spread and range expansion of invasive species. Such analyses are pivotal for tailoring effective prevention and control strategies, as they forecast species’ spatio-temporal spread and concurrent niche-shift dynamics (Bates et al., 2020).
Among the various invasive species, Solenopsis invicta Buren (Hymenoptera: Formicidae), a native of South America, is a high-risk alien insect that severely threatens agriculture, forestry, public safety, human health and ecosystem integrity (Sung et al., 2018). In the early twentieth century, S. invicta was inadvertently introduced into the southern United States through lapses in quarantine and inspection, triggering serious agricultural losses and environmental-health problems (Wetterer, 2013). First detected in Guangdong Province in 2004, S. invicta has since expanded into 12 Chinese provinces. Its high adaptability enables it to rapidly become a dominant populations of newly colonised ecosystems (Lei et al., 2019). Research indicates that S. invicta reduces local abundance and biodiversity per unit area, disrupts ecological equilibrium, and catastrophically fragments food webs, often creating near or complete vacuums in the resident species assemblage (Drees et al., 2013). Over the past decade, national-scale modelling has consistently identified the core suitable zone within the 18–32°N latitude range (Teng et al., 2025). Regional analyses further reveal that local establishment is primarily governed by soil moisture and slope conditions, while the northern boundary of suitability is projected to shift poleward under warming scenario (LeBrun et al., 2012; Song et al., 2021). Meanwhile, increasing road network density is expected to lower the effective suitability threshold (Lin et al., 2022). Accumulated evidence identifies climate change as the primary driver of S. invicta invasions, altering both the species′ distributional limits and rate of spread by modulating the sequential stages of the invasion process (Levia and Frost, 2004; Needleman et al., 2018; Lee et al., 2021). Therefore, the most effective strategy for preventing and controlling harmful invaders is to quantify the spatio-temporal dynamics of invasion, identify high-risk areas, and inform targeted monitoring and early-warning programmes. This underscores a paradigm shift from static species distribution models to dynamic niche frameworks.
The risk zone of invasive species, defined as the region where establishment and impact are probable, is shaped by the interplay of numerous environmental factors (Gan et al., 2025). For every environmental variable, there is an optimal range within which a species can persist. The breadth of this range and the species′ capacity to adapt to its local environment are key components of its ecological niche (Wang et al., 2025). Species distribution models (SDMs) are tools that integrate known species occurrence data with associated environmental variables to construct predictive models via specific algorithms. These models characterize species′ ecological niches to predict their realized and potential distributions across time and space (Brown, 2014). Among species distribution modelling algorithms—Bioclim, Climex, Domain, GARP, and MaxEnt—MaxEnt is a maximum-entropy machine-learning algorithm that estimates the potentially suitable distribution of a species (Borges et al., 2022). MaxEnt yields higher simulation accuracy and superior predictive performance compared to the alternative algorithms mentioned above (Ming et al., 2018). Consequently, MaxEnt is now widely used in conservation biology to project species′ potential ranges, evaluate habitat suitability, forecast climate-driven niche shifts, assess the invasion risk of alien taxa, and inform phylogeographic reconstruction (Kumar and Stohlgren, 2009; Erikssona and Daleruma, 2018; Santana et al., 2019). Furthermore, invasive species often undergo pronounced niche shifts (Fenollosa et al., 2025). Rapid evolution enables invasive alien species to develop novel adaptive mechanisms, expanding their fundamental niche, whereas the absence of natural enemies and vacant niches in the introduced range may shift their realized niche (Bates et al., 2020). Invasive species can rapidly adjust their ecological niches to match local environmental conditions, facilitating rapid establishment in novel habitats. Consequently, conventional species distribution models may fail to capture accurately the niche dynamics of these invasive taxa (Srivastava et al., 2020). Ecospat is an R package for quantifying, testing, and visualizing species′ niches and distributions (Di Cola et al., 2017). It can directly quantify niche overlap and axis-specific differences between native and introduced ranges, thereby exposing niche shifts associated with invasion (Rodrigues et al., 2016). Thus, incorporating niche dynamics into species distribution projections can improve assessments of invasiveness and underlying mechanisms in novel ranges. Currently, most research on S. invicta has addressed its invasion status, biodiversity impacts, and control measures, whereas habitat dynamics and niche shifts of this species remain understudied (Cook, 2003; Ma et al., 2010; Wang et al., 2013). Here, using MaxEnt and the “ecospat” package, we quantified the potential distributions under current and future climate scenarios, and characterized the niche dynamics of S. invicta in China and the USA. First, we compared the bioclimatic envelopes of S. invicta between China and the USA and quantified how these variables relate to, and differ from, the species′ current distributions in the two regions. Second, we used MaxEnt to project the potential distribution of S. invicta in China and the USA under current (1970–2000 mean) and two future period (2050 and 2070). Third, we used the ecospat package to quantify niche dynamics between the native and introduced ranges and to characterize how the niche has shifted during invasion. For the first time, we systematically quantified the mechanisms of ecological niche conservation and expansion of S. invicta in both countries under the climate framework, and revealed the pivotal influence of non-equilibrium invasion dynamics on future early-warning systems.
2 Materials and methods
2.1 Occurrence data of S. invicta
Occurrence records for S. invicta in China and the USA were compiled from the Global Biodiversity Information Facility (GBIF), the China Academic Journal Network Publishing Database (CNKI), the Chinese Virtual Herbarium (CVH), and literature searches via Google Scholar (Tang et al., 2021). The occurrence records were screened to remove duplicates and any entries lacking precise geographic coordinates (Zhong et al., 2023; Liao et al., 2025). Localities with only specific place names were georeferenced using Google Earth to obtain geographic coordinates (Kong et al., 2021). Field surveys and cross validation further verified and supplemented the dataset, ensuring that it accurately reflects the current distribution of the species in both countries. Sampling bias is a critical concern in species distribution modelling, yet any bias-reduction technique carries inherent limitations that must be explicitly considered (Dudík et al., 2005). To minimize spatial autocorrelation, occurrence records were thinned to retain a single point per 10 km grid cell using the spatial screening method (Li et al., 2023). The resulting dataset was then cross-validated against alternative bias-reduction methods (cluster-based filtering and grouping screening) to ensure robust model performance (Liao et al., 2025; Luo et al., 2025). Each subset was run independently in MaxEnt, and AUC, TSS and omission rates were compared. Differences among the three approaches were negligible (< 5%), so the spatially thinned dataset was retained for final modelling. This approach yielded a dataset that was both large enough for model calibration and spatially representative of the species′ actual range in China and the USA. After thinning, 286 occurrence records for China and 733 for the USA were retained and used to parameterize the models. The cleaned occurrences were exported to a CSV file and mapped with ArcGIS (Esri, USA) to visualize the species′ range in both countries. The resulting occurrences of S. invicta in each country are shown in Figure 1.
Figure 1

The distribution of occurrence points of Solenopsis invicta in China and the USA. (a) Occurrence points (286 points) in China; (b) occurrence points (733 points) in the USA.
2.2 Selection and comparison of climate variables
Bioclimatic variables drive niche shifts and govern the spatial extent of suitable habitat during invasion, and therefore constitute the primary predictors for habitat projections (Morin and Thuiller, 2009). We used 19 bioclimatic variables to quantify niche divergence and habitat suitability for S. invicta in China and the USA (Table 1). Historical bioclimatic variables (1970–2000) were obtained from the WorldClim database (http://www.worldclim.org), interpolated from global meteorological-station records (Tang et al., 2021). We projected suitable habitats for 2050 and 2070 under both low-emission (RCP-2.6) and high-emission (RCP-8.5) scenarios (Zhang et al., 2019). According to the Intergovernmental Panel on Climate Change’s (IPCC) Fifth Assessment Report (AR5), RCP 2.6 corresponds to the lowest emission scenario, while RCP 8.5 corresponds to the highest (Drouet et al., 2015). To ensure consistency with WorldClim projections (20-year means), we selected 2050 and 2070 (the mid-points of the 2041–2060 and 2061–2080 windows, respectively) and employed RCP 2.6 and RCP 8.5 to bound the low- and high-emission extremes, thereby encompassing the full plausible range of future suitable habitat for S. invicta. All bioclimatic variables, both historical and future, were obtained from WorldClim v2.1 at 30 arc-seconds (≈1 km at the equator; Hijmans et al., 2005). Multicollinearity among bioclimatic variables can lead to overfitting and reduce the reliability of MaxEnt projections, so pairwise Pearson correlations were calculated and highly correlated predictors were removed (Kumar and Stohlgren, 2009). Initially, MaxEnt was run with all 19 bioclimatic variables and the occurrence records of S. invicta. The jackknife test was then used to quantify variable importance and rank the bioclimatic predictors by their contribution to model performance (Tang et al., 2020).
Table 1
| Type | Variables | Description | Units | China | USA |
|---|---|---|---|---|---|
| Bioclimatic variables | Bio1 | Annual Mean Temperature (°C) | °C | Y | Y |
| Bio2 | Mean Diurnal Range [Mean of monthly (max temp - min temp)] (°C) | °C | Y | Y | |
| Bio3 | Isothermality (Bio2/Bio7) (×100) | — | Y | Y | |
| Bio4 | Temperature Seasonality (standard deviation×100) (Coefficient of Variation) | °C | |||
| Bio5 | Max Temperature of Warmest Month (°C) | °C | Y | ||
| Bio6 | Min Temperature of Coldest Month (°C) | °C | |||
| Bio7 | Temperature Annual Range (Bio5-Bio6) (°C) | °C | Y | Y | |
| Bio8 | Mean Temperature of Wettest Quarter (°C) | °C | Y | ||
| Bio9 | Mean Temperature of Driest Quarter (°C) | °C | Y | ||
| Bio10 | Mean Temperature of Warmest Quarter (°C) | °C | |||
| Bio11 | Mean Temperature of Coldest Quarter (°C) | °C | |||
| Bio12 | Annual Precipitation (mm) | mm | Y | Y | |
| Bio13 | Precipitation of Wettest Month (mm) | mm | |||
| Bio14 | Precipitation of Driest Month (mm) | mm | Y | ||
| Bio15 | Precipitation Seasonality (Coefficient of Variation) | — | Y | ||
| Bio16 | Precipitation of Wettest Quarter (mm) | mm | |||
| Bio17 | Precipitation of Driest Quarter (mm) | mm | |||
| Bio18 | Precipitation of Warmest Quarter (mm) | mm | Y | Y | |
| Bio19 | Precipitation of Coldest Quarter (mm) | mm |
Bioclimatic variables in this study.
Y indicates which variables are chosen to predict suitable areas in China and the USA.
Pearson correlation analysis was used to mitigate highly correlated predictors and reduce multicollinearity. Variables with |r| ≥ 0.8 were considered redundant and only the ecologically more interpretable member of each pair was retained. After considering their ecological relevance, we retained the member of each highly correlated pair that possessed clearer biological meaning, easier interpretability, or higher model importance (Zhang et al., 2016). Finally, this procedure retained eight bioclimatic variables in China (Bio1, Bio2, Bio3, Bio5, Bio7, Bio12, Bio14, and Bio18) and nine in the USA (Bio1, Bio2, Bio3, Bio7, Bio8, Bio9, Bio12, Bio15, and Bio18; Table 1). The selected bioclimatic variables and occurrence records were input to MaxEnt to project habitat suitability for S. invicta in China and the USA. To quantify niche shift during invasion, the native niche is typically used as the fixed reference. S. invicta has been invasive in the USA for nearly a century, whereas its presence in China spans only a few decades. Thus, bioclimatic variables from the USA were used as the native-range baseline for quantifying environmental niche shifts in ecospat.
To compare climatic conditions between the two invasive ranges, we used SPSS 25 (IBM, Armonk, USA) to test the significance of differences in the retained bioclimatic variables between China and the USA. A two-way ANOVA without replication was performed to compare the means of the 19 bioclimatic variables between China and the USA. To mitigate sample-size effects on variance comparisons of individual bioclimatic variables, we used bootstrap resampling to assess the accuracy and validity of the test statistics (Lee and Rodgers, 1998). By bootstrapping equal-sized samples from the native range to match the number of invasive occurrences, we approximated the sampling distribution of each statistic, enabling robust inference and re-estimation of means and variances for every bioclimatic variable. The bootstrapping process was repeated 1,000 times to generate 95% confidence intervals (α = 0.05) for each bioclimatic variable. p > 0.05 indicates non-significance, 0.01 < p ≤ 0.05 denotes significance and p ≤ 0.001 denotes high significance. Finally, violin plots were used to visualize bioclimatic differences between the native and invasive ranges.
2.3 Bioclimatic niche shift
To quantify climatic niche shifts during the bridgehead invasion of S. invicta, we followed the PCA-env workflow implemented in the R package ecospat (v3.5). This package is designed to effectively separate, quantify, and compare the climatic and spatial environmental conditions of the study region (Di Cola et al., 2017). We also employed kernel density estimation to fit the sample data and obtain the overall probability density function (Fitzpatrick et al., 2013). The niche occupancy rate (PNO) was estimated for each bioclimatic variable from the average niche model. We randomly extracted 10,000 background points within the distribution range of S. invicta in China and the USA using DIVA-GIS v7.5.0 and obtained the corresponding environmental variable values (Gao et al., 2021). Note that niche-shift analyses of alien species typically treat the native-range niche as the fixed reference (Roura-Pascual et al., 2009). Consequently, nine available bioclimatic variables (Bio1, Bio2, Bio3, Bio7, Bio8, Bio9, Bio12, Bio15, and Bio18) are considered to be ecologically relevant for S. invicta. We conducted a principal components analysis (PCA-env) approach to perform niche analysis following the methods of Broennimann et al. (2007) and Broennimann et al. (2014). Environmental variables were converted into a two-dimensional space defined by the first and second principal components, and projected onto a 100 × 100 grid bounded by the minimum and maximum values of PCA in the background data (Strubbe et al., 2013). Sampling bias is effectively corrected by this method. To quantify climatic niche differences between the USA and China, we implemented the PCA-env framework for invasive species.
Niche overlap was quantified with Schoener’s D, and tests of niche equivalence and similarity were performed by comparing observed occurrence densities in environmental space against null distributions generated by 1,000 random reallocations (Broennimann et al., 2012). The niche equivalency test evaluates whether the niches of two groups are identical by testing if the observed overlap differs from that expected when occurrences are randomly reassigned between groups. The calculation of niche equivalence and niche similarity was randomly repeated 100 times, and the statistical test was performed for the value of D (α = 0.05; Guisan et al., 2014). The null hypothesis of niche equivalence was rejected if the observed niche overlap value was significantly higher than that of the null distribution. Niche equivalence tests evaluate only the overlap of occupied environmental space and do not account for the climatic conditions of the surrounding background. Therefore, the niche similarity test was also performed to take into account the surrounding environment of the study area (Aguirre-Gutiérrez et al., 2015). All niche analyses were carried out with the ecospat package in R. The variables chosen included Bio1, Bio2, Bio3, Bio7, Bio8, Bio9, Bio12, Bio15, and Bio18. Collectively, these variables characterize the year-round environmental regime of the species’ habitats.
2.4 Modelling optimization and model prediction
To predict species′ habitat suitability, MaxEnt model integrates occurrence records with bioclimatic variables (Yi et al., 2016). Specifically, the potential distributions of S. invicta in China and the USA were modelled with MaxEnt 3.4.1. Occurrence records and the selected bioclimatic variables were imported into the model, which then allocated the data into a training set and a test set at a 3:1 ratio for model calibration and validation (Tang et al., 2021). The model was run for a maximum of 500 iterations, with prediction results exported in ASCII format. The classification threshold of potential distributions was determined using the method that maximizes the sum of sensitivity and specificity, while the normal distribution theory and expert experience were fully considered (Freeman and Moisen, 2008). ArcGIS 10.4 software was used to reclassify the prediction results into four suitability categories: highly suitable (p ≥ 0.72), moderately suitable (0.53 ≤ p < 0.72), low suitable (0.25 ≤ p < 0.53), and unsuitable (p < 0.25). Predictive performance was assessed with the area under the receiver operating characteristic curve (AUC) and the true skill statistic (TSS), both widely accepted metric for species distribution models, and omission rates were also evaluated (Wang et al., 2007). The feature combination (FC) and regularization multiplier (RM) were optimized with the ENMeval package in R (Morales et al., 2017). The FC enables MaxEnt to incorporate complex mathematical relationships to predict the response of S. invicta to bioclimatic factors, while RM constrains model complexity, optimizing the smoothness and generalizability of the response curves. These parameters are crucial for predictive accuracy and were determined by calling the ENMeval package in R (Muscarella et al., 2014). The model includes five features: linear (L), quadratic (Q), hinge (H), product (P), and threshold (T). To identify the optimal combination of FC and RM, the RM values were limited to the range of 0.5 to 4.0, incremented by 0.5. The feature combinations tested were L, LQ, H, LQH, LQHP, and LQHPT. The ENMeval package evaluated 48 parameter combinations. The small-sample-corrected Akaike Information Criteria (AICc) was used to assess the model’s fit and complexity, with the model having the smallest AICc value being prioritized (Velasco and González-Salazar, 2019). The maximum sensitivity plus specificity (MSS) and 10 percentile training presence (10 P) were used to evaluate model overfitting, while predictive accuracy was quantified by AUC, TSS and omission rates (Radosavljevic and Anderson, 2014).
3 Results
3.1 Evaluation of the accuracy and contribution rate of variables
The MaxEnt model was retrained with the optimized parameter combination. Across all current and future climate projections, AUC and TSS values exceeded 0.9, and the omission rate was below 10%, collectively indicating consistently high predictive accuracy. Under the maximum sensitivity plus specificity threshold, 95.2% of occurrence records were accurately predicted, and 91.4% of unsampled or non-distributed areas were correctly identified. Under the 10th percentile training presence threshold, 93.4% of occurrence records were accurately predicted, and 89.6% of unsampled or non-distributed areas were correctly identified. Both threshold determination methods demonstrated that MaxEnt model was more accurate at predicting areas where S. invicta occurs than at predicting non-distribution areas.
In China, Bio1, Bio7, and Bio12 are the three dominant bioclimatic drivers of current habitat suitability for S. invicta. Together these variables account for > 82% of the model′s contribution to habitat suitability (see Table 2). In the USA, habitat suitability for S. invicta is driven primarily by Bio1, Bio8, and Bio12, which together account for > 89% of the model′s contribution (see Table 2). Notably, Bio1 and Bio12 are consistently key determinants of S. invicta habitat suitability in both China and the USA.
Table 2
| Variable contribution rate of China (%) | Variable contribution rate of the USA (%) | ||
|---|---|---|---|
| Variables | Contribution rate | Variable | Contribution rate |
| Bio1 | 50.1 | Bio1 | 61.1 |
| Bio2 | 2.3 | Bio2 | 0.9 |
| Bio3 | 1.2 | Bio3 | 0.8 |
| Bio5 | 2.4 | Bio7 | 3.2 |
| Bio7 | 11.5 | Bio8 | 4.9 |
| Bio12 | 21.1 | Bio9 | 4.1 |
| Bio14 | 10.4 | Bio12 | 23.8 |
| Bio18 | 0.9 | Bio15 | 0.6 |
| - | - | Bio18 | 0.7 |
Contribution rate of bioclimatic variables in prediction of current suitable areas.
3.2 Direct comparison of environmental variables
Comparisons revealed that, apart from Bio1 and Bio12, all other bioclimatic variables differed significantly between China and the USA (p < 0.001; Figure 2). The min temperature of coldest month for S. invicta in China was higher than that of the USA (∆T = 4.86 °C). China also exhibited a smaller mean diurnal range (∆T = −4.21 °C) and a narrower annual temperature range (∆T = −6.62 °C) than the USA. Compared with populations in the USA, S. invicta in China has become particularly more temperature-sensitive during invasion. Mean annual precipitation in China was 28.35 mm higher than that in the USA. Precipitation in the wettest month (∆T = 11.62 mm), wettest quarter (∆T = 31.60 mm) and warmest quarter (∆T = 29.39 mm) was likewise higher in China than in the USA. But precipitation in the driest month (∆T = −3.23 mm), driest quarter (∆T = −12.21 mm) and coldest quarter (∆T = −14.06 mm) was correspondingly lower in China than in the USA. In China, S. invicta tolerates wider precipitation extremes but exhibits greater sensitivity to temperature variation.
Figure 2

Comparison of Solenopsis invicta environmental variables between native (the USA) and invasive countries (China) by R.
3.3 Climatic niche overlap, equivalency and similarity
Climatic niche comparisons of S. invicta between China and the USA are presented in Figures 3, 4. Principal-component analysis of the MaxEnt-selected bioclimatic variables showed that the first two axes explain 62.25% of the total variance (PC1 = 41.02%, PC2 = 21.23%), indicating a shift and expansion of the realized climatic niche in the invasive regions examined. PC1 (41.02%) correlates positively with temperature seasonality, whereas PC2 (21.23%) correlates negatively with precipitation seasonality. Niche overlap (D) between China and the USA was 0.301, and the vector of climate-niche shift deviated significantly from the background climate gradient (p < 0.05). Meanwhile, niche comparisons between China and the USA revealed small unfilled portions in both ranges, each substantially smaller than their area of overlap. Niche-equivalence testing rejected the null hypothesis of identical niches (p < 0.05), whereas the similarity test did not (p > 0.05), indicating significant overlap but non-equivalent climatic niches between China and the USA. Together, the equivalence and similarity tests indicate that the climatic niche of S. invicta has shifted significantly during its transition from the USA to China. In particular, pair-wise comparisons of environmental variables between the USA and China revealed significant divergence in niche requirements, demonstrating that S. invicta possesses strong adaptive capacity via niche shift during invasion.
Figure 3

Niche of Solenopsis invicta in China and the USA under climatic ecological space. (a,b) Represent histograms representing the niche equivalence (D) test and niche similarity test of the two regions. (c) Represents the contribution of each variable to the principal component axis. (d) Indicates the overlapping of the species origin and invasion countries. Blue indicates niche overlap, green represents unfilled niche space, and red represents expansion. Red arrows mark the Schoener’s D (niche overlap index) estimate. The solid and dashed contour lines illustrate 100 and 50% of the available environmental space, respectively.
Figure 4

Predicted niche occupancy (PNO) profiles. Blue solid indicates predicted niche overlap, green solid represents predicted niche of native country, and red solid represents predicted niche of invasive country. Over-lapping peaks indicate similar climatic tolerances, and the breadth of the profile indicates the climatic tolerance specificity. The green and red solid contour lines illustrate 100% of the available environmental space for native country and invasive country, respectively. (a) Annual mean temperature (Bio1); (b) mean diurnal range (Bio2); (c) isothermality (Bio3); (d) temperature annual range (Bio7); (e) mean temperature of wettest quarter (Bio8); (f) mean temperature of driest quarter (Bio9); (g) annual precipitation (Bio12); (h) precipitation seasonality (Bio15); (i) precipitation of warmest quarter (Bio18).
Single-factor bioclimatic analysis and the corresponding PNO curves intuitively reflect niche shifts across all 19 climate variables for S. invicta in China and the USA (Figure 4). Bio2 and Bio15 showed obvious divergence, indicating that daily temperature amplitude and seasonal rainfall variation are the primary constraints shaping the differing distributions of S. invicta in China and the USA. Other variables exhibited similar response breadths in both countries, notably Bio8 and Bio12, indicating comparable adaptation to wet-season temperature and total annual rainfall. Moreover, the species′ response to Bio15 differed markedly between China and the USA, indicating a rapid adjustment to altered seasonal rainfall regimes during invasion.
3.4 Potential ecologically suitable distribution under current climate conditions
MaxEnt projections were classified into four habitat-suitability classes for S. invicta: high, moderate, low, and unsuitable. In China (Figure 5a), highly suitable areas covers 1.769 × 10⁵ km2 (1.83% of the national land area) and is concentrated in Hainan, Guangdong, Guangxi and Fujian Provinces. Moderately suitable areas surrounds highly suitable areas, extending over 2.2969 × 10⁵ km2, accounting for about 23.9% of the national land area. Low suitable areas occur mainly in Yunnan, Jiangxi, southern Guizhou and Hunan Provinces, and along the Chongqing-Sichuan border. In the USA (Figure 5b), highly suitable areas occurs primarily in Florida, southeastern Texas, the southern coastal plains of Louisiana, Mississippi and Alabama, and the eastern coastal region of Georgia, South Carolina and North Carolina. These highly suitable areas cover 3.2781 × 10⁵ km2, representing approximately 3.57% of the total land area of the United States. Moderately suitable areas extends northward from the highly suitable areas, covering most of Texas, Louisiana, Mississippi, Alabama, Georgia, South Carolina and North Carolina. These moderately suitable areas covers 7.1328 × 10⁵ km2, representing approximately 7.78% of the land area of the United States. In both countries, S. invicta is largely confined to low-latitude coastal regions of the east and south.
Figure 5
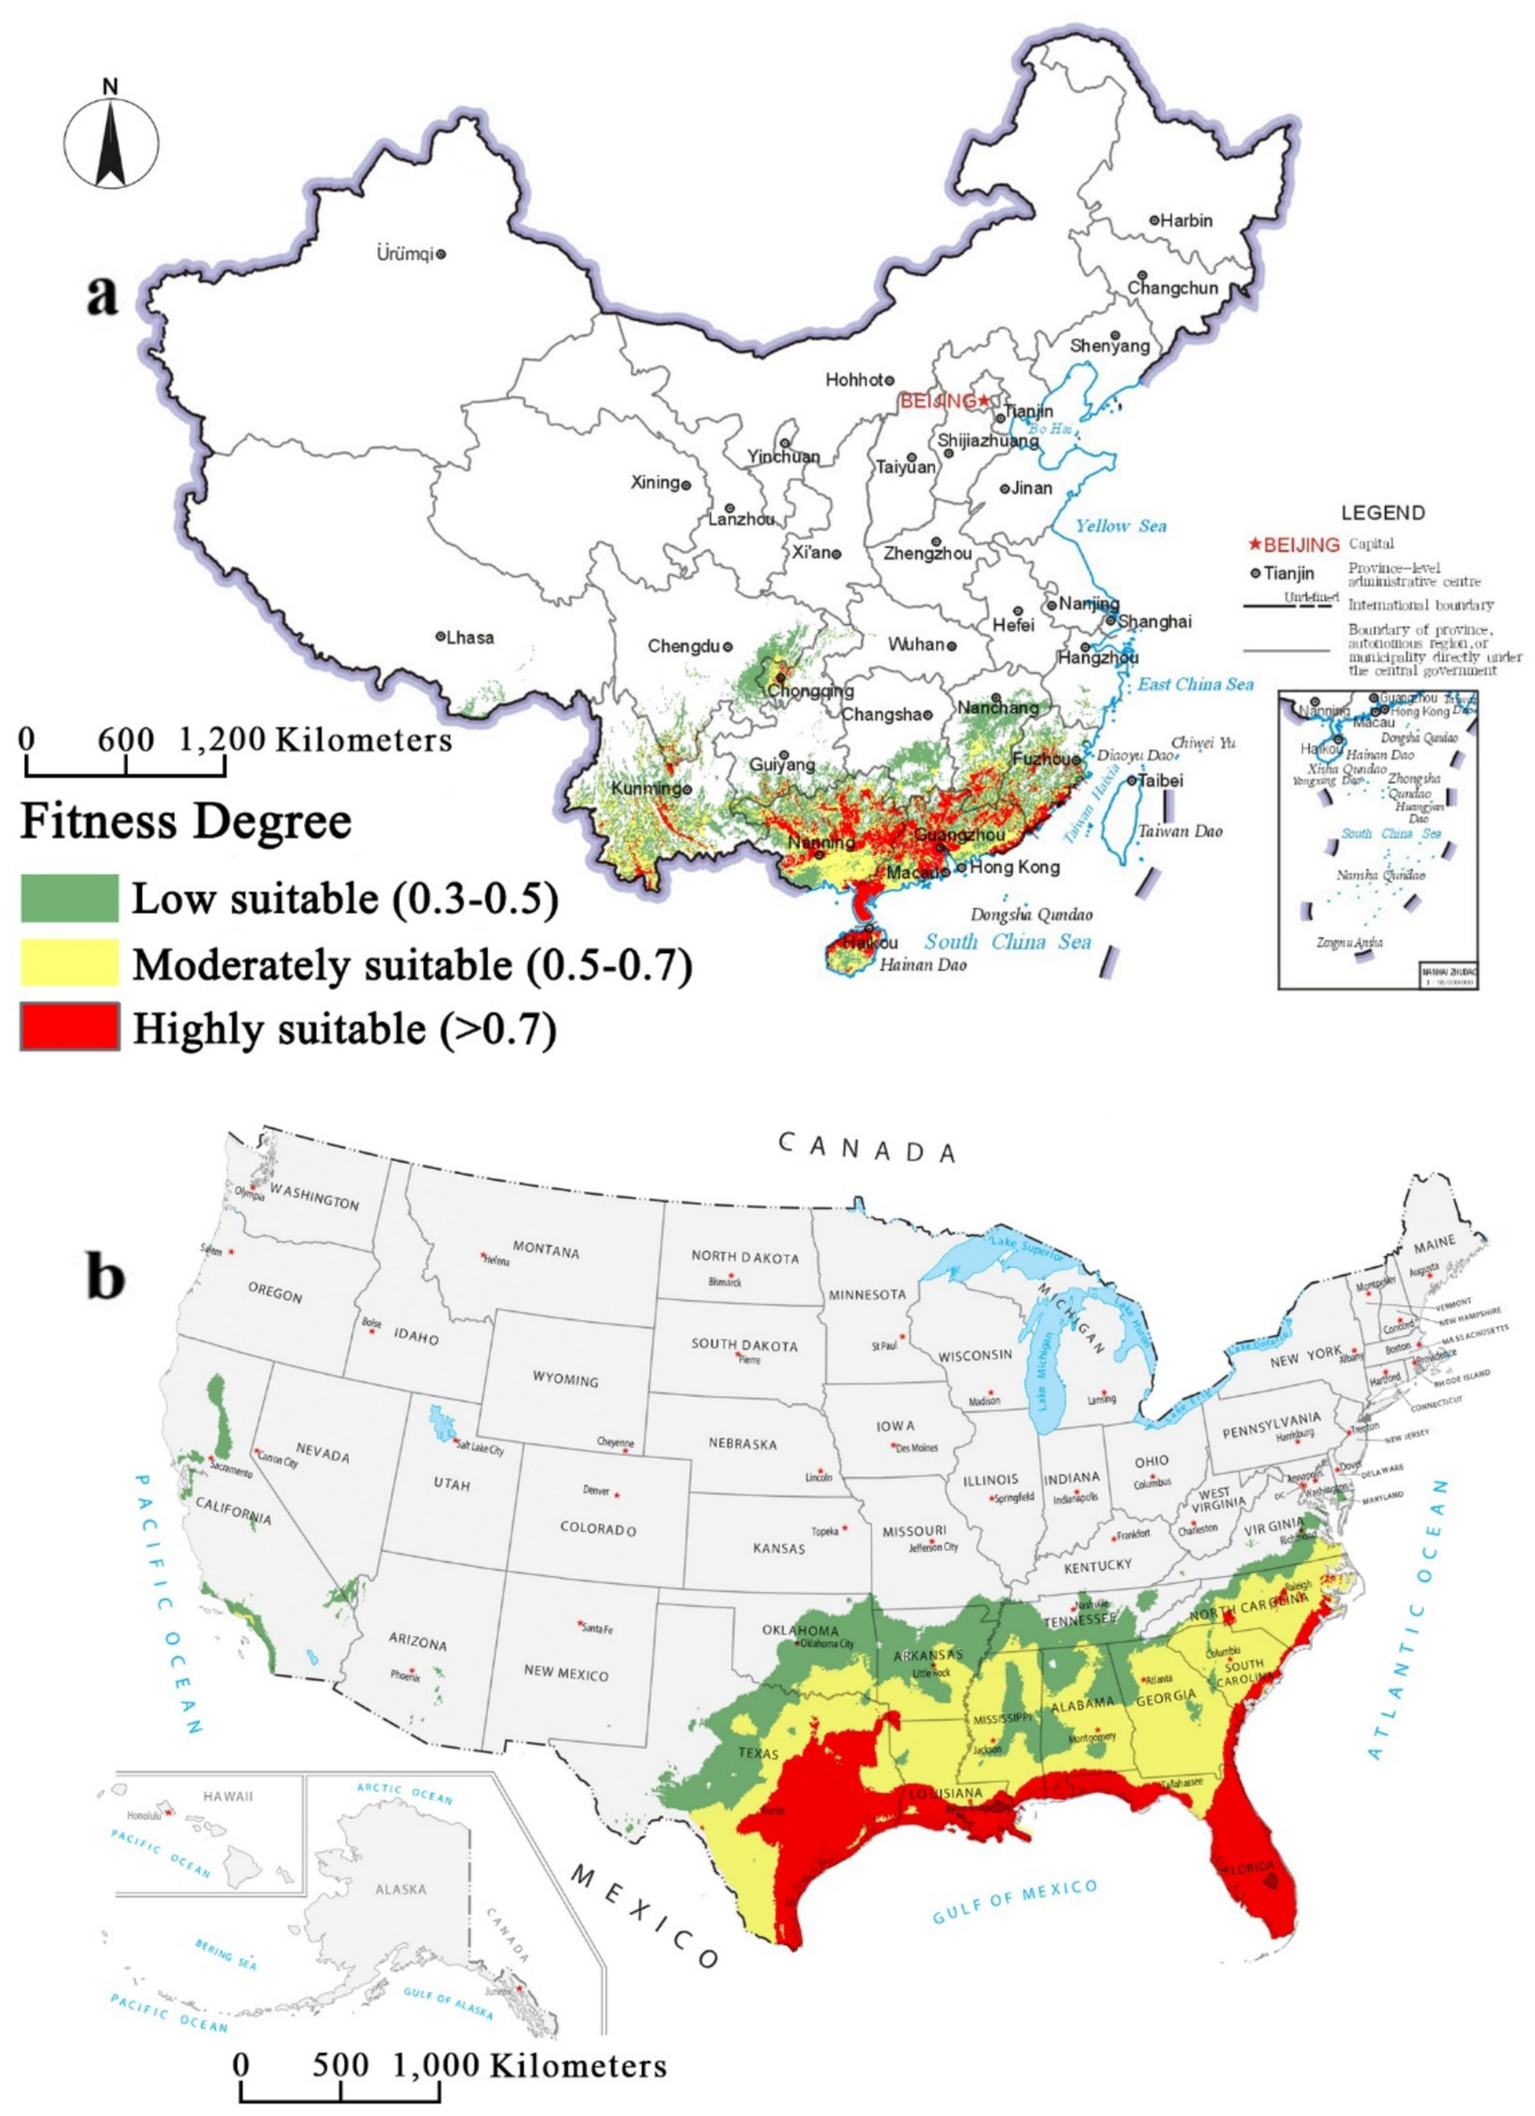
Suitable areas of Solenopsis invicta in China and the USA under the current climate conditions. (a) China; (b) the USA.
3.5 Potential ecologically suitable distribution under future climate conditions
Future suitable habitats for S. invicta in China and the USA are shown in Figures 6, 7. Under both RCP 2.6 and RCP 8.5, highly suitable areas in China will expand outward from the current distribution areas. Yunnan and Guangxi provinces are projected to become increasingly suitable for S. invicta establishment and persistence. Furthermore, regions presently free of S. invicta are projected to remain largely invasion-resistant under the future climates in China. In China, S. invicta is projected to remain largely confined to areas south of 30°N. Under future climates, North Carolina will face increasing invasion pressure, with highly suitable habitat projected to expand inland. Overall, suitable habitat for S. invicta in the USA is projected to remain largely south of 36°N.
Figure 6
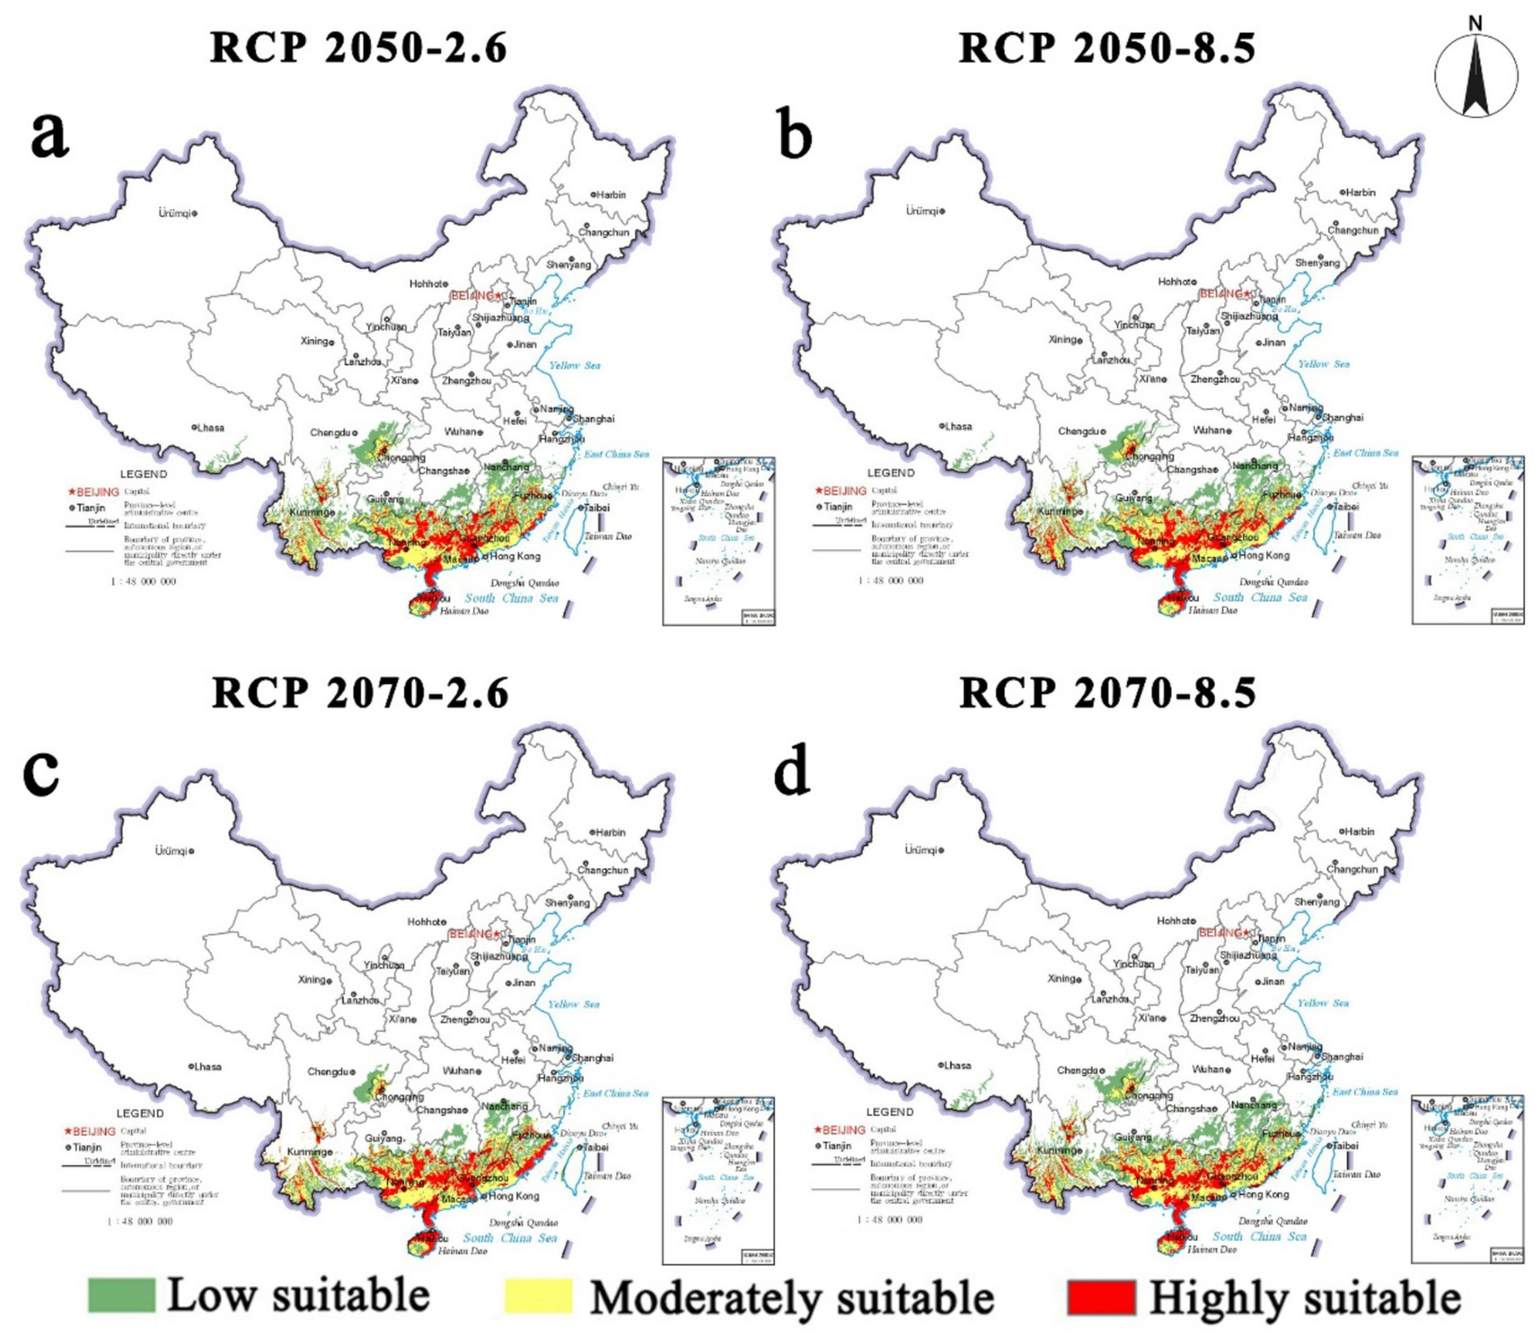
Future species distribution models of Solenopsis invicta in China under different climate scenarios predicted by MaxEnt. (a) RCP 2050–2.6; (b) RCP 2050–8.5; (c) RCP 2070–2.6; (d) RCP 2070–8.5.
Figure 7

Future species distribution models of Solenopsis invicta in America under different climate scenarios predicted by MaxEnt. (a) RCP 2050–2.6; (b) RCP 2050–8.5; (c) RCP 2070–2.6; (d) RCP 2070–8.5.
Projected changes in habitat suitability for China and the USA are shown in Figure 8. Under future climates, the combined area of highly and moderately suitable habitat for S. invicta in China is projected to expand. Climatic conditions under RCP 8.5 are more conducive to the expansion of suitable habitat. In the USA, the highly suitable areas is projected to decline initially and then expand, whereas the moderately suitable area will follow the opposite trend. Under both RCP 2.6 and RCP 8.5, the centroid of suitable habitat for S. invicta is projected to shift northwestward in China and southeastward in the USA (Figure 9). Compared with RCP 2.6, RCP 8.5 exerts a stronger influence on the centroid shift of S. invicta.
Figure 8

Suitable areas change of Solenopsis invicta in China and the USA under different climate scenarios. (a) Highly suitable area in China; (b) moderately suitable area in China; (c) highly suitable area in the USA; (d) moderately suitable area in the USA.
Figure 9

The core distributional shifts of Solenopsis invicta suitable areas in China and the USA under different climate scenarios. (a) Core range shifts of S. invicta in China; (b) Core range shifts of S. invicta in the USA.
4 Discussion
4.1 Performance of the species distribution modelling approach
Species distribution models (SDMs) accurately forecast suitable habitat ranges for species and quantify the relationships between climate variables and species presence (De Marco et al., 2008; Evans et al., 2015). MaxEnt, one of the most widely used SDMs, can efficiently leverages large-scale species data to estimate habitat suitability. This capability enriches the environmental data available for building comprehensive species-environment relationships (Elith and Leathwick, 2009). Consequently, MaxEnt is widely regarded as one of the most reliable tools for species distribution prediction. The International Union for Conservation of Nature (IUCN) now integrates MaxEnt into research on biological invasions, endangered-species conservation, and climate-change impacts (Cassini, 2011).
To forecast the effects of global climate change on the future spread of S. invicta in China and the USA, we developed ecological niche models for both current and future climate scenarios. The ranges and climates projected by our model closely match the documented occurrences of S. invicta in both regions (Sung et al., 2018). It is worth noting that climate is not the sole driver of invasion success. Invasion dynamics also hinge on the species’ intrinsic adaptive capacity, disturbance levels in recipient habitats, reproductive and dispersal traits, and anthropogenic activity (Wilson et al., 2009; Schweiger et al., 2010). Nevertheless, climate remains a key determinant of species survival and reproduction, profoundly shaping the geographic distribution and biological control of alien species (Bellard et al., 2012). Climate also governs species interactions, thereby influencing alien distributions and the outcome of biological-control programmes (Uden et al., 2015). Here, we characterized the niche of S. invicta with 19 environmental variables and evaluated model performance using AUC, TSS and omission rates. With AUC and TSS exceeding 0.9, and the omission rate below 10%, the model delivers highly accurate, robust predictions. Given the high AUC, spatial sorting bias may have inflated the evaluation metrics. Consequently, we emphasize TSS and omission rate alongside AUC and recommend independent, spatially blocked cross-validation for future projections.
4.2 Climatic space for S. invicta
Environmental variables strongly shape insect distributions. Both the eastern seaboards of China and the USA are maritime, lying largely within the mid-latitude temperate zone (30–50°N). This similar physiography generates comparable temperature and precipitation regimes, providing a common climatic template for trans-continental invasion by the same species (Tiffney, 1985; Chen et al., 2005; Zhao et al., 2015). Among the numerous climatic variables that affect alien species distributions, only a handful of key factors drive the invasion process (Occhipinti-Ambrogi, 2007). Under current climates, temperature is the primary constraint on S. invicta survival in both China and the USA. Annual mean temperature (Bio1) was identified as the most critical factor of species distribution, contributing more than 50% in both countries. Temperature is a key determinant of insect reproduction, a prerequisite for population persistence (Regniere et al., 2012). Annual average temperature captures the thermal conditions required for growth and development of S. invicta. Deviations from the optimal thermal range disrupt reproductive and physiological processes in insects (Janowitz and Fischer, 2011). Foraging as the paramount life activity of insects is affected by temperature. Worker ants of S. invicta foraged between 15 and 43 °C, and the average weight of individual forager increased by about 30% with rising soil temperature (Porter and Tschinkel, 1987). Elevated environmental temperature will promote foraging-gene expression of S. invicta, enhancing food conversion (Zhou et al., 2020). However, relative humidity, saturation deficit, soil moisture, and wind speed showed no association with foraging activity (Porter and Tschinkel, 1987). Meanwhile, temperature also governs the reproduction and development activities of S. invicta. Larval development occurs only within a narrow thermal window: 24–36 °C is optimal, and 17 °C represents the theoretical lower threshold (Porter, 1988). Interestingly, development time decreased significantly with rising temperature, and temperature likewise governs invasion speed and spread. In new habitats, the flight of reproductive ants is the primary natural spread mechanism, and flight speed increases with temperature but declines with body mass (Vogt et al., 2000). Consequently, the latitudinal temperature gradient constrains S. invicta from expanding into higher latitudes. Killion and Grant set the northern invasion limit at the −17 °C annual minimum isotherm (Killion and Grant, 1995), and Allen believes that −12.2 °C alone halts the northward spread of S. invicta in the USA (Allen et al., 1995).
Besides temperature, moisture and precipitation strongly influence insect physiology and population dynamics. Our model identified annual precipitation as a further key constraint on the species′ suitable range in both countries. Environmental moisture mainly affects insect water balance, and further regulates growth and development of insects (Benoit, 2010; Jactel et al., 2012). Soil-moisture studies show that worker ants can tolerate high water moisture, whereas drought significantly reduces survival of S. invicta (Xu et al., 2009). For example, eggs of Cyclocephala immaculata immaculata develop only when soil moisture exceeds 12.5%, and embryos are highly moisture-sensitive (Potter, 1983). In addition, rainfall and soil moisture also govern longevity. Mortality of S. invicta is high when relative soil water content falls below 20%, whereas values above 40% have no discernible effect on lifespan (Xu et al., 2009). Nevertheless, pronounced outbreaks can follow drought, largely because reduced winter soil moisture enhances overwintering survival (Dominiak et al., 2007). Over-wintering survival of Heliothis zea produced is much lower in humid than in dry soil (Rummel et al., 1986). Higher winter soil moisture has also been shown to increase pupal overwintering mortality in other insect species (HOSHIKAWA et al., 1988; Liu et al., 2007; Hou et al., 2009). Soil moisture is only one of several factors affecting overwintering-pupa survival, and mortality is also influenced by soil temperature, soil-layer structure and irrigation regime.
4.3 Suitable habitat and its dynamics
Climate change will reshape interactions among human activities, abiotic conditions and biota, potentially intensifying biological invasions (Pyke et al., 2008). Using the optimized MaxEnt model, we projected and mapped suitable habitats of S. invicta in China and the USA, quantified its spatial pattern and identified the key limiting factors. Leveraging two representative concentration pathways, our study is the first to project the distribution of S. invicta in both China and the USA under changing climates using MaxEnt. Our projections show that suitable habitat for S. invicta will continue to expand in China but will contract modestly in the USA. S. invicta are mainly distributed in the eastern and southern coasts of both countries, where rainfall is abundant and heat is sufficient (Gershunov and Barnett, 1998; Qian and Qin, 2008). Under current climates, our predicted distribution aligns well with documented occurrences in both countries, yet deviates somewhat from earlier forecasts—especially within China. On the one hand, S. invicta has been present in China for a relatively short time, and its adaptation to the local environment remains unstable (Wetterer, 2013). On the other hand, Chinese scholars generally regard the coldest quarterly average temperature (−12.2 °C or −17 °C) as the northern boundary for S. invicta in China based on the experience of the USA, and take the precipitation (510 mm) as the watershed to determine the suitability of S. invicta (Killion and Grant, 1995; Korzukhin et al., 2001). Yet habitat deemed suitable solely from these thresholds is likely over-estimated. Moreover, although Beijing, Tianjin and Shandong Province—lying at latitudes similar to parts of the USA—were considered to be at risk, China’s complex topography, distinctive microclimates and intensive human modification limit the usefulness of latitude-only predictions. Under the current climates, S. invicta is mainly distributed in the eastern and southern regions of both China and the USA. These regions correspond to the subtropical monsoon climate of China and the subtropical humid climate of the USA, where monsoonal warmth and abundant rainfall are beneficial for S. invicta. Meanwhile, the forest-rich eastern and southern coasts of both countries also supply abundant food for S. invicta (Li et al., 2004; Keenan et al., 2015). Furthermore, pest occurrence probability is linked to forest cover, and future climate-driven changes in forest extent will further shape pest distributions (Hudgins et al., 2017). However, given the omnivorous diet of S. invicta, forest influence on its distribution may be partially buffered. Altitude strongly modifies regional climate, hydrology and vegetation, thereby indirectly constraining the spread of invasive species (Becker et al., 2005). The Qinghai-Tibet Plateau, for example, hindered the possible path of Spodoptera exigua Hiibner from India into China (Wang et al., 2020). Although altitude variables was not included in our model, we noticed that the Rocky Mountains significantly prevented S. invicta from expanding into the western United States. By contrast, the Yunnan-Kweichow Plateau with similar in altitude has extensive suitable habitat, probably because the surrounding high human density offsets the climatic limitation.
Under future climates, MaxEnt projects a gradual expansion of suitable habitat in China and a contraction in the USA. For example, suitable habitat is projected to keep expanding in Guangxi and Hainan, whereas it will contract along the southern US coast, including Baton Rouge, Louisiana. Future climate change will alter global mean annual rainfall and its spatial pattern (Dore, 2005; Trenberth, 2011). Global warming is projected to intensify aridity across tropical and subtropical regions of the Northern Hemisphere (0–30°N), likely explaining the projected contraction of S. invicta habitat in the low-latitude coastal USA (Dai, 2011; Trenberth et al., 2014). The total annual rainfall in China has increased under global warming (Gong and Wang, 2000). For example, the Qinghai-Tibet region has experienced a marked precipitation increase, whereas rainfall in the southwestern region has declined slightly overall (Li et al., 2010). Altered rainfall patterns in China have enabled S. invicta to expand its range steadily toward the northwest. Moreover, enhanced BIOME4 projections further indicate a northward shift of natural vegetation boundaries in eastern China, providing additional support for the potential northwestward spread of S. invicta. In summary, our results illustrate how climate, topography enemy and human activity jointly sculpt the invasion trajectory. Scientific forecasts in the future should integrate dynamic climate projections, fine-scale elevation data and spatially explicit human-modification layers rather than relying on single-factor thresholds or latitude surrogates.
4.4 Climatic niche overlap, equivalency and similarity
A species′ fundamental niche comprises the set of environmental conditions under which it can persist. More broadly, “niche” also encompasses the position occupied by a population in space and time. Climate as an environmental factor is particularly important for the present of alien species (Pearman et al., 2008). Climatic differences alter resource availability, driving niche differentiation and shaping the distinct spatial patterns of alien species (Lavergne et al., 2010). Identifying patterns produced by niche conservatism is a prerequisite for predicting species invasion (Wiens et al., 2010). Here, our niche-equivalency and similarity tests reveal a dual pattern for S. invicta: significant climatic niche conservatism alongside measurable divergence during invasion into China. High stability indicates that the species largely retains the core temperature–precipitation envelope of its native range, consistent with the conservatism reported in other invasive systems. Meta-analysis including S. invicta confirms high niche stability across multiple ant invasions (Liu et al., 2020). However, the equivalence test rejected the null of identical niches, whereas the similarity test did not, demonstrating that the observed expansion into hotter, more seasonally variable climates is not a passive artefact of differing background conditions but reflects active colonization of novel environmental space. This apparent paradox—conservatism in the original niche and simultaneous expansion of the invasion process—suggests that S. invicta combines strong physiological buffering with rapid adaptive adjustment. Meanwhile, enemy release and altered biotic interactions allow genuine niche expansion beyond the native envelope (Liu et al., 2020). Consequently, predictive models that assume strict niche conservatism may underestimate the species′ future spread in invaded regions, emphasizing the need for dynamic, adaptation-aware forecasts. Not all climatically suitable habitats in China have been occupied during the invasion, and vacant ecological space persists alongside ongoing expansion, leaving the population in a state of disequilibrium. Vacant yet climate-suitable habitat reflects China′s non-equilibrium invasion: short invasion duration, microclimatic barriers and human suppression leave substantial ecological space unoccupied (Liu et al., 2020). Therefore, future climate change is likely to drive further ecological-niche shifts during invasion.
Building on the above evidence of simultaneous conservatism and expansion, we infer that the observed niche divergence reflects genuine evolutionary change rather than passive background effects. Lack of natural enemies and altered biotic interactions in China probably relax selection pressures, allowing the species to colonize hotter, more seasonal climates that lie outside its native envelope (Broennimann et al., 2007; Tingley et al., 2014). Range expansion itself further promotes niche shifts, while growing evidence for extensive epigenetic variation provides a mechanistic pathway for rapid physiological adjustment despite limited genetic diversity (Allendorf and Lundquist, 2003; Prentis et al., 2008; Hawes et al., 2018). Together, these processes clarify why niche similarity is maintained even as equivalence is rejected, and underscore the need to incorporate flexible, adaptation-aware parameters when forecasting future spread.
5 Conclusion
Biological invasions are the second greatest reason of global biodiversity loss, which is essentially a dynamic process of species distribution changes. Ecological niche models (ENMs) grounded in machine learning principles are widely applied in invasion and conservation biology. We first compared bioclimatic variables characterising S. invicta in China and the USA, then used MaxEnt to project current and future habitat suitability in both countries, and finally quantified niche shifts with the ecospat package. We found that similar mean annual temperature and precipitation in China and the USA provide an essential climatic template for S. invicta’s invasion success, whereas divergence in other bioclimatic variables reflects the species′ capacity to adapt to novel habitats. Second, S. invicta is currently concentrated along the eastern and southern coasts of both countries, and its suitable range will expand in China but contract in the USA under future climates. Consequently, uncritical adoption of US-derived thresholds and prediction practices is inadequate for guiding future S. invicta management in China. Third, mean diurnal range (Bio2), precipitation seasonality (Bio15) and other variables showed significant niche differentiation, underscoring the species′ capacity for rapid climatic adaptation during invasion. Niche conservatism shaped the early stages of invasion, yet S. invicta subsequently exhibited significant climatic and geographic niche shifts during its expansion. Overall, ENM-based prediction and assessment of alien species′ suitable habitats and niches offer both theoretical insights and practical value. Our study delineates suitable habitats and quantifies climatic niche shifts during S. invicta′s spread from the USA to China, providing managers with a scientific basis for formulating evidence-based control policies.
Statements
Data availability statement
The original contributions presented in the study are included in the article/supplementary material, further inquiries can be directed to the corresponding author.
Author contributions
XT: Conceptualization, Data curation, Formal analysis, Investigation, Software, Writing – original draft, Writing – review & editing. YD: Data curation, Formal analysis, Software, Writing – review & editing. ZH: Project administration, Supervision, Validation, Writing – review & editing. MZ: Conceptualization, Project administration, Writing – review & editing. YY: Conceptualization, Software, Supervision, Writing – review & editing. KZ: Funding acquisition, Visualization, Writing – review & editing.
Funding
The author(s) declare that financial support was received for the research and/or publication of this article. This project was funded by the Jiangxi Institute of Land Space Survey and Planning, Technology Innovation Center for Land Spatial Ecological Protection and Restoration in Great Lakes Basin, Ministry of Natural Resources.
Conflict of interest
The authors declare that the research was conducted in the absence of any commercial or financial relationships that could be construed as a potential conflict of interest.
Generative AI statement
The author(s) declare that no Gen AI was used in the creation of this manuscript.
Any alternative text (alt text) provided alongside figures in this article has been generated by Frontiers with the support of artificial intelligence and reasonable efforts have been made to ensure accuracy, including review by the authors wherever possible. If you identify any issues, please contact us.
Publisher’s note
All claims expressed in this article are solely those of the authors and do not necessarily represent those of their affiliated organizations, or those of the publisher, the editors and the reviewers. Any product that may be evaluated in this article, or claim that may be made by its manufacturer, is not guaranteed or endorsed by the publisher.
References
1
Abdedayem W. Patpour M. Laribi M. Justesen A. F. Kouki H. Fakhfakh M. et al . (2023). Wheat stem rust detection and race characterization in Tunisia. Plants12:552. doi: 10.3390/plants12030552
2
Aguirre-Gutiérrez J. Serna-Chavez H. M. Villalobos-Arambula A. R. Perez De La Rosa J. A. Raes N. (2015). Similar but not equivalent: ecological niche comparison across closely–related Mexican white pines. Divers. Distrib.21, 245–257. doi: 10.1111/ddi.12268
3
Allen C. R. Lutz R. S. Demarais S. (1995). Red imported fire ant impacts on northern bobwhite populations. Ecol. Appl.5, 632–638. doi: 10.2307/1941972
4
Allendorf F. W. Lundquist L. L. (2003). Introduction: population biology, evolution, and control of invasive species. Conserv. Biol.17, 24–30. doi: 10.1046/j.1523-1739.2003.02365.x
5
Atwater D. Z. Ervine C. Barney J. N. (2018). Climatic niche shifts are common in introduced plants. Nat. Ecol. Evol.2, 34–43. doi: 10.1038/s41559-017-0396-z
6
Bates O. K. Ollier S. Bertelsmeier C. (2020). Smaller climatic niche shifts in invasive than non-invasive alien ant species. Nat. Commun.11, 1–8. doi: 10.1038/s41467-020-19031-1
7
Becker T. Dietz H. Billeter R. Buschmann H. Edwards P. J. (2005). Altitudinal distribution of alien plant species in the Swiss Alps. Perspect. Plant Ecol. Evol. Syst.7, 173–183. doi: 10.1016/j.ppees.2005.09.006
8
Bellard C. Bertelsmeier C. Leadley P. Thuiller W. Courchamp F. (2012). Impacts of climate change on the future of biodiversity. Ecol. Lett.15, 365–377. doi: 10.1111/j.1461-0248.2011.01736.x
9
Bellard C. Thuiller W. Leroy B. Genovesi P. Bakkenes M. Courchamp F. (2013). Will climate change promote future invasions?Glob. Chang. Biol.19, 3740–3748. doi: 10.1111/gcb.12344
10
Benoit J. B. (2010). Water management by dormant insects: comparisons between dehydration resistance during summer aestivation and winter diapause. Aestivation49, 209–229. doi: 10.1007/978-3-642-02421-4_10
11
Borges I. L. Dangerfield J. C. Angeloni L. M. Funk W. C. Fitzpatrick S. W. (2022). Reproductive benefits associated with dispersal in headwater populations of Trinidadian guppies (Poecilia reticulata). Ecol. Lett.25, 344–354. doi: 10.1111/ele.13929
12
Broennimann O. Fitzpatrick M. C. Pearman P. B. Petitpierre B. Pellissier L. Yoccoz N. G. et al . (2012). Measuring ecological niche overlap from occurrence and spatial environmental data. Glob. Ecol. Biogeogr.21, 481–497. doi: 10.1111/j.1466-8238.2011.00698.x
13
Broennimann O. Mráz P. Petitpierre B. Guisan A. Müller-Schärer H. (2014). Contrasting spatio-temporal climatic niche dynamics during the eastern and western invasions of spotted knapweed in North America. J. Biogeogr.41, 1126–1136. doi: 10.1111/jbi.12274
14
Broennimann O. Treier U. A. Müller-Schärer H. Thuiller W. Peterson A. Guisan A. (2007). Evidence of climatic niche shift during biological invasion. Ecol. Lett.10, 701–709. doi: 10.1111/j.1461-0248.2007.01060.x
15
Brown J. L. (2014). SDM toolbox: a python-based GIS toolkit for landscape genetic, biogeographic and species distribution model analyses. Methods Ecol. Evol.5, 694–700. doi: 10.1111/2041-210X.12200
16
Cárdenas G. P. Bravo N. Barboza E. Salazar W. Ocaña J. Vázquez M. et al . (2023). Current and future distribution of Shihuahuaco (Dipteryx spp.) under climate change scenarios in the central-eastern Amazon of Peru. Sustainability15:7789. doi: 10.3390/su15107789
17
Cassini M. H. (2011). Ranking threats using species distribution models in the IUCN red list assessment process. Biodivers. Conserv.20, 3689–3692. doi: 10.1007/s10531-011-0126-9
18
Chen X. Hu B. Yu R. (2005). Spatial and temporal variation of phenological growing season and climate change impacts in temperate eastern China. Glob. Chang. Biol.11, 1118–1130. doi: 10.1111/j.1365-2486.2005.00974.x
19
Clement R. A. Lee H. Manoukis N. C. Pacheco Y. M. Ross F. Sisterson M. S. et al . (2025). Addressing biological invasions in agriculture with big data in an informatics age. Agriculture15:1157. doi: 10.3390/agriculture15111157
20
Cook J. L. (2003). Conservation of biodiversity in an area impacted by the red imported fire ant, Solenopsis invicta (Hymenoptera: formicidae). Biodivers. Conserv.12, 187–195. doi: 10.1023/A:1021986927560
21
Dai A. (2011). Drought under global warming: a review. Wiley Interdiscip. Rev. Clim. Chang.2, 45–65. doi: 10.1002/wcc.81
22
De Marco P. Jr. Diniz-Filho J. A. F. Bini L. M. (2008). Spatial analysis improves species distribution modelling during range expansion. Biol. Lett.4, 577–580. doi: 10.1098/rsbl.2008.0210
23
Di Cola V. Broennimann O. Petitpierre B. Breiner F. T. D’amen M. Randin C. et al . (2017). Ecospat: an R package to support spatial analyses and modeling of species niches and distributions. Ecography40, 774–787. doi: 10.1111/ecog.02671
24
Dominiak B. Gillespie P. Kerr M. Kelly E. Mclennan R. (2007). Search for red imported fire ants Solenopsis invicta Burren (Hymenoptera: Formicidae) in New South Wales, Australia during 2003/2004. Plant Protection Quart.22:14. doi: 10.1071/PP07003
25
Dore M. H. (2005). Climate change and changes in global precipitation patterns: what do we know?Environ. Int.31, 1167–1181. doi: 10.1016/j.envint.2005.03.004
26
Dormann C. F. Schymanski S. J. Cabral J. Chuine I. Graham C. Hartig F. et al . (2012). Correlation and process in species distribution models: bridging a dichotomy. J. Biogeogr.39, 2119–2131. doi: 10.1111/j.1365-2699.2011.02659.x
27
Drees B. M. Calixto A. A. Nester P. R. (2013). Integrated pest management concepts for red imported fire ants Solenopsis invicta (Hymenoptera: Formicidae). Insect Sci.20, 429–438. doi: 10.1111/j.1744-7917.2012.01552.x
28
Drouet L. Bosetti V. Tavoni M. (2015). Selection of climate policies under the uncertainties in the fifth assessment report of the IPCC. Nat. Clim. Chang.5, 937–940. doi: 10.1038/nclimate2721
29
Dudík M. Phillips S. Schapire R. E. (2005). Correcting sample selection bias in maximum entropy density estimation. Adv. Neural Inf. Proces. Syst.18, 323–330.
30
Elith J. Leathwick J. R. (2009). Species distribution models: ecological explanation and prediction across space and time. Annu. Rev. Ecol. Evol. Syst.40, 677–697. doi: 10.1146/annurev.ecolsys.110308.120159
31
Erikssona T. Daleruma F. (2018). A maxent approach to identify potential range expansion areas for an expanding wolf population. Biol. Conserv.220, 170–181. doi: 10.1016/j.biocon.2018.02.019
32
Evans T. G. Diamond S. E. Kelly M. W. (2015). Mechanistic species distribution modelling as a link between physiology and conservation. Conserv. Physiol.3, 1032–1056. doi: 10.1093/conphys/cov056
33
Fenollosa E. Pang S. E. H. Briscoe N. J. Guisan A. Salguero-Gómez R. (2025). Powerful yet challenging: mechanistic niche models for predicting invasive species potential distribution under climate change. Ecography32:e07775. doi: 10.1002/ecog.07775
34
Fitzpatrick M. C. Gotelli N. J. Ellison A. M. (2013). MaxEnt versus MaxLike: empirical comparisons with ant species distributions. Ecosphere4, 1–15. doi: 10.1890/ES13-00066.1
35
Freeman E. A. Moisen G. G. (2008). A comparison of the performance of threshold criteria for binary classification in terms of predicted prevalence and kappa. Ecol. Model.217, 48–58. doi: 10.1016/j.ecolmodel.2008.05.015
36
Gan T. He Z. Xu D. Chen J. Zhang H. Wei X. et al . (2025). Modeling the potential distribution of Hippophae rhamnoides in China under current and future climate scenarios using the biomod2 model. Front. Plant Sci.16:1533251. doi: 10.3389/fpls.2025.1533251
37
Gao T. Xu Q. Liu Y. Zhao J. Shi J. (2021). Predicting the potential geographic distribution of Sirex nitobei in China under climate change using maximum entropy model. Forests12:151. doi: 10.3390/f12020151
38
Gershunov A. Barnett T. P. (1998). ENSO influence on intraseasonal extreme rainfall and temperature frequencies in the contiguous United States: observations and model results. J. Clim.11, 1575–1586. doi: 10.1175/1520-0442(1998)011<1575:EIOIER>2.0.CO;2
39
Gong D.-Y. Wang S.-W. (2000). Severe summer rainfall in China associated with enhanced global warming. Clim. Res.16, 51–59. doi: 10.3354/cr016051
40
Guisan A. Petitpierre B. Broennimann O. Daehler C. Kueffer C. (2014). Unifying niche shift studies: insights from biological invasions. Trends Ecol. Evol.29, 260–269. doi: 10.1016/j.tree.2014.02.009
41
Haubrock P. J. Cuthbert R. N. Haase P. (2023). Long-term trends and drivers of biological invasion in central European streams. Sci. Total Environ.876:10. doi: 10.1016/j.scitotenv.2023.162817
42
Hawes N. A. Fidler A. E. Tremblay L. A. Pochon X. Dunphy B. J. Smith K. F. (2018). Understanding the role of DNA methylation in successful biological invasions: a review. Biol. Invasions20, 2285–2300. doi: 10.1007/s10530-018-1703-6
43
Hijmans R. J. Cameron S. E. Parra J. L. Jones P. G. Jarvis A. (2005). Very high resolution interpolated climate surfaces for global land areas. Int. J. Climatol.25, 1965–1978. doi: 10.1002/joc.1276
44
Hoshikawa K. Tsutsui H. Honma K. Sakagami S. F. (1988). Cold resistance in four species of beetles overwintering in the soil, with notes on the overwintering strategies of some soil insects. Appl. Entomol. Zool.23, 273–281. doi: 10.1303/aez.23.273
45
Hou M. Han Y. Lin W. (2009). Influence of soil moisture on supercooling capacity and associated physiological parameters of overwintering larvae of rice stem borer. Entomol. Sci.12, 155–161. doi: 10.1111/j.1479-8298.2009.00316.x
46
Hudgins E. J. Liebhold A. M. Leung B. (2017). Predicting the spread of all invasive forest pests in the United States. Ecol. Lett.20, 426–435. doi: 10.1111/ele.12741
47
Jactel H. Petit J. Desprez-Loustau M. L. Delzon S. Piou D. Battisti A. et al . (2012). Drought effects on damage by forest insects and pathogens: a meta-analysis. Glob. Chang. Biol.18, 267–276. doi: 10.1111/j.1365-2486.2011.02512.x
48
Janowitz S. A. Fischer K. (2011). Opposing effects of heat stress on male versus female reproductive success in Bicyclus anynana butterflies. J. Therm. Biol.36, 283–287. doi: 10.1016/j.jtherbio.2011.04.001
49
Jiang Y. Yao Y. Mustafa G. Ren X. Chen C. Wu W. et al . (2024). The impact of land use and biological invasions on ecological service values of coastal wetland ecosystems: A case study in Jiangsu Province, China. Water16:56. doi: 10.3390/w16010056
50
Keenan R. J. Reams G. A. Achard F. De Freitas J. V. Grainger A. Lindquist E. (2015). Dynamics of global forest area: results from the FAO global forest resources assessment 2015. For. Ecol. Manag.352, 9–20. doi: 10.1016/j.foreco.2015.06.014
51
Killion M. J. Grant W. E. (1995). A colony-growth model for the imported fire ant: potential geographic range of an invading species. Ecol. Model.77, 73–84. doi: 10.1016/0304-3800(94)00029-H
52
Kong F. Tang L. He H. Yang F. Tao J. Wang W. (2021). Assessing the impact of climate change on the distribution of Osmanthus fragrans using Maxent. Environ. Sci. Pollut. Res.28, 1–9. doi: 10.1007/s11356-021-13121-3
53
Korzukhin M. D. Porter S. D. Thompson L. C. Wiley S. (2001). Modeling temperature-dependent range limits for the fire ant Solenopsis invicta (Hymenoptera: formicidae) in the United States. Environ. Entomol.30, 645–655. doi: 10.1603/0046-225X-30.4.645
54
Kumar S. Stohlgren T. J. (2009). Maxent modeling for predicting suitable habitat for threatened and endangered tree Canacomyrica monticola in New Caledonia. J. Ecol. Nat. Environ.1, 94–98. doi: 10.4314/jene.v1i4.48355
55
Lavergne S. Mouquet N. Thuiller W. Ronce O. (2010). Biodiversity and climate change: integrating evolutionary and ecological responses of species and communities. Annu. Rev. Ecol. Evol. Syst.41, 321–350. doi: 10.1146/annurev-ecolsys-102209-144628
56
Lebrun E. G. Plowes R. M. Gilbert L. E. (2012). Imported fire ants near the edge of their range: disturbance and moisture determine prevalence and impact of an invasive social insect. J. Anim. Ecol.81, 884–895. doi: 10.1111/j.1365-2656.2012.01954.x
57
Lee C. M. Lee D.-S. Kwon T.-S. Athar M. Park Y.-S. (2021). Predicting the global distribution of Solenopsis geminata (Hymenoptera: Formicidae) under climate change using the MaxEnt model. Insects12:229. doi: 10.3390/insects12030229
58
Lee W.-C. Rodgers J. L. (1998). Bootstrapping correlation coefficients using univariate and bivariate sampling. Psychol. Methods3, 91–103. doi: 10.1037/1082-989X.3.1.91
59
Lee W.-H. Song J.-W. Yoon S.-H. Jung J.-M. (2022). Spatial evaluation of machine learning-based species distribution models for prediction of invasive ant species distribution. Appl. Sci.12:10260. doi: 10.3390/app122010260
60
Lei W. Xu Y.-J. Ling Z. Lu Y.-Y. (2019). Impact of the red imported fire ant Solenopsis invicta Buren on biodiversity in South China: A review. J. Integr. Agric.18, 788–796. doi: 10.1016/S2095-3119(18)62014-3
61
Levia D. Frost E. (2004). Assessment of climatic suitability for the expansion of Solenopsis invicta Buren in Oklahoma using three general circulation models. Theor. Appl. Climatol.79, 23–30. doi: 10.1007/s00704-004-0067-2
62
Li D. Fan S. He A. Yin F. (2004). Forest resources and environment in China. J. For. Res.9, 307–312. doi: 10.1007/s10310-004-0109-8
63
Li L. Yang S. Wang Z. Zhu X. Tang H. (2010). Evidence of warming and wetting climate over the Qinghai-Tibet plateau. Arct. Antarct. Alp. Res.42, 449–457. doi: 10.1657/1938-4246-42.4.449
64
Li M. Zhao H. Xian X. Zhu J. Chen B. Jia T. et al . (2023). Geographical distribution pattern and ecological niche of Solenopsis invicta Buren in China under climate change. Diversity15:607. doi: 10.3390/d15050607
65
Li C. Zhou Y. Wang C. Pan X. Wang Y. Qi X. et al . (2025). Research on the economic loss model of invasive alien species based on multidimensional data Spatialization—A case study of economic losses caused by Hyphantria cunea in Jiangsu Province. Biology14:552. doi: 10.3390/biology14050552
66
Liao D. Zhou B. Xiao H. Zhang Y. Zhang S. Su Q. et al . (2025). MaxEnt modeling of the impacts of human activities and climate change on the potential distribution of Plantago in China. Biology14:564. doi: 10.3390/biology14050564
67
Lin C.-H. Liu Y.-H. Huang R.-N. Lin C.-C. Liu H. K.-H. Wen T.-H. (2022). Modeling geographical invasions of Solenopsis invicta influenced by land-use patterns. Sci. Rep.12:11733. doi: 10.1038/s41598-022-15399-w
68
Liu Z. Gong P. Wu K. Wei W. Sun J. Li D. (2007). Effects of larval host plants on over-wintering preparedness and survival of the cotton bollworm, Helicoverpa armigera (Hübner)(Lepidoptera: Noctuidae). J. Insect Physiol.53, 1016–1026. doi: 10.1016/j.jinsphys.2007.05.005
69
Liu C. Wolter C. Xian W. Jeschke J. M. (2020). Most invasive species largely conserve their climatic niche. Proc. Natl. Acad. Sci.117, 23643–23651. doi: 10.1073/pnas.2004289117
70
Lorenzo P. Morais M. C. (2023). Strategies for the Management of Aggressive Invasive Plant Species. Plants12:2482. doi: 10.3390/plants12132482
71
Luo Y. Yang J. Liu L. Zhang K. (2025). MaxEnt modeling and effects of climate change on shifts in habitat suitability for Sorbus alnifolia in China. Plants14:677. doi: 10.3390/plants14050677
72
Ma J. Hu X.-N. Wu J.-J. Zhao J. Chen N. (2010). An analysis for the interception dynamic of Solenopsis invicta Buren at ports in Guangdong. J. Environ. Entomol.32, 122–124. doi: 10.3969/j.issn.1674-0858.2010.01.019
73
Ming G. Shuping N. Liang S. (2018). Analysis of global potential ecological suitable producing area for Salvia miltiorrhiza based on MaxEnt Model. China pharmacy.
74
Morales N. S. Fernández I. C. Baca-González V. (2017). Maxent’s parameter configuration and small samples: are we paying attention to recommendations?. A systematic review. PeerJ5:e3093. doi: 10.7717/peerj.3093
75
Morin X. Thuiller W. (2009). Comparing niche-and process-based models to reduce prediction uncertainty in species range shifts under climate change. Ecology90, 1301–1313. doi: 10.1890/08-0134.1
76
Muscarella R. Galante P. J. Soley-Guardia M. Boria R. A. Kass J. M. Uriarte M. et al . (2014). ENM eval: an R package for conducting spatially independent evaluations and estimating optimal model complexity for Maxent ecological niche models. Methods Ecol. Evol.5, 1198–1205. doi: 10.1111/2041-210X.12261
77
Needleman R. K. Neylan I. P. Erickson T. (2018). Potential environmental and ecological effects of global climate change on venomous terrestrial species in the wilderness. Wilderness Environ. Med.29, 226–238. doi: 10.1016/j.wem.2017.11.004
78
Occhipinti-Ambrogi A. (2007). Global change and marine communities: alien species and climate change. Mar. Pollut. Bull.55, 342–352. doi: 10.1016/j.marpolbul.2006.11.014
79
Pearman P. B. Guisan A. Broennimann O. Randin C. F. (2008). Niche dynamics in space and time. Trends Ecol. Evol.23, 149–158. doi: 10.1016/j.tree.2007.11.005
80
Peterson A. T. Pape M. Soberón J. (2017). Rethinking receiver operating characteristic analysis applications in ecological niche modeling. Ecol. Model.213, 63–72. doi: 10.1016/j.ecolmodel.2007.11.008
81
Porter S. D. (1988). Impact of temperature on colony growth and developmental rates of the ant, Solenopsis invicta. J. Insect Physiol.34, 1127–1133. doi: 10.1016/0022-1910(88)90215-6
82
Porter S. D. Tschinkel W. R. (1987). Foraging in Solenopsis invicta (Hymenoptera: Formicidae): effects of weather and season. Environ. Entomol.16, 802–808. doi: 10.1093/ee/16.3.802
83
Potter D. (1983). Effect of soil moisture on oviposition, water absorption, and survival of southern masked chafer (Coleoptera: Scarabaeidae) eggs. Environ. Entomol.12, 1223–1227. doi: 10.1093/ee/12.4.1223
84
Prentis P. J. Wilson J. R. Dormontt E. E. Richardson D. M. Lowe A. J. (2008). Adaptive evolution in invasive species. Trends Plant Sci.13, 288–294. doi: 10.1016/j.tplants.2008.03.004
85
Pyke C. R. Thomas R. Porter R. D. Hellmann J. J. Dukes J. S. Lodge D. M. et al . (2008). Current practices and future opportunities for policy on climate change and invasive species. Conserv. Biol.22, 585–592. doi: 10.1111/j.1523-1739.2008.00956.x
86
Qian W. Qin A. (2008). Precipitation division and climate shift in China from 1960 to 2000. Theor. Appl. Climatol.93, 1–17. doi: 10.1007/s00704-007-0330-4
87
Radosavljevic A. Anderson R. P. (2014). Making better Maxent models of species distributions: complexity, overfitting and evaluation. J. Biogeogr.41, 629–643. doi: 10.1111/jbi.12227
88
Regniere J. Powell J. Bentz B. Nealis V. (2012). Effects of temperature on development, survival and reproduction of insects: experimental design, data analysis and modeling. J. Insect Physiol.58, 634–647. doi: 10.1016/j.jinsphys.2012.01.010
89
Rodrigues J. F. M. Coelho M. T. P. Diniz-Filho J. A. F. (2016). Exploring intraspecific climatic niche conservatism to better understand species invasion: the case of Trachemys dorbigni (Testudines, Emydidae). Hydrobiologia779, 127–134. doi: 10.1007/s10750-016-2805-8
90
Roura-Pascual N. Brotons L. Peterson A. T. Thuiller W. (2009). Consensual predictions of potential distributional areas for invasive species: a case study of argentine ants in the Iberian Peninsula. Biol. Invasions11, 1017–1031. doi: 10.1007/s10530-008-9313-3
91
Rummel D. Neece K. Arnold M. Lee B. (1986). Overwintering survival and spring emergence of Heliothis zea (Boddie)(Lepidoptera: Noctuidae) in the Texas southern high plains. The Southwestern entomologist (USA).
92
Santamarina S. Mateo R. G. Alfaro-Saiz E. Acedo C. (2023). On the importance of invasive species niche dynamics in plant conservation management at large and local scale. Front. Ecol. Evol.10:1049142. doi: 10.3389/fevo.2022.1049142
93
Santana P. A. Jr. Kumar L. Da Silva R. S. Pereira J. L. Picanço M. C. (2019). Assessing the impact of climate change on the worldwide distribution of Dalbulus maidis (DeLong) using MaxEnt. Pest Manag. Sci.75, 2706–2715. doi: 10.1002/ps.5379
94
Schweiger O. Biesmeijer J. C. Bommarco R. Hickler T. Hulme P. E. Klotz S. et al . (2010). Multiple stressors on biotic interactions: how climate change and alien species interact to affect pollination. Biol. Rev.85, 777–795. doi: 10.1111/j.1469-185X.2010.00125.x
95
Song J. Zhang H. Li M. Lei J. (2021). Prediction of spatiotemporal invasive risk of the red import fire ant, Solenopsis invicta (Hymenoptera: Formicidae), in China. Insects12, 874–892. doi: 10.3390/insects12100874
96
Srivastava V. Liang W. Keena M. A. Roe A. D. Hamelin R. C. Griess V. C. (2020). Assessing niche shifts and conservatism by comparing the native and post-invasion niches of major Forest invasive species. Insects11:479. doi: 10.3390/insects11080479
97
Strubbe D. Broennimann O. Chiron F. Matthysen E. (2013). Niche conservatism in non-native birds in E urope: niche unfilling rather than niche expansion. Glob. Ecol. Biogeogr.22, 962–970. doi: 10.1111/geb.12050
98
Sung S. Kwon Y. S. Lee D. K. Cho Y. (2018). Predicting the potential distribution of an invasive species, Solenopsis invicta Buren (Hymenoptera: Formicidae), under climate change using species distribution models. Entomol. Res.48, 505–513. doi: 10.1111/1748-5967.12325
99
Tang X. Yuan Y. Liu X. Zhang J. (2021). Potential range expansion and niche shift of the invasive Hyphantria cunea between native and invasive countries. Ecol. Entomol.46, 910–925. doi: 10.1111/een.13028
100
Tang X. Yuan Y. Zhang J. (2020). How climate change will alter the distribution of suitable Dendrobium habitats. Front. Ecol. Evol.8:320. doi: 10.3389/fevo.2020.536339
101
Teles W. S. Silva D. D. P. Vilela B. Lima-Junior D. P. Pires-Oliveira J. C. Miranda M. S. (2022). How will the distributions of native and invasive species be affected by climate change? Insights from giant south American land snails. Diversity14:467. doi: 10.3390/d14060467
102
Teng F. Jiangxia Y. Jingwen W. (2025). Risk assessment of Solenopsis invicta invasion in Yiliang County based on machine learning. J. Southwest For. Univ.45, 183–191. doi: 10.11929/j.swfu.202402014
103
Tiffney B. H. (1985). Perspectives on the origin of the floristic similarity between eastern Asia and eastern North America. J. Arnold Arbor.66, 73–94. doi: 10.5962/bhl.part.13179
104
Tingley R. Vallinoto M. Sequeira F. Kearney M. R. (2014). Realized niche shift during a global biological invasion. Proc. Natl. Acad. Sci.111, 10233–10238. doi: 10.1073/pnas.1405766111
105
Trenberth K. E. (2011). Changes in precipitation with climate change. Clim. Res.47, 123–138. doi: 10.3354/cr00953
106
Trenberth K. E. Dai A. Van Der Schrier G. Jones P. D. Barichivich J. Briffa K. R. et al . (2014). Global warming and changes in drought. Nat. Clim. Chang.4, 17–22. doi: 10.1038/nclimate2067
107
Uden D. R. Allen C. R. Angeler D. G. Corral L. Fricke K. A. (2015). Adaptive invasive species distribution models: a framework for modeling incipient invasions. Biol. Invasions17, 2831–2850. doi: 10.1007/s10530-015-0914-3
108
Vasconcelos R. N. Cantillo-Pérez T. Franca Rocha W. J. S. Aguiar W. M. Mendes D. T. De Jesus T. B. et al . (2024). Advances and challenges in species ecological niche modeling: a mixed review. Earth5, 963–989. doi: 10.3390/earth5040050
109
Velasco J. A. González-Salazar C. (2019). Akaike information criterion should not be a “test” of geographical prediction accuracy in ecological niche modelling. Ecol. Inform.51, 25–32. doi: 10.1016/j.ecoinf.2019.02.005
110
Vogt J. T. Appel A. G. West M. S. (2000). Flight energetics and dispersal capability of the fire ant, Solenopsis invicta Buren. J. Insect Physiol.46, 697–707. doi: 10.1016/S0022-1910(99)00158-4
111
Wang R. Jiang C. Guo X. Chen D. You C. Zhang Y. et al . (2020). Potential distribution of Spodoptera frugiperda (JE Smith) in China and the major factors influencing distribution. Glob. Ecol. Conserv.21, 865–876.
112
Wang L. Lu Y. Xu Y. Zeng L. (2013). The current status of research on Solenopsis invicta Buren (Hymenoptera: Formicidae) in mainland China. Asian Myrmecol.5, 125–138. doi: 10.1016/j.gecco.2019.e00865
113
Wang J.-G. Wu J.-W. Li W.-J. (2025). Ecological niche changes and risk regionalization of the invasive plant Praxelis clematidea. Ecol. Evol.15:e71546. doi: 10.1002/ece3.71546
114
Wang Y. Xie B. Wan F. Xiao Q. (2007). Application of ROC curve analysis in evaluating the performance of alien species’ potential distribution models. Biodivers. Sci.15, 365–372. doi: 10.17520/biods.2007033
115
Wei J. Zhang H. Zhao W. Zhao Q. (2017). Niche shifts and the potential distribution of Phenacoccus solenopsis (Hemiptera: Pseudococcidae) under climate change. PLoS One12:e0180913. doi: 10.1371/journal.pone.0180913
116
Wetterer J. K. (2013). Exotic spread of Solenopsis invicta Buren (Hymenoptera: Formicidae) beyond North America. Sociobiology60, 50–55. doi: 10.13102/sociobiology.v60i1.50-55
117
Wiens J. J. Ackerly D. D. Allen A. P. Anacker B. L. Buckley L. B. Cornell H. V. et al . (2010). Niche conservatism as an emerging principle in ecology and conservation biology. Ecol. Lett.13, 1310–1324. doi: 10.1111/j.1461-0248.2010.01515.x
118
Wilson J. R. Dormontt E. E. Prentis P. J. Lowe A. J. Richardson D. M. (2009). Something in the way you move: dispersal pathways affect invasion success. Trends Ecol. Evol.24, 136–144. doi: 10.1016/j.tree.2008.10.007
119
Xu Y. Zeng L. Lu Y. Liang G. (2009). Effect of soil humidity on the survival of Solenopsis invicta Buren workers. Insect. Soc.56, 367–373. doi: 10.1007/s00040-009-0032-2
120
Yan Y. Xian X. Jiang M. Wan F. (2017). “Biological invasion and its research in China: an overview” in Biological invasions and its Management in China. Eds. WanF.JiangM.ZhanA. (Dordrecht, The Netherlands: Springer), 3–19.
121
Yi Y.-J. Cheng X. Yang Z.-F. Zhang S.-H. (2016). Maxent modeling for predicting the potential distribution of endangered medicinal plant (H. riparia Lour) in Yunnan, China. Ecol. Eng.92, 260–269. doi: 10.1016/j.ecoleng.2016.04.010
122
Zhang M.-G. Slik J. F. Ma K.-P. (2016). Using species distribution modeling to delineate the botanical richness patterns and phytogeographical regions of China. Sci. Rep.6, 1–9. doi: 10.1038/srep22400
123
Zhang H. Song J. Zhao H. Li M. Han W. (2021). Predicting the distribution of the invasive species Leptocybe invasa: combining MaxEnt and Geodetector models. Insects12:92. doi: 10.3390/insects12020092
124
Zhang K. Zhang Y. Tao J. (2019). Predicting the potential distribution of Paeonia veitchii (Paeoniaceae) in China by incorporating climate change into a Maxent model. Forests10:190. doi: 10.3390/f10020190
125
Zhao Z. Li S. Liu J. Peng J. Wang Y. (2015). The distance decay of similarity in climate variation and vegetation dynamics. Environ. Earth Sci.73, 4659–4670. doi: 10.1007/s12665-014-3751-2
126
Zhong X. Zhang L. Zhang J. He L. Sun R. (2023). Maxent modeling for predicting the potential geographical distribution of Castanopsis carlesii under various climate change scenarios in China. Forests14:1397. doi: 10.3390/f14071397
127
Zhou Y. Lei Y. Lu L. He Y. (2020). Temperature- and food-dependent foraging gene expression in foragers of the red imported fire ant Solenopsis invicta Buren (Hymenoptera: Formicidae). Physiol. Entomol.45, 1–6. doi: 10.1111/phen.12304
128
Zhu Y. (2012). Current status, influence and countermeasure of biological invasion on ecological security in China. Plant Dis. Pests3, 64–67.
Summary
Keywords
Solenopsis invicta Buren, species invasion, MaxEnt model, ecospat, habitat change, niche shift
Citation
Tang X, Deng Y, He Z, Zhou M, Yuan Y and Zeng K (2025) Modelling the potential distribution and niche shift of Solenopsis invicta Buren under climate change and invasion process. Front. For. Glob. Change 8:1659630. doi: 10.3389/ffgc.2025.1659630
Received
04 July 2025
Accepted
13 October 2025
Published
23 October 2025
Volume
8 - 2025
Edited by
Benoit Marçais, INRA Centre Nancy-Lorraine, France
Reviewed by
Yongquan Zhao, Chinese Academy of Sciences (CAS), China
Chia-Hsien Lin, National Taiwan Normal University, Taiwan
Updates
Copyright
© 2025 Tang, Deng, He, Zhou, Yuan and Zeng.
This is an open-access article distributed under the terms of the Creative Commons Attribution License (CC BY). The use, distribution or reproduction in other forums is permitted, provided the original author(s) and the copyright owner(s) are credited and that the original publication in this journal is cited, in accordance with accepted academic practice. No use, distribution or reproduction is permitted which does not comply with these terms.
*Correspondence: Yue Deng, jxgisdy@126.com
Disclaimer
All claims expressed in this article are solely those of the authors and do not necessarily represent those of their affiliated organizations, or those of the publisher, the editors and the reviewers. Any product that may be evaluated in this article or claim that may be made by its manufacturer is not guaranteed or endorsed by the publisher.