 Chunju Peng1,2,3
 Yandong Song4Qi Huang1,2,3
 Zhengwen Niu1,2,3Guanghui Zeng1,2,3
 Huajing Kang1,2,3
 Miaomiao Ying1,2,3*
- 1Key Laboratory of Crop Breeding in South Zhejiang, Wenzhou, China
- 2Wenzhou Vocational College of Science and Technology, Wenzhou, China
- 3Wenzhou Academy of Agricultural Sciences, Wenzhou, China
- 4Lishui Institute of Agriculture and Forestry Sciences, Lishui, China
Mangrove forest is a tropical or subtropical woody plant community, which plays an important role in carbon sequestration and oxygen release, improving the bay environment and biodiversity. The aboveground biomass (AGB) of mangrove forests is a key parameter to evaluate and reflect the carbon cycle capacity and productivity level of mangroves, and it is very important to accurately estimate mangrove forest AGB. In recent years, machine learning algorithms have achieved good results in forest AGB estimation, but the performance of mangrove AGB inversion in subtropical regions remains undemonstrated. Based on Sentinel-2 imagery and ground survey data, this study employed five machine learning algorithms—random forest (RF), categorical boosting (CATboost), extreme gradient boosting (XGboost), support vector machine (SVM), and local cascade ensemble (LCE)—to construct an aboveground biomass (AGB) model for artificially introduced mangrove areas along the coast of Zhejiang Province, China. The results show that texture variables contributed the most to coastal mangrove forest AGB. All models perform well in predicting mangrove forest AGB, among which had the highest accuracy with an R2 of 0.68 and RMSE of 6.85 Mg ha−1 based on XGboost model. The spatial distribution of mangrove AGB was estimated based on the optimal XGboost model. The total mangrove AGB in the region was 5930.28 Mg and the average AGB was 11.35 Mg ha−1. This study can provide a basis for the management of coastal mangrove resources and the assessment of carbon sink capacity in Zhejiang Province.
1 Introduction
Mangroves are a tropical or subtropical woody plant community composed of mangrove plants that grow in coastal intertidal zones or at river estuaries (Hao et al., 2024; Xue and Qian, 2022). Mangroves play an important role in carbon sequestration, oxygen release, protection of coastal seawalls, and improvement of bay environment and biodiversity (Hu et al., 2020; Zhu et al., 2015). Mangrove above-ground biomass (AGB) is a key parameter to assess and reflect mangrove carbon cycle capacity and productivity. Accurate estimation of mangrove AGB is helpful to better understand the ecological function and value of mangrove forests, to better manage mangrove forests, and to improve the coastal ecological environment (Chatting et al., 2020; Komiyama et al., 2008; Navarro et al., 2019; Yu et al., 2023).
The traditional manual survey method is not suitable for large-scale estimation of mangrove AGB due to its high cost, long time, low timeliness, and certain damage (Comley and McGuinness, 2005; Navarro et al., 2019). In recent years, with the development of remote sensing technology, mangrove information extraction and AGB inversion using different remote sensing methods have become the main research content (Wang et al., 2019). Remote sensing technology has large spatial scale and strong timeliness, thus greatly saving the manpower and material resources of traditional methods (Hamilton et al., 2018; Kanniah et al., 2015). At present, there is more and more research on remote sensing inversion of mangrove AGB and carbon storage mapping based on spaceborne and airborne platforms as well as optical, synthetic aperture radar, LiDAR, and other sensors (Tian et al., 2022; Wang et al., 2019). Tian et al. (2022) combined UAV LiDAR data and machine learning algorithms to estimate the AGB of the invasive mangrove species in a subtropical estuary in China, revealing that its spatial AGB distribution was characterized by higher values in the northwest and lower values in the southeast, with an average AGB of 25.57 Mg ha−1. Fu et al. (2025) successfully developed a height inversion model for mangroves in the subtropical region of Guangxi, China, using multi-source remote sensing data, and accurately estimated the AGB distribution ranges of different dominant species. AGB estimation methods based on optical remote sensing rely on variables such as image spectral characteristics, vegetation index, and texture characteristics, including the use of low and medium-resolution satellite Landsat series and sentinel series images, or the use of high-resolution satellite worldview3 and SPOT series images. However, the reflectance of mangroves obtained from remote sensing images is complicated and greatly affected by the environment. The traditional linear and nonlinear parameter regression methods are simple, but the accuracy is not high (Ali et al., 2015; Sinha et al., 2016).
In recent years, machine learning algorithms based on non-parametric models have achieved good results in a variety of scenarios, and are more effective than traditional regression models in forest biomass estimation (Martins Silva et al., 2019; Wu et al., 2019). Machine learning algorithms have no strict requirements on data distribution and the relationship between variables, and can more accurately establish complex relationships between biomass and variables (Heumann, 2011; Jachowski et al., 2013). Majnoun Hosseini et al. (2024) developed a stacked ensemble machine learning model that accurately maps cropping intensity patterns in Iran using multi-temporal Sentinel-2 and Landsat-8/9 data within Google Earth Engine, and successfully applied it for multi-year monitoring and forecasting. Using Worldview-2 images and considering species types, a study proposed a precise estimation model of mangrove AGB based on the neural network and RMSE decreased by 19.17% compared with non-species (Zhu et al., 2015). A study evaluated the inversion and prediction mapping capabilities of mangrove AGB using Sentinel-1 SAR and Sentinel-2 multispectral images based on multiple machine learning algorithms. The RMSE after the combination of different band features was 27.8–28.5 Mg ha−1 (Castillo et al., 2017). Similarly Baloloy et al. (2018) compared the ability of three optical remote sensing satellites to predict mangrove AGB. Among them, the R2 of the linear regression model constructed by Sentinel-2, Planetscope, and RapidEye was 0.89, 0.80, and 0.92. In another study, Yusandi et al. (2018) built a mangrove AGB regression model based on Landsat-8 and SPOT-5 images, and estimated the mangrove biomass at two stations in West Kalimantan, with an R2 of 77.1%. In addition, there was a study (Berninger et al., 2018) that combined Sentinel-1 and PALSAR satellite image data to estimate the above-ground biomass of mangroves in Indonesia and used a multiple linear regression model to model the three years, and the R2 was 0.69–0.77. At present, many machine learning algorithms are widely used in AGB estimation, but the selection of different characteristic variables and hyperparameter adjustment of different machine learning algorithms will affect the accuracy of biomass prediction. Moreover, further studies are needed on the inversion of biomass and spatial heterogeneity at large regional scales.
As the northernmost natural distribution zone of mangroves in China, subtropical mangroves exhibit significant differences from tropical mangroves in terms of ecological adaptability, community structure, and biomass accumulation patterns. However, current research on mangroves remains largely focused on tropical regions, and the accuracy of distribution information extraction and AGB estimation for subtropical mangroves is still relatively low, which hinders the precise assessment of their carbon sequestration capacity. To address these issues, this study utilized Sentinel-2 imagery and machine learning algorithms to estimate the AGB of subtropical mangroves along the coast of Zhejiang Province, China, and evaluated the performance of various models. The main contributions of this study are: (1) Constructing a multi-dimensional feature set integrating spectral features, vegetation indices, and texture features based on Sentinel-2 data, and systematically evaluating their effectiveness in AGB estimation; (2) Comparing the performance of multiple machine learning algorithms in AGB estimation and selecting the optimal model for subtropical mangrove AGB inversion; (3) Achieving precise extraction of mangrove distribution and high-accuracy AGB mapping along the coast of Zhejiang Province, providing a scientific basis for assessing the carbon sequestration capacity of mangroves in this region.
2 Materials
2.1 Study area
The study area (Figure 1) was located in the coastal area of Wenzhou and Taizhou, Zhejiang Province (120°26′E-121° 59′E, 27°6’N-29° 11’N), which belongs to the subtropical monsoon climate area, with the annual average temperature around 18°C and the average annual precipitation of 1750 mm. The total area of the study area was 271,606 ha, of which the land area was 140,504 ha. This area was the northern boundary of mangroves planted in China, among which mangroves were all artificial introduced species, such as Candelaria and Camelia, etc., with a total area of about 393.79 ha, among which the area of mangroves in Wenzhou was about 257.01 ha and that of mangroves in Taizhou was about 129.76 ha (Hao et al., 2024).
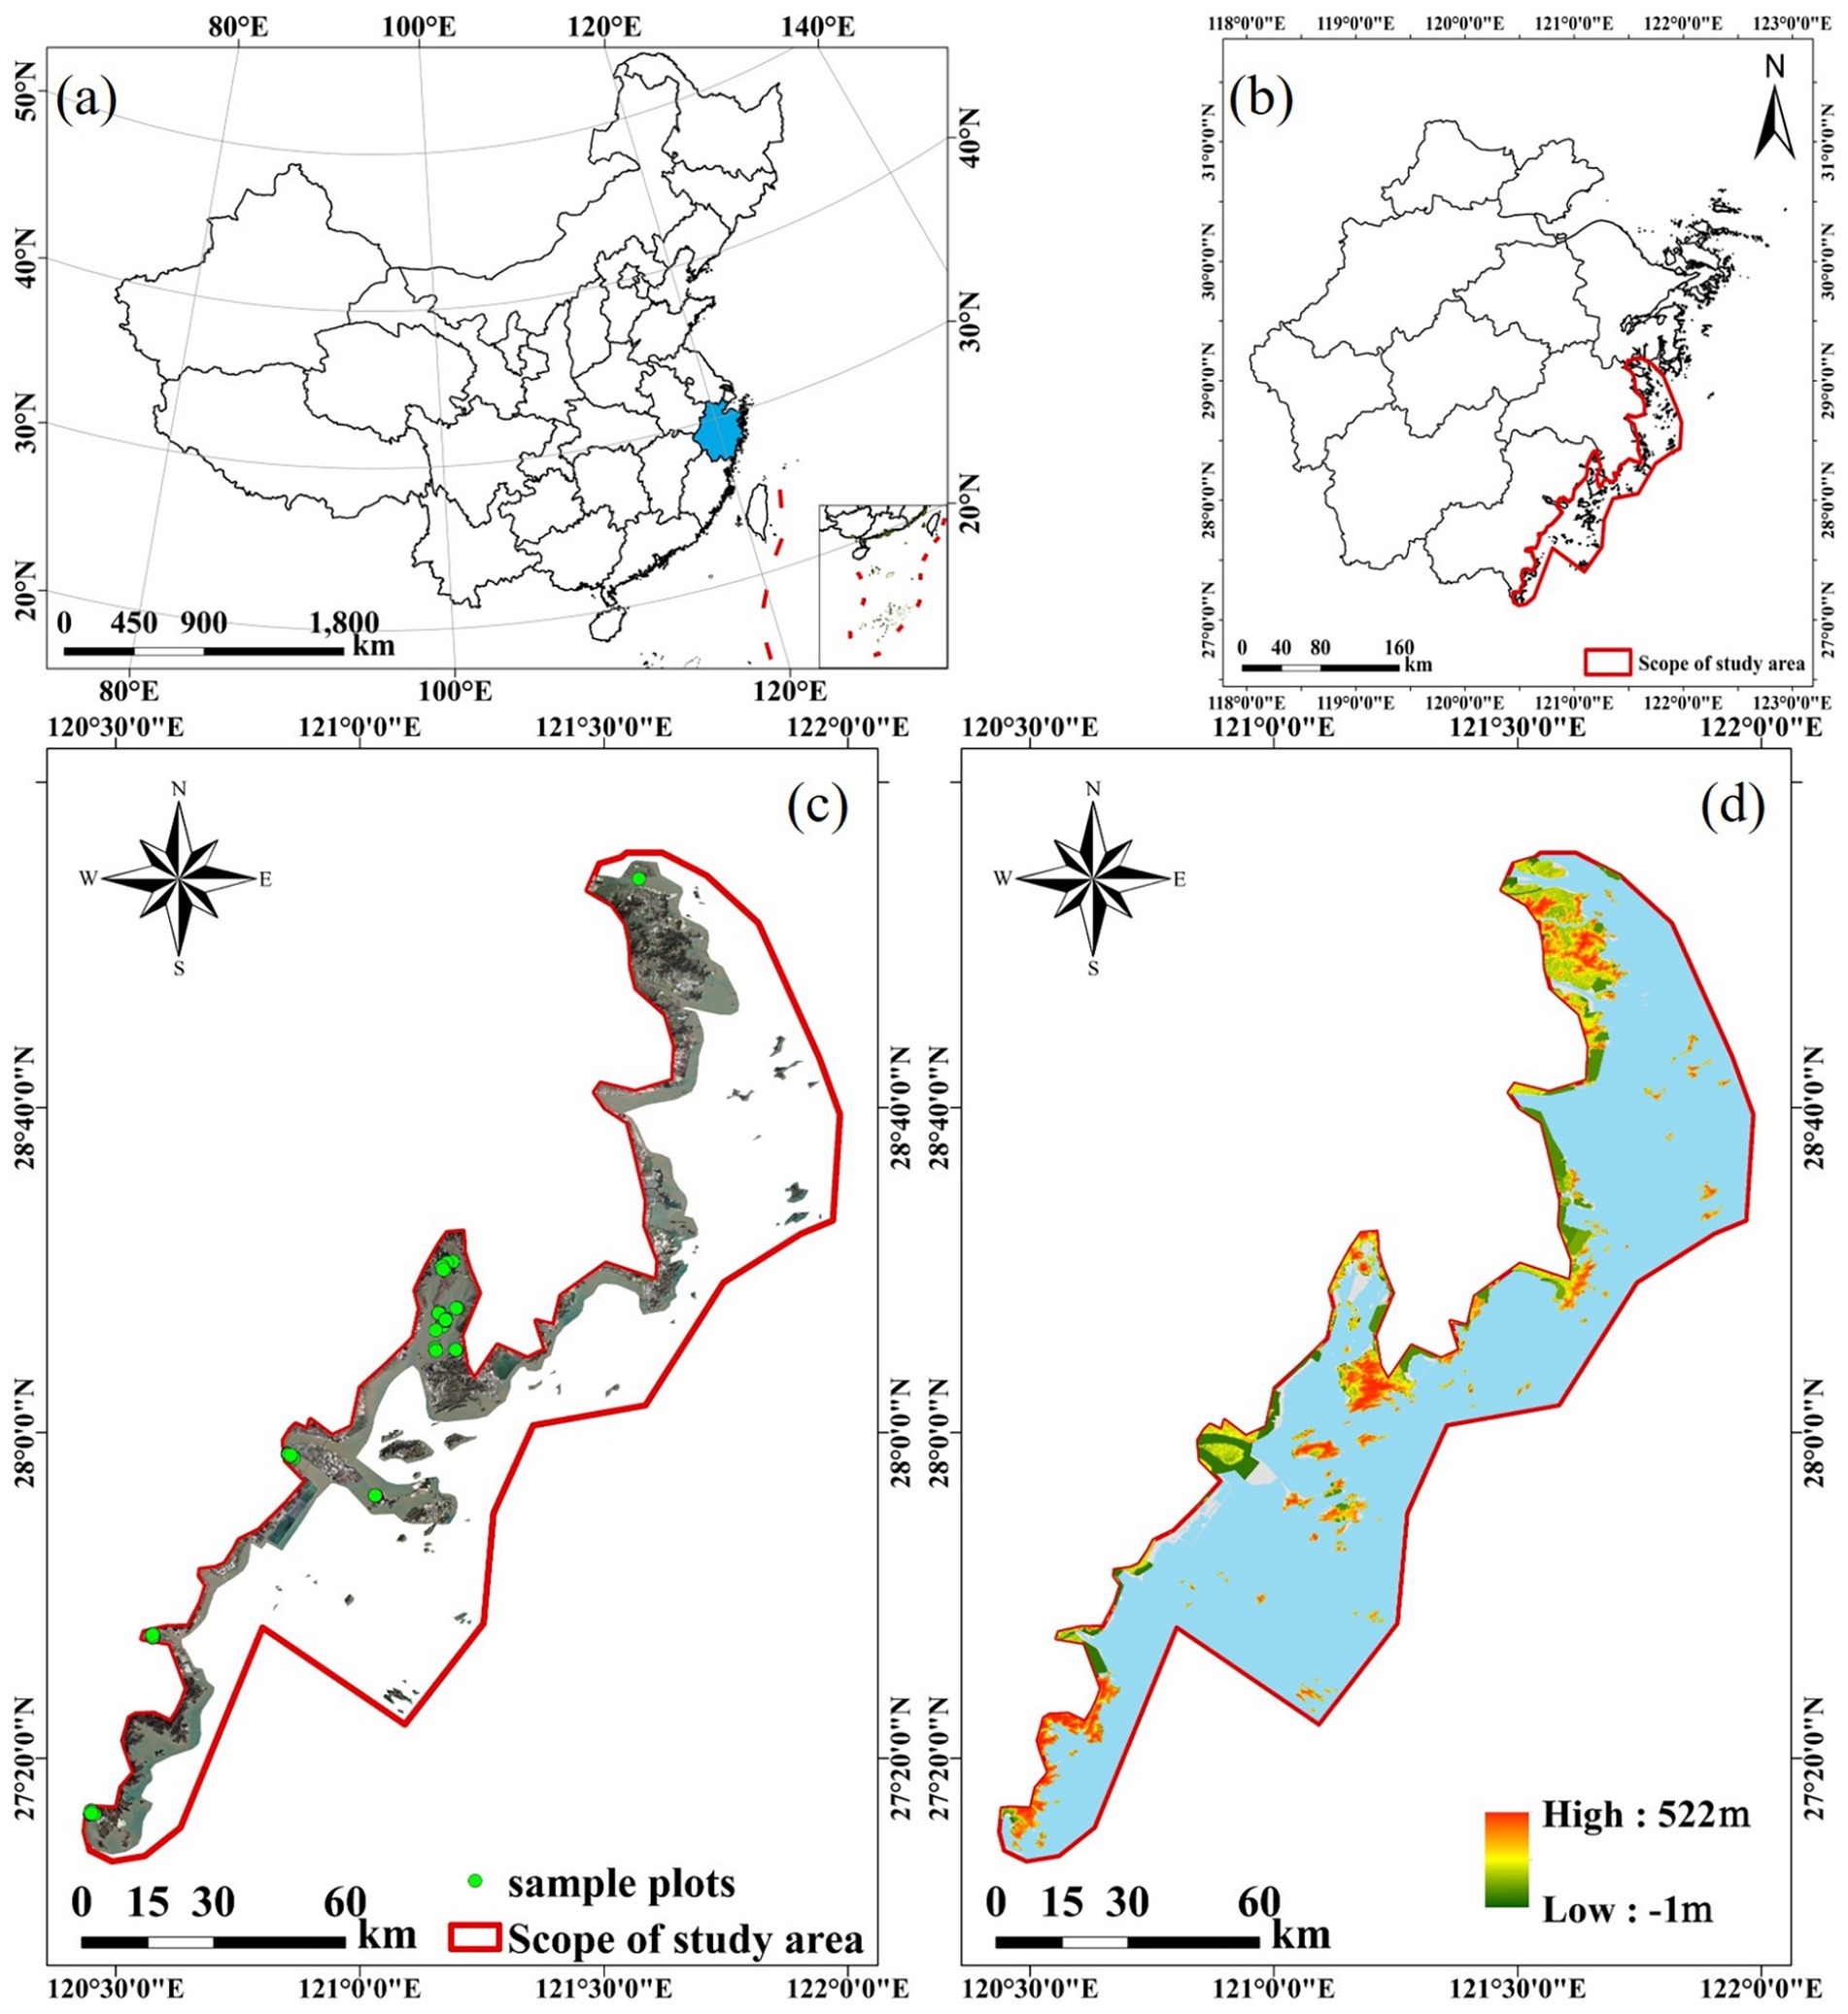
Figure 1. Overview of the study area: (a–c) location of the study area; (d) topography of the study area.
2.2 Data acquisition and preprocessing
2.2.1 Sentinel-2 image acquisition and preprocessing
The satellite data was Sentinel-2 L2A, which has been corrected by atmospheric and geometric correction. Sentinel-2 L2A had 12 bands (Table 1) and the data download address was Copernicus open center (Pandit et al., 2018).1 The image was taken on August 11, 2023 with <10% cloud cover. This study used the SNAP software provided by ESA to resample the data. The spatial resolution of each band was resampled to 10 m by the nearest neighbor method, and multiple images were clipped to obtain the image of the study area.
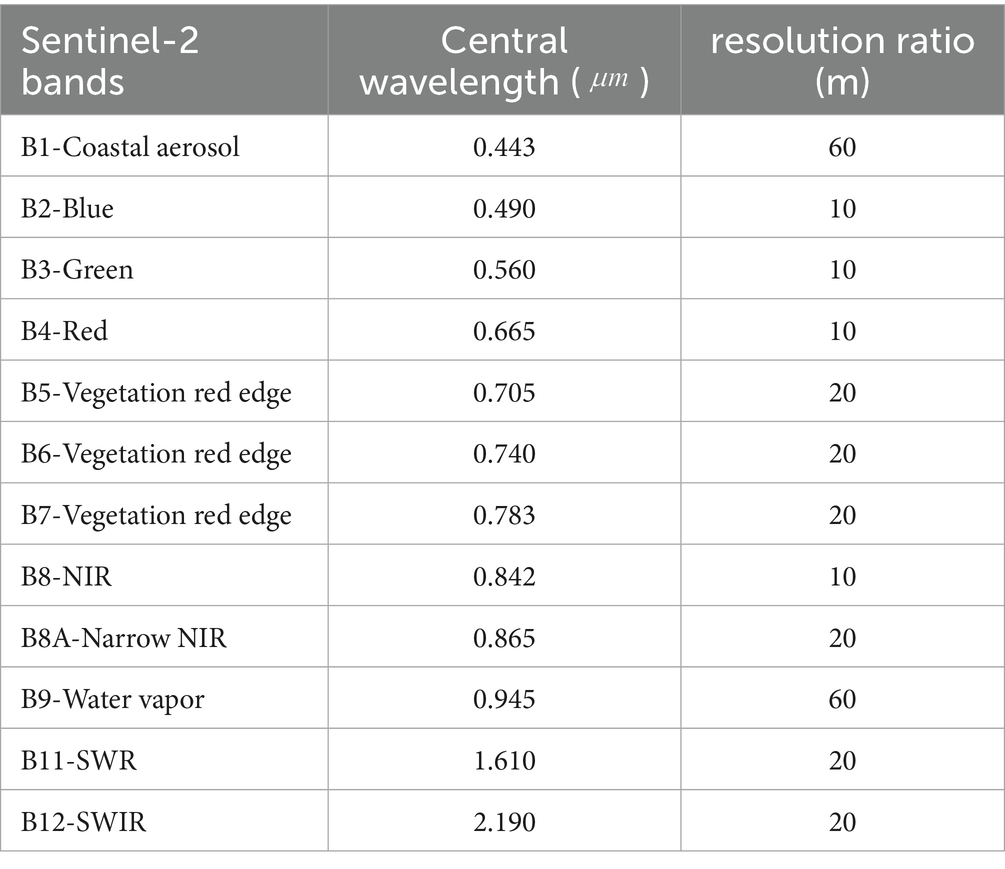
Table 1. Sentinel-2 image spectral characteristic factor and description.
2.2.2 Ground survey data
This study conducted a ground survey of mangrove forests in the study area on September 2023 and collected a total of 340 sample plots. The specific distribution of mangrove sample plots is shown in Figure 1. In this study, the sample plots were set to be square, all 10 m × 10 m in size, and the longitude and latitude coordinates of the sampled corner points were obtained through the global positioning system (GPS) for matching with remote sensing image elements. In this study, the diameter at breast height (DBH) and height of each tree were measured in each plot, and the AGB of each tree was calculated according to the allometric growth equation and the AGB of each plot was summarized. The allometric growth equation is as follows Equation 1. In addition, the specific information on the AGB of the investigated sample is shown in Table 2.
where AGB represents aboveground biomass of mangrove forests (unit: g); P is crown diameter (unit: cm); H represents height of tree (unit: cm).
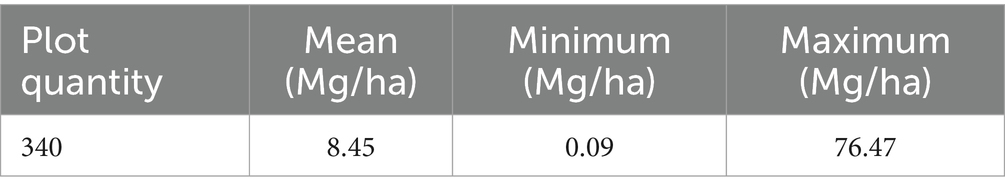
Table 2. AGB information of mangrove plots.
3 Methods
3.1 Feature extraction and selection of feature variable
3.1.1 Feature variable extraction
This study used Sentinel-2 to calculate 4 different vegetation indices, including ratio vegetation index (RVI), difference vegetation index (DVI), normalized difference vegetation index (NDVI), and enhanced vegetation index (EVI). In addition, eight texture features based on grey level co-occurrence matrix (GLCM) (Wang et al., 2021) were used in this study, and this study set three different Windows of 3*3, 5*5, and 7*7. The specific information is shown in Table 3.

Table 3. Characteristic factors and description.
3.1.2 Variable selection
This study used the random forest importance ranking (RFIR) to select the feature variables. Feature importance was evaluated by observing the effect of each feature on splitting nodes in the decision tree, and this study measured the importance of different variables by predicting the percent increase in mean square error (%IncMSE) (Han et al., 2023). %IncMSE assigns a random value to the predictor, and the corresponding prediction model error increases, indicating that the factor is of great importance (Strobl et al., 2007). To overcome the variability in results caused by random sampling in a single run, this study conducted feature selection by setting different random seeds and calculating the average importance across multiple runs. Referencing the training iterations used in related research, this study set the number of training iterations to 100. This repeated iterative strategy significantly reduces evaluation bias due to sample and feature randomness, ensuring the statistically robust selection of highly important variables.
3.2 Methods for estimating AGB
3.2.1 Random forest model
Random forest (RF) algorithm (Breiman, 2001) is an ensemble algorithm based on decision trees. RF builds a forest of unrelated classification and regression trees randomly, and finally trains and predicts the samples (Rodriguez-Galiano et al., 2012). The RF takes all the generated decision trees together as the estimator. When estimating AGB, it first estimates each decision tree, and finally averages the results to obtain the final estimated value (Nandy et al., 2021). Each decision tree in the RF is generated only for part of the training samples or part of the feature variables, which reduces the variance of the whole RF and alleviates overfitting (Otukei and Blaschke, 2010). In this paper, we used the Python library scikit-learn v1.0.2 to build the RF model.
3.2.2 CATboost
CATegorical Boosting (CATboost) (Prokhorenkova et al., 2018) is an ensemble learning model. It is one of the mainstream models of gradient-boosting decision trees (GBDT). CatBoost can significantly improve the processing of category data by using the average value of category labels as the node splitting standard when processing category-type features, and increase the number of minority class samples through sampling technology (Zhong et al., 2023). With strong robustness, generalization ability, robustness, and flexibility, CATboost can efficiently and reasonably handle category-type variables, solve the problem of prediction deviation in gradient lifting, and improve the generalization performance of the model through ranking promotion and symmetric tree structure (Huang et al., 2019). This study used the Python package CATboost v1.2.5 to build the setup CATboost model.
3.2.3 XGboost
Extreme Gradient Boosting (XGBoost) (Chen and Guestrin, 2016) is an efficient regression method for gradient boosting. XGBoost is trained in two stages by addition: it first fits the entire input data, then adjusts the residuals, and iterates until the stop criteria are met. XGBoost optimizes the loss function using second-order derivatives and reduces overfitting by taking the model complexity as a regularization term. The algorithm supports parallel computation and can avoid overfitting and underfitting. XGBoost makes the training and prediction stages more efficient through optimization and has the advantages of flexibility and strong interpretability, but there are problems with sensitivity to parameters and high requirements for data preprocessing (Samat et al., 2020). This study used Python XGboost v1.5.0 to build XGBoost.
3.2.4 SVM
Support vector machines (SVM) (Cortes and Vapnik, 1995) are a classical machine learning algorithm whose basic goal is to construct a hyperplane in a high-dimensional feature space so that the distance between the plane and the sample point farthest from it is minimal. To improve the generalization ability of the model, SVM introduces soft intervals when optimizing the loss function to deal with linearly indivisibility data (Vafaei et al., 2018). SVM uses the kernel trick to map input features to a high-dimensional space, thereby extending the hyperplane into a hypersurface (Liu et al., 2017). Although SVR can effectively mine potential rules in remote sensing features and is robust to outliers, it still has overfitting problems, and the current SVM algorithms used for biomass estimation usually need to select kernel functions through experience, which limits its generalization ability (Wang et al., 2016). This study used the Python package scikit-learn v1.0.2 to construct SVM.
3.2.5 LCE model
The local cascade ensemble (LCE) (Fauvel et al., 2019) is a machine-learning algorithm that combines RF and XGBoost. LCE optimizes bias by combining bagging and boosting methods to improve the predictive performance of machine learning models (Khattak et al., 2024). In addition, LCE personalizes the training data by generating multiple base learners and adding their predictions as new attributes to the data set and applies a divide-and-conquer strategy to capture global relationships. LCE allocates missing samples to decision nodes with fewer errors through block propagation, and the processing of missing data is similar to that of XGBoost, reducing overfitting problems caused by the raised tree (Jiao et al., 2022). This study used the Python package Lcensemble v0.3.0 to build the LCE model.
3.3 Hyperparameter optimization
Hyperparameters in machine learning are options that are set outside of model training and are not optimized or changed during training. The selection of different hyperparameters has a great influence on the performance and accuracy of the model, so it is necessary to select the optimal hyperparameters for training. In this study, multiple hyperparameters need to be adjusted for different machine-learning algorithms. The detailed information is shown in Table 4. To obtain the optimal hyperparameters, this study used the 5-fold cross-validation method (Hajihosseinlou et al., 2023) to randomly divide the training set into five subsets of the same size. The data of four subsets were used for training the model, and the remaining subsets were used for testing the model. Then the five possible choices were repeated, and the hyperparameters with the highest average accuracy on the five verification sets were obtained by the grid search method.

Table 4. Hyperparameter configuration of algorithms.
The max_depth within the hyperparameters serves as a critical parameter for controlling model complexity. Excessively shallow depth can easily lead to underfitting, failing to capture underlying patterns in the data, while excessive depth significantly increases the risk of overfitting and computational overhead. Therefore, this study defined a range of max_depth covering both commonly used shallow and medium-depth trees. In addition, the n_estimators also influences model fitting performance: too few trees may weaken the ensemble effect, whereas too many result in diminishing marginal returns and a sharp increase in computational cost. Accordingly, a range of 20–200 was selected, encompassing typical intervals from basic to large-scale ensembles, with a step size designed to facilitate efficient identification of the optimal value through grid search. For the SVM kernel function selection, multiple commonly used kernel types were employed to better capture both nonlinear and linear relationships. The selection of other parameters was based on relevant domestic and international studies to enhance the rationality and scientific rigor of parameter configuration (Huang et al., 2024; Li et al., 2023; Prakash et al., 2022).
3.4 Evaluation indicators
The evaluation indicators of AGB estimation accuracy used in this study were root mean square error (RMSE) and R2. RMSE is a standard deviation that measures the difference between the predicted value and the true value and is commonly used to evaluate the predictive performance of regression models. R2 is a common regression analysis metric used to evaluate a model’s ability to explain data variation, and its value ranges from 0 to 1, with a closer to 1 indicating the model’s better fit to the data. The calculation formulas are as follow in Equations (2) and (3):
where for the first 𝑖 sample AGB per unit area of predicted value, for the first 𝑖 sample AGB per unit area of the measured values, to sample all the average of the measured values, 𝑛 for the total sample area. In addition to accuracy evaluation metrics, this study also assessed the computational efficiency of various machine learning models, focusing on training time, training set prediction time, test set prediction time, and total computational time. This analysis provides a clearer reflection of the computational cost associated with the models’ learning of data patterns.
4 Results
4.1 Extraction of mangrove forest distribution information
In this study, sample labeling for classification was conducted using relevant high-resolution imagery, visual interpretation, and field survey samples. A total of 7,451 samples were selected. With reference to the ratio commonly adopted in related classification studies, the samples were divided into training and testing sets at a ratio of 3:1. The specific number of samples for each feature category is presented in the Table 5. This study used the maximum likelihood method (Atkinson and Lewis, 2000) to obtain the classification results of six land types in the region, and the distribution information of mangrove forests. The area of the mangrove forest was 522.31 ha, as shown in Figure 2. This study selected 1,545 ground feature test samples to evaluate the accuracy of classification results and to obtain the recall rate and precision rate of each land use type. This study calculated the overall accuracy and Kappa coefficient, as shown in Table 6. The overall accuracy was 92.39% and the Kappa coefficient was 0.9087, indicating a high accuracy. At the same time, the recall rate of mangroves was 94.82% and the precision rate was 86.43%. As can be seen from the distribution map of mangrove extraction, mangroves were mainly distributed in the estuary area of several rivers and near islands, such as Ou River, Ao River, and Dongtou Islands, and are also distributed in the coastal areas of Yueqing Bay, Sanmen Bay, Yanpu Bay.
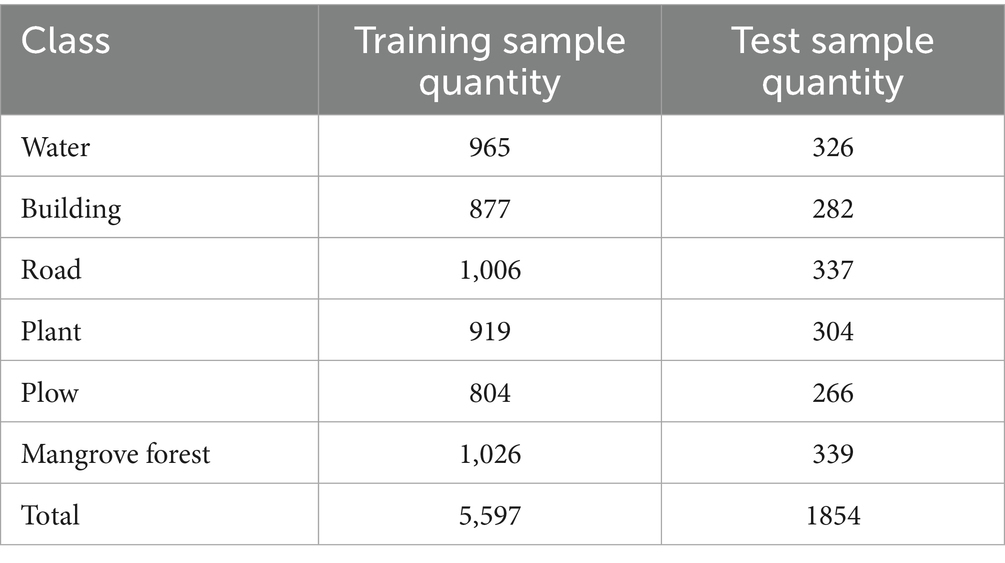
Table 5. Comparison of classification sample quantities.
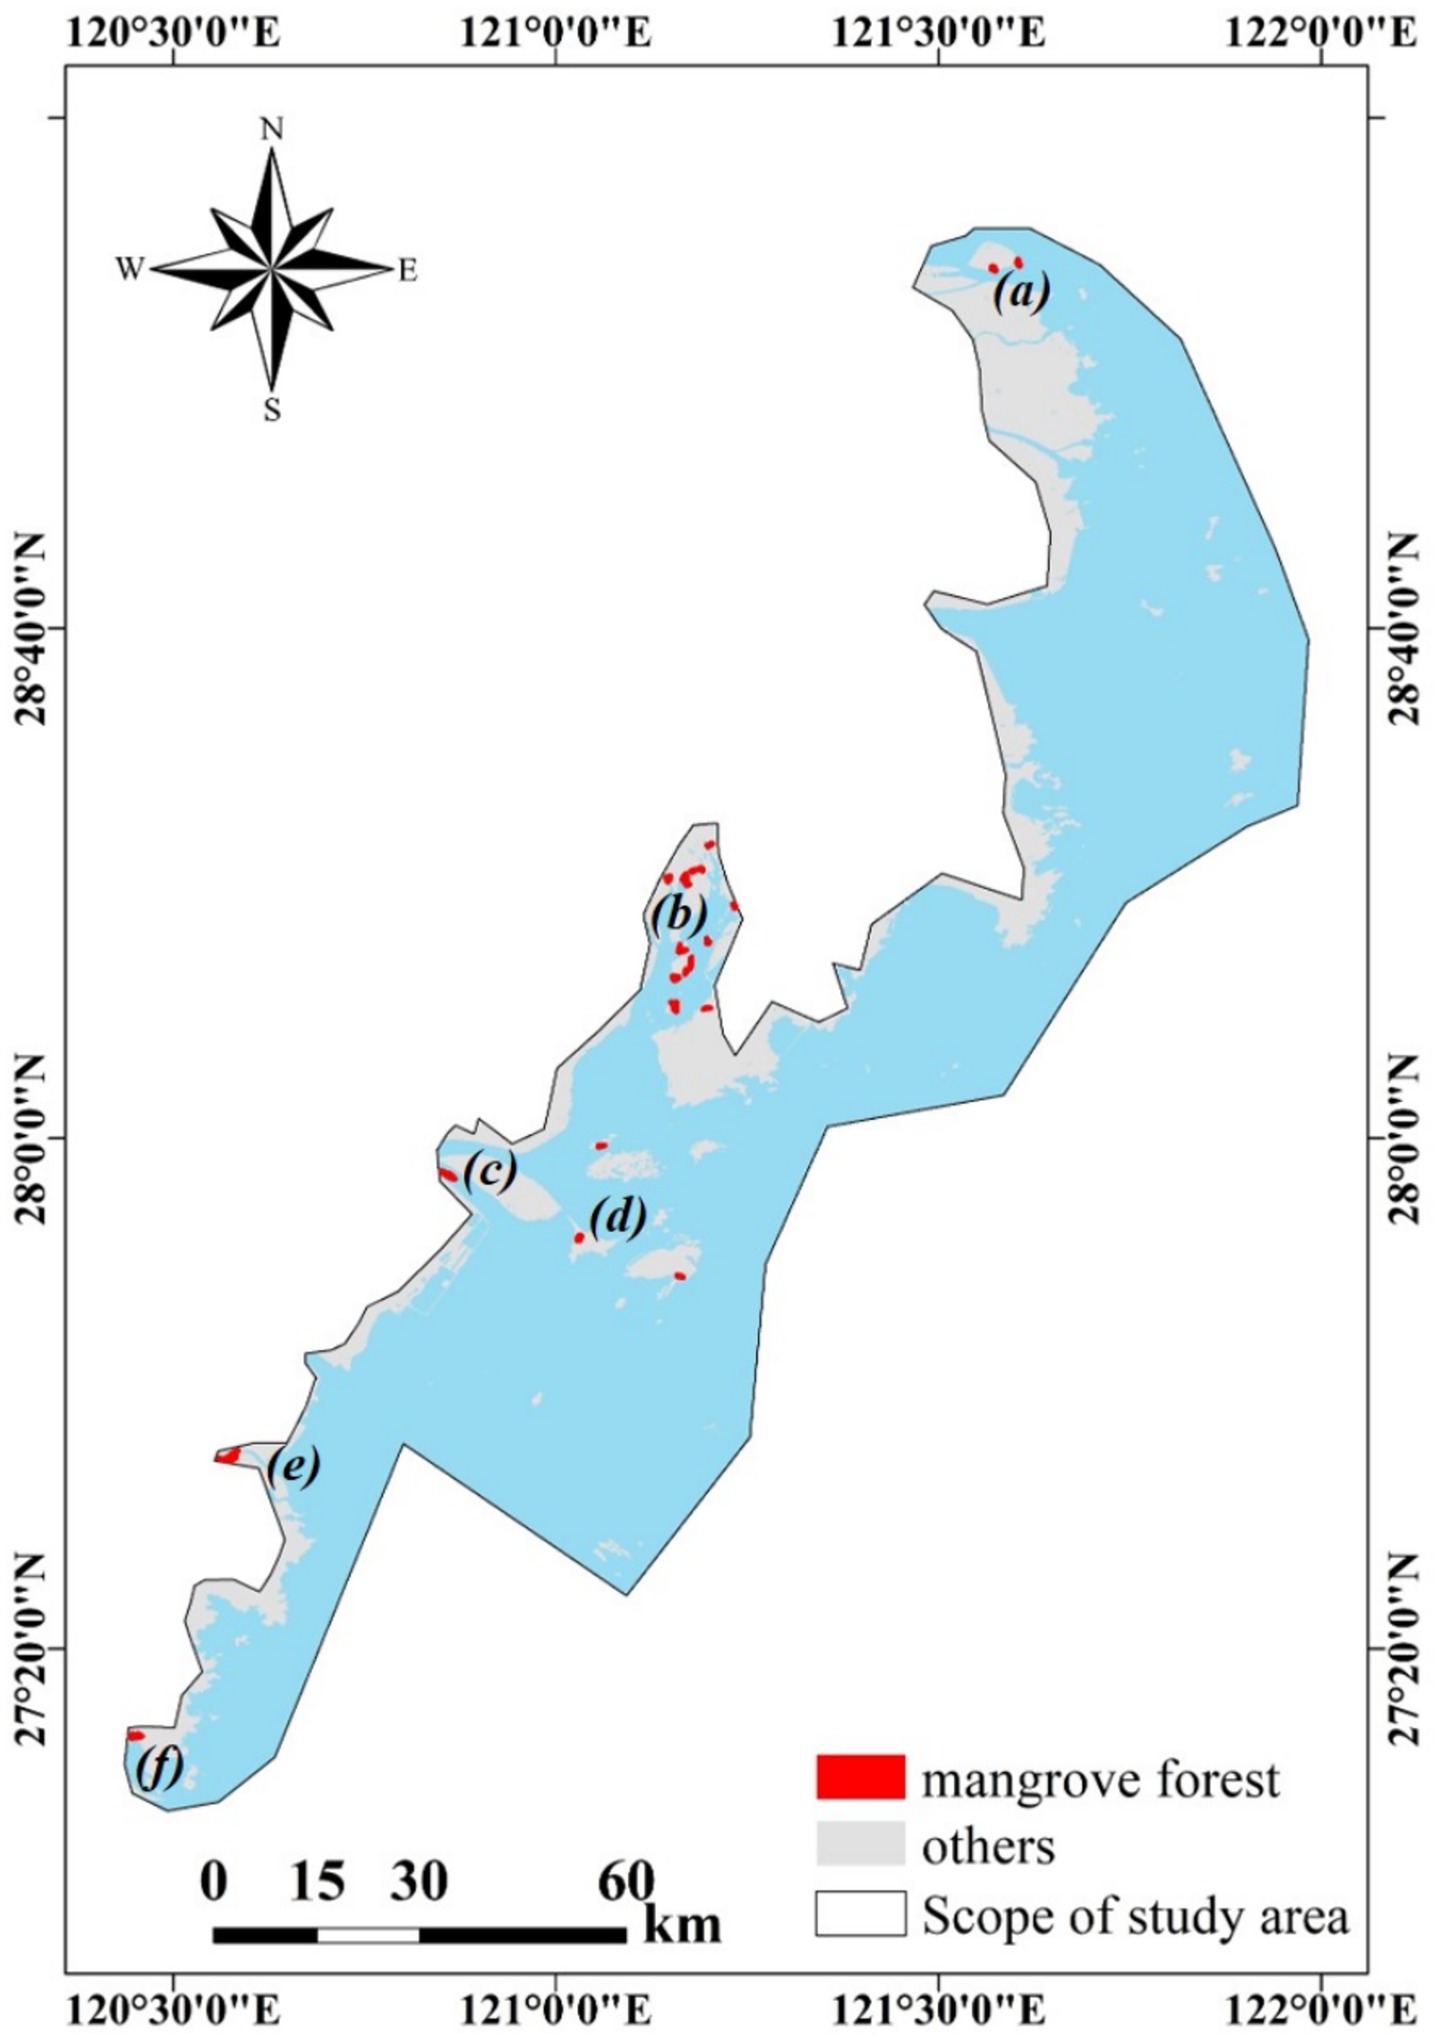
Figure 2. Mangrove information extraction results; (a) Sanmen Bay area; (b) Yueqing Bay area; (c) Estuary of the Ou River; (d) The Dongtou Islands; (e) The estuary of the Ao River; (f) Yanpu Bay.
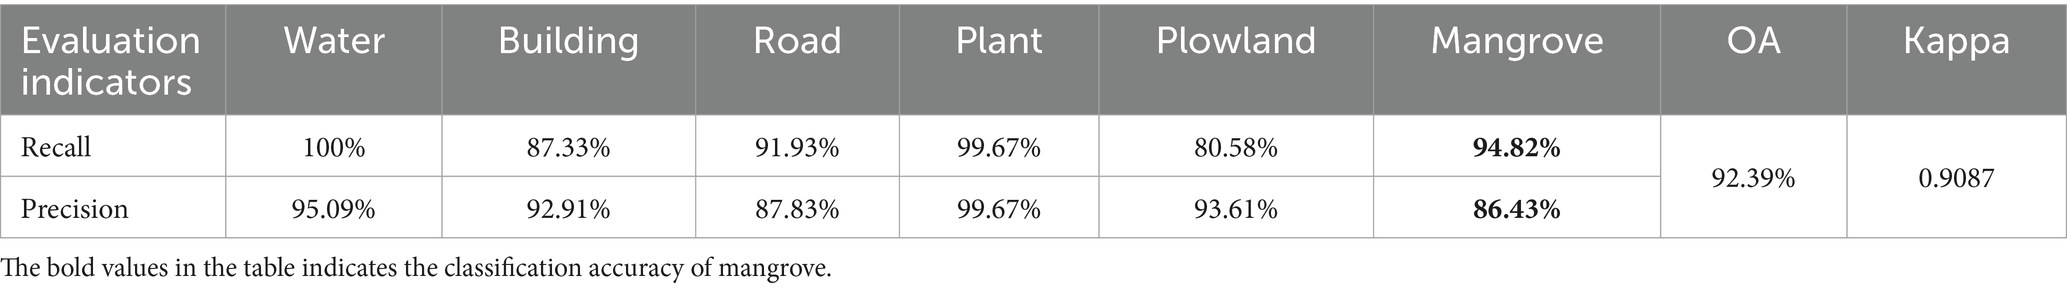
Table 6. Precision results of regional land use classification.
4.2 The feature variable selection
This study selected the importance of 304 variables consisting of spectral features, vegetation index, and texture features by RFIR. Figure 3 shows the %IncMSE of the first 30 variables after 100 runs using the RFIR. The texture variable was abbreviated as the base spectral band feature name window size. It can be seen from the figure that the correlation between texture characteristics and AGB was strong, followed by spectral characteristics.
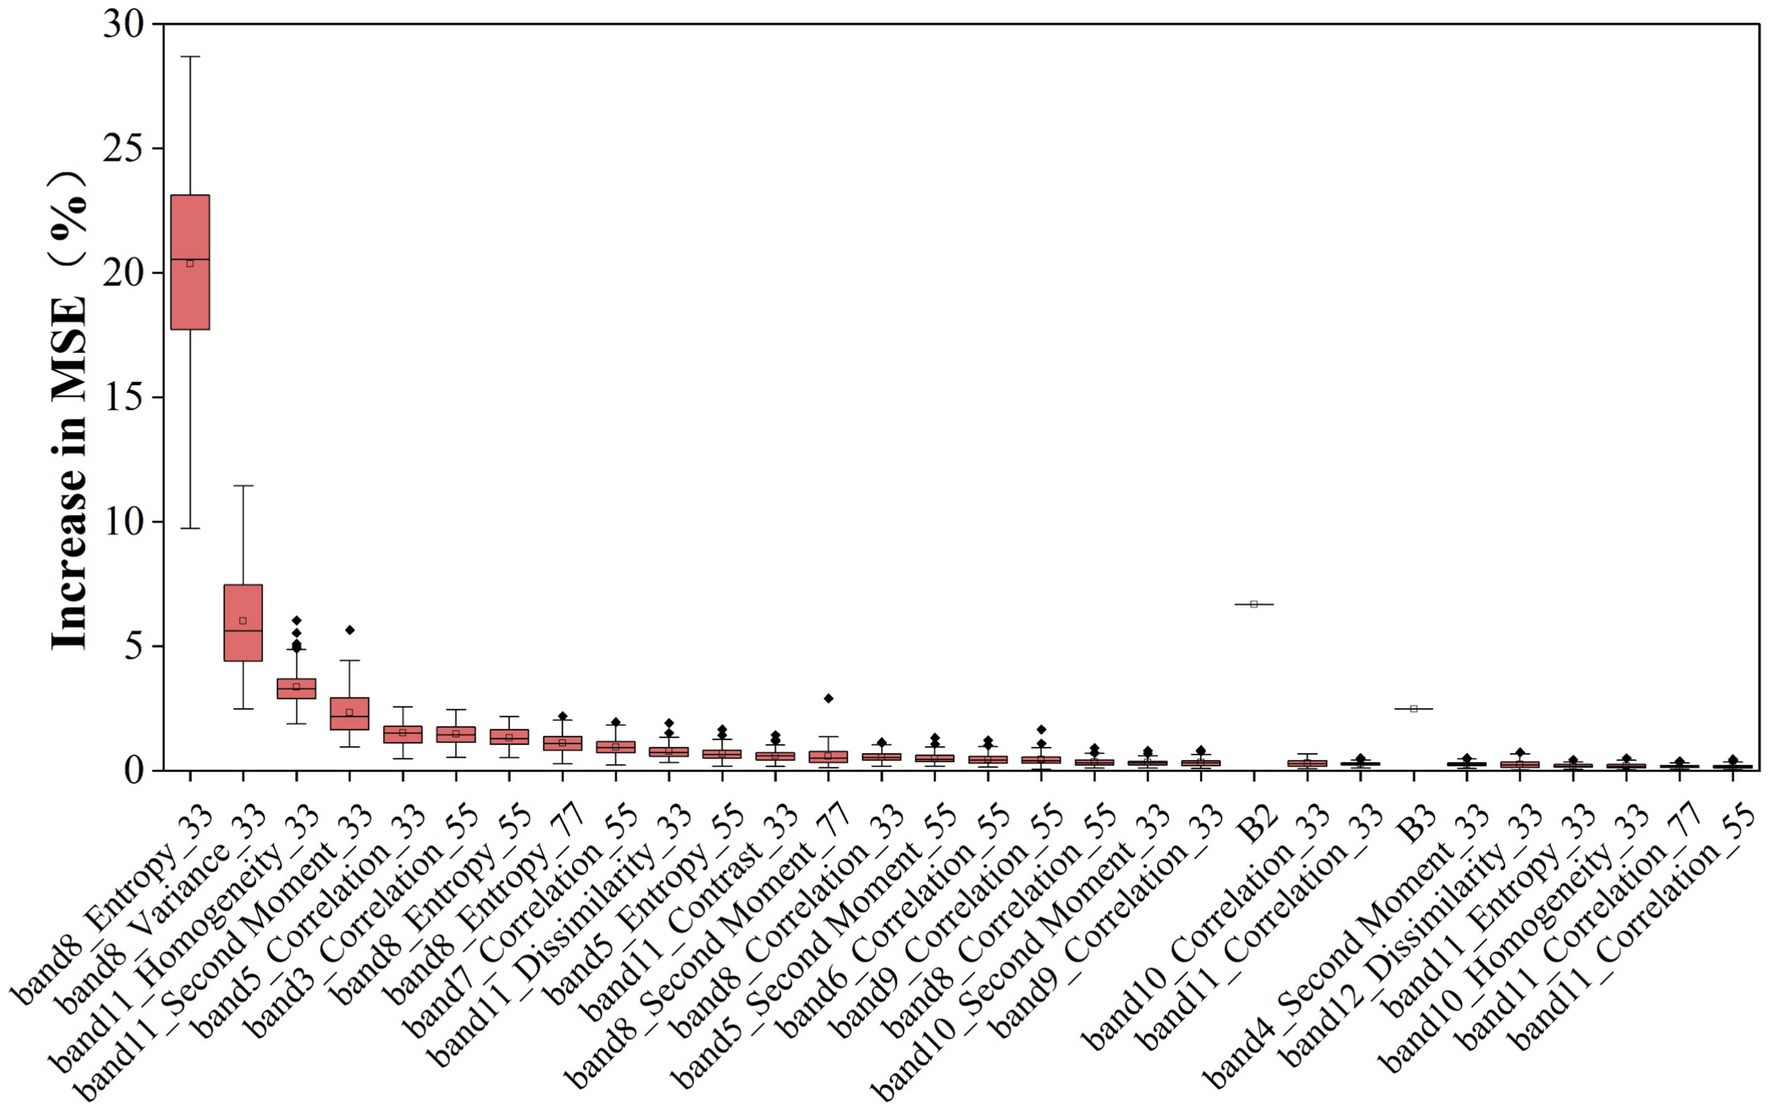
Figure 3. The first 30 variables sorted by importance score after RF feature screening (by %IncMSE).
4.3 Hyperparameter optimization results
According to the machine learning hyperparameter configurations, the parameters of the machine learning algorithms were optimized by using a 5-fold cross-validation method and grid search hyperparameter setting. This study used the minimum root-mean-square value as the scoring standard. The optimal hyperparameters of the five algorithms are shown in Table 7.

Table 7. The optimal value of each algorithm hyperparameter.
4.4 Model accuracy result
This study used the optimal hyperparameters to predict. From the AGB prediction accuracy of the training set and test set of the five algorithms, it can be seen that XGboost after hyperparameter optimization had the best performance on the training set, R2 was 0.998, RMSE was 0.634 Mg ha−1, and RMSE of the RF was 4.736 Mg ha−1. At the same time, the accuracy of LCE was not higher than XGboost, RMSE was 3.928 Mg ha−1. The R2 of the five algorithms on the training set was >90%, indicating that the model had a good fitting effect between the remote sensing characteristics and the AGB. XGboost worked best on the test set, with R2 of 0.682 and RMSE of 6.851 Mg ha−1. In addition, the accuracy of CATboost was also better, with R2 of 0.697 and RMSE of 6.92 Mg ha−1. On the test set, the effect of RF and SVM was poor, while the R2 of the other three integrated algorithms was >0.65. Therefore, XGboost, which was effective in the training set and test set, was selected for the inversion of regional mangrove AGB in this study (Figures 4, 5).
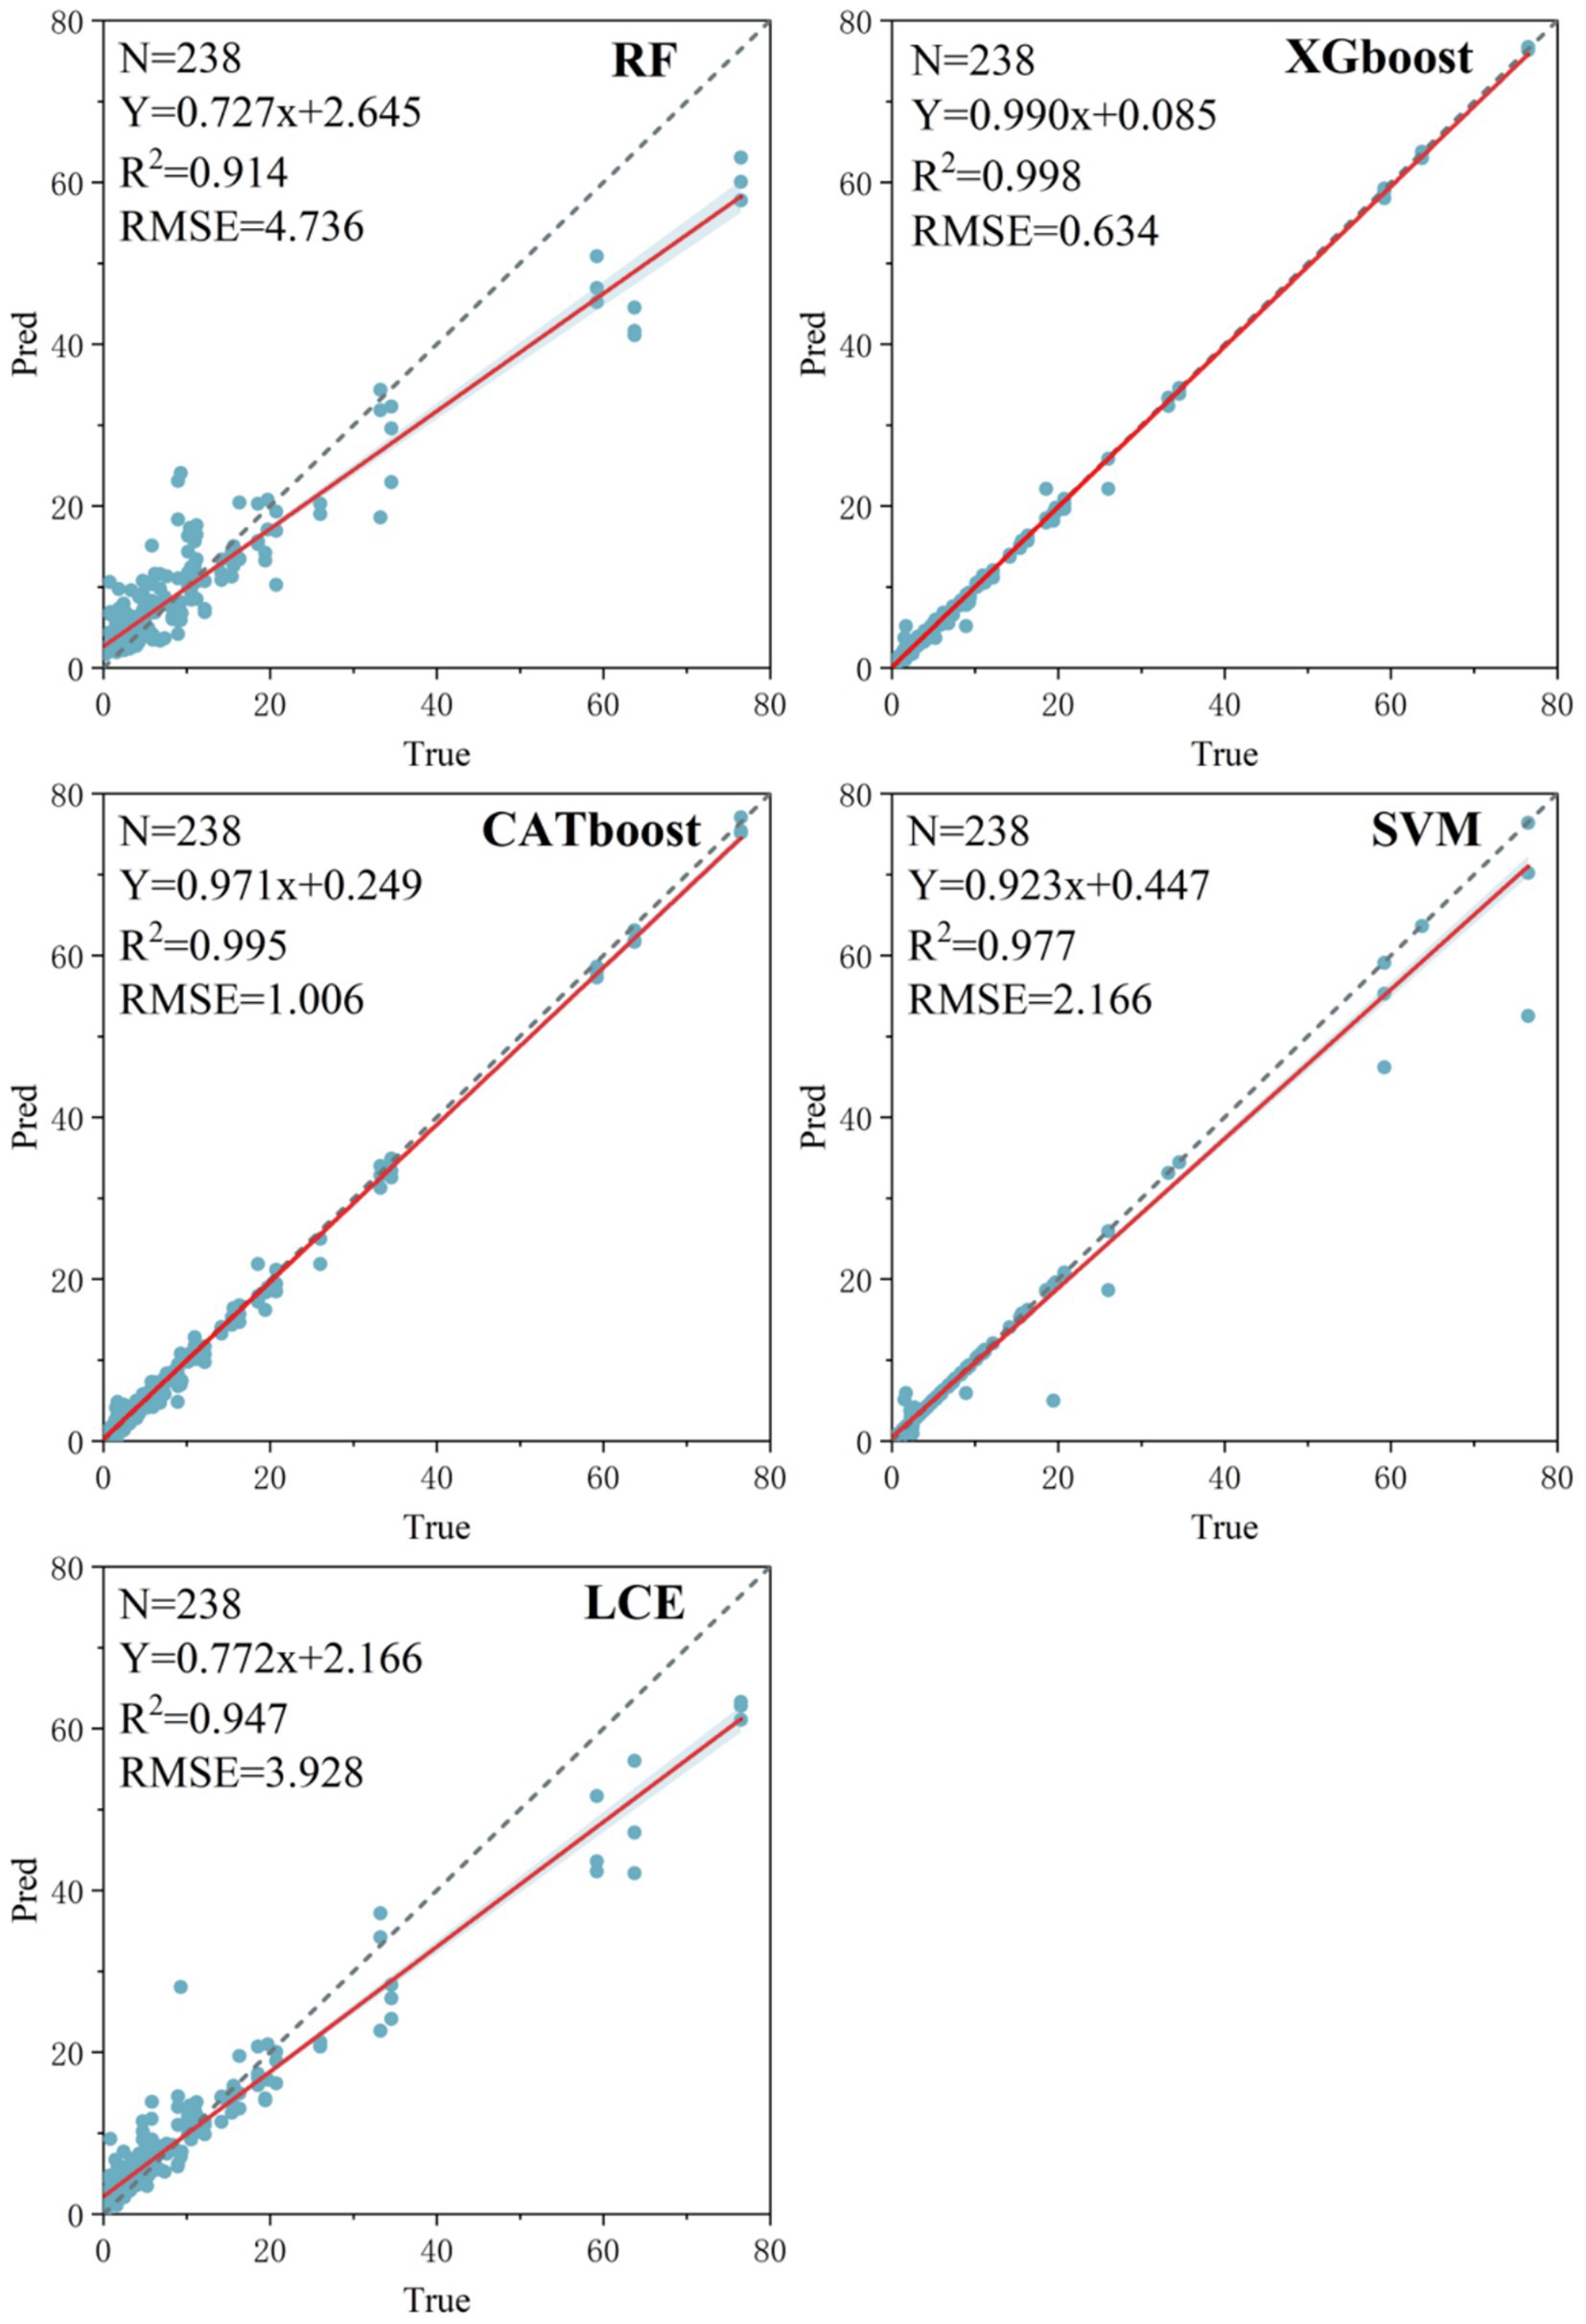
Figure 4. Precision comparison of five algorithms on the training set.
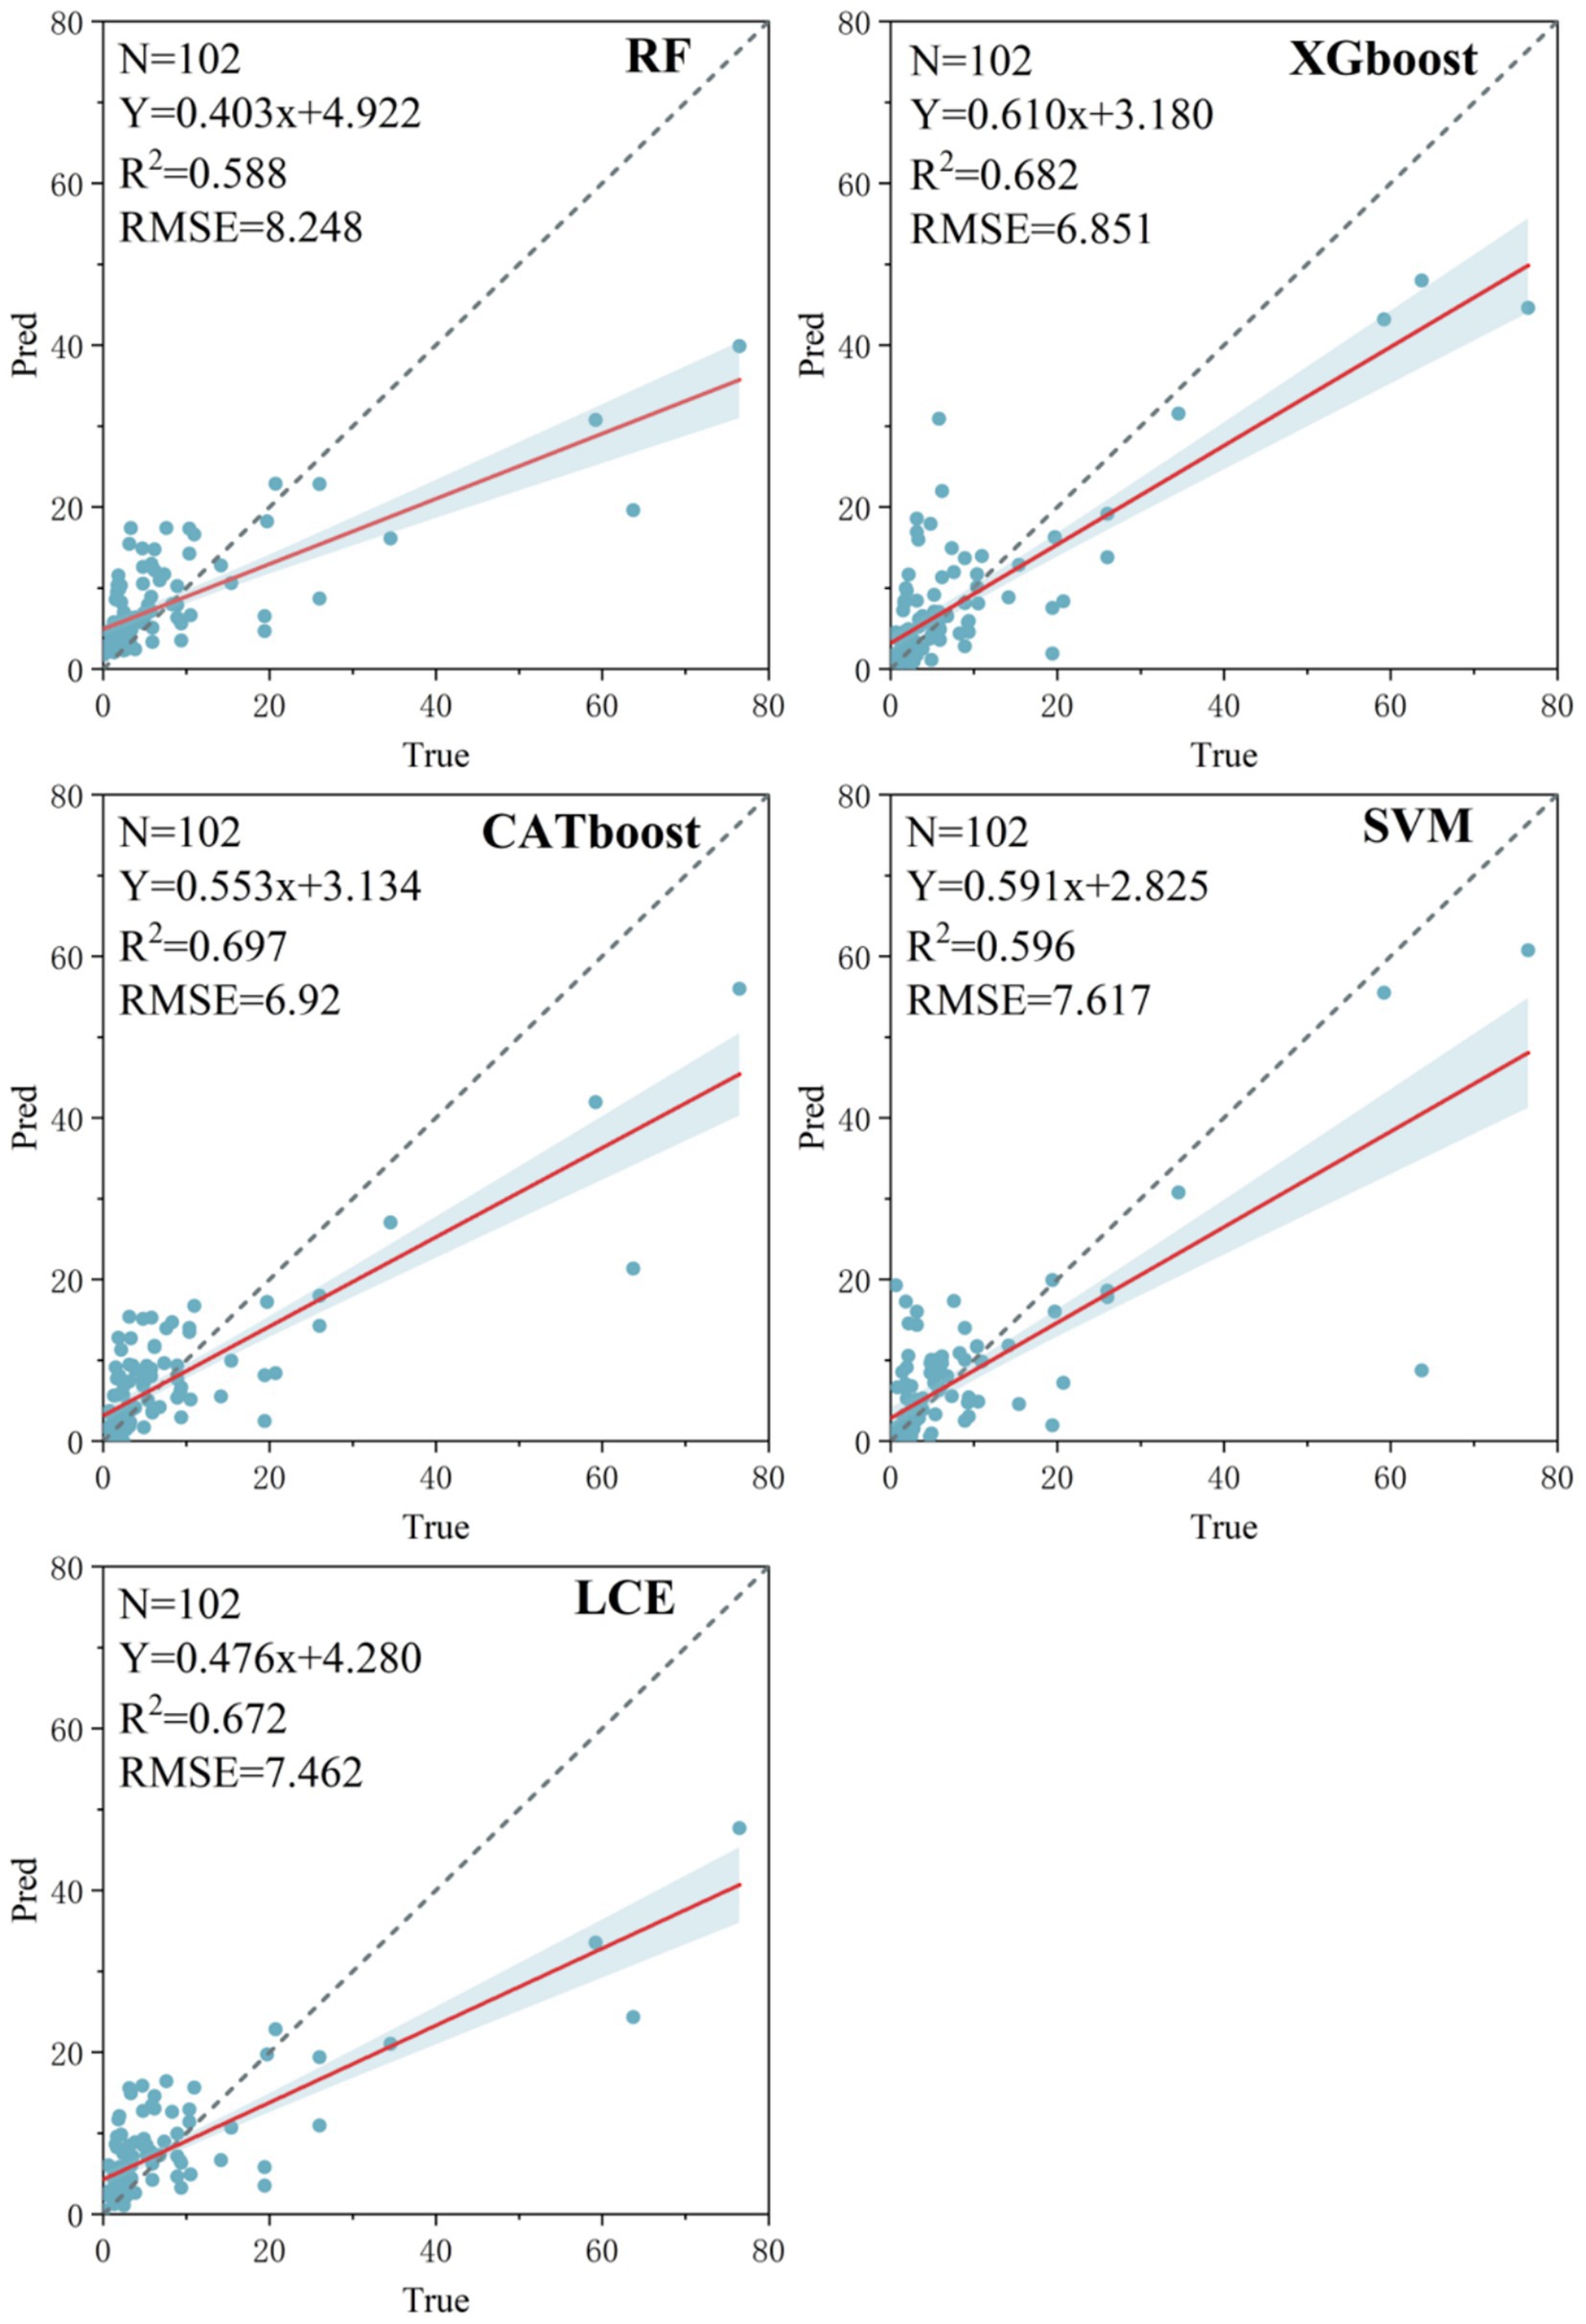
Figure 5. Precision comparison of five algorithms on the test set.
Furthermore, this study compared the computation times of different models on both the training and test sets, as shown in the Table 8. The results indicate that the LCE model incurred the highest computational cost, particularly requiring the longest training time—approximately 300 times longer than other models. It was also the slowest in both training set prediction and test set prediction, indicating higher model complexity and lower computational efficiency compared to the other models. Among the five models, SVM was the fastest, taking only 0.01 s, while the other three models also completed within 1 s, demonstrating high computational efficiency. With the exception of the LCE model, the other four models achieved both training and testing times within 1 s, indicating strong real-time performance.
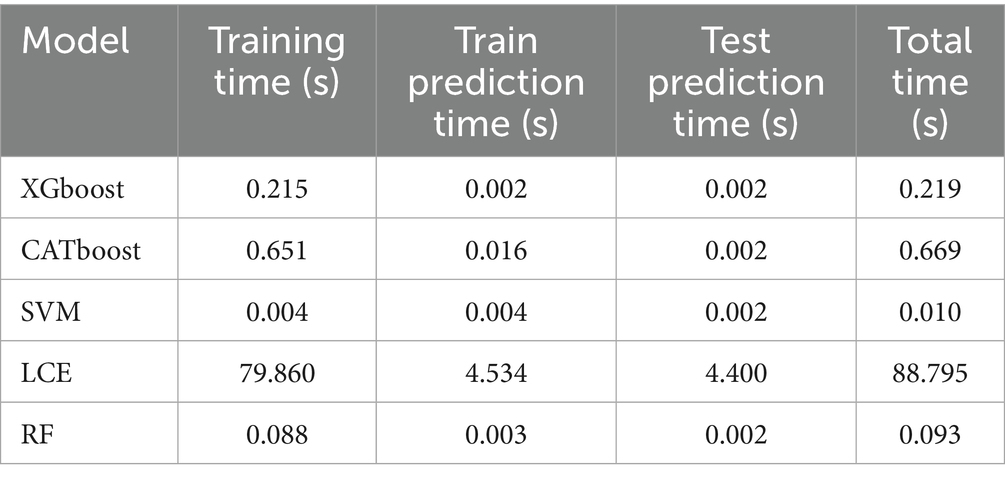
Table 8. Comparison of model calculation time.
4.5 Spatial distribution of coastal mangrove forest AGB
The following figure shows the results of remote sensing estimation of mangrove AGB in coastal Zhejiang Province based on the XGboost. In addition, this study extracted the inversion information of regional mangrove AGB. The average AGB was 11.35 Mg ha−1, and the total AGB was 5930.28 Mg. From the perspective of spatial distribution, the mangrove AGB per unit area the Dongtou Islands is higher, with an average of more than 16.82 Mg ha−1, followed by the mangrove AGB along the coast of the estuary of Ao River and Sanmen Bay, while the AGB of the Ou River estuary in the middle is lower, with an average of <10 Mg ha−1 (Figure 6).
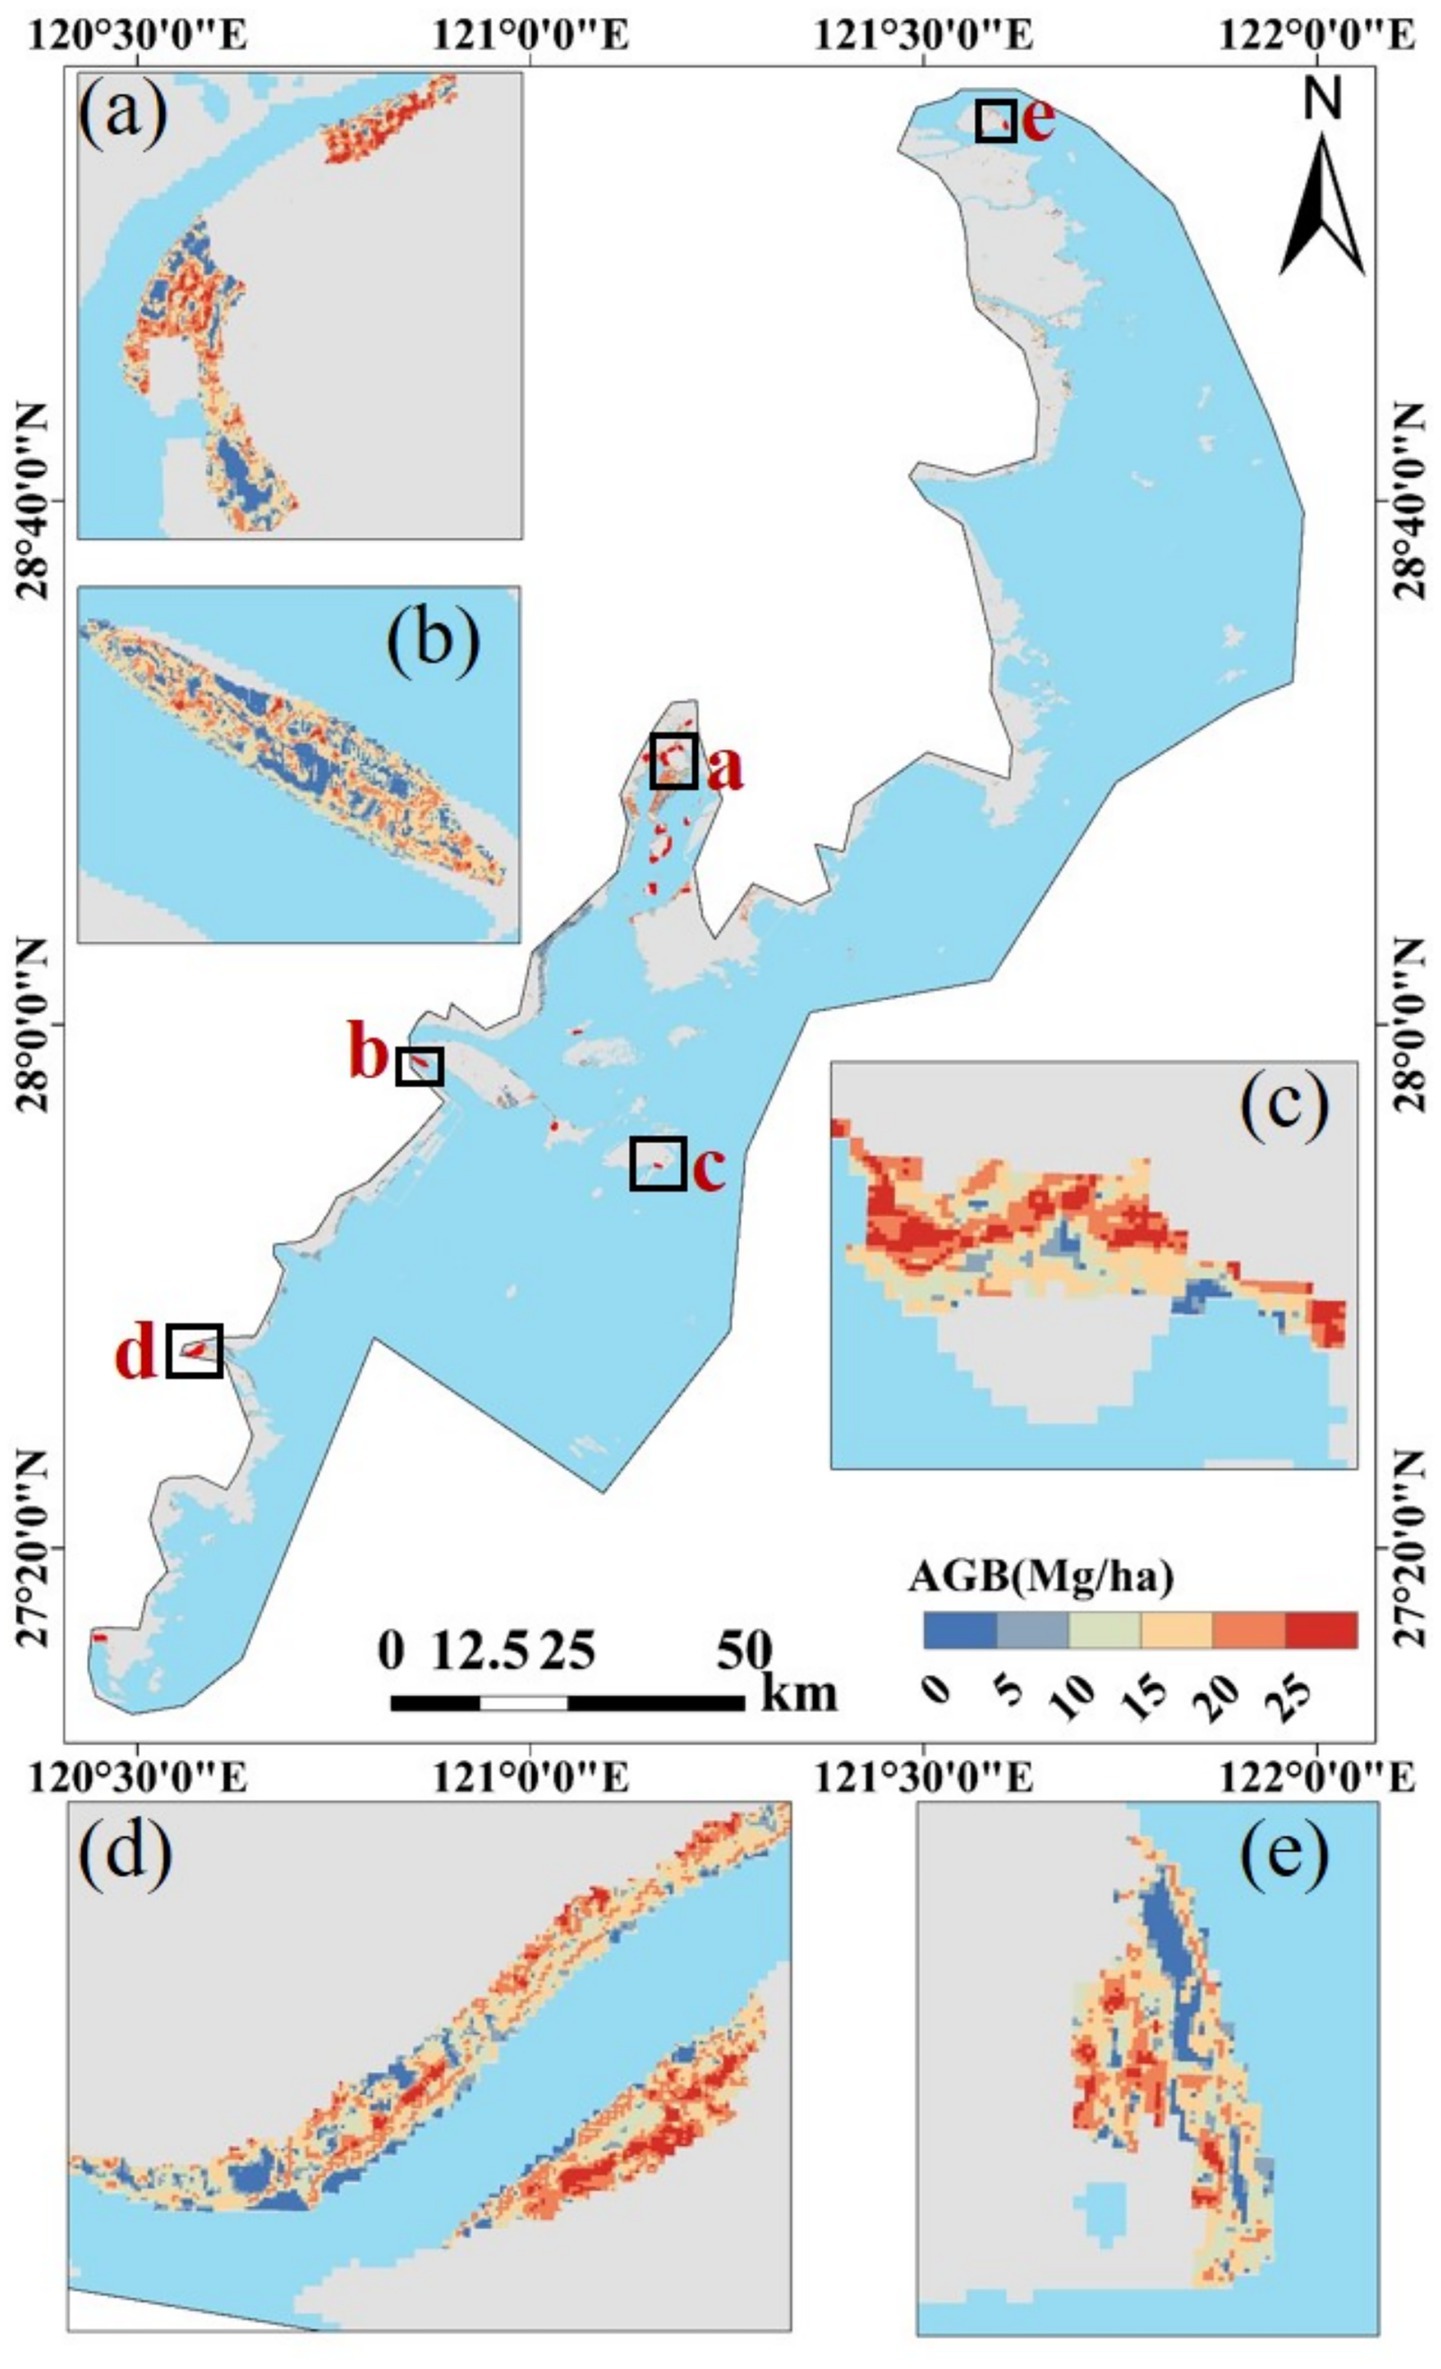
Figure 6. Inversion results of regional mangrove AGB; (a) near Yueqing Bay; (b) The estuary of the Ou River; (c) The Dongtou Islands; (d) The estuary of the Ao River; (e) Sanmen Bay.
5 Discussion
5.1 Analysis of feature importance
This study employed the RF algorithm to evaluate the importance of 304 input feature variables and selected the top 30 important features. The results indicate that textural features made the most significant contribution (28 in total), while spectral features and vegetation indices had relatively limited influence. Among the selected textural features, Correlation-type features accounted for the largest proportion (12 features), followed by Entropy and Second Moment (5 features each). The prominence of textural features is closely related to the structural complexity of the mangrove ecosystem. This distribution suggests that indicators representing textural uniformity, directionality, and heterogeneity collectively influence the inversion accuracy of mangrove biomass (Shili et al., 2017). Textural information, which is associated with the spatial structure of vegetation, effectively reflects internal canopy shadows and structural characteristics, demonstrating considerable potential for estimating forest AGB (Kraus et al., 2009; Laginha Pinto Correia et al., 2017; Sarker and Nichol, 2011). Furthermore, among the selected textural features, those extracted using a 3 × 3 window predominated (16 features), which may be attributed to the spatial resolution of the remote sensing imagery and the distribution area of the mangroves. Smaller windows help capture detailed characteristics of mangroves, and the extracted textural information is less susceptible to noise interference, better representing random heterogeneity and more sensitively responding to biomass changes, thereby enhancing the correlation with biomass (Cao et al., 2021).
Additionally, due to the optical remote sensing’s limited penetration capability, it struggles to capture vertical vegetation structure information and is susceptible to spectral saturation (Avtar et al., 2012; Mermoz et al., 2014). The sensitivity of vegetation indices decreases in high-biomass regions, and saturated effects may occur in locally high-density areas within the study area, resulting in weaker correlations with AGB. Furthermore, in mangrove habitats, tidal inundation, mudflats, and underlying soil reflectance can interfere with the relationship between vegetation indices and actual AGB. As this study was based on single-temporal imagery, vegetation phenology and seasonal variations cause changes in vegetation color, also contributing to the lower correlation of vegetation indices. Textural features, influenced by surface properties and illumination conditions, are independent of color variations and can reflect spatial patterns that single spectral pixels cannot express, thereby compensating for the limitations of traditional vegetation indices in estimating crop growth parameters (Li et al., 2020; Zhang et al., 2021). Different species and growth stages of vegetation exhibit distinct textural characteristics, with the canopy and foliar structures of large vegetation forming unique textural patterns in imagery, thereby providing higher-order spatial information that enhances biomass estimation accuracy. Although previous studies have suggested that vegetation indices may play a more critical role than original bands in Sentinel-2-based biomass models (Chrysafis et al., 2019), numerous studies have demonstrated that textural features more effectively mitigate the impact of spatial heterogeneity and improve the estimation accuracy of biomass and carbon storage (Lu and Batistella, 2005).
5.2 Model accuracy comparison and uncertainty analysis
This study used the Sentinel-2 satellite image data combined with ground sample survey data to construct mangrove AGB models by using five machine learning algorithms. Of the five machine learning algorithms, XGboost achieved the best results, with higher accuracy than the latest LCE.
On the test set, both XGboost and CATboost achieved higher accuracy than the other three algorithms, where the RMSE of XGboost was lower than that of CATboost, and the R2 of XGboost was lower than that of CATboost. RF was the least effective of the five algorithms, because RF made predictions by integrating multiple decision trees, and the independence between its trees often limits its expressiveness (Pham et al., 2020a). In addition, LCE’s R2 on the test set was slightly lower than XGboost and CATboost, and RMSE was also higher than both models. This was since LCE’s local modeling strategy may be adaptable to specific data, but faced challenges when generalizing to different test sets. LCE captured local features of the data through local modeling, but the capabilities of such local models may be limited. Both XGboost and Catboost are gradient-lift tree-based algorithms that optimize prediction results by progressively improving the model while handling complex nonlinear relationships and having greater expressibility in feature Spaces (Zhai et al., 2023). In addition, XGboost included regularization terms (L1 and L2 regularization), which can effectively prevent overfitting, thereby improving the generalization ability of the model. In related studies, the application of the XGboost algorithm combined with differential evolution for mangrove AGB estimation yielded superior performance compared to other machine learning models, achieving an R2 of 0.84 (Shen et al., 2025). Another study (Pham et al., 2020b) integrated XGboost with a genetic algorithm for mangrove biomass estimation, reporting an R2 of 0.683 and an RMSE of 25.08 Mg ha−1. Additionally, research combining Sentinel-2 imagery and CATboost for mangrove AGB estimation (Pham et al., 2021) achieved an R2 of 0.665 and an RMSE of 18.41 Mg ha−1. In comparison, this study utilized Sentinel-2 data and XGboost for biomass estimation, achieving a comparable R2 of 0.682, while demonstrating a significantly lower RMSE of 6.851 Mg/ha, indicating improved precision in AGB prediction.
Furthermore, factors such as image quality, model selection, and hyperparameter settings can introduce uncertainties in the estimation of aboveground mangrove AGB (Lu et al., 2016). This study utilized calibrated Sentinel-2 imagery and selected cloud-free time periods to effectively minimize uncertainty related to image quality. The uncertainty analysis in this research primarily focused on model selection and hyperparameter configuration. During model selection, cross-validation and grid search were employed to identify optimal hyperparameters and select the best-performing model on the test set for AGB inversion. However, due to the inherent randomness and systematic errors associated with XGboost, a repeated random prediction approach was adopted for uncertainty analysis to evaluate prediction errors under different configurations. Specifically, biomass inversion was performed 100 times using different random seeds, and the per-pixel standard deviation (STD) of the predictions was calculated (Chen et al., 2015). The final statistical results are shown in the Table 9. As illustrated, the STD is mostly below 6 Mg ha−1, accounting for approximately 90% of cases, with a mean standard deviation of 3.44 Mg ha−1 and a maximum not exceeding 20 Mg ha−1. These results indicate that the error caused by randomness is relatively low, suggesting minimal uncertainty in the model predictions.
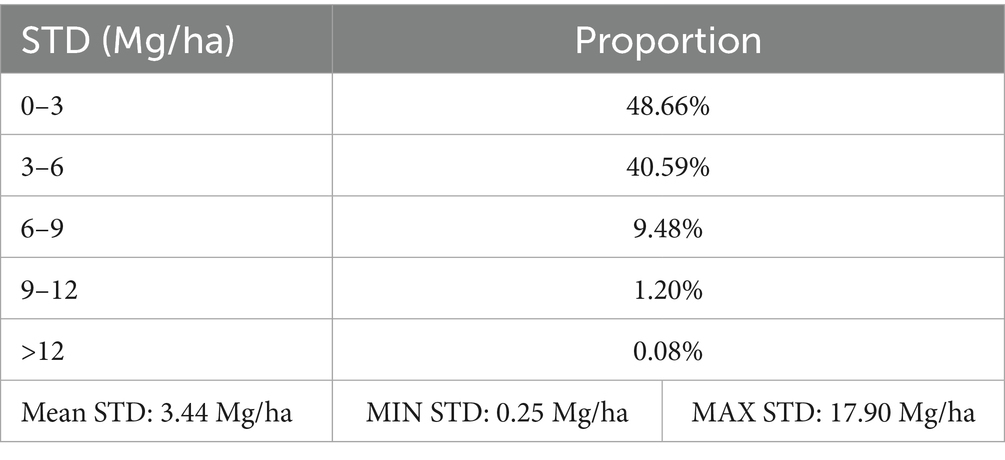
Table 9. Statistical proportion of standard deviation in estimated AGB.
5.3 Limitations and prospects
However, this study still has certain limitations that need to be addressed and improved in future research. First, regarding sample representativeness and spatial heterogeneity, the 340 sample plots used in this study cover a total area of 522.31 hectares, which may not fully capture the highly complex spatial heterogeneity within the mangrove ecosystem. The model may underestimate or overestimate AGB in these regions. To enhance model accuracy and generalizability, future studies should consider increasing the number of samples, especially by conducting additional surveys in sparsely sampled areas. Second, the spatial resolution of Sentinel-2 data remains a limitation in areas with high mangrove density or strong heterogeneity. In regions with complex canopy structures and high species mixing, intra-pixel spectral mixing is significant, which may lead to biases in biomass estimation—particularly in transition zones between forest and water, where non-vegetation signals in boundary pixels further affect inversion accuracy. Future research could enhance the perception of vertical structural information by integrating multi-source remote sensing data, or use the Google Earth Engine platform to incorporate multi-temporal imagery to reduce noise caused by phenological and seasonal variations.
6 Conclusion
This study used the Sentinel-2 remote sensing image data combined with mangrove sample plots to extract the distribution information of mangroves along the coast of Zhejiang Province and inverted the AGB of mangroves by machine learning. The main conclusions are as follows: (1) The accuracy of the mangrove area extracted by the maximum likelihood method was 86.43%, and the recall rate was 94.82%; (2) Five different machine learning methods were selected for mangrove AGB model construction, in which XGboost achieved the best effect, the test set R2 was 0.682, the RMSE was 6.851 Mg ha−1, and the R2 of other algorithms were also >0.65; (3) In this study, the optimal model XGboost was selected to invert the regional mangrove AGB, in which the average AGB in the region was 11.35 Mg ha−1, and the total AGB was 5930.28 Mg. Research indicates that XGBoost demonstrates strong fitting and prediction capabilities, suggesting that this gradient-boosting-based ensemble learning model holds considerable potential for application in subtropical coastal mangrove systems. However, due to factors such as the spatial heterogeneity of mangroves and variations in imagery quality, direct transfer of the model developed in this study to other subtropical regions should involve sample supplementation and validation to ensure reliability.
Data availability statement
The original contributions presented in the study are included in the article/supplementary material, further inquiries can be directed to the corresponding author.
Author contributions
CP: Writing – original draft, Data curation, Investigation, Validation. YS: Writing – review & editing, Supervision, Investigation. QH: Writing – review & editing. ZN: Data curation, Writing – review & editing, Investigation. GZ: Investigation, Writing – review & editing. HK: Methodology, Supervision, Writing – review & editing, Project administration. MY: Conceptualization, Supervision, Validation Writing – review & editing.
Funding
The author(s) declare that financial support was received for the research and/or publication of this article. The research was supported by the Wenzhou Academy of Agricultural Science of Doctoral Research Launch Project, the General Scientific Research Projects of the Department Education of Zhejiang Province (Y202250707).
Conflict of interest
The authors declare that the research was conducted in the absence of any commercial or financial relationships that could be construed as a potential conflict of interest.
Generative AI statement
The authors declare that no Gen AI was used in the creation of this manuscript.
Any alternative text (alt text) provided alongside figures in this article has been generated by Frontiers with the support of artificial intelligence and reasonable efforts have been made to ensure accuracy, including review by the authors wherever possible. If you identify any issues, please contact us.
Publisher’s note
All claims expressed in this article are solely those of the authors and do not necessarily represent those of their affiliated organizations, or those of the publisher, the editors and the reviewers. Any product that may be evaluated in this article, or claim that may be made by its manufacturer, is not guaranteed or endorsed by the publisher.
Footnotes
References
Ali, I., Greifeneder, F., Stamenkovic, J., Neumann, M., and Notarnicola, C. (2015). Review of machine learning approaches for biomass and soil moisture retrievals from remote sensing data. Remote Sens 7, 16398–16421. doi: 10.3390/rs71215841
Alvarenga, C. B.d., Mundim, G. S. M., Santos, E. A., Gallis, R. A. B., Zampiróli, R., Rinaldi, P. C. N., et al. (2021). Normalized difference vegetation index for desiccation evaluation with glyphosate + 2,4-D in magnetized spray solution. Braz. J. Biol. 83:e246579. doi: 10.1590/1519-6984.246579
Atkinson, P. M., and Lewis, P. (2000). Geostatistical classification for remote sensing: an introduction. Comput. Geosci. 26, 361–371. doi: 10.1016/S0098-3004(99)00117-X
Avtar, R., Sawada, H., Takeuchi, W., and Singh, G. (2012). Characterization of forests and deforestation in Cambodia using ALOS/PALSAR observation. Geocarto Int. 27, 119–137. doi: 10.1080/10106049.2011.626081
Baloloy, A. B., Blanco, A. C., Candido, C. G., Argamosa, R. J. L., Dumalag, J. B. L. C., Dimapilis, L. L. C., et al. (2018). Estimation of mangrove forest aboveground biomass using multispectral bands, vegetation indices and biophysical variables derived from optical satellite imageries: rapideye, planetscope and sentinel-2. ISPRS Ann. Photogramm. Remote Sens. Spatial Inf. Sci. IV-3, 29–36. doi: 10.5194/isprs-annals-IV-3-29-2018
Berninger, A., Lohberger, S., Stängel, M., and Siegert, F. (2018). Sar-based estimation of above-ground biomass and its changes in tropical forests of Kalimantan using L- and C-band. Remote Sens 10:831. doi: 10.3390/rs10060831
Cao, J., Liu, K., Zhuo, L., Liu, L., Zhu, Y., and Peng, L. (2021). Combining UAV-based hyperspectral and LiDAR data for mangrove species classification using the rotation forest algorithm. Int. J. Appl. Earth Obs. Geoinf. 102:102414. doi: 10.1016/j.jag.2021.102414
Castillo, J. A. A., Apan, A. A., Maraseni, T. N., and Salmo, S. G. (2017). Estimation and mapping of above-ground biomass of mangrove forests and their replacement land uses in the Philippines using sentinel imagery. ISPRS J. Photogramm. Remote Sens. 134, 70–85. doi: 10.1016/j.isprsjprs.2017.10.016
Chatting, M., LeVay, L., Walton, M., Skov, M. W., Kennedy, H., Wilson, S., et al. (2020). Mangrove carbon stocks and biomass partitioning in an extreme environment. Estuar. Coast. Shelf Sci. 244:106940. doi: 10.1016/j.ecss.2020.106940
Chen, Q., Vaglio Laurin, G., and Valentini, R. (2015). Uncertainty of remotely sensed aboveground biomass over an African tropical forest: propagating errors from trees to plots to pixels. Remote Sens. Environ. 160, 134–143. doi: 10.1016/j.rse.2015.01.009
Chen, T., and Guestrin, C. (2016). XGBoost: A scalable tree boosting system, proceedings of the 22nd ACM SIGKDD international conference on knowledge discovery and data mining. California, USA: Association for Computing Machinery, San Francisco, 785–794.
Chrysafis, I., Mallinis, G., Tsakiri, M., and Patias, P. (2019). Evaluation of single-date and multi-seasonal spatial and spectral information of Sentinel-2 imagery to assess growing stock volume of a Mediterranean forest. Int. J. Appl. Earth Obs. Geoinf. 77, 1–14. doi: 10.1016/j.jag.2018.12.004
Comley, B. W. T., and McGuinness, K. A. (2005). Above- and below-ground biomass, and allometry, of four common northern Australian mangroves. Aust. J. Bot. 53, 431–436. doi: 10.1071/BT04162
Cortes, C., and Vapnik, V. (1995). Support-vector networks. Mach. Learn. 20, 273–297. doi: 10.1023/A:1022627411411
Fauvel, K., Masson, V., Fromont, É., Faverdin, P., and Termier, A. (2019). Towards sustainable Dairy Management - a machine learning enhanced method for estrus detection, proceedings of the 25th ACM SIGKDD international conference on Knowledge Discovery & Data Mining. Anchorage, AK: Association for Computing Machinery, 3051–3059.
Fu, B., Wei, Y., Jiang, L., Yao, H., Li, X., Yang, Y., et al. (2025). Estimation of mangrove heights and aboveground biomass using UAV-LiDAR, Sentinel-1 and ZY-3 stereo images. Ecol. Inform. 88:103160. doi: 10.1016/j.ecoinf.2025.103160
Hajihosseinlou, M., Maghsoudi, A., and Ghezelbash, R. (2023). A novel scheme for mapping of MVT-type Pb–Zn prospectivity: lightGBM, a highly efficient gradient boosting decision tree machine learning algorithm. Nat. Resour. Res. 32, 2417–2438. doi: 10.1007/s11053-023-10249-6
Hamilton, S. E., Castellanos-Galindo, G. A., Millones-Mayer, M., and Chen, M. (2018). Remote sensing of mangrove forests: Current techniques and existing databases. Makowski: Springer International Publishing.
Han, J., Li, P., Yang, Z., Zhang, Y., Xu, Y., Feng, Y., et al. (2023). Variation and influencing factors of runoff and sediment in Ru River basin based on random forest model. Acta Ecol. Sin. Makowski: Springer. 43, 4190–4201. doi: 10.5846/stxb202204151013
Hao, J., Lv, K., Hu, T., Wang, Y., and Xu, G. (2024). Remote sensing inversion of mangrove biomass based on machine learning. For. Grassl. Resour. Res. 22, 65–72. doi: 10.13466/j.cnki.lczyyj.2024.01.009
Heumann, B. W. (2011). Satellite remote sensing of mangrove forests: recent advances and future opportunities. Prog. Phys. Geogr. Earth Environ. 35, 87–108. doi: 10.1177/0309133310385371
Hu, T., Zhang, Y., Su, Y., Zheng, Y., Lin, G., and Guo, Q. (2020). Mapping the global mangrove forest aboveground biomass using multisource remote sensing data. Remote Sens 12:1690. doi: 10.3390/rs12101690
Huang, G., Wu, L., Ma, X., Zhang, W., Fan, J., Yu, X., et al. (2019). Evaluation of CatBoost method for prediction of reference evapotranspiration in humid regions. J. Hydrol. 574, 1029–1041. doi: 10.1016/j.jhydrol.2019.04.085
Huang, L., Huang, Z., Zhou, W., Wu, S., Li, X., Mao, F., et al. (2024). Landsat-based spatiotemporal estimation of subtropical forest aboveground carbon storage using machine learning algorithms with hyperparameter tuning. Front. Plant Sci. 15:1421567. doi: 10.3389/fpls.2024.1421567
Jachowski, N. R. A., Quak, M. S. Y., Friess, D. A., Duangnamon, D., Webb, E. L., and Ziegler, A. D. (2013). Mangrove biomass estimation in Southwest Thailand using machine learning. Appl. Geogr. 45, 311–321. doi: 10.1016/j.apgeog.2013.09.024
Jiao, Z., Wang, H., Xing, J., Yang, Q., Zhao, J., and Yang, M. (2022). A local Cascade ensemble learning method for Lithium ion battery SOC estimation under multi external factors considering OCV hysteresis, 2022 power system and green energy conference (PSGEC). Shanghai, China: Springer, 262–266.
Kanniah, K. D., Sheikhi, A., Cracknell, A. P., Goh, H. C., Tan, K. P., Ho, C. S., et al. (2015). Satellite images for monitoring mangrove cover changes in a fast growing economic region in southern peninsular Malaysia. Remote Sens 7, 14360–14385. doi: 10.3390/rs71114360
Khattak, A., Zhang, J., Chan, P.-w., Chen, F., and Almujibah, H. (2024). Estimating wind shear magnitude near runways at Hong Kong international airport using an interpretable local cascade ensemble strategy. Asia-Pac. J. Atmos. Sci. 60, 271–287. doi: 10.1007/s13143-024-00351-x
Komiyama, A., Ong, J. E., and Poungparn, S. (2008). Allometry, biomass, and productivity of mangrove forests: a review. Aquat. Bot. 89, 128–137. doi: 10.1016/j.aquabot.2007.12.006
Kraus, T., Schmidt, M., Dech, S. W., and Samimi, C. (2009). The potential of optical high resolution data for the assessment of leaf area index in east African rainforest ecosystems. Int. J. Remote Sens. 30, 5039–5059. doi: 10.1080/01431160903022878
Laginha Pinto Correia, D., Raulier, F., Filotas, É., and Bouchard, M. (2017). Stand height and cover type complement forest age structure as a biodiversity indicator in boreal and northern temperate forest management. Ecol. Indic. 72, 288–296. doi: 10.1016/j.ecolind.2016.08.033
Li, B., Xu, X., Zhang, L., Han, J., Bian, C., Li, G., et al. (2020). Above-ground biomass estimation and yield prediction in potato by using UAV-based RGB and hyperspectral imaging. ISPRS J. Photogramm. Remote Sens. 162, 161–172. doi: 10.1016/j.isprsjprs.2020.02.013
Li, H., Zhang, G., Zhong, Q., Xing, L., and Du, H. (2023). Prediction of urban forest aboveground carbon using machine learning based on Landsat 8 and Sentinel-2: a case study of Shanghai, China. Remote Sens 15:284. doi: 10.3390/rs15010284
Liu, P., Choo, K.-K. R., Wang, L., and Huang, F. (2017). SVM or deep learning? A comparative study on remote sensing image classification. Soft. Comput. 21, 7053–7065. doi: 10.1007/s00500-016-2247-2
Lu, D., and Batistella, M. (2005). Exploring TM image texture and its relationships with biomass estimation in Rondônia, Brazilian Amazon. Acta Amazon. 35, 249–257. doi: 10.1590/S0044-59672005000200015
Lu, D., Chen, Q., Wang, G., Liu, L., Li, G., and Moran, E. (2016). A survey of remote sensing-based aboveground biomass estimation methods in forest ecosystems. Int. J. Digit. Earth. Quebec City, Canada. 9, 63–105. doi: 10.1080/17538947.2014.990526
Majnoun Hosseini, M., Valadan Zoej, M. J., Taheri Dehkordi, A., and Ghaderpour, E. (2024). Cropping intensity mapping in Sentinel-2 and Landsat-8/9 remote sensing data using temporal transfer of a stacked ensemble machine learning model within Google earth engine. Geocarto Int. 39:2387786. doi: 10.1080/10106049.2024.2387786
Martins Silva, J. P., Marques da Silva, M. L., Ferreira da Silva, E., Fernandes da Silva, G., Ribeiro de Mendonça, A., Cabacinha, C. D., et al. (2019). Computational techniques applied to volume and biomass estimation of trees in Brazilian savanna. J. Environ. Manag. 249:109368. doi: 10.1016/j.jenvman.2019.109368
Mermoz, S., Réjou-Méchain, M., Villard, L., Toan, T. L., Rossi, V., and Gourlet-Fleury, S. (2014). “Biomass of dense forests related to L-band SAR backscatter?” in 2014 IEEE Geoscience and Remote Sensing Symposium. Quebec City, Canada: Institute of Electrical and Electronics Engineers. 1037–1040.
Nandy, S., Srinet, R., and Padalia, H. (2021). Mapping forest height and aboveground biomass by integrating ICESat-2, Sentinel-1 and Sentinel-2 data using random forest algorithm in northwest Himalayan foothills of India. Geophys. Res. Lett. 48:e2021GL093799. doi: 10.1029/2021GL093799
Navarro, J. A., Algeet, N., Fernández-Landa, A., Esteban, J., Rodríguez-Noriega, P., and Guillén-Climent, M. L. (2019). Integration of UAV, Sentinel-1, and Sentinel-2 data for mangrove plantation aboveground biomass monitoring in Senegal. Remote Sens 11:77. doi: 10.3390/rs11010077
Otukei, J. R., and Blaschke, T. (2010). Land cover change assessment using decision trees, support vector machines and maximum likelihood classification algorithms. Int. J. Appl. Earth Obs. Geoinf. 12, S27–S31. doi: 10.1016/j.jag.2009.11.002
Pandit, S., Tsuyuki, S., and Dube, T. (2018). Estimating above-ground biomass in sub-tropical buffer zone community forests, Nepal, using sentinel 2 data. Remote Sens 10:601. doi: 10.3390/rs10040601
Pham, T. D., Le, N. N., Ha, N. T., Nguyen, L. V., Xia, J., Yokoya, N., et al. (2020a). Estimating mangrove above-ground biomass using extreme gradient boosting decision trees algorithm with fused Sentinel-2 and ALOS-2 PALSAR-2 data in can Gio biosphere reserve, Vietnam. Remote Sens 12:777. doi: 10.3390/rs12050777
Pham, T. D., Yokoya, N., Nguyen, T. T. T., Le, N. N., Ha, N. T., Xia, J., et al. (2021). Improvement of mangrove soil carbon stocks estimation in North Vietnam using Sentinel-2 data and machine learning approach. GIScience Remote Sens. 58, 68–87. doi: 10.1080/15481603.2020.1857623
Pham, T. D., Yokoya, N., Xia, J., Ha, N. T., Le, N. N., Nguyen, T. T., et al. (2020b). Comparison of machine learning methods for estimating mangrove above-ground biomass using multiple source remote sensing data in the red River Delta biosphere reserve, Vietnam. Remote Sens 12:334. doi: 10.3390/rs12081334
Prakash, A. J., Behera, M. D., Ghosh, S. M., Das, A., and Mishra, D. R. (2022). A new synergistic approach for Sentinel-1 and PALSAR-2 in a machine learning framework to predict aboveground biomass of a dense mangrove forest. Ecol. Inform. 72:101900. doi: 10.1016/j.ecoinf.2022.101900
Prokhorenkova, L., Gusev, G., Vorobev, A., Dorogush, A. V., and Gulin, A. (2018). CatBoost: Unbiased boosting with categorical features, proceedings of the 32nd international conference on neural information processing systems. Montréal, ON: Curran Associates Inc, 6639–6649.
Rodriguez-Galiano, V. F., Ghimire, B., Rogan, J., Chica-Olmo, M., and Rigol-Sanchez, J. P. (2012). An assessment of the effectiveness of a random forest classifier for land-cover classification. ISPRS J. Photogramm. Remote Sens. 67, 93–104. doi: 10.1016/j.isprsjprs.2011.11.002
Samat, A., Li, E., Wang, W., Liu, S., Lin, C., and Abuduwaili, J. (2020). Meta-XGBoost for hyperspectral image classification using extended MSER-guided morphological profiles. Remote Sens 12:1973. doi: 10.3390/rs12121973
Sarker, L. R., and Nichol, J. E. (2011). Improved forest biomass estimates using ALOS AVNIR-2 texture indices. Remote Sens. Environ. 115, 968–977. doi: 10.1016/j.rse.2010.11.010
Shen, Y., Liao, Z., Tian, Y., Tao, J., Luo, J., Wang, J., et al. (2025). Knowledge assisted differential evolution extreme gradient boost algorithm for estimating mangrove aboveground biomass. Appl. Soft Comput. 172:112838. doi: 10.1016/j.asoc.2025.112838
Shili, M., Yong, P., Zhongjun, Z., Zengyuan, L., Xueqiong, W., and Shiming, L. (2017). Estimation of aboveground biomass in a temperate forest using texture information from WorldView-2. J. Remote Sens. 21, 812–824. doi: 10.11834/jrs.20176083
Sinha, S., Jeganathan, C., Sharma, L. K., Nathawat, M. S., Das, A. K., and Mohan, S. (2016). Developing synergy regression models with space-borne ALOS PALSAR and Landsat TM sensors for retrieving tropical forest biomass. J. Earth Syst. Sci. 125, 725–735. doi: 10.1007/s12040-016-0692-z
Strobl, C., Boulesteix, A.-L., Zeileis, A., and Hothorn, T. (2007). Bias in random forest variable importance measures: illustrations, sources and a solution. BMC Bioinformatics 8:25. doi: 10.1186/1471-2105-8-25
Tan, Y., Sun, J.-Y., Zhang, B., Chen, M., Liu, Y., and Liu, X.-D. (2019). Sensitivity of a ratio vegetation index derived from hyperspectral remote sensing to the Brown Planthopper stress on Rice plants. Sensors 19:375. doi: 10.3390/s19020375
Tian, Y., Zhang, Q., Huang, H., Huang, Y., Tao, J., Zhou, G., et al. (2022). Aboveground biomass of typical invasive mangroves and its distribution patterns using UAV-LiDAR data in a subtropical estuary: Maoling River estuary, Guangxi, China. Ecol. Indic. 136:108694. doi: 10.1016/j.ecolind.2022.108694
Tucker, C. J. (1979). Red and photographic infrared linear combinations for monitoring vegetation. Remote Sens. Environ. 8, 127–150. doi: 10.1016/0034-4257(79)90013-0
Vafaei, S., Soosani, J., Adeli, K., Fadaei, H., Naghavi, H., Pham, T. D., et al. (2018). Improving accuracy estimation of Forest aboveground biomass based on incorporation of ALOS-2 PALSAR-2 and sentinel-2A imagery and machine learning: a case study of the Hyrcanian Forest area (Iran). Remote Sens 10:172. doi: 10.3390/rs10020172
Wang, J., Du, H., Li, X., Mao, F., Zhang, M., Liu, E., et al. (2021). Remote sensing estimation of bamboo forest aboveground biomass based on geographically weighted regression. Remote Sens 13:2962. doi: 10.3390/rs13152962
Wang, L., Jia, M., Yin, D., and Tian, J. (2019). A review of remote sensing for mangrove forests: 1956–2018. Remote Sens. Environ. 231:111223. doi: 10.1016/j.rse.2019.111223
Wang, L.a., Zhou, X., Zhu, X., Dong, Z., and Guo, W. (2016). Estimation of biomass in wheat using random forest regression algorithm and remote sensing data. Crop J. 4, 212–219. doi: 10.1016/j.cj.2016.01.008
Wu, C., Chen, Y., Peng, C., Li, Z., and Hong, X. (2019). Modeling and estimating aboveground biomass of Dacrydium pierrei in China using machine learning with climate change. J. Environ. Manag. 234, 167–179. doi: 10.1016/j.jenvman.2018.12.090
Xue, C., and Qian, S. (2022). Fusion of Landsat 8 and Sentinel-2 data for mangrove phenology information extraction and classification. National Remote Sensing Bulletin 26, 1121–1142. doi: 10.11834/jrs.20221448
Yu, C., Gong, H., Cao, J., Liu, Y., and Liu, K. (2023). Individual tree crown delineation and aboveground biomass estimation of Sonneratia apetala based on unmanned aerial vehicle remote sensing images. Trop. Geogr. 43, 12–22. doi: 10.13284/j.cnki.rddl.003609
Yusandi, S., Jaya, I. N. S., and Mulia, F. (2018). Biomass estimation model for mangrove forest using medium-resolution imageries in BSN co ltd concession area, West Kalimantan. IJReSES 15, 37–50. doi: 10.30536/j.ijreses.2018.v15.a2683
Zhai, W., Li, C., Fei, S., Liu, Y., Ding, F., Cheng, Q., et al. (2023). Catboost algorithm for estimating maize above-ground biomass using unmanned aerial vehicle-based multi-source sensor data and SPAD values. Comput. Electron. Agric. 214:108306. doi: 10.1016/j.compag.2023.108306
Zhang, J., Qiu, X., Wu, Y., Zhu, Y., Cao, Q., Liu, X., et al. (2021). Combining texture, color, and vegetation indices from fixed-wing UAS imagery to estimate wheat growth parameters using multivariate regression methods. Comput. Electron. Agric. 185:106138. doi: 10.1016/j.compag.2021.106138
Zhen, Z., Chen, S., Yin, T., Chavanon, E., Lauret, N., Guilleux, J., et al. (2021). Using the negative soil adjustment factor of soil adjusted vegetation index (SAVI) to resist saturation effects and estimate leaf area index (LAI) in dense vegetation areas. Sensors 21:2115. doi: 10.3390/s21062115
Zhong, W., Zhang, D., Sun, Y., and Wang, Q. (2023). A catboost-based model for the intensity detection of tropical cyclones over the Western North Pacific based on satellite cloud images. Remote Sens 15:3510. doi: 10.3390/rs15143510
Keywords: mangrove, aboveground biomass, machine learning, Sentinel-2, inversion
Citation: Peng C, Song Y, Huang Q, Niu Z, Zeng G, Kang H and Ying M (2025) Estimating coastal mangrove aboveground biomass of Zhejiang province based on sentinel-2 images and multiple machine learning algorithms. Front. For. Glob. Change. 8:1662546. doi: 10.3389/ffgc.2025.1662546
Edited by:
Ram P. Sharma, Tribhuvan University, NepalReviewed by:
Shaohua Lei, Nanjing Hydraulic Research Institute, ChinaEmilio Ramírez-Juidías, Universidad de Sevilla Instituto Universitario de Arquitectura y Ciencias de la Construccion, Spain
Ebrahim Ghaderpour, Sapienza University of Rome, Italy
Copyright © 2025 Peng, Song, Huang, Niu, Zeng, Kang and Ying. This is an open-access article distributed under the terms of the Creative Commons Attribution License (CC BY). The use, distribution or reproduction in other forums is permitted, provided the original author(s) and the copyright owner(s) are credited and that the original publication in this journal is cited, in accordance with accepted academic practice. No use, distribution or reproduction is permitted which does not comply with these terms.
*Correspondence: Miaomiao Ying, bW15aW5nMDEyMEAxNjMuY29t