Abstract
Wildfires present a significant threat to ecosystems, property, and human life in Kazakhstan. Understanding fire hazards is essential for effective management and mitigation of these risks. This study develops a comprehensive fire hazard index for Kazakhstan by integrating static, long-term landscape factors with dynamic, real-time weather and vegetation conditions. The static component employs a machine learning approach, specifically the Random Forest algorithm, trained on a dataset that includes topographic variables derived from the SRTM DEM, land cover classifications from MODIS Terra/Aqua LULC products, and historical fire occurrence data from NASA FIRMS. This model quantifies the inherent fire susceptibility of various landscapes based on these enduring characteristics. The dynamic component captures short-term fluctuations in fire risk by incorporating satellite-derived vegetation information and meteorological observations. The MODIS-derived Normalized Difference Vegetation Index (NDVI) serves as a proxy for fuel availability and moisture content. Spatially interpolated weather data such as temperature, humidity, wind speed, and precipitation provide the necessary meteorological context. The dynamic index is calculated using a modified Canadian Fire Weather Index (FWI) system, specifically adapted to account for the influence of live fuel moisture, as indicated by NDVI, on fire ignition and spread dynamics. The final fire risk index is created by additively combining the static and dynamic components, offering a spatiotemporal perspective on fire risk. This integrated approach allows for the assessment of both the underlying susceptibility of a landscape to fire and the immediate effects of weather and vegetation conditions. The resulting high-resolution fire hazard maps are intended to inform fire management decisions, optimize resource allocation for fire prevention and suppression efforts, and support targeted interventions in high-risk areas. This research underscores the value of combining machine learning techniques with remotely sensed data for enhanced fire risk assessment in Kazakhstan, facilitating more proactive and effective fire management strategies.
1 Introduction
Kazakhstan faces persistent and escalating wildfire challenges that pose serious risks to its ecosystems, economy, and human well-being (Babu et al., 2019; Chepashev et al., 2025). The country has a history of severe fire events that destroyed hectares of forest (Zhanbossinova et al., 2024). According to the Global Forest Watch report, between 2001 and 2024 fires accounted for 38% of Kazakhstan’s total tree cover loss (33.4 thousand hectares), with 2023 alone contributing 14.0 thousand hectares (Global Forest Watch, n.d.). These figures highlight the increasing frequency and intensity of wildfires and their devastating ecological and social consequences for the country.
The occurrence and severity of wildfires in Kazakhstan are shaped by a combination of climatic, anthropogenic, and natural drivers (Kolluru, 2024). Hot and dry summers produce highly flammable conditions (Xu et al., 2021). Anthropogenic influences, such as negligence and fire safety violations, frequently act as ignition sources (Kenzhebayeva et al., 2023). Natural lightning events also contribute significantly to fire ignition (Kharyutkina et al., 2024). Beyond ignition, the consequences of wildfires are wide-ranging: economic losses, destruction of tree cover (Babu et al., 2019; Singh, 2022), population displacement, air pollution, and long-term ecological degradation (Zong et al., 2020). These impacts feature the perseverance of proactive fire management strategies cantered on prevention, early detection, and rapid suppression (Zhanbossinova et al., 2024; Sample et al., 2022).
Accurate fire risk assessment is a critical foundation for wildfire management, as it supports targeted resource allocation and the development of preventive measures in high-risk regions (Suresh Babu et al., 2024). Fire risk assessment typically integrates two types of factors: static indicators, which describe long-term predispositions of landscapes to fire, and dynamic indicators, which capture short-term variability (Zagalikis, 2023; Moreno et al., 2025). This distinction is important for designing risk indices that not only highlight inherently flammable regions but also adapt to changing environmental conditions.
Static indices focus on relatively stable variables, including topography, vegetation type, and historical fire occurrence. These indices provide insights into the inherent flammability of landscapes and have been widely used for mapping baseline fire susceptibility (Scott et al., 2012; Finney, 1998; Babu and Roy, 2020). However, their limitation is that they do not capture temporal dynamics such as fuel moisture fluctuations or rapid changes in weather conditions. Dynamic indices, in contrast, capture short-term variations in fire risk by integrating real-time meteorological and vegetation data. Among these, the Canadian Fire Weather Index (FWI) (Van Wagner, 1987) remains the most widely applied due to its robust integration of weather variables such as temperature, relative humidity, wind speed, and precipitation (Babu, 2019). However, dynamic indices often fail to incorporate static drivers of susceptibility, leading to incomplete assessments (Taylor et al., 2024).
Recognizing the limitations of purely static or purely dynamic indices, recent research has emphasized integrated approaches that combine both long-term landscape susceptibility and short-term weather-driven variability (Singh and Babu, 2021). Such combined indices provide a more holistic assessment of wildfire risk, but applications remain limited and often underdeveloped, especially in Central Asian ecosystems. Kazakhstan, with its vast forest–steppe mosaic, sparse meteorological infrastructure, and increasing fire frequency, presents an ideal case where integrated approaches can significantly improve operational fire management (Chepashev et al., 2025).
To address this gap, we propose a Spatiotemporal Fire Risk Index (SFRI) tailored to Kazakhstan’s diverse landscapes. This framework integrates: (i) a static hazard index, generated using a Random Forest (RF) model trained on terrain attributes, land cover data, and historical fire records; (ii) a dynamic fire risk index, derived from the Fire Weather Index (FWI) system, modified with vegetation indices (NDVI) and the Fuel Moisture Index (FMI); and (iii) validation with satellite-based fire detections, including both MODIS and VIIRS. This combination captures both baseline landscape susceptibility and real-time environmental triggers, making the index more reliable for predicting fire risk in Central Asia.
2 Materials and methods
2.1 Study area
Kazakhstan, the largest landlocked country in the world, is located in Central Asia and covers an area of approximately 2.7 million square kilometers. The nation features a diverse geography that includes steppes, deserts, mountains, and forested areas, primarily found in the northern regions. The vast landscape of Kazakhstan significantly influences its climate, which ranges from continental to arid, leading to notable variations in ecosystems and land use patterns (World Bank, 2021). The northern part of the country, particularly regions such as Pavlodar, Akmolinsk, and Kostanay, is distinguished by its forested areas, while the southern regions are mainly arid or semi-arid.
Forests in Kazakhstan cover about 5% of the country’s territory and play a crucial role in supporting biodiversity and ecological stability (Zhanbossinova et al., 2024). The main types of forests include coniferous, deciduous, and mixed forests, with key species such as larch, pine, birch, and aspen that are essential for maintaining local climates and soil health (Suresh Babu et al., 2024). However, these forests face significant threats from logging, agricultural expansion, and wildfires (Babu et al., 2019). The ongoing degradation of forest ecosystems demonstrates the need for immediate management interventions to protect these vital resources (Suresh Babu et al., 2024). Figure 1, which represents the study area map of Kazakhstan, is comprised of two distinct datasets: MODIS IGBP (International Geosphere-Biosphere Programme) and a Digital Elevation Model (DEM). These two components provide crucial information about the geography of Kazakhstan, which is essential for fire risk assessment.
Figure 1

Maps depicting the study area in Kazakhstan, including land use and land cover (LULC) and the Digital Elevation Model (DEM).
2.2 Methodology
The datasets utilized in this research are outlined in Table 1, and Figure 2 depicts the entire process of developing the Spatiotemporal Fire Risk Index (SFRI). The initial step in assessing fire risk is the establishment of a static fire hazard index. This index evaluates the likelihood of a fire occurring in a specific area by considering various factors, such as the types of vegetation present and the land’s topography, including slope, direction, and elevation (Babu and Roy, 2020). These factors are crucial for understanding fire behavior and susceptibility, as they affect the availability of fuel and the spread of fire across different landscapes. Following the development of the static fire hazard index, the next phase involves applying the Canadian Fire Weather Index (FWI). This index serves as a framework for evaluating fire risk based on meteorological conditions (Van Wagner, 1987). The weather-based fire risk index is calculated using key weather parameters derived from satellite datasets. Essential variables in this assessment include air temperature, relative humidity, wind speed, and precipitation, which together play a significant role in determining fire risk (Bedia et al., 2012). In the final stage, we combine the static fire hazard index with the dynamic fire risk index to develop an SFRI. This integration facilitates a thorough assessment of fire risk by considering both the long-term susceptibility of landscapes to fire and the immediate effects of weather and climatic conditions.
Table 1
| S. No. | Datasets | Product | Spatial resolution | Temporal resolution |
|---|---|---|---|---|
| 1 | Shuttle Radar Topography Mission (SRTM) | DEM | 90 m | |
| 2 | MODIS/Terra + Aqua Land Cover Type | MCD12Q1 | 500 m | Year |
| 3 | MODIS/Terra Vegetation Indices | MOD13A2 | 1,000 m | 16 day |
| 4 | MODIS Terra, Aqua fire hotspot data | MOD14 MYD14 |
1,000 m | Daily |
| 5 | AWS data | AT, RH, WS | Daily |
Datasets utilized in generating SFRI.
Figure 2
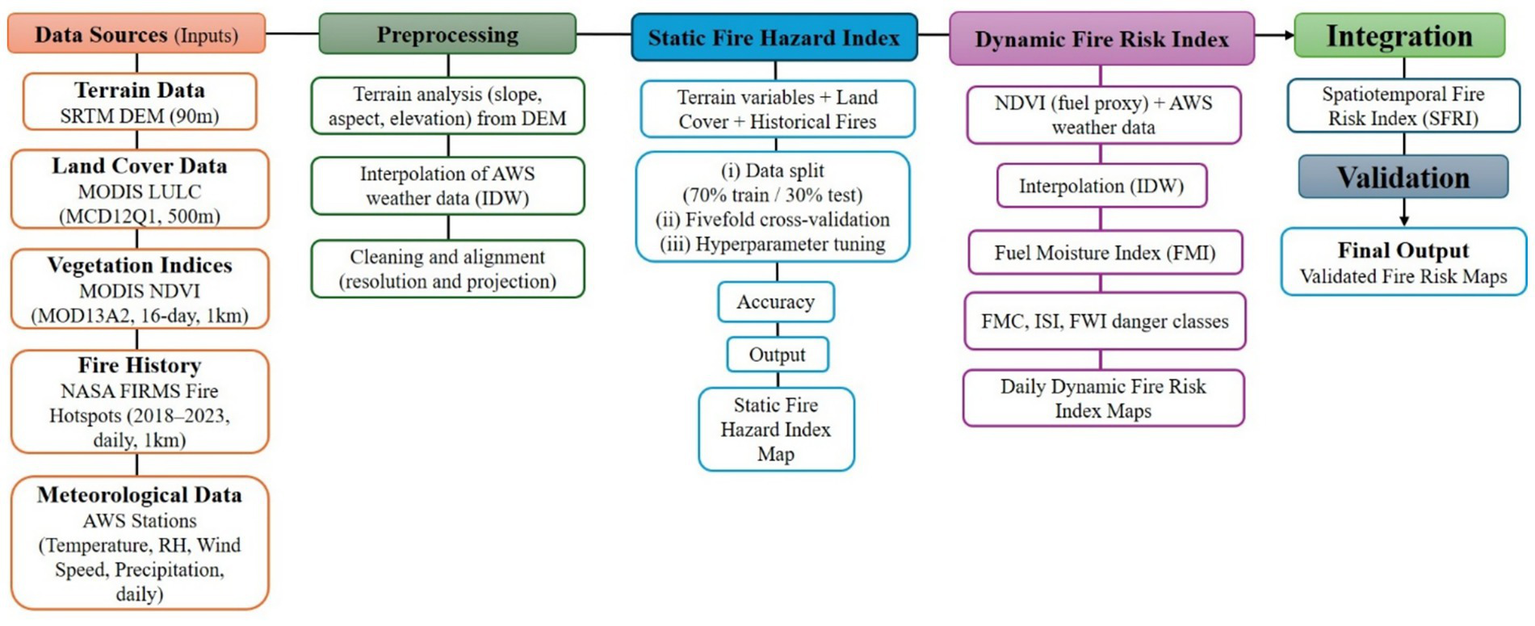
Flowchart illustrating the methodology of SFRI.
2.2.1 Static fire hazard index
To evaluate the static fire hazard, we obtained several geospatial datasets, including Terrain Data, Land Cover Data, and Fire History Data. The Shuttle Radar Topography Mission (SRTM) Digital Elevation Model (DEM) was sourced from the USGS Earth Explorer website (USGS Earth Explorer, n.d.)1 and provides detailed elevation information. MODIS (Moderate Resolution Imaging Spectroradiometer) Terra and Aqua land use and land cover (LULC) maps were downloaded from the Earthdata Search portal (Earthdata Search, n.d.)2, which categorizes the land cover types throughout Kazakhstan. Additionally, active fire point data specific to Kazakhstan was retrieved from the NASA Fire Information for Resource Management System (FIRMS) website (NASA, Fire information for resource management system, n.d.)3, encompassing the fire seasons from 2018 to 2023.
The acquired data underwent further processing to derive additional spatial variables and prepare it for the machine learning model. A terrain analysis was conducted using the SRTM DEM data to calculate the slope and aspect of the terrain, which are essential factors influencing fire behavior (Finney, 1998; Jain et al., 2021). A Random Forest model was developed in a Python Jupyter Notebook to predict fire occurrence in Kazakhstan, taking advantage of its effectiveness in modeling complex, non-linear relationships. The model was trained on a dataset that included terrain attributes, land cover classifications from MODIS IGBP, and historical fire records. The dataset was divided into a 70% training set and a 30% testing set, employing a fivefold cross-validation approach to ensure robust performance. Hyperparameter tuning was performed using a randomized search to optimize key parameters, such as the number of trees (ranging from 100 to 500), maximum features (The number of features considered at each split, testing “sqrt”, “log2”, 0.6, and 0.8. This parameter controls the randomness of the model and helps in reducing correlation among trees), and tree depth (ranging from 5 to 20).
The trained model displayed strong predictive capabilities, achieving an accuracy of 0.78 and a robust AUC score of 0.80 on the test set. An analysis of variable importance indicated that static factors like slope and elevation were the most significant predictors of fire occurrence. This validated model was subsequently used to generate a spatially explicit static fire hazard index, which serves as a foundational component of the Spatiotemporal Fire Risk Index (SFRI) for Kazakhstan.
2.2.2 Dynamic fire risk index
We developed a dynamic fire risk index for Kazakhstan by enhancing the Canadian Fire Weather Index (FWI) with satellite-derived vegetation data, which improves the assessment of fuel availability. We also modified the fuel moisture content by incorporating the Fuel Moisture Index (FMI), thereby simplifying the calculations. This modification was necessary because the original equation relied on ground-based parameters and values from the previous day. We utilized the Normalized Difference Vegetation Index (NDVI) from MODIS TERRA (MOD13A2 product) as fuel proxies. A network of Automatic Weather Stations (AWS) in Kazakhstan provided current data on temperature, humidity, and wind speed. These datasets were spatially interpolated using deterministic Inverse Distance Weighting (IDW) to generate continuous raster surfaces. IDW was chosen over Kriging because of its computational efficiency and fewer statistical assumptions. IDW interpolation is both simpler and faster than Kriging, which requires a robust variogram model and is more computationally intensive (Kravchenko and Bullock, 1999). This approach enabled the efficient processing of the large dataset by ensuring that the influence of each AWS observation was inversely proportional to its distance from the interpolated location, allowing for the rapid and reliable generation of representative spatial surfaces for analysis. The FWI system, which includes the Fine Fuel Moisture Code (FMC), Duff Moisture Code, and Drought Code, was modified to incorporate Enhanced Vegetation Index (EVI). The FMC, which represents the moisture content of readily ignitable fuels, was adjusted using the Fuel Moisture Index equation (Sharples et al., 2009) to better reflect live fuel moisture dynamics. The original FWI system, without the FMI, often underestimated fire danger in these areas, especially during periods of green-up or drought stress where live fuel moisture deviates significantly from that inferred solely from weather variables. The FMI improves fire danger assessment and prediction by providing a more holistic and ecologically relevant indicator of fuel moisture conditions. The remaining components of the FWI, which are primarily driven by weather, were derived from the interpolated meteorological data. The Initial Spread Index (ISI), which combines FMC and weather conditions, quantifies the potential rate of fire spread (Bourlière et al., 2006). The FWI integrates both FMC and ISI to produce a fire danger rating that ranges from very low to very high (Equations (1–5)).
The following equations are used to generate the FWI for each day:
The FMI is a simplified index developed by Sharples in 2009 to estimate the moisture content of fuel in a forest or grassland. It’s a relatively straightforward calculation compared to more complex indices. The FMI equation is used as a proxy for the fuel moisture content (m).
Where:
FMI: Fuel Moisture Index = m; T: Air temperature; RH: Relative humidity.
The equations of FWI are shown in the following equations.
In the Intermediate FWI (B), f(D) is the fuel availability and the NDVI has been used as a proxy in this study.
2.2.3 Spatiotemporal Fire Risk Index
To develop a comprehensive and robust fire risk assessment, a Spatiotemporal Fire Risk Index can be established by combining both static and dynamic components through an additive model. This methodological framework leverages the strengths of both static fire hazard and dynamic fire risk indices, resulting in a more accurate and nuanced representation of fire risk. The daily calculations of the integrated fire hazard index during the 2023 fire season facilitate real-time analysis and application in fire management strategies. This index can be overlaid with actual fire occurrences on corresponding days, allowing for a direct comparison between predicted fire risk and observed events. The resulting fire danger maps are categorized into five distinct fire hazard levels: very low, low, moderate, high, and very high. These classifications, derived from pixel values, provide practical guidance to fire management agencies, enabling them to adapt their prevention and suppression strategies dynamically according to the changing fire risk landscape (Stocks et al., 2002). A summary of the classification criteria is included in Table 2.
Table 2
| S. No. | Hazard class | Pixel values |
|---|---|---|
| 1 | Very low | <4 |
| 2 | Low | 4–5 |
| 3 | Moderate | 5–6 |
| 4 | High | 6–8 |
| 5 | Very high | >8 |
Fire hazard classes.
3 Results and discussion
The developed SFRI provides a comprehensive assessment of fire risk across Kazakhstan. This spatial layer can assist authorities in prioritizing resources and focusing their efforts on areas with a higher likelihood of fire occurrence (Akther and Hassan, 2011). The SFRI maps were generated during the 2023 fire season, and the selected maps have been overlaid with the corresponding MODIS fire incidents, as shown in Figure 3. These maps were generated daily to provide a thorough and operationally relevant assessment of fire danger throughout the season. However, Figure 3 presents only a limited selection of dates to demonstrate the model’s accuracy during specific, representative instances.
Figure 3
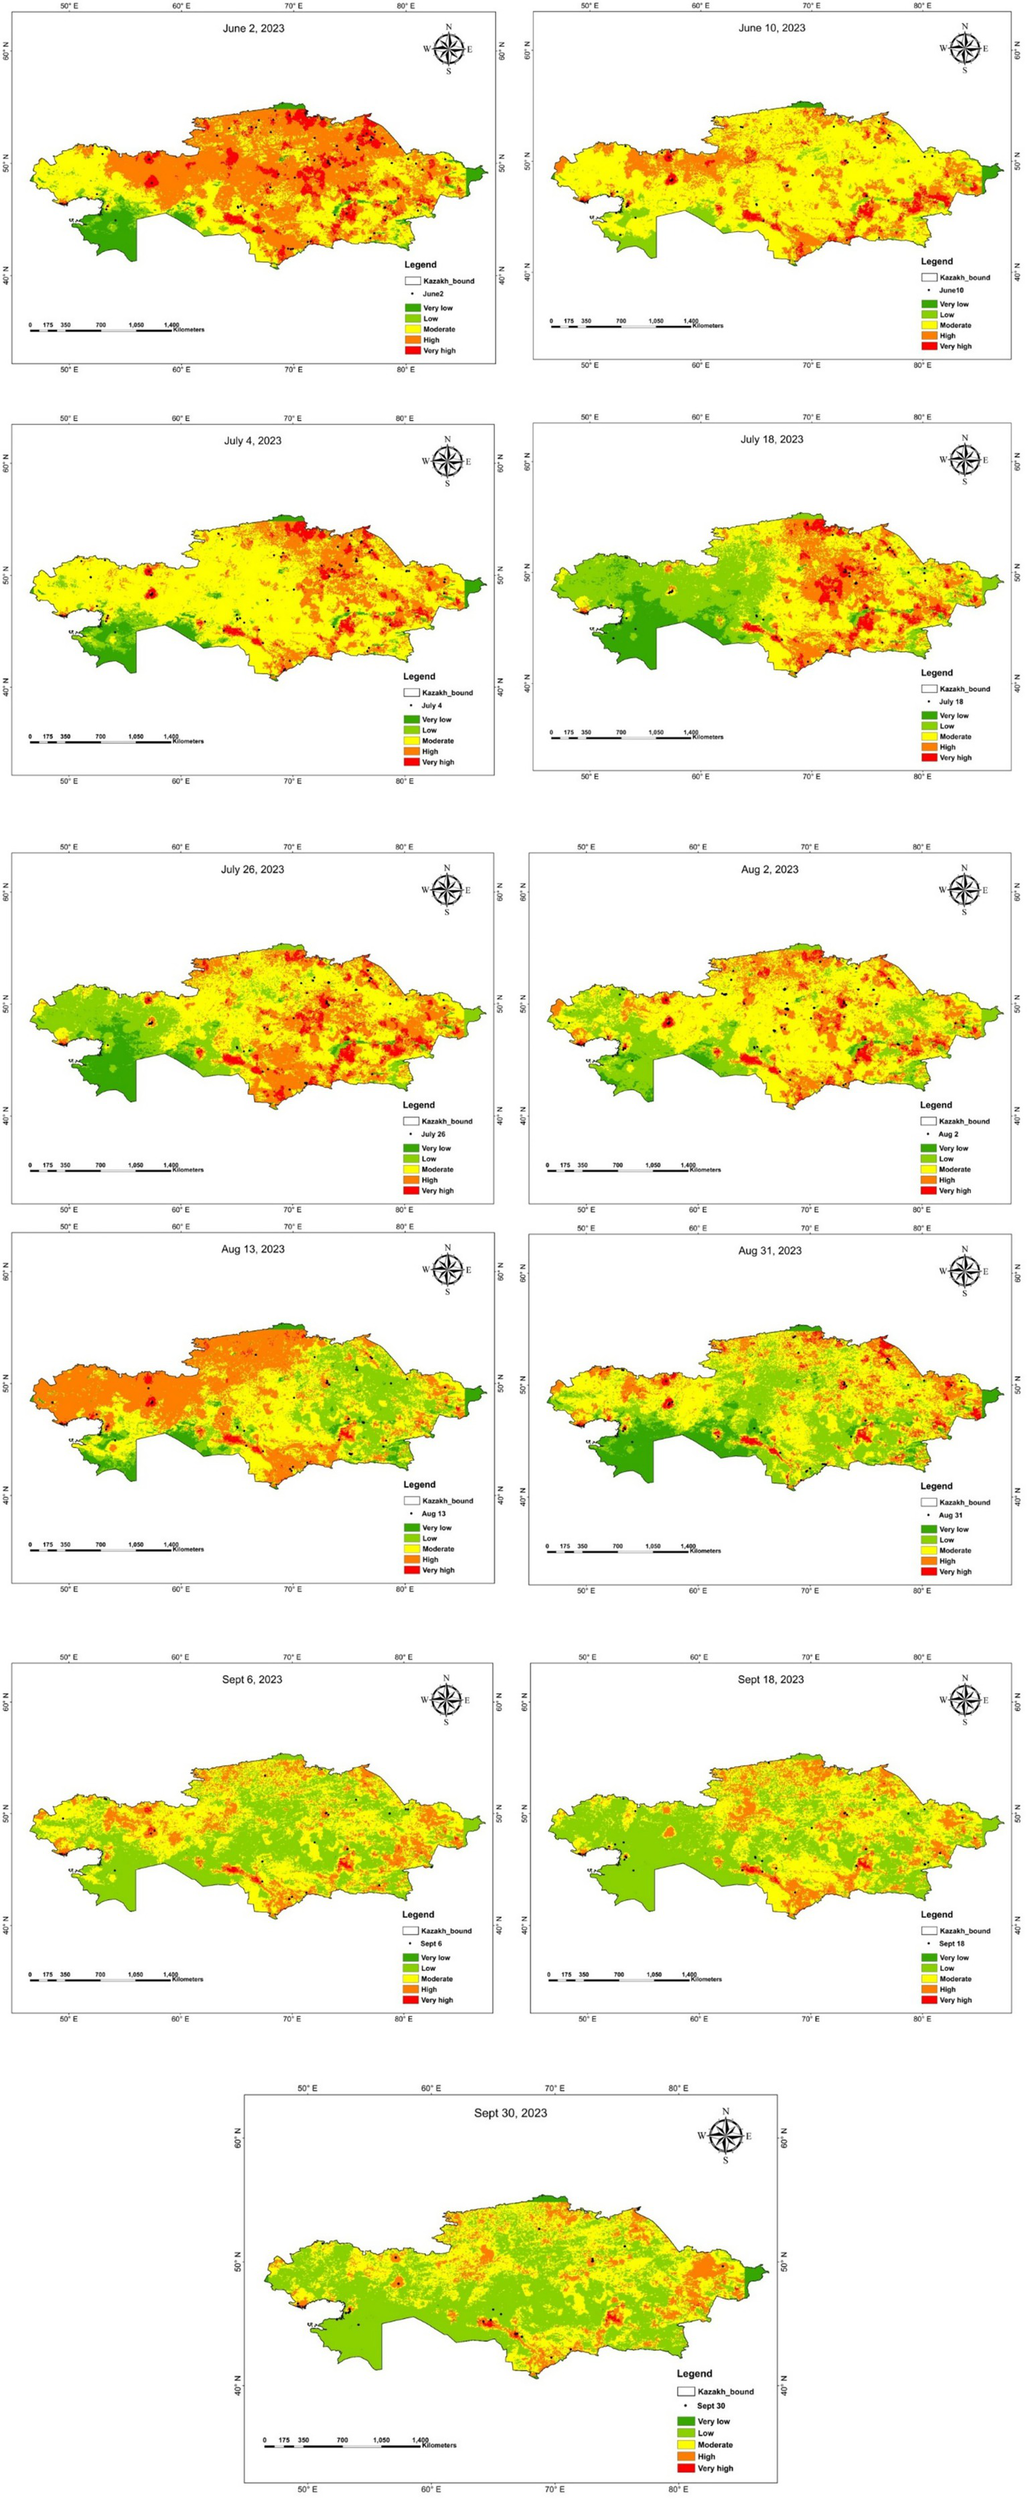
Fire risk maps overlaid with the corresponding day fire points (selected images).
Accuracy assessment of the SFRI will be conducted by comparing predicted fire risk classifications against observed fire occurrences derived from satellite-based fire detection datasets, specifically MODIS (MCD14) (Giglio et al., 2016; Babu et al., 2016). A contingency table (Table 3) displaying the frequency of fire incidents across the discretized risk categories (very low to very high) will be generated, providing a comprehensive examination of fire point distribution across various fire danger classes over the specified timeframe. This analysis will illuminate trends and patterns in fire occurrence, providing critical insights for effective fire management and prevention strategies. A positive correlation between observed fire incidence and predicted risk level is anticipated, with a concentration of fire events within the high to very high-risk classes (Babu and Roy, 2020). Understanding the temporal dynamics reflected in this distribution is crucial for developing adaptive management strategies responsive to fluctuating fire conditions.
Table 3
| Date | Very low | Low | Moderate | High | Very high | Accuracy (%) |
|---|---|---|---|---|---|---|
| Jun-02 | 1 | 2 | 27 | 210 | 56 | 98.99 |
| Jun-10 | 6 | 7 | 28 | 70 | 33 | 90.97 |
| Jul-04 | 4 | 3 | 43 | 105 | 36 | 96.34 |
| Jul-18 | 6 | 1 | 21 | 136 | 20 | 96.20 |
| Jul-26 | 0 | 5 | 19 | 65 | 6 | 94.74 |
| Aug-02 | 9 | 2 | 95 | 304 | 73 | 97.72 |
| Aug-13 | 5 | 10 | 26 | 28 | 43 | 86.61 |
| Aug-31 | 3 | 12 | 15 | 68 | 0 | 84.69 |
| Sep-06 | 3 | 7 | 7 | 35 | 0 | 80.76 |
| Sep-18 | 8 | 3 | 10 | 68 | 0 | 87.64 |
| Sep-30 | 8 | 4 | 9 | 43 | 4 | 82.35 |
Fire point distribution across fire danger classes and accuracies (selected).
The validation process comprises three steps: (1) spatial discretization of the study area into distinct fire risk zones based on the index output; (2) quantification of fire occurrences within each risk zone using MODIS active fire detection data; and (3) a binary classification of fire detections, where fires occurring within moderate, high, and very high-risk zones are considered correctly identified by the index, while those within low and very low-risk zones are deemed misclassifications (Babu et al., 2019). Preliminary analysis suggests an accuracy exceeding 80% during the fire season in Kazakhstan.
This binary classification approach is predicated on the heightened probability of fire occurrence in areas classified as moderate to very high risk, driven by contributing factors such as fuel availability, aridity, and meteorological conditions conducive to fire ignition and spread (Burgan et al., 1998). This assumption allows for a focused evaluation of the index’s performance in identifying fire occurrences within these critical zones. Overall, the accuracy of the fire risk model, determined by the percentage of correctly classified fire points, is generally high, indicating the effectiveness of the fire hazard index in predicting fire occurrences. However, periods characterized by highly variable weather conditions or significant shifts in fuel moisture can lead to reduced accuracy. These fluctuations underscore the importance of ongoing model refinement and validation to enhance predictive capability, particularly under dynamic environmental conditions.
The entire procedure for calculating the SFRI involves generating a raster surface from weather parameters, including temperature (T), relative humidity (RH), and wind speed (WS). This process entails calculating various components, such as the wind speed component, fuel moisture index, moisture content, fuel moisture function, Initial Spread Index, and fire weather index. Ultimately, the static fire hazard index is integrated to produce the SFRI in a Python environment, with sample output illustrated in Figure 4. These fire risk maps are uploaded daily to the website https://tabigat.gov.kz/ throughout the fire season in the region. A snapshot of the fire risk map is displayed in Figure 5. This map demonstrates the spatial distribution of fire risk across Kazakhstan, categorized into five hazard levels: very low, low, moderate, high, and very high, based on the calculated SFRI.
Figure 4
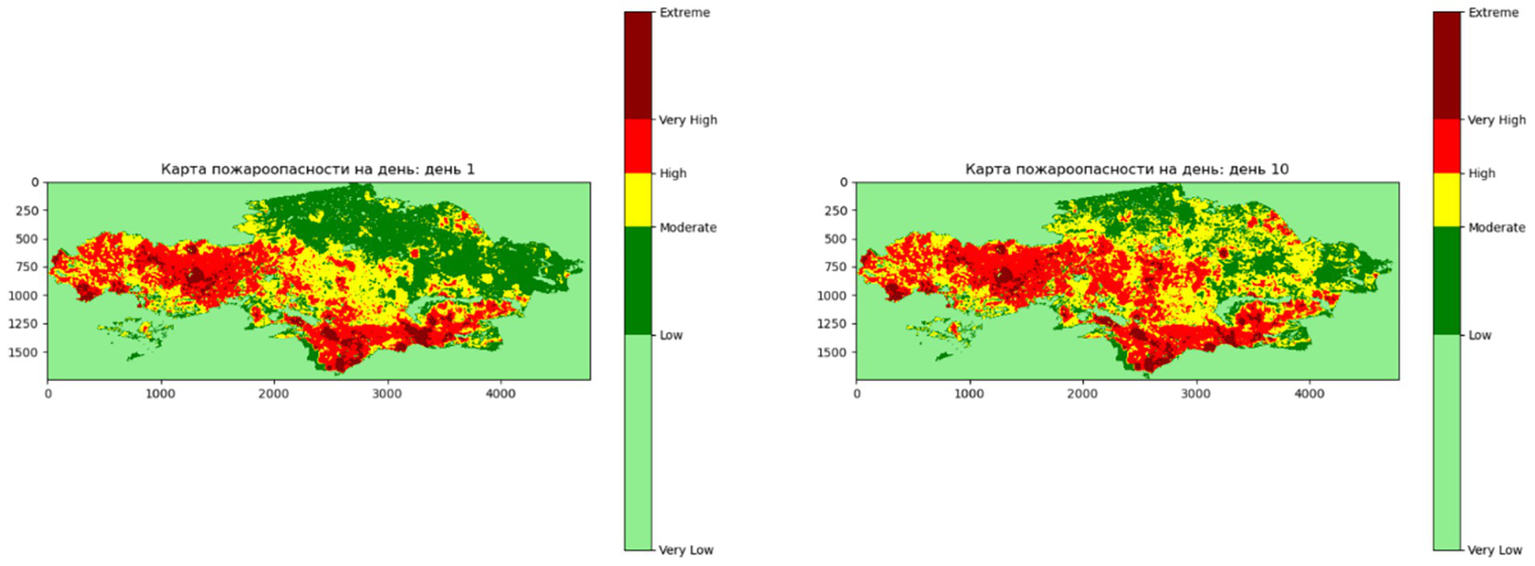
Daily Spatiotemporal Fire Risk Index (SFRI) outputs in python environment.
Figure 5
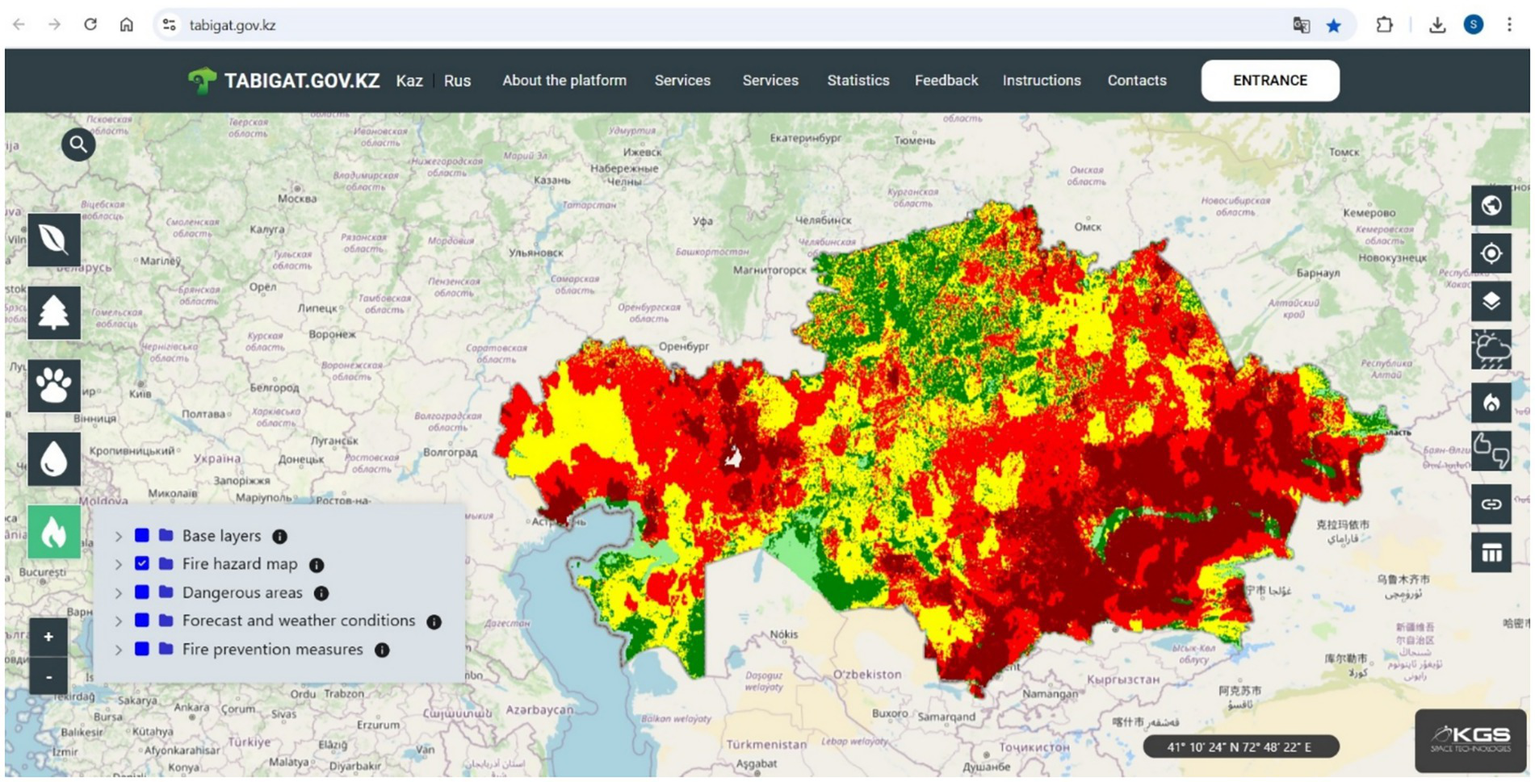
Snapshot of the fire risk map on 24th May, 2025 from the tabigat website (https://tabigat.gov.kz/).
4 Conclusion
This study demonstrates the development and application of a Spatiotemporal Fire Risk Index (SFRI) for Kazakhstan, combining static and dynamic factors to provide a comprehensive fire risk assessment. The static component, derived from a Random Forest model trained on terrain attributes, land cover, and historical fire data, represents the inherent fire susceptibility of the landscape. The dynamic component, a modified Canadian Fire Weather Index (FWI) incorporating satellite-derived Normalized Difference Vegetation Index (NDVI) and interpolated weather data, captures the influence of real-time meteorological conditions and fuel availability on fire risk. The integration of these components through an additive model allows for a more nuanced and accurate representation of fire hazard, accounting for both long-term landscape vulnerability and short-term weather-driven fluctuations.
Validation of the SFRI against observed fire occurrences from MODIS active fire detection datasets indicates a generally high accuracy, exceeding 80% during the 2023 fire season. The binary classification approach, focusing on the index’s ability to identify fires within moderate to very high-risk zones, underscores its effectiveness in predicting fire occurrences in areas with elevated fire potential due to fuel availability, aridity, and conducive meteorological conditions. The contingency table analysis, illustrating the distribution of fire incidents across discretized risk categories, confirms a positive correlation between predicted risk level and observed fire incidence, with a concentration of fire events within the higher risk classes.
While the overall accuracy is promising, periods of highly variable weather or significant shifts in fuel moisture can influence the index’s predictive capability. Further research and model refinement, including the exploration of alternative fuel moisture indices and advanced spatial interpolation techniques for meteorological data, may enhance the model’s robustness and adaptability to dynamic environmental conditions. The incorporation of real-time or near real-time fuel moisture data, derived from remote sensing or field observations, could further improve the accuracy of the dynamic component of the index. This SFRI is currently operational and accessible online during the fire season, providing valuable real-time information for fire management agencies in Kazakhstan. This resource enables more effective resource allocation, targeted prevention efforts, and proactive fire suppression strategies.
5 Future work
The Spatiotemporal Fire Risk Index (SFRI) will be enhanced in the future by incorporating more advanced and dynamic data sources, as well as machine learning techniques, to increase the accuracy of predictions and the practical utility of the index. One crucial area for our future work is dynamic fuel moisture. We plan to utilize data from the Sentinel-2 and Landsat 9 satellites, which offer superior spatial and temporal resolutions compared to the MODIS data used in this study. From these datasets, we will develop more precise dynamic fuel moisture content (FMC) indices, such as the Normalized Difference Moisture Index (NDMI) or other specialized indices. This advancement will enable near-real-time monitoring of live fuel moisture, providing a clearer picture of the landscape’s flammability compared to the static vegetation index. Additionally, we will explore the integration of more weather data, including real-time wind speed and direction, into the model to enhance our understanding of fire behavior and spread.
Statements
Data availability statement
Publicly available datasets were analyzed in this study. This data can be found at: https://search.earthdata.nasa.gov/.
Author contributions
KB: Writing – original draft, Writing – review & editing. SS: Writing – review & editing. GK: Writing – review & editing. KG: Writing – review & editing.
Funding
The author(s) declare that no financial support was received for the research and/or publication of this article.
Acknowledgments
Authors are grateful to the Joint Stock Company “National Company” “Kazakhstan Gharysh Sapary,” Astana, Kazakhstan for giving support during the research. The authors acknowledge the MODIS Science team for the Science Algorithms, the Processing Team for producing MODIS data, and the GES DAAC MODIS Data Support Team for making MODIS data available to the user community, NASA Earthdata team and FIRMS websites for free MODIS TERRA datasets and active fire data.
Conflict of interest
KG was employed by Joint Stock Company “National Company” “Kazakhstan Gharysh Sapary”.
The remaining authors declare that the research was conducted in the absence of any commercial or financial relationships that could be construed as a potential conflict of interest.
Generative AI statement
The authors declare that no Gen AI was used in the creation of this manuscript.
Any alternative text (alt text) provided alongside figures in this article has been generated by Frontiers with the support of artificial intelligence and reasonable efforts have been made to ensure accuracy, including review by the authors wherever possible. If you identify any issues, please contact us.
Publisher’s note
All claims expressed in this article are solely those of the authors and do not necessarily represent those of their affiliated organizations, or those of the publisher, the editors and the reviewers. Any product that may be evaluated in this article, or claim that may be made by its manufacturer, is not guaranteed or endorsed by the publisher.
Supplementary material
The Supplementary material for this article can be found online at: https://www.frontiersin.org/articles/10.3389/ffgc.2025.1680856/full#supplementary-material
References
1
Akther M. S. Hassan Q. K. (2011). Remote sensing-based assessment of fire danger conditions over boreal forest. IEEE J. Sel. Top. Appl. Earth Observ. Remote Sens.4, 992–999. doi: 10.1109/JSTARS.2011.2165940
2
Babu K. V. S. (2019). Developing forest fire danger index using geo-spatial techniques. Hyderabad: International Institute of Information Technology.
3
Babu K. V. S. Kabdulova G. Kabzhanova G. (2019). Developing the forest fire danger index for the country Kazakhstan by using geospatial techniques. J. Environ. Inform. Lett.1, 48–59. doi: 10.3808/jeil.201900006
4
Babu K. V. S. Roy A. (2020). Static fire danger estimation based on the historical Modis hotspot data using geospatial techniques for the Uttarakhand state, India. Int. Soc. Environ. Inf. Sci.4, 11–21. doi: 10.3808/jeil.202000038
5
Babu K. V. S. Roy A. Prasad P. R. (2016). Forest fire risk modeling in Uttarakhand Himalaya using TERRA satellite datasets. Eur. J. Remote Sens.49, 381–395. doi: 10.5721/EuJRS20164921
6
Babu K. V. S. Visser V. Moncrieff G. Slingsby J. Altwegg R. (2021). A machine learning algorithm approach to map wildfire probability based on static parameters. Environ. Sci. Proc.13:10. doi: 10.3390/IECF2021-10806
7
Bedia J. Herrera S. Gutiérrez J. M. Zavala G. Urbieta I. R. Moreno J. M. (2012). Sensitivity of fire weather index to different reanalysis products in the Iberian Peninsula. Nat. Hazards Earth Syst. Sci.12, 699–708. doi: 10.5194/nhess-12-699-2012
8
Bourlière F. A. R. I. D. Pimont F. Vega J. A. Chuvieco E. (2006). Spectral and spatial vulnerability assessment of fuel types to fire in a Mediterranean landscape. Int. J. Wildland Fire15, 41–52.
9
Burgan R. E. Klaver R. W. Klaver J. M. (1998). Fuel models and fire potential from satellite and surface observations. Int. J. Wildland Fire8, 159–170. doi: 10.1071/WF9980159
10
Chepashev D. Nurakynov S. Sharma D. Sydyk N. Kabdulova G. (2025). Mapping fire hazard potential in Kazakhstan: a machine learning and remote sensing perspective. Int. J. Wildland Fire34. doi: 10.1071/WF24232
11
Earthdata Search . (n.d.). Available online at: https://search.earthdata.nasa.gov/ (Accessed March 2, 2024)
12
Finney M. A. (1998). FARSITE, fire area simulator--model development and evaluation, vol. No. 4. Rocky Mountain Research Station: The Station.
13
Giglio L. Schroeder W. Justice C. O. (2016). The collection 6 MODIS active fire detection algorithm and fire products. Remote Sens. Environ.178, 31–41. doi: 10.1016/j.rse.2016.02.054
14
Global Forest Watch . Available online at: https://www.globalforestwatch.org/dashboards/country/KAZ/?category=fires (Accessed February 21, 2025).
15
Jain M. Saxena P. Sharma S. Sonwani S. (2021). Investigation of forest fire activity changes over the Central India domain using satellite observations during 2001–2020. GeoHealth5:e2021GH000528. doi: 10.1029/2021GH000528
16
Kenzhebayeva Z. Yeskendirova D. Omarova U. Kuntunova L. Sariyeva A. (2023). Preventing Forest fires using a wireless sensor network. GEOMATE J.25, 53–60.
17
Kharyutkina E. Moraru E. Pustovalov K. Loginov S. (2024). Lightning-ignited wildfires and associated meteorological conditions in Western Siberia for 2016–2021. Atmos.15:106. doi: 10.3390/atmos15010106
18
Kolluru V. (2024). Regional and landscape scale examination and attribution of vegetation changes to social-environmental system drivers in Kazakhstan. Brookings: University of South Dakota.
19
Kravchenko A. Bullock D. G. (1999). A comparative study of interpolation methods for mapping soil properties. Agron. J.91, 393–400. doi: 10.2134/agronj1999.00021962009100030007x
20
Moreno M. Steger S. Bozzoli L. Terzi S. Trucchia A. van Westen C. J. et al . (2025). Space-time data-driven modeling of wildfire initiation in the mountainous region of Trentino–South Tyrol, Italy. Vienna, Austria.
21
NASA, Fire information for resource management system . (n.d.). (FIRMS). Available online at: https://firms.modaps.eosdis.nasa.gov/ (Accessed March 10, 2024).
22
Sample M. Thode A. E. Peterson C. Gallagher M. R. Flatley W. Friggens M. et al . (2022). Adaptation strategies and approaches for managing fire in a changing climate. Climate10:58. doi: 10.3390/cli10040058
23
Scott J. H. Thompson M. P. Calkin D. E. (2012). Calculating and interpreting fire danger indices: US Department of Agriculture, Forest Service, Rocky Mountain Research Station.
24
Sharples J. J. McRae R. H. D. Weber R. O. Gill A. M. (2009). A simple index for assessing fuel moisture content. Environ. Model. Softw.24, 637–646. doi: 10.1016/j.envsoft.2008.10.012
25
Singh S. (2022). Forest fire emissions: a contribution to global climate change. Front. For. Glob. Change5:925480. doi: 10.3389/ffgc.2022.925480
26
Singh S. Babu K. V. S. (2021). “Forest fire susceptibility mapping for Uttarakhand state by using geospatial techniques” in Recent technologies for disaster management and risk reduction: Sustainable community resilience & responses P. K. Rai et al. (eds.) (Cham: Springer International Publishing), 173–188.
27
Stocks B. J. Mason J. A. Todd J. B. Bosch E. M. Wotton B. M. Amiro B. D. et al . (2002). Large forest fires in Canada, 1959–1997. J. Geophys. Res. Atmos.107:FFR-5. doi: 10.1029/2001JD000484
28
Suresh Babu K. V. Swati Singh G. Kabdulova K. G. Baktybekov G. (2024). Geospatial assessment of forest fire impacts utilizing high-resolution KazEOSat-1 satellite data. Front. For. Glob. Change7:1296100. doi: 10.3389/ffgc.2024.1296100
29
Taylor R. Marshall A. G. Crimp S. Cary G. J. Harris S. (2024). A statistical forecasting model for extremes of the fire behaviour index in Australia. Atmos.15:470. doi: 10.3390/atmos15040470
30
USGS Earth Explorer . (n.d.). Available online at: https://earthexplorer.usgs.gov/ (Accessed January 23, 2024).
31
Van Wagner C. E. (1987). Development and structure of the Canadian Forest fire weather index system. Headquarters, Ottawa: Canadian Forestry Service.
32
World Bank . (2021). Kazakhstan overview. Available online at: https://www.worldbank.org/en/country/kazakhstan/overview (Accessed December 20, 2023).
33
Xu Y. Lin Z. Wu C. (2021). Spatiotemporal variation of the burned area and its relationship with climatic factors in Central Kazakhstan. Remote Sens13:313. doi: 10.3390/rs13020313
34
Zagalikis G. (2023). “Remote sensing and GIS applications in wildfires” in Geographic information systems-data science approach (IntechOpen).
35
Zhanbossinova A. Mazhitova Z. Saktaganova Z. Atantayeva B. Kulshanova A. Akhmetova R. (2024). “Forests in Kazakhstan: issues of conservation and environmental safety” in E3S Web of Conferences, vol. 524 (Karshi, Uzbekistan: EDP Sciences), 02010.
36
Zong X. Tian X. Yin Y. (2020). Impacts of climate change on wildfires in Central Asia. Forests11:802. doi: 10.3390/f11080802
Summary
Keywords
fire risk, MODIS, FWI, SFRI, Random Forest
Citation
Babu KVS, Singh S, Kabdulova G and Gulnara K (2025) A novel framework for fire risk assessment in Kazakhstan: integrating machine learning and remote sensing. Front. For. Glob. Change 8:1680856. doi: 10.3389/ffgc.2025.1680856
Received
06 August 2025
Accepted
08 October 2025
Published
05 November 2025
Volume
8 - 2025
Edited by
Himanshu Bargali, Indian Institute of Forest Management, India
Reviewed by
Venkata Sai Krishna Vanama, Esri India Technologies Pvt. Ltd., India
Saleem Khan, Compliance Kart Pvt. Ltd., India
FX Anjar Tri Laksono, Universitas Jenderal Soedirman Teknik Geologi, Indonesia
Updates
Copyright
© 2025 Babu, Singh, Kabdulova and Gulnara.
This is an open-access article distributed under the terms of the Creative Commons Attribution License (CC BY). The use, distribution or reproduction in other forums is permitted, provided the original author(s) and the copyright owner(s) are credited and that the original publication in this journal is cited, in accordance with accepted academic practice. No use, distribution or reproduction is permitted which does not comply with these terms.
*Correspondence: K. V. Suresh Babu, sureshbabu.iiith@gmail.com
Disclaimer
All claims expressed in this article are solely those of the authors and do not necessarily represent those of their affiliated organizations, or those of the publisher, the editors and the reviewers. Any product that may be evaluated in this article or claim that may be made by its manufacturer is not guaranteed or endorsed by the publisher.