Abstract
Recent global warming has driven substantial changes in terrestrial vegetation, yet long-term global patterns remain insufficiently characterized. The Normalized Difference Vegetation Index (NDVI) provides a robust measure for assessing vegetation dynamics, and previous studies have reported regionally varying greening and browning trends. To further clarify these global-scale vegetation responses, this study examined NDVI changes from 1982 to 2022 and classified long-term NDVI variability using a frequency-based k-means clustering approach. Analyses revealed increasing NDVI trends in Europe, western Russia, India, China, and Central Africa, while declines were observed in Canada, South America, South Africa, and eastern Central Asia. Arid and semi-arid regions maintained persistently low NDVI values, whereas high-latitude tundra and transitional ecosystems showed strong seasonal variability and extended growing seasons associated with rising temperatures. Subtropic–midlatitude humid regions exhibited seasonal cycles linked to cropping activities, and tropical rainforests maintained high NDVI levels but showed increasing temporal variability. The k-means classification further indicated that vegetation functional diversity has increased under warming and hydrological intensification, alongside a general extension of vegetation growth periods—including earlier spring green-up and delayed autumn senescence. These findings highlight distinct global patterns of vegetation–climate interactions and provide an improved basis for interpreting ecosystem responses to ongoing climate change. Future research incorporating process-based models and climate feedback mechanisms will be essential for understanding the long-term implications of these observed shifts.
1 Introduction
Global climate is a key factor determinant of the global distribution of plant biomes influencing its composition, abundance, and evolution (Woodward et al., 2004). Conversely, vegetation affects meteorological phenomena by altering surface energy balances through hydrological, radiometric, aerodynamical properties, and by modifying greenhouse gas emissions and uptake, thereby contributing to climate change (Guo et al., 2022). Climate change has been reported to promote vegetation growth in some regions due to rising temperatures and changes in precipitation patterns, making environmental conditions more favorable (Fensholt and Proud, 2012; Eitzinger et al., 2013; Piao et al., 2020). Vegetation greening has also been found to be influenced by atmospheric CO2 fertilization, socioeconomic factors, along with land-use changes and climate variability (Liu et al., 2022; Han et al., 2023; Liu et al., 2024a). These interactions between vegetation and climate play a critical role in long-term evolutions of both ecosystem and climate systems. Global climate change not only drives localized vegetation shifts but also alters ecosystem structure and function, forming a complex feedback loop that, in turn, influences climate itself (Parmesan and Yohe, 2003). Effectively monitoring these interactions is essential for developing climate adaptation strategies.
Satellite-based vegetation indices, such as the Normalized Difference Vegetation Index (NDVI; Huang et al., 2021) and Enhanced Vegetation Index (EVI, Jiang et al., 2008), have become a key means of long-term monitoring global ecosystem changes. As a global study, Brown et al. (2012) analyzed 26 years of satellite-derived NDVI data and found that the growing season length has been increasing in 27% of global cropland areas, positively impacting agricultural productivity. Liu et al. (2015) noted that temperature increases promote NDVI growth in humid regions, whereas in arid regions, precipitation is the primary driver, and rising temperatures can even cause NDVI decline. Guo et al. (2022) reported that NDVI values are positively correlated with temperature and precipitation in 66 and 63% of global areas, respectively. Unlike global vegetation studies, regional studies provide detailed insights into how specific environmental conditions influence vegetation dynamics. In North America, NDVI exhibits a strong positive correlation with precipitation (Los et al., 2001), while its responses vary by region due to changes in temperature and precipitation, highlighting the complex interactions among climate factors (Gim et al., 2020). In South America, reduced precipitation in the Amazon rainforest has led to NDVI declines, particularly during El Niño (ENSO) events (Hilker et al., 2014). In Northern Europe, rising spring temperatures have been shown to drive NDVI increases, especially in grasslands and shrublands (Kelsey et al., 2021). Liu et al. (2024b) reported that NDVI fluctuations in Central African rainforests are more closely linked to solar radiation than precipitation. In East Asia, Liu et al. (2023) found that soil moisture plays a crucial role in NDVI changes in the northwest arid area, whereas warming trends enhance NDVI growth in the southeast humid area. In India, Thenkabail et al. (2009) reported that NDVI declines significantly in years with low precipitation, particularly in agricultural areas. In Australia, Burton et al. (2024) observed that southern region experiences earlier NDVI peaks due to rising temperatures, while northern and tropical regions exhibit delayed NDVI peaks, likely driven by changing precipitation patterns.
Previous studies have primarily analyzed NDVI in relation to climate variables (Wu et al., 2018; Yang et al., 2019). However, this approach may oversimplify ecosystem dynamics, as vegetation change is driven by complex interactions among multiple environmental and biological factors rather than by a single variable (Zhang et al., 2020; Wang and Liu, 2022). In natural ecosystems, vegetation responds through interconnected chain effects within the community, which unfold over long time scales (Parmesan and Yohe, 2003; Piao et al., 2019). Therefore, to capture the true dynamics of vegetation, especially for perennial species whose responses to multi-year climate variations emerge gradually, NDVI should be examined in terms of its long-term variability and frequency characteristics rather than short-term fluctuations.
To address this issue, this study analyzes the frequency distribution of NDVI values for each pixel over a 41-year period (1982–2022) by transforming its time series into a histogram. This histogram serves as a unique fingerprint representing the long-term variability pattern and frequency structure of NDVI at each location. Consequently, even within the same ecosystem type, pixels can be classified into distinct clusters according to differences in NDVI variability and frequency composition. After identifying clusters with similar NDVI variation patterns, we characterize the climate regimes associated with each class. This sequencing treats climate variables as a contextual factor rather than assuming that NDVI variability is a deterministic response to it, reduces collinearity among potential drivers, and allows similar vegetation behaviors to emerge across ecologically distinct regions. By inverting the conventional direction of analysis, this approach enables a more holistic understanding of vegetation–climate coupling and provides a systematic and quantitative framework for assessing how long-term climate change affects vegetation dynamics. Ultimately, this framework is expected to enhance our understanding of climate-vegetation interactions and improve predictions of ecosystem responses to future climate change.
2 Data and methods
2.1 Data
The NDVI is an index obtained by dividing the difference between near-infrared channel (e.g., 0.725–1.10 μm) and red channel (e.g., 0.58–0.68 μm) by the sum of these channels (Pinzon and Tucker, 2014). Because near-infrared reflectance is distinctively larger than red reflectance for photosynthetically healthy plant parts, the NDVI can quantify the abundance of living vegetation (Goward et al., 1985). This study utilized the NDVI data from the Global Inventory Modeling and Mapping Studies-3rd Generation V1.2 (GIMMS-3G+) dataset (Pinzon et al., 2023; https://doi.org/10.3334/ORNLDAAC/2187), which was generated based on long-term measurements of the Advanced Very High Resolution Radiometer (AVHRR) onboard various polar orbiting satellite platforms (e.g., NOAA, MetOp series). Since bias corrections for long-term satellite data were applied, this dataset is well-suited for analyzing global vegetation index trends in relation to climate change. The GIMMS-3G + data processing included cross-sensor calibration, normalization for orbital drift and view angle, corrections for volcanic and stratospheric aerosols, and rigorous cloud screening. The final dataset was obtained from the 14–16-day maximum-value composite to further suppress residual cloud contamination, generating NDVI values twice per month. The GIMMS 3G + dataset has a spatial resolution of 0.0833° × 0.0833° (Pinzon and Tucker, 2014). To minimize the influence of snow-dominated polar environments on vegetation data, this study focuses on the region between 70°N and 60°S.
To explain the spatiotemporal variation in vegetation, climate variables (e.g., 2-m temperature, 2-m relative humidity, precipitation, solar radiation, and cloud cover) were analyzed using Agrometeorological Indicators from the Copernicus Climate Change Service (Boogaard et al., 2020; https://doi.org/10.24381/cds.6c68c9bb). This dataset was derived from the European Center for Medium-Range Weather Forecasts Reanalysis v5 (ERA5; Hersbach et al., 2023) commonly known as AgERA5. The AgERA5 data has a spatial resolution of 0.1° × 0.1° and a daily temporal resolution. To ensure consistency between GIMMS-3G + and AgERA5 data, NDVI and climate data were converted into the same 0.25° × 0.25° resolution. For the land area between 60°S and 70°N, a total of 223,734 grids were analyzed in this study.
2.2 Methods
The response of NDVI to climate change over the 41-year period (1982–2022) was investigated by analyzing the spatial distributions of the climatological mean and linear trends for NDVI and five climate variables (2-m temperature, 2-m relative humidity, precipitation, solar radiation, and cloud cover). To explore the relationships between vegetation dynamics and climate factors, we conducted a correlation analysis using the Pearson correlation coefficient. This analysis was based on the 41-year climatological mean distributions of the NDVI and five climate variables. These spatial climatology’s capture co-spatial associations at the multi-decadal scale but are not intended for causal attribution; they are complemented by analyses of and long-term trends and seasonal cycles. In order to examine vegetation and climate changes, the linear trend during 41 years was calculated using ordinary least squares (OLS) regression for each grid. The OLS regression was performed using the linregress function from the SciPy. Stats module in Python, which computes the slope, intercept, correlation coefficient, p-value, and standard error for each grid cell. Before calculating the linear trend, seasonal component was removed by subtracting the monthly mean climatology during 41 years for each grid cell.
The primary findings of this study were derived from k-means clustering, a widely used unsupervised learning algorithm for analyzing large datasets. For the k-means clustering, we prepared the annual frequency of NDVI for the period of 1982–2012. Because 223,734 grid points were used in this study, the annual frequencies of NDVI are available at each of the 223,734 grid points. These points can be objectively classified serval types using k-means clustering. The optimal number of clusters (k) was determined using the Calinski–Harabasz Index (CHI), which quantifies the ratio of between-cluster dispersion to within-cluster cohesion. From Figure 1, we determined the optimal k to be eight because it yielded the maximum CHI value and, consequently, the most balanced partitioning. The spatial distributions and time series of eight NDVI variation types were basically analyzed. The mean and standard deviation of NDVI and five climate variables for eight types were investigated in form of time series during 41 years and monthly variations.
Figure 1
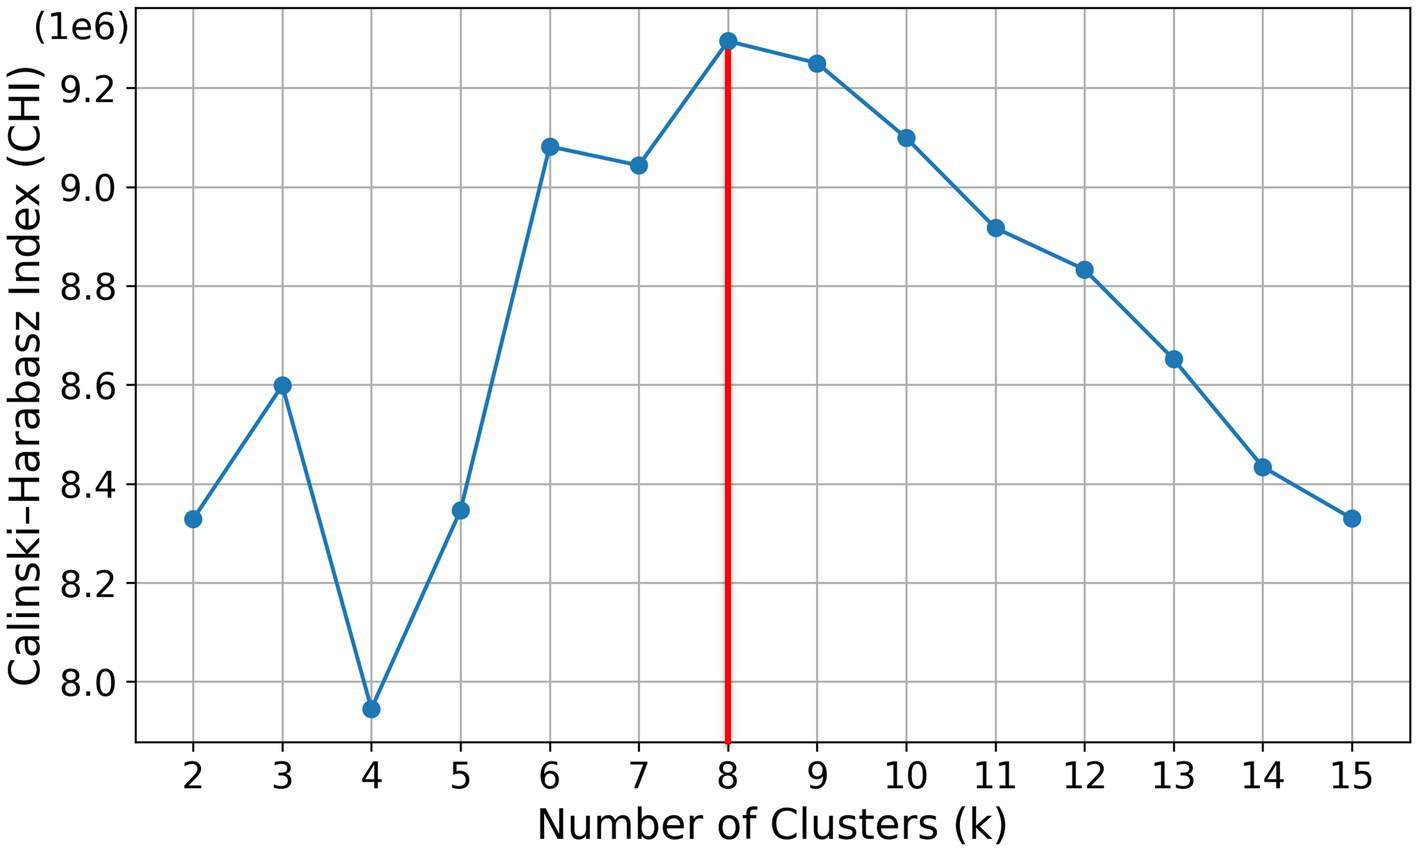
Calinski–Harabasz index (CHI) as a function of the number of clusters (k) for k-means solutions (k = 2–15). The CHI peaks at k = 8 (red line), indicating the optimal cluster number.
3 Results and discussion
3.1 Global mean distributions
The spatial distributions of the long-term average (1982–2022) of NDVI and five-climate variables are presented in Figure 2. The NDVI values are the highest (above 0.9) in the Amazon, Central Africa, and Southeast Asia (Figure 2a), while the Middle Eastern deserts, Central Asia, and the western part of parts of China and Mongolia exhibit low NDVI values below 0.15. These findings are consistent with those reported in previous studies (Tian et al., 2015; Song et al., 2018; Guo et al., 2022). 2-m temperature is generally high in equatorial regions, with mean values around 300 K, and lower in high-latitude areas, where temperatures average approximately 270 K (Figure 2b). The pattern correlation between mean NDVI and temperature distributions is 0.36. Warm temperatures promote vegetation growth in wet regions (Song et al., 2018), but in dry and arid areas, vegetation tends to decline as temperatures rise (Julien and Sobrino, 2009; Rahimi et al., 2025). Specifically, NDVI values near the equator, where temperatures are high, exhibit noticeable variations. The correlation between mean NDVI and precipitation is 0.38, suggesting that that precipitation is just as important as temperature in determining vegetation growth (Guo et al., 2022). Heavy precipitation is concentrated in tropical rainforests and Southeast Asia (Figure 2c), where NDVI values are also high. Several studies have indicated that precipitation was strongly correlated with increases in the vegetation index (Yang et al., 2019; Liu et al., 2022; Rahimi et al., 2025), especially for the dry region. Downward solar radiation at the surface (i.e., solar radiation) is a crucial factor in plant photosynthesis. However, because its effect on the vegetation can be complex depending on vegetation type cloud scattering, the correlation between mean NDVI and solar radiation is 0.15 (Figure 2d). Thick clouds strongly block solar radiation, reducing total irradiance while increasing the proportion of diffuse radiation and transmitting some sunlight (Schwander et al., 2002; Bernhard et al., 2004). Similar to solar radiation, the correlation of mean NDVI and cloud cover is 0.2 (Figure 2e). Relative humidity near the surface (i.e., 2-m relative humidity) serves as an indicator of surface moisture and directly influences plant transpiration (Song et al., 2020). The correlation between mean NDVI and relative humidity distributions is 0.25 (Figure 2f). The spatial distribution of relative humidity is also well correlated with solar radiation (0.91) and cloud cover (−0.78), suggesting that overall effects of these variables determine vegetation growth.
Figure 2
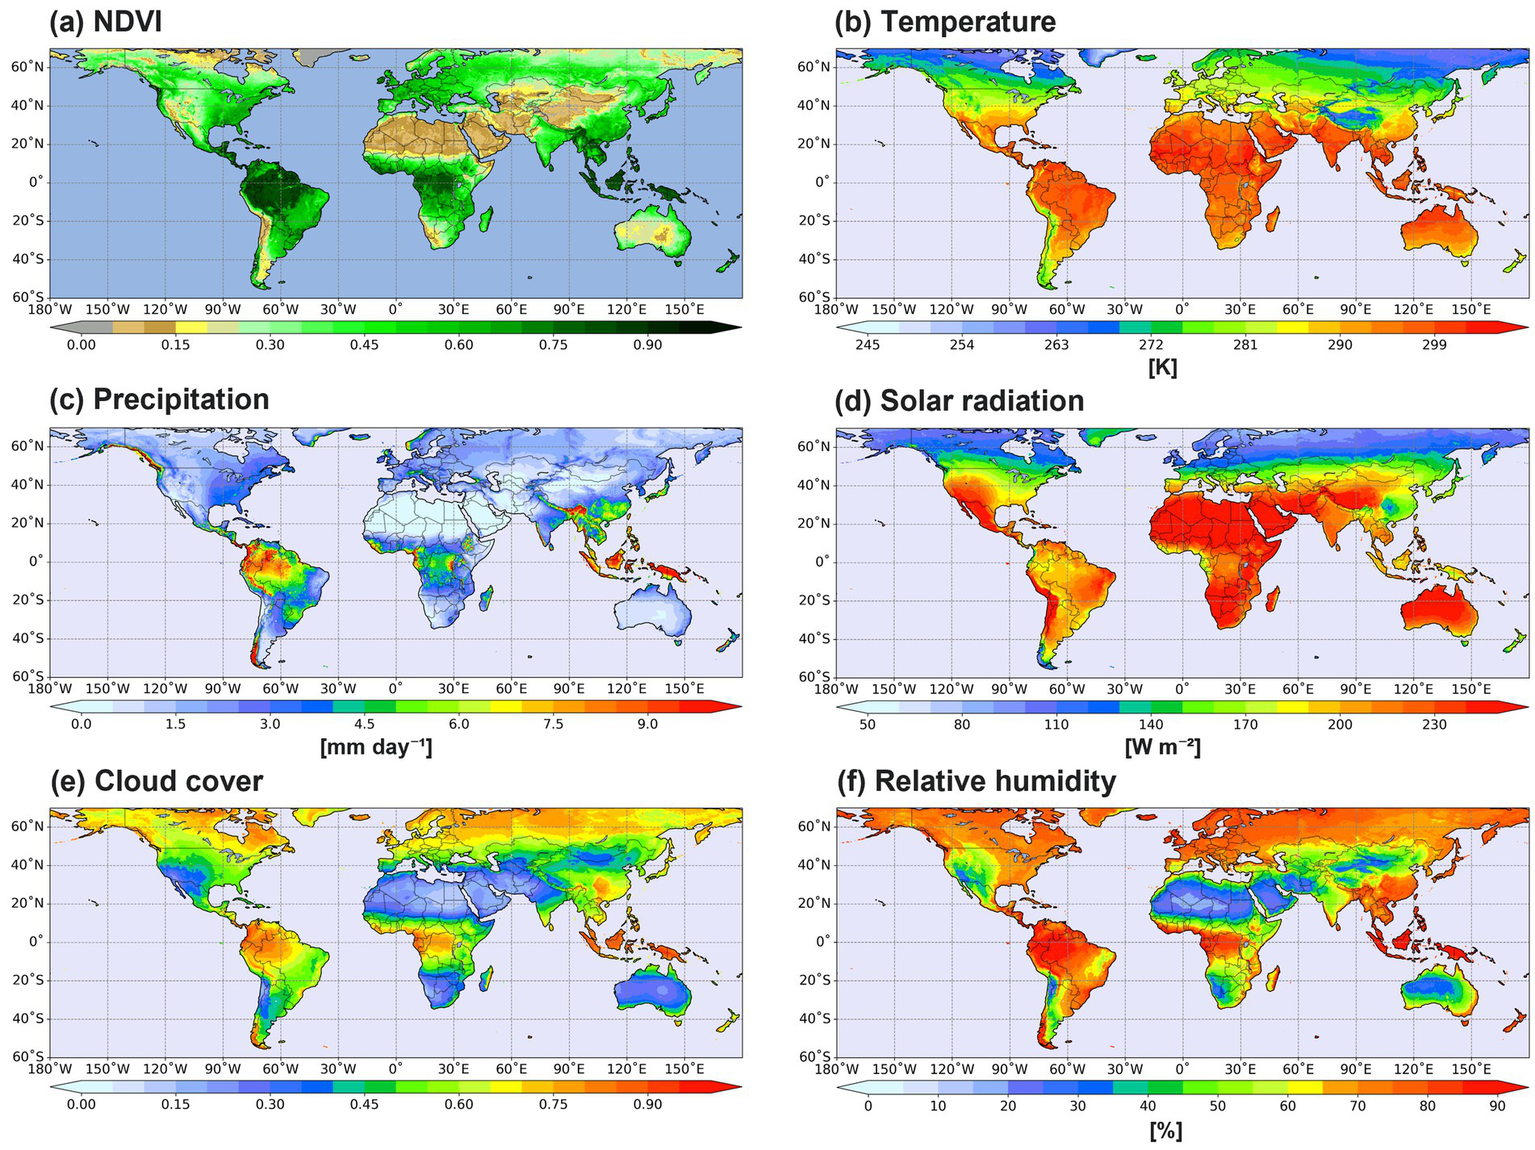
Global mean distributions of (a) NDVI, (b) 2-m temperature, (c) precipitation, (d) solar radiation, (e) cloud cover, and (f) 2-m relative humidity for the period of 1982–2022.
3.2 Linear trend distributions
Figure 3 illustrates the spatial distribution of the linear trend (slope) of NDVI and climate variables over the 41-year period (1982–2022). The slope was derived from the pixel-wise OLS regression of each variable against time, with year (time) scaled from 1 to 41. The estimated slopes represent the rate of change per year and are mapped accordingly. Overall, NDVI exhibits an increasing trend, particularly in Europe, western Russia, India, China, and central Africa. Conversely, a declining NDVI trend is observed in Canada, South Africa, South America, and the Central Asia (Figure 3a). These NDVI trends align with previous studies (Fensholt and Proud, 2012; Liu et al., 2015; Liu et al., 2022). Although vegetation is influenced by various climate factors, it is essential to examine the trends of individual climate variables. Surface temperature exhibits a global increasing trend, with particularly pronounced warming in the high-latitude regions of the Northern Hemisphere (Figure 3b). Such global warming trend is closely related with the enhanced vegetation growth over the Europe and the western part of Russia. In high latitude regions with climatically cold temperatures (Figure 2b), global warming is thought to have a positive effect on vegetation growth. The increasing precipitation trend in India is positively correlated with the NDVI trend, while decreasing precipitation and NDVI trends are evident in South America, South Africa, and the western part of Central Asia (Figure 3c). By contrast, the increasing NDVI trend is found in the southern part of China despite the decreasing precipitation trend (Figure 3c). Because the southern part of China is characterized by heavy precipitation and humid environment as a part of the East Asian monsoon (Song and Sohn, 2015), the decreasing precipitation would not interfere with vegetation growth in the southern part of China. Rather, the increasing solar radiation is positively correlated with the increasing NDVI trend in the southern part of China (Figure 3d). The solar radiation trend (Figure 3d) is inversely correlated with precipitation, cloud cover, and relative humidity trends (Figures 3c,e,f).
Figure 3
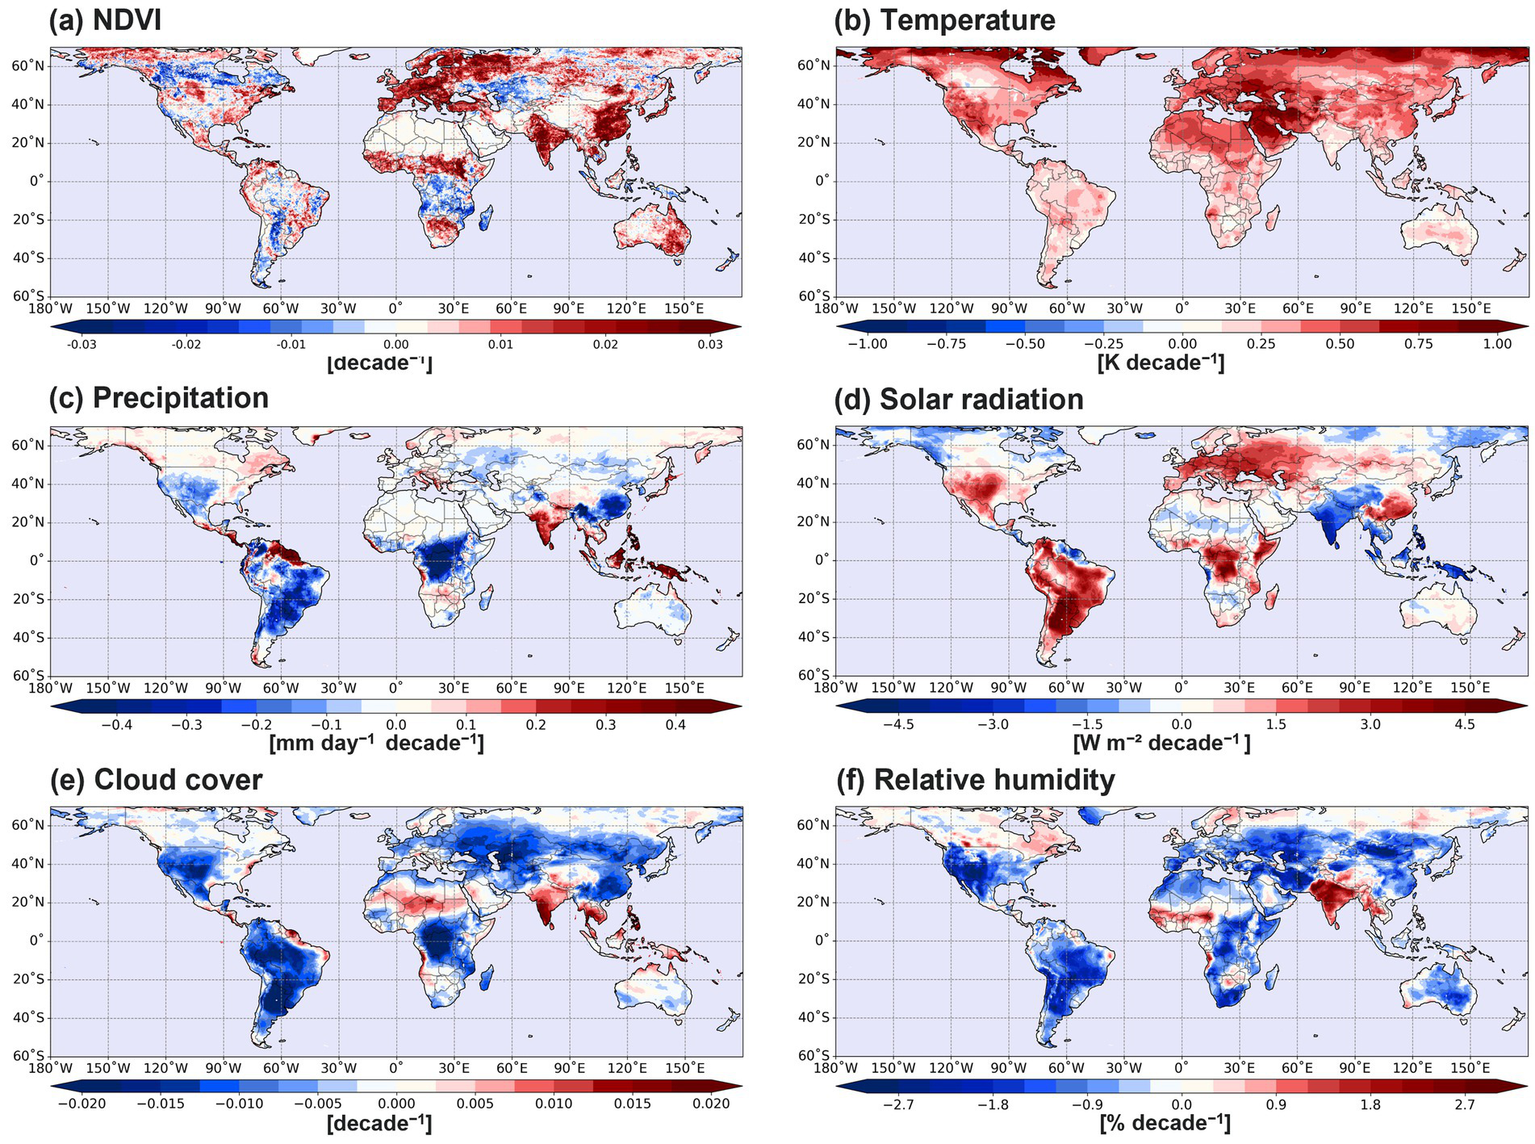
Linear trend distributions of (a) NDVI, (b) 2-m temperature, (c) precipitation, (d) solar radiation, (e) cloud cover, and (f) 2-m relative humidity for the period of 1982–2022.
3.3 NDVI variation types
Based on the temporal variation in NDVI annual frequency, the k-means clustering analysis identifies eight distinct types. Each type represents a group of areas with similar NDVI fluctuations over 41 years and is depicted using different color scales (Figure 4a). Type 1 accounts for 3.19% of global land area and corresponds to an extremely dry region (i.e., desert) with consistently 0.1 NDVI values and minimal variability. This type is primarily distributed across western China, Mongolia, Iran, Arabian Peninsula, and the deserts of Chile (Figure 4b). Because these desert areas have extremely low precipitation (Figure 2c), vegetation growth is highly suppressed. Type 2 covers 8.35% of the land area and it also corresponds to another desert type that NDVI values predominantly range between 0.1 and 0.2, indicating slightly higher NDVI values compared to Type 1 (Figure 4c). This type is distributed over the Sahara, Arabian Peninsula, and several deserts. Type 3 spans 10.04% of the land area and represents semi-arid desert regions such as the Australia, Argentina, Namibia, Republic of South Africa, and the western part the United States along with the surrounding areas of Type 2 (Figure 4d). Type 3 exhibits relatively higher NDVI values compared to Type 1 and Type 2 due to more precipitation in the Type 3 region (Figure 2c). In Type 3, the occurrence of NDVI smaller than 0.1 or larger than 0.25 is becoming more frequent during recent decades, indicating that the polarization of vegetation is increasing. Those results are consistent with the NDVI variation results over Australia region (Burton et al., 2024). Type 4 covers 17.74% of the land area and is distributed across high-latitude tundra regions such as Russia, Greenland, Canada, and Alaska (Figure 4e). This type is characterized by the unique NDVI distributions that most are concentrated at 0–0.05 and exhibit an even frequency over 0.05–0.8. Because high latitude regions have extremely cold temperature and permanent snow cover in winter, the winter environment severely inhibits vegetation growth and thus NDVI values approach zero. Since 2012, NDVI frequencies in the 0.05–0.15 range have significantly increased, while the occurrence of NDVI values between 0.2 and 0.6 has slightly declined. This decline is attributed to forest loss caused by wildfires, particularly between the 2000s and 2012, when forests decreased by approximately 0.3 Mha per year (Schaphoff et al., 2016). The increasing NDVI trend in the 0.05–0.15 range is likely attributable to permafrost reduction and the subsequent expansion of herbaceous plants and shrubs (Wang and Liu, 2022; Frigo et al., 2023). Additionally, permafrost melting appears to have led to lake formation, which has contributed to an increase in the frequency of NDVI values near zero (Chen et al., 2021). It may also be linked to the early stages of ecological succession following wildfires where herbaceous plants and broadleaf trees proliferate (Fiore et al., 2020). Type 5 is the most frequent (28.53%) among eight types and dominantly found southward (i.e., warmer temperature) around the Type 4 over the Eurasia and North America continents (Figure 4f). Type 5 also exhibits a strong seasonal variability in NDVI values such as Type 4, whereas the NDVI distribution of Type 5 is mostly concentrated over the range of 0.2 to 0.4 significantly different from that of Type 4. In Type 5, the NDVI frequency of 0.2–0.4 has declined while the frequency around 0.8 is increasing (i.e., enhanced vegetation diversity). The decreasing NDVI frequencies of 0.2–0.4 can be attributed to climate change and land-use changes in Siberia, leading to the afforestation of steppe regions (Kirpotin et al., 2021). The increasing NDVI frequencies around 0.8 may be attributed to extended spring–autumn seasons and prolonged leaf retention, driven by warming temperatures (Piao et al., 2019; Zhang et al., 2020; Huang et al., 2023). Type 6 accounts for 12.02% of the total land area and is primarily distributed across single- and double-cropping agricultural regions in the Northern Hemisphere, South America, India, and Northeast Asia (Biradar and Xiao, 2011; Qiu et al., 2014; Andrade and Satorre, 2015) with some coverage in Australia, Africa, and Russia’s evergreen forests. In Type 6, NDVI values are primarily distributed between 0.4 and 0.6, with smaller seasonal variability compared to Type 5. However, since the 2010s, NDVI values in Type 6 have declined from around 0.4 compared to 1982. Type 7 covers 12.77% of the land area (Figure 4h), including regions with dense vegetation in Europe and southern China, as well as multi-cropping agricultural zones in North and South America, and Africa (Thenkabail et al., 2009; Waha et al., 2020). The NDVI values of Type 7 are frequently found in the 0.6–0.8 range, with smaller seasonal variability, similar to Type 6. In contrast to single- and double-cropping regions (Type 6), where precipitation and solar radiation are key factors for vegetation growth, multi-cropping regions (Type 7) exhibit an increasing trend in NDVI values greater than 0.6 (Wu et al., 2018; Waha et al., 2020). The increasing NDVI trend of Type 7 is mostly attributed to the southern China and European regions and it might be related with the improved agricultural technology and enhanced crop productivity (Supit et al., 2010; Eitzinger et al., 2013; Qiu et al., 2022). Additionally, Type 7 regions are located near tropical rainforests, serving as ecotones where vegetation dynamics are influenced by both agricultural activities and shifting climatic conditions. Type 8 is 7.36% of the land area and encompasses tropical rainforest regions, including the Amazon, Central Africa, and Southeast Asia (Figure 4i). This type is characterized by the heightened NDVI values, consistently exceeding 0.8. Warm temperature and abundant precipitation conditions (Figures 2b,c) can sustain dense vegetation such as tropical rainforest.
Figure 4
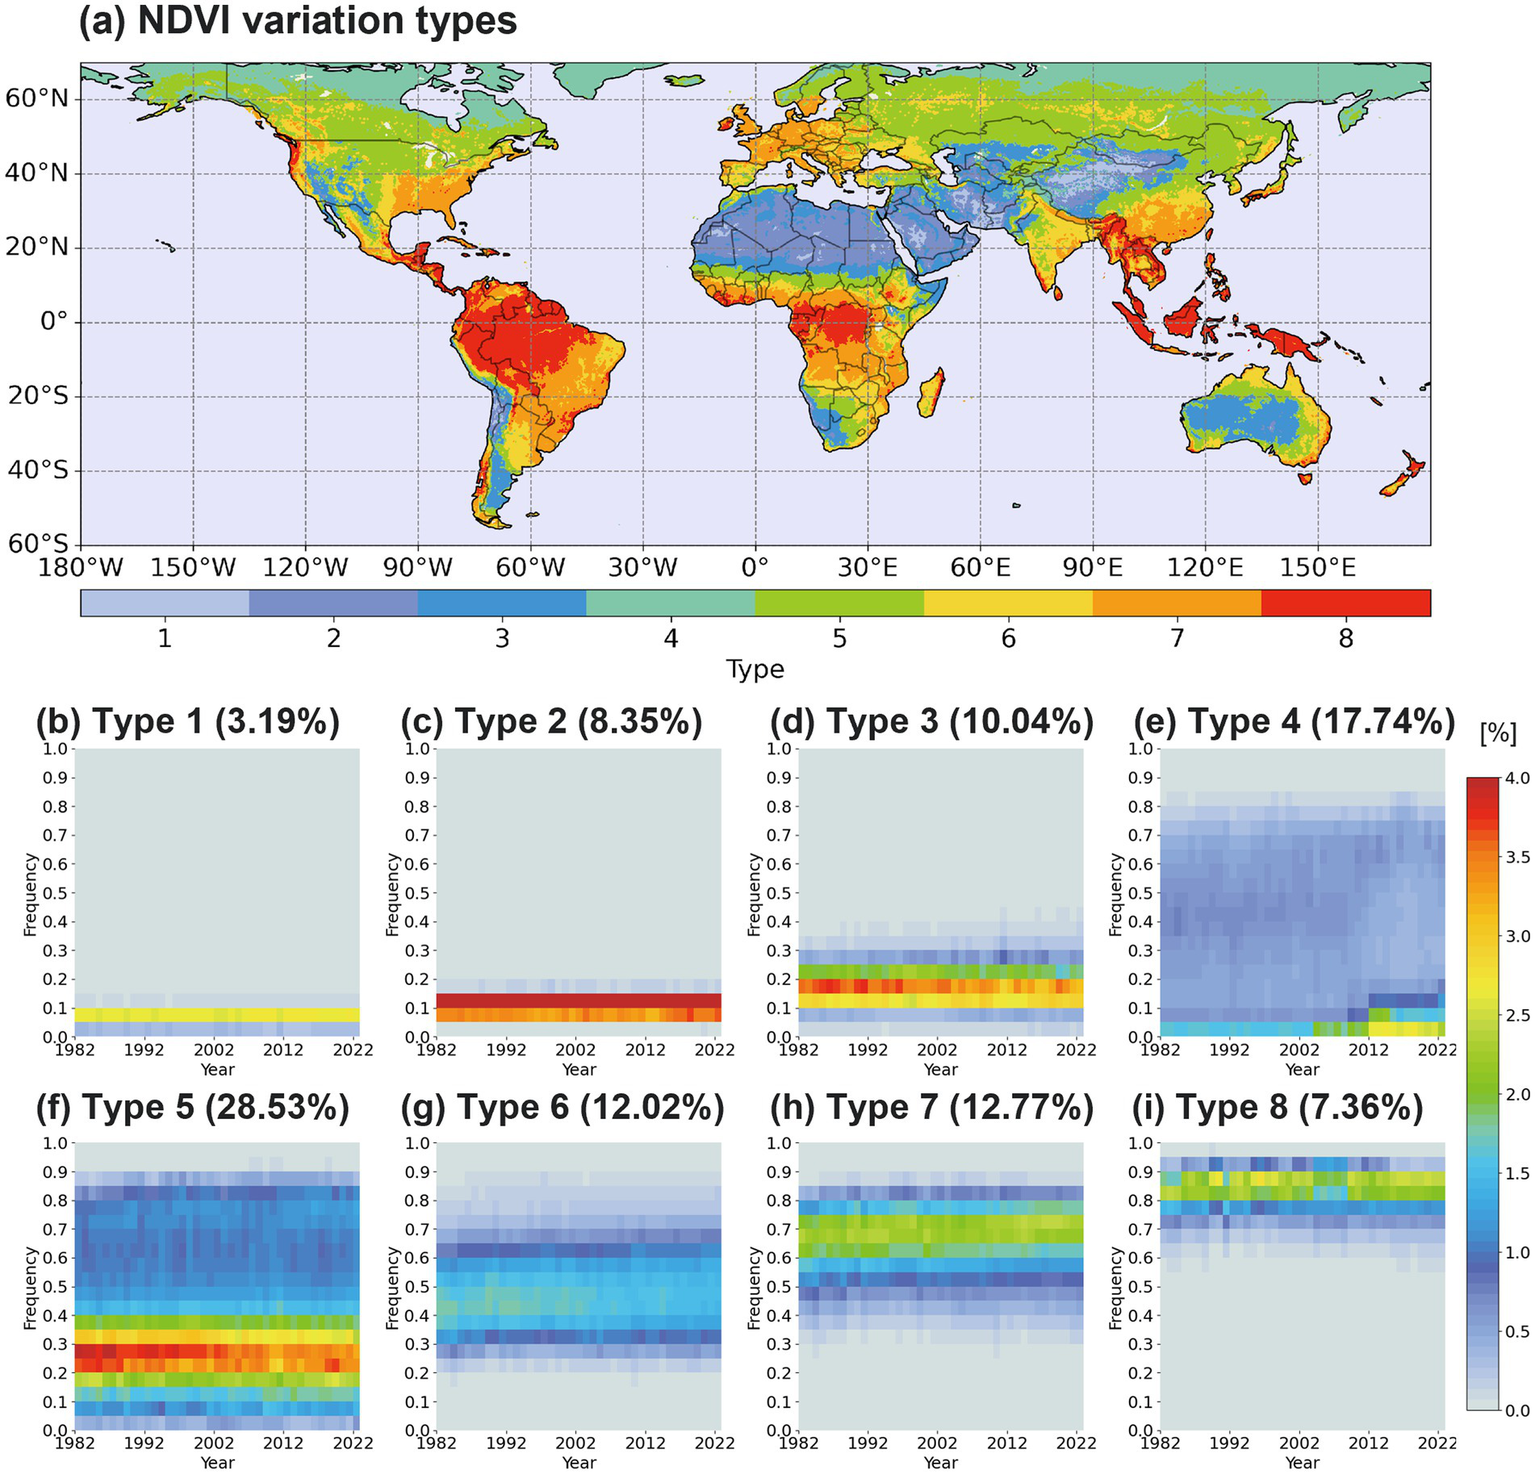
(a) Spatial distributions of NDVI variation types and (b–i) the temporal evolution of NDVI frequency for each NDVI variation type.
3.4 Time series of annual mean
Figure 5 presents the annual mean variations of NDVI and the five climate variables across the eight NDVI variation types. As the classification transitions from Type 1 to Type 8, the mean NDVI values show a clear increasing trend (Figure 5a). Type 1 and Type 2 are characterized by arid desert climates with NDVI values less than 0.1. In Type 1, NDVI values are lower than in Type 2, but humidity is found to be higher. This appears to be due to Type 1 encompassing alpine regions or deserts near alpine areas (Figure 4a). These regions have significantly lower temperatures than Type 2, which in turn leads to higher humidity-related indices, including relative humidity (Figure 5). Type 3 and Type 4 are semi-arid desert and high-latitude tundra regions, respectively, both showing NDVI values around 0.2. In Type 4, humidity-related indices remain stable or show a slight increase, exhibiting a markedly different trend from other types (Figures 5c,e,f). The NDVI mean values of Types 5–7 are distributed between 0.3 and 0.7 those types exhibit a gradual increasing trend during the four decades. The increased NDVI trends are originated from China, India, Europe, the western part of Russia, and Central Africa (Figures 3a, 4a). The NDVI values of tropical rainforest (Type 8) initially increase but later decline. The mean temperature variations contrastingly indicate warm temperature in the tropical rainforest region (Type 8) and cold temperature in the high latitude regions of Types 4–5 (Figure 5b). Although there is a degree of difference, all types represent an increasing tendency in temperature as the result of global warming. The precipitation variations do not show a consistent trend, except for Type 7 representing the strong decreasing trend of precipitation (Figure 5c) over the southern China, Central Africa, and Brazil (Figure 3c). The decreasing precipitation in the southern China has rather effect of increasing vegetation growth in relation with solar radiation increases. The solar radiation exhibits the increasing trends for Types 6–8 (Figure 5d), especially over South America, Central Africa, Europe, the western part of Russia, and the southern China (Figure 3d). Those three types commonly have the mean solar radiation around 200 W m−2 under the frequent cloudy environment (Figure 2e). The decreasing precipitation in the southern China has rather effect of increasing vegetation growth in relation with solar radiation increases. The cloud cover and near-surface (2 m) relative humidity variations are quite similar (Figures 5e,f). Desert areas are characterized by lower cloud cover and relative humidity, whereas tropical rainforest region has the highest cloud cover and humidity. As the result of global warming, cloud cover and surface relative humidity are generally decreasing. Although these variations are associated with the reduced moisture supply that inhibits vegetation growth, Whereas increased solar radiation can enhance photosynthesis and partially offset moisture limitations in some regions, its effects remain complex and context-dependent.
Figure 5
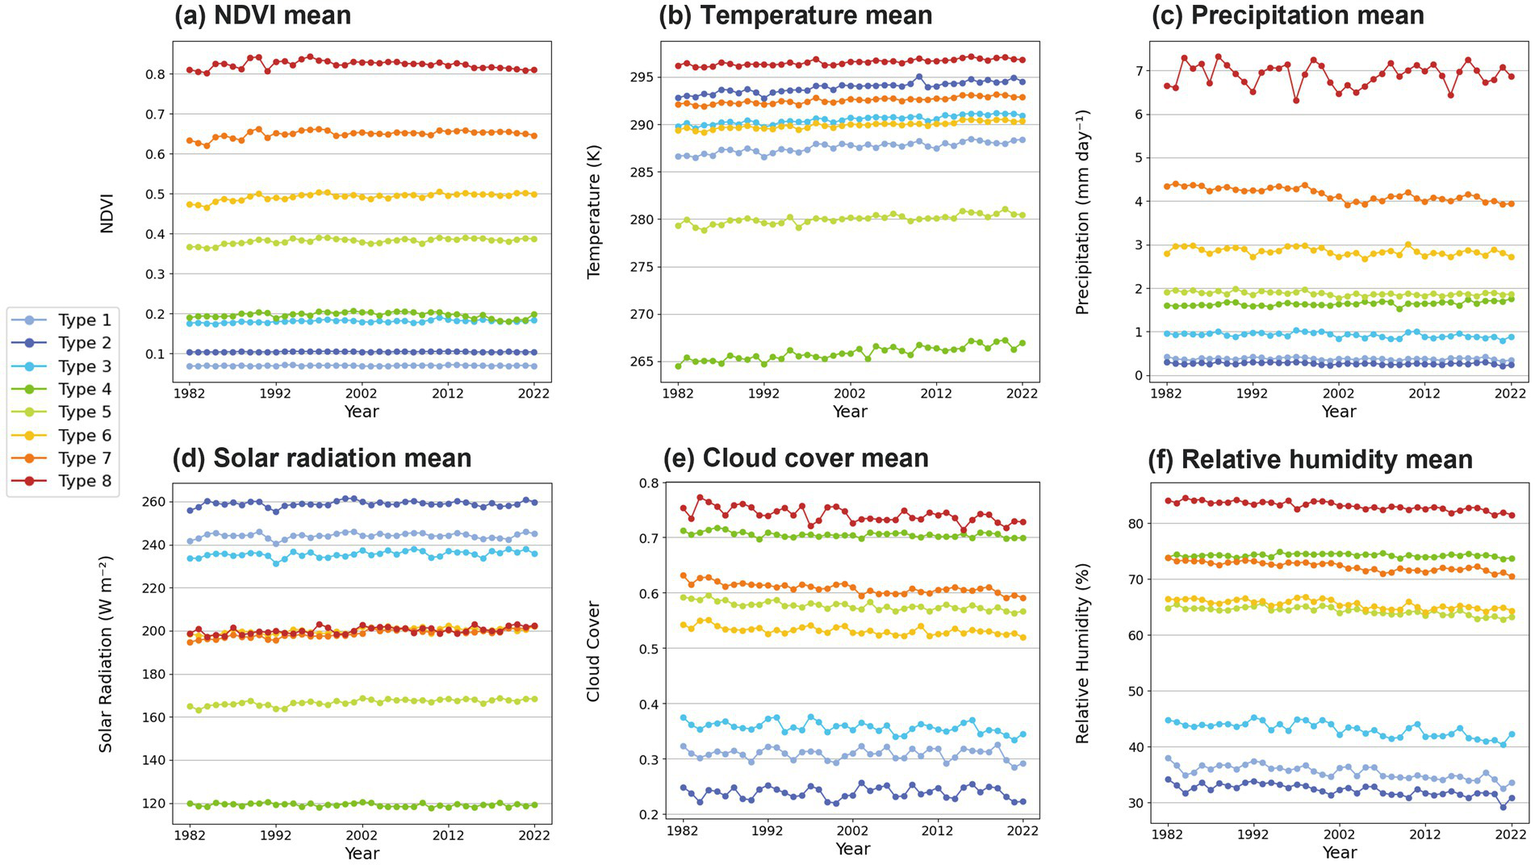
Annual mean variations of (a) NDVI, (b) 2-m temperature, (c) precipitation, (d) solar radiation (e) cloud cover, and (f) 2-m relative humidity for each NDVI variation type. Each line color represents each type.
3.5 Time series of annual variability
The standard deviation is a useful metric for assessing the variability of a given variable. Seasonal variability was analyzed using time series of standard deviation (SD) for NDVI and each of the five climate variables (Figure 6). As shown in the frequency distributions of NDVI (Figures 5b–i), these variations are quantitatively represented by the standard deviation in Figure 6a. NDVI and precipitation variability were very low in Types 1 and 2. However, weather variables differed between the two, with Type 1 exhibiting significantly higher volatility in temperature and solar radiation. As discussed in Figure 5, this is likely due to the relatively high latitudes and altitudes of most Type 1 regions. Meanwhile, rainfall and relative humidity were slightly higher in Type 1, whereas cloud cover showed no consistent pattern. In Type 3, NDVI variability has been gradually increasing. Most of this region consists of high-altitude areas, desertification-prone zones, or border regions. Its defining characteristics include rising temperatures and decreasing relative humidity. This suggests that NDVI fluctuations in this region are closely linked to the accelerating process of desertification. Types 4–5 show large NDVI variability, which is thought to be related to the substantial seasonal variability of surface temperature and solar radiation in these types (Figures 6b,d). The standard deviations of NDVI for Types 3–8 are found to be increasing during the four decades, while the standard deviation of Type 8 shows a weak increasing trend in the recent decades. It suggests that the diversity of vegetation has been increasing in response to recent global warming. The increasing NDVI variability of Type 4–7 appears to be related with the increasing standard deviation of relative humidity (Figure 6f), Meanwhile, the NDVI variability in Type 8 is thought to be associated with increasing precipitation and relative humidity in recent decades (Figure 6c). Notably, Type 8 exhibits the smallest variability in temperature and solar radiation but the highest variability in precipitation, characteristic of a typical tropical rainforest region.
Figure 6
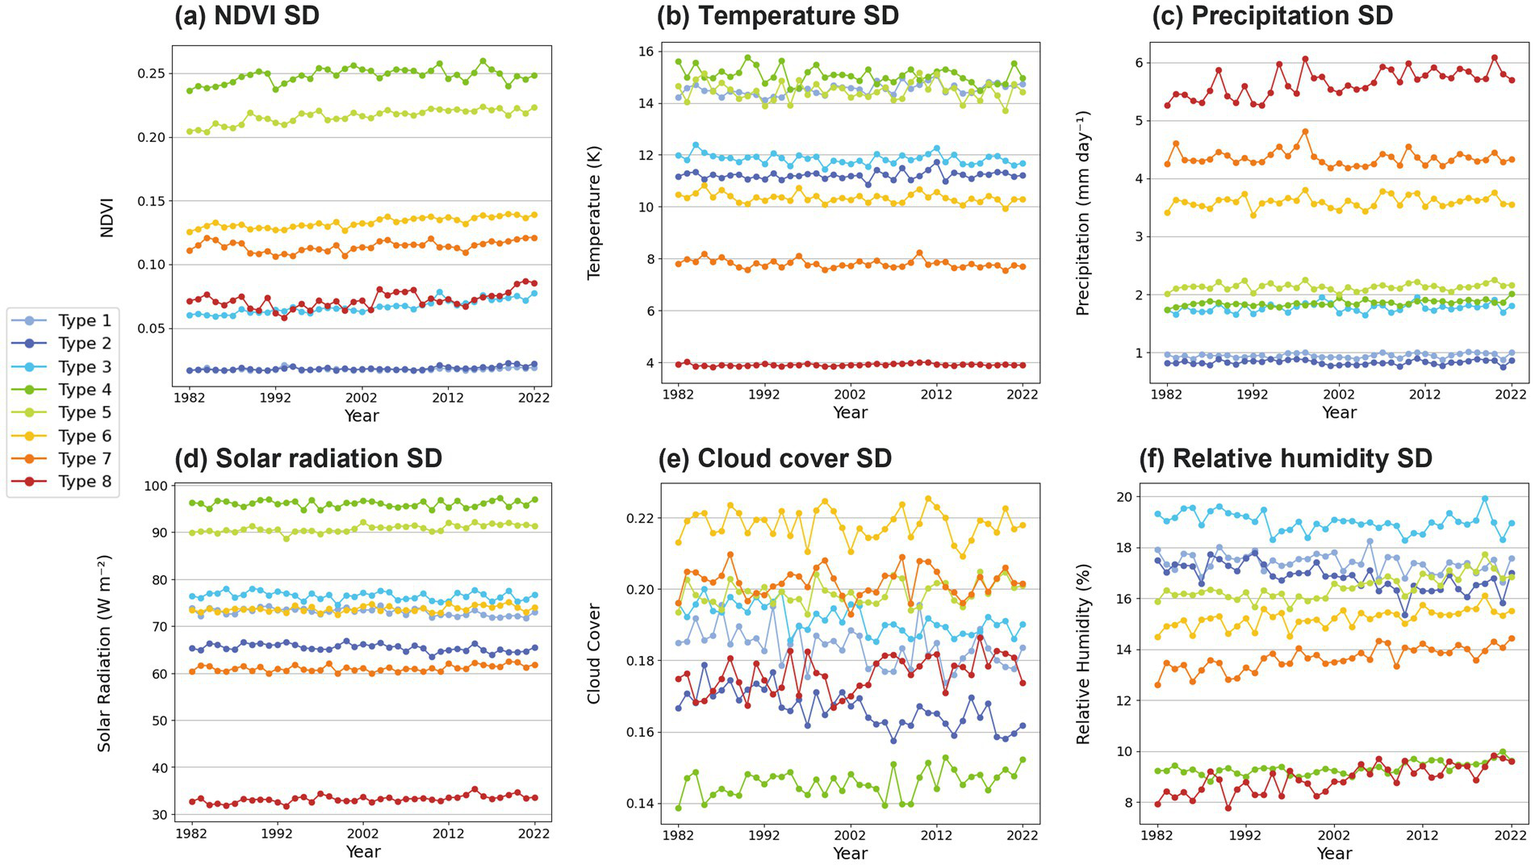
Annual standard deviation (SD) changes of (a) NDVI, (b) 2-m temperature, (c) precipitation, (d) solar radiation, (e) cloud cover, and (f) 2-m relative humidity for each NDVI variation type. Each line color represents each type.
3.6 Seasonal cycles
In order to examine the seasonal climatology of NDVI and climate variables, the monthly mean patterns are investigated in Figure 7. As previously discussed, since Types 4–5 are located in high latitudes, they show the strong seasonal variation for the NDVI (Figure 7a). The temperature, precipitation, and solar radiation also indicate the strong seasonal variation of Types 4–5 (Figures 7b–d). The maximum of NDVI, temperature, precipitation, and solar radiation commonly occurs in the northern hemisphere summertime (Figures 7a–d). The peak of solar radiation for Types 4–5 is found in June, where those of NDVI and temperature occur in August, indicating that the effect of solar radiation on vegetation growth is delayed by 1 month. Types 6–7 represent a moderate seasonal variation for the NDVI (Figure 7a). In contrast, the Types 1–3 and Type 8 are characterized by little change in vegetation throughout the year (Figure 7a). The Types 1–3 and Type 8 display a clear contrast in mean values of precipitation, cloud cover, and relative humidity, along with the seasonal variability of temperature and solar radiation (Figures 7b–f). The large seasonal variability of temperature and solar radiation in Types 1–3, as well as that of precipitation in Type 8, appears to be not related to vegetation seasonal changes. In addition, the maximum value of NDVI in spring and autumn (Figure 7a) because tropical rainforest region had peak leaf production in spring and autumn seasons in association with the increased solar radiation and active photosynthesis.
Figure 7
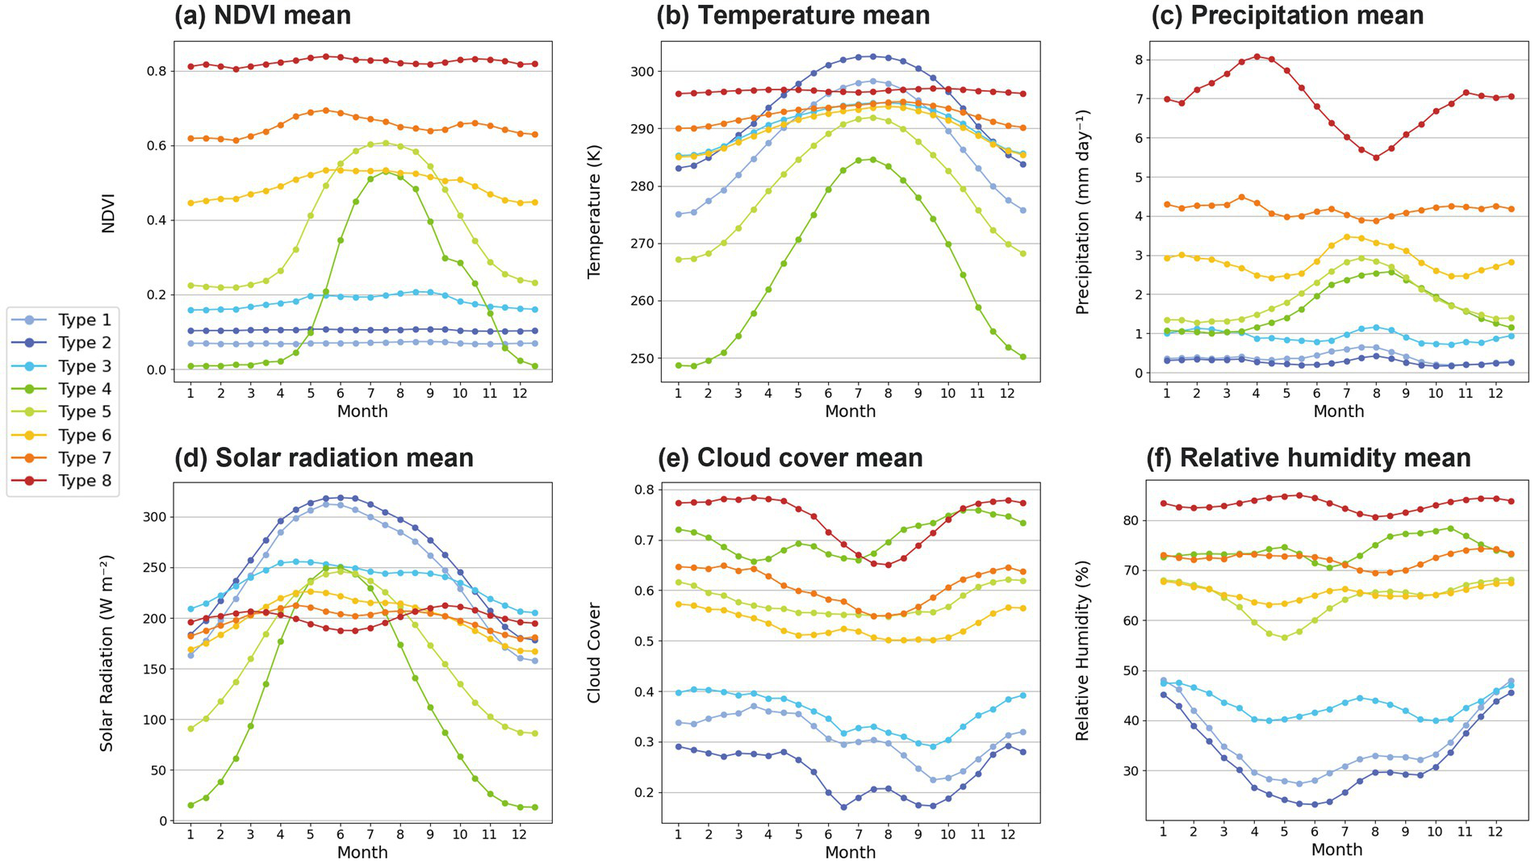
Monthly mean variations of (a) NDVI, (b) 2-m temperature, (c) precipitation, (d) solar radiation, (e) cloud cover, and (f) 2-m relative humidity for each NDVI variation type. Each line color represents each type.
3.7 Monthly trends
The decadal trends of vegetation and climate variables are further analyzed on a monthly basis (Figure 8). The increasing NDVI and temperature trends are observed across all seasons (Figure 8a). However, in Type 4, the NDVI decreases significantly from October to November, while temperature rises markedly (Figure 8b). Additionally, precipitation, cloud cover, relative humidity trends are increasing along with decreasing solar radiation over those seasons in Type 4 (Figures 8c–f). These changes are thought to be related with a significant reduction in evaporation, resulting in excessive soil moisture. This, in turn, may have negatively affected tree growth in the region, contributing to forest decline and NDVI loss (Baltzer et al., 2014; Carpino et al., 2018). Consequently, the analysis suggests a decline in the growth of evergreen conifers, the dominant tree species in this region, with a potential shift toward vegetation types better suited to the changing climate, such as herbaceous plants, mosses, and shrubs (Li et al., 2021; van Zuijlen et al., 2024). Furthermore, NDVI showed a significant decline during the fall season, from October to November, due to the senescence of herbaceous plants (Gehrmann et al., 2022). Increasing NDVI trends from winter to spring are commonly observed in Types 5–7 (Figure 8a). These regions have experienced shorter winters and earlier spring leaf-out, resulting in an extended vegetation growth period (Ontel et al., 2025). Notably, high autumn temperatures sustain photosynthesis and prolong the senescence period (Richardson et al., 2013). The decreasing NDVI trends in late winter to spring and summer seasons are only found in Type 8 (Figure 8a). The decreasing vegetation trend in spring is thought to be partly related to the decrease in temperature and solar radiation (Figures 8b,d), and that in summer appears to be associated with the reduction of precipitation (Figure 8c). According to recent studies, it cannot be concluded that NDVI greening will continue worldwide. This outlook emphasizes the need for continuous monitoring and further research based on NDVI frequency distribution-based analysis (Fu et al., 2025; Zhao et al., 2025).
Figure 8
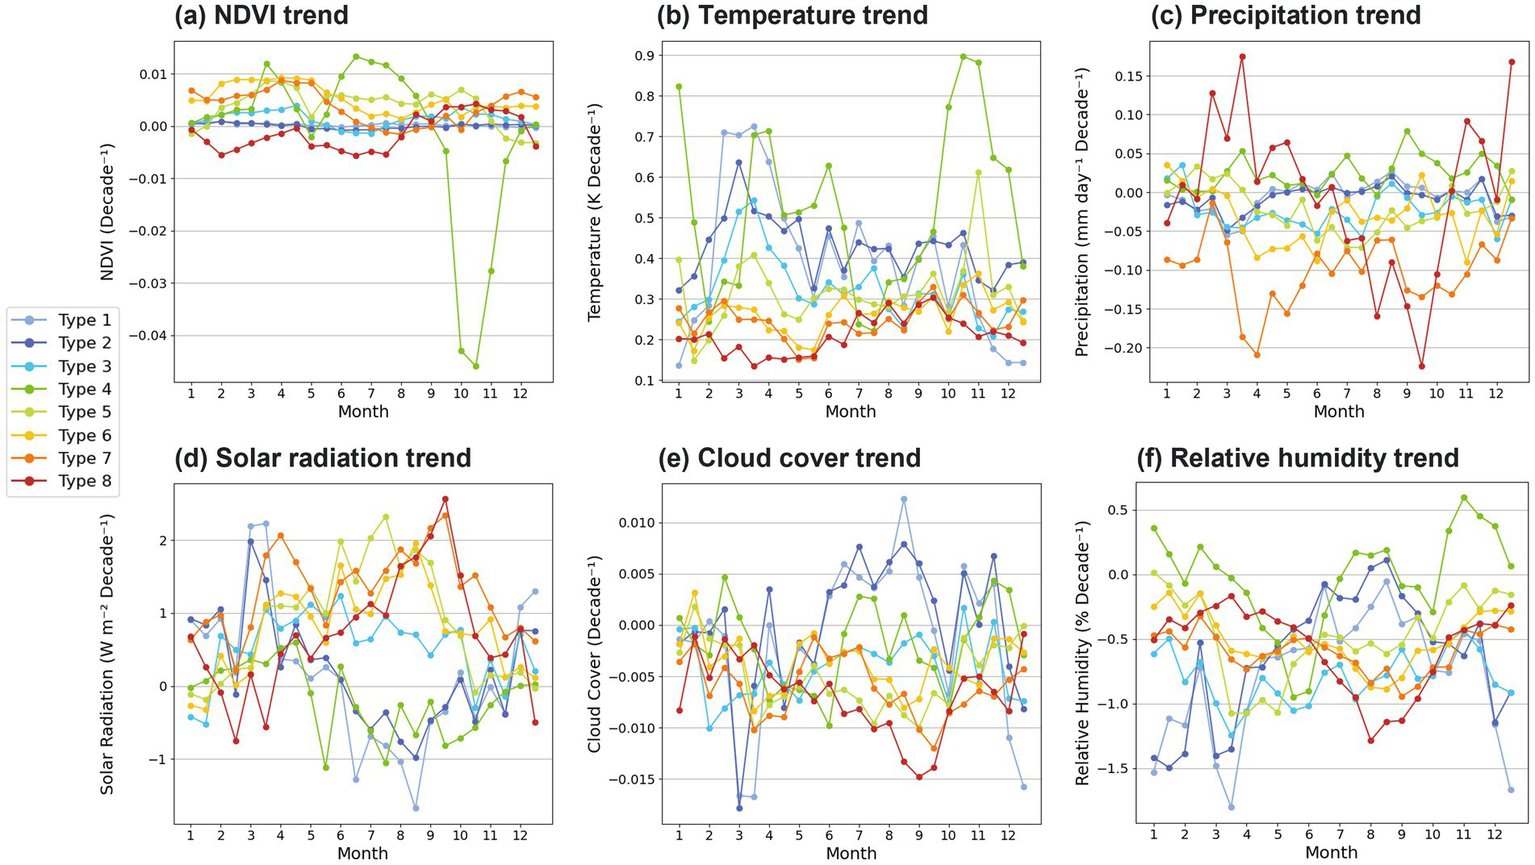
Monthly linear trends of (a) NDVI, (b) 2-m temperature, (c) precipitation, (d) solar radiation (e) cloud cover, and (f) 2-m relative humidity for each NDVI variation type. Each line color represents each type.
4 Summarizations and conventions
This study examined global vegetation and climate changes from 1982 to 2022 using the GIMMS-3G + NDVI dataset and AgERA5 climate data across 223,734 grid cells. The climatological mean NDVI values were highest in tropical rainforests and lowest in arid regions, showing moderate correlations with temperature (R = 0.36) and precipitation (R = 0.38). Over four decades, NDVI increased across Europe, western Russia, India, China, and Central Africa, but declined in Canada, South America, South Africa, and Central Asia. Vegetation gains in high latitudes were linked to warming, while decreases in dry regions reflected reduced rainfall and intensified droughts. The k-means clustering of NDVI frequency distributions yielded eight notable types. Arid and semi-arid zones (Types 1–3) maintained low NDVI with little seasonality; however, Type 3 displayed growing heterogeneity, with both extremely low and high NDVI values becoming more frequent. High-latitude tundra and transitional zones (Types 4–5) exhibited strong seasonal cycles and increasing summer greenness, reflecting longer growing seasons and greater interannual variability. Subtropic-midlatitude humid regions (Types 6–7) showed distinct cropping-related NDVI cycles; Type 6 experienced rising NDVI variability, while Type 7 displayed a pronounced greening trend, especially in China and Europe, associated with higher temperatures and solar radiation. Tropical rainforests (Type 8) sustained high NDVI throughout the year but have shown increasing variability during recent four decades.
This study is meaningful in an objective classification on vegetation fluctuation patterns and long-term changes. This approach based on NDVI frequency distributions effectively captures large-scale variability and enables the identification of common climate drivers affecting vegetation changes. By categorizing NDVI variations rather than relying solely on direct statistical relationships, this study offers a novel perspective on vegetation-climate interactions, contributing to a more nuanced understanding of ecosystem responses to global climate variability. In particular, the standard deviation results of NDVI for Types 3–8 suggested that the diversity of vegetation has been increasing in response to recent global warming and hydrological cycle changes. Furthermore, on basis of monthly changes, the increasing NDVI and temperature trends were observed across all seasons, except Type 5 in autumn season and Type 8. The increasing NDVI trends from winter to spring (summer to autumn) can be understood as extended vegetation growth period with shorter winter and earlier spring leaf-out (longer summer and maintaining vegetation in late fall). Applying this finding to future climate projections could also provide deeper insights into how ecosystems will respond to ongoing climate change.
Statements
Data availability statement
The datasets presented in this study can be found in online repositories. The names of the repository/repositories and accession number(s) can be found at: https://doi.org/10.5281/zenodo.15048700.
Author contributions
W-JC: Conceptualization, Data curation, Formal analysis, Funding acquisition, Investigation, Methodology, Project administration, Resources, Software, Supervision, Validation, Visualization, Writing – original draft, Writing – review & editing. H-JS: Formal analysis, Funding acquisition, Methodology, Project administration, Supervision, Validation, Writing – original draft, Writing – review & editing. H-JG: Methodology, Validation, Writing – review & editing. MK: Methodology, Validation, Writing – review & editing. H-SP: Methodology, Validation, Writing – review & editing.
Funding
The author(s) declared that financial support was received for this work and/or its publication. This research was supported by Global-Learning and Academic research institution for Master’s·PhD students, and Postdocs (LAMP) Program of the National Research Foundation of Korea (NRF) grant funded by the Ministry of Education (No. RS-2023-00301914).
Conflict of interest
The author(s) declared that this work was conducted in the absence of any commercial or financial relationships that could be construed as a potential conflict of interest.
Generative AI statement
The author(s) declared that Generative AI was not used in the creation of this manuscript.
Any alternative text (alt text) provided alongside figures in this article has been generated by Frontiers with the support of artificial intelligence and reasonable efforts have been made to ensure accuracy, including review by the authors wherever possible. If you identify any issues, please contact us.
Publisher’s note
All claims expressed in this article are solely those of the authors and do not necessarily represent those of their affiliated organizations, or those of the publisher, the editors and the reviewers. Any product that may be evaluated in this article, or claim that may be made by its manufacturer, is not guaranteed or endorsed by the publisher.
References
1
Andrade J. F. Satorre E. H. (2015). Single and double crop systems in the argentine pampas: environmental determinants of annual grain yield. Field Crop Res.177, 137–147. doi: 10.1016/j.fcr.2015.03.008
2
Baltzer J. L. Veness T. Chasmer L. E. Sniderhan A. E. Quinton W. L. (2014). Forests on thawing permafrost: fragmentation, edge effects, and net forest loss. Glob. Chang. Biol.20, 824–834. doi: 10.1111/gcb.12349,
3
Bernhard G. Booth C. R. Ehramjian J. C. (2004). Version 2 data of the National Science Foundation's ultraviolet radiation monitoring network: south pole. J. Geophys. Res. Atmos.109:D21207. doi: 10.1029/2004JD004937
4
Biradar C. M. Xiao X. (2011). Quantifying the area and spatial distribution of double-and triple-cropping croplands in India with multi-temporal MODIS imagery in 2005. Int. J. Remote Sens.32, 367–386. doi: 10.1080/01431160903464179
5
Boogaard H. Schubert J. De Wit A. Lazebnik J. Hutjes R. der Van Grijn G. , (2020). Agrometeorological indicators from 1979 to present derived from reanalysis. Copernicus Climate Change Service (C3S) Climate Data Store (CDS). doi: 10.24381/cds.6c68c9bb (Accessed September 27, 2024)
6
Brown M. E. De Beurs K. M. Marshall M. (2012). Global phenological response to climate change in crop areas using satellite remote sensing of vegetation, humidity and temperature over 26 years. Remote Sens. Environ.126, 174–183. doi: 10.1016/j.rse.2012.08.009
7
Burton C. A. Rifai S. W. Renzullo L. J. Van Dijk A. I. (2024). Enhancing long-term vegetation monitoring in Australia: a new approach for harmonising the advanced very high resolution radiometer normalised-difference vegetation (NVDI) with MODIS NDVI. Earth Syst. Sci. Data16, 4389–4416. doi: 10.5194/essd-16-4389-2024
8
Carpino O. A. Berg A. A. Quinton W. L. Adams J. R. (2018). Climate change and permafrost thaw-induced boreal forest loss in northwestern Canada. Environ. Res. Lett.13:084018. doi: 10.1088/1748-9326/aad74e
9
Chen Y. Liu A. Cheng X. (2021). Vegetation grows more luxuriantly in Arctic permafrost drained lake basins. Glob. Chang. Biol.27, 5865–5876. doi: 10.1111/gcb.15853,
10
Eitzinger J. Trnka M. Semerádová D. Thaler S. Svobodová E. Hlavinka P. et al . (2013). Regional climate change impacts on agricultural crop production in central and Eastern Europe–hotspots, regional differences and common trends. J. Agric. Sci.151, 787–812. doi: 10.1017/S0021859612000767
11
Fensholt R. Proud S. R. (2012). Evaluation of earth observation based global long term vegetation trends—comparing GIMMS and MODIS global NDVI time series. Remote Sens. Environ.119, 131–147. doi: 10.1016/j.rse.2011.12.015
12
Fiore N. M. Goulden M. L. Czimczik C. I. Pedron S. A. Tayo M. A. (2020). Do recent NDVI trends demonstrate boreal forest decline in Alaska?Environ. Res. Lett.15:095007. doi: 10.1088/1748-9326/ab9c4c
13
Frigo D. Eggertsson Ó. Prendin A. L. Dibona R. Unterholzner L. Carrer M. (2023). Growth form and leaf habit drive contrasting effects of Arctic amplification in long-lived woody species. Glob. Chang. Biol.29, 5896–5907. doi: 10.1111/gcb.16895,
14
Fu J. Su B. Qin J. Hu Y. (2025). Mid-spine belt of beautiful China: future reversal of increasing vegetation greening in response to an evolving environment. Int. J. Digit. Earth18:2449183. doi: 10.1080/17538947.2024.2449183
15
Gehrmann F. Ziegler C. Cooper E. J. (2022). Onset of autumn senescence in high Arctic plants shows similar patterns in natural and experimental snow depth gradients. Arctic Sci.8, 744–766. doi: 10.1139/as-2020-0044
16
Gim H. J. Ho C. H. Jeong S. Kim J. Feng S. Hayes M. J. (2020). Improved mapping and change detection of the start of the crop growing season in the US Corn Belt from long-term AVHRR NDVI. Agric. For. Meteorol.294:108143. doi: 10.1016/j.agrformet.2020.108143
17
Goward S. N. Tucker C. J. Dye D. G. (1985). North American vegetation patterns observed with the NOAA-7 advanced very high resolution radiometer. Vegetatio64, 3–14. doi: 10.1007/BF00033449
18
Guo J. Wang K. Wang T. Bai N. Zhang H. Cao Y. et al . (2022). Spatiotemporal variation of vegetation NDVI and its climatic driving forces in global land surface. Pol. J. Environ. Stud.31, 3541–3549. doi: 10.15244/pjoes/147194
19
Han Y. Lin Y. Zhou P. Duan J. Cao Z. Wang J. et al . (2023). Assessing dynamic changes, driving mechanisms and predictions of multisource vegetation remote sensing products in Chinese regions. Appl. Sci.13:5229. doi: 10.3390/app13095229
20
Hersbach H. Bell B. Berrisford P. Biavati G. Horányi A. Muñoz Sabater J. et al . (2023). ERA5 monthly averaged data on single levels from 1940 to present. Copernicus climate change service (C3S) climate data store (CDS), doi: 10.24381/cds.f17050d7 (Accessed November 18, 2024)
21
Hilker T. Lyapustin A. I. Tucker C. J. Hall F. G. Myneni R. B. Wang Y. et al . (2014). Vegetation dynamics and rainfall sensitivity of the Amazon. Proc. Natl. Acad. Sci.111, 16041–16046. doi: 10.1073/pnas.1404870111,
22
Huang S. Tang L. Hupy J. P. (2021). A commentary review on the use of normalized difference vegetation index (NDVI) in the era of popular remote sensing. J. For. Res.32, 1–6. doi: 10.1007/s11676-020-01155-1
23
Huang J. Zhao X. Bürger M. Chory J. Wang X. (2023). The role of ethylene in plant temperature stress response. Trends Plant Sci.28, 808–824. doi: 10.1016/j.tplants.2023.03.001,
24
Jiang Z. Huete A. R. Didan K. Miura T. (2008). Development of a two-band enhanced vegetation index without a blue band. Remote Sens. Environ.112, 3833–3845. doi: 10.1016/j.rse.2008.06.006
25
Julien Y. Sobrino J. A. (2009). The yearly land cover dynamics (YLCD) method: an analysis of global vegetation from NDVI and LST parameters. Remote Sens. Environ.113, 329–334. doi: 10.1016/j.rse.2008.09.016
26
Kelsey K. C. Pedersen S. H. Leffler A. J. Sexton J. O. Feng M. Welker J. M. (2021). Winter snow and spring temperature have differential effects on vegetation phenology and productivity across Arctic plant communities. Glob. Chang. Biol.27, 1572–1586. doi: 10.1111/gcb.15505,
27
Kirpotin S. N. Callaghan T. V. Peregon A. M. Babenko A. S. Berman D. I. Bulakhova N. A. et al . (2021). Impacts of environmental change on biodiversity and vegetation dynamics in Siberia. Ambio50, 1926–1952. doi: 10.1007/s13280-021-01570-6,
28
Li Y. Liu H. Zhu X. Yue Y. Xue J. Shi L. (2021). How permafrost degradation threatens boreal forest growth on its southern margin?Sci. Total Environ.762:143154. doi: 10.1016/j.scitotenv.2020.143154,
29
Liu L. Ciais P. Maignan F. Zhang Y. Viovy N. Peaucelle M. et al . (2024b). Solar radiation triggers the bimodal leaf phenology of central African evergreen broadleaved forests. J. Adv. Model. Earth Syst.16:e2023MS004014. doi: 10.1029/2023MS004014
30
Liu J. Fu J. Qin J. Su B. Hong Y. (2024a). Effects of climate variability and urbanization on spatiotemporal patterns of vegetation in the middle and lower Yangtze River basin, China. Front. Plant Sci.15:1459058. doi: 10.3389/fpls.2024.1459058,
31
Liu Y. Li Y. Li S. Motesharrei S. (2015). Spatial and temporal patterns of global NDVI trends: correlations with climate and human factors. Remote Sens7, 13233–13250. doi: 10.3390/rs71013233
32
Liu C. Liu J. Zhang Q. Ci H. Gu X. Gulakhmadov A. (2022). Attribution of NDVI dynamics over the globe from 1982 to 2015. Remote Sens14:2706. doi: 10.3390/rs14112706
33
Liu Q. Yao F. Garcia-Garcia A. Zhang J. Li J. Ma S. et al . (2023). The response and sensitivity of global vegetation to water stress: a comparison of different satellite-based NDVI products. Int. J. Appl. Earth Obs. Geoinf.120:103341. doi: 10.1016/j.jag.2023.103341
34
Los S. O. Collatz G. J. Bounoua L. Sellers P. J. Tucker C. J. (2001). Global interannual variations in sea surface temperature and land surface vegetation, air temperature, and precipitation. J. Clim.14, 1535–1549. doi: 10.1175/1520-0442(2001)014<1535:GIVISS>2.0.CO;2
35
Ontel I. Avram S. Gheorghe C. A. Niculae M. I. Pascu I. S. Rodino S. (2025). Shifting vegetation phenology in protected areas: a response to climate change. Ecol. Inform.85:102962. doi: 10.1016/j.ecoinf.2024.102962
36
Parmesan C. Yohe G. (2003). A globally coherent fingerprint of climate change impacts across natural systems. Nature421, 37–42. doi: 10.1038/nature01286,
37
Piao S. Liu Q. Chen A. Janssens I. A. Fu Y. Dai J. et al . (2019). Plant phenology and global climate change: current progresses and challenges. Glob. Chang. Biol.25, 1922–1940. doi: 10.1111/gcb.14619,
38
Piao S. Wang X. Park T. (2020). Characteristics, drivers and feedbacks of global greening. Nat. Rev. Earth Environ.1, 14–27. doi: 10.1038/s43017-019-0001-x
39
Pinzon J. E. Pak E. W. Tucker C. J. Bhatt U. S. Frost G. V. Macander M. J. (2023). Global vegetation greenness (NDVI) from AVHRR GIMMS-3G+, 1981-2022 (version 1). ORNL distributed active archive center. doi: 10.3334/ORNLDAAC/2187
40
Pinzon J. E. Tucker C. J. (2014). A non-stationary 1981–2012 AVHRR NDVI3g time series. Remote Sens6, 6929–6960. doi: 10.3390/rs6086929
41
Qiu B. Hu X. Chen C. Tang Z. Yang P. Zhu X. et al . (2022). Maps of cropping patterns in China during 2015–2021. Sci Data9:479. doi: 10.1038/s41597-022-01589-8,
42
Qiu B. Zhong M. Tang Z. Wang C. (2014). A new methodology to map double-cropping croplands based on continuous wavelet transform. Int. J. Appl. Earth Obs. Geoinf.26, 97–104. doi: 10.1016/j.jag.2013.05.016
43
Rahimi E. Dong P. Jung C. (2025). Global NDVI-LST correlation: temporal and spatial patterns from 2000 to 2024. Environment12:67. doi: 10.3390/environments12020067
44
Richardson A. D. Keenan T. F. Migliavacca M. Ryu Y. Sonnentag O. Toomey M. (2013). Climate change, phenology, and phenological control of vegetation feedbacks to the climate system. Agric. For. Meteorol.169, 156–173. doi: 10.1016/j.agrformet.2012.09.012
45
Schaphoff S. Reyer C. P. Schepaschenko D. Gerten D. Shvidenko A. (2016). Tamm review: observed and projected climate change impacts on Russia’s forests and its carbon balance. For. Ecol. Manag.361, 432–444. doi: 10.1016/j.foreco.2015.11.043
46
Schwander H. Koepke P. Kaifel A. Seckmeyer G. (2002). Modification of spectral UV irradiance by clouds. J. Geophys. Res. Atmos.107:4296. doi: 10.1029/2001JD001297,
47
Song Z. Li R. Qiu R. Liu S. Tan C. Li Q. et al . (2018). Global land surface temperature influenced by vegetation cover and PM2.5 from 2001 to 2016. Remote Sens10:2034. doi: 10.3390/rs10122034
48
Song X. Lyu S. Wen X. (2020). Limitation of soil moisture on the response of transpiration to vapor pressure deficit in a subtropical coniferous plantation subjected to seasonal drought. J. Hydrol.591:125301. doi: 10.1016/j.jhydrol.2020.125301
49
Song H.-J. Sohn B. J. (2015). Two heavy rainfall types over the Korean peninsula in the humid east Asian summer environment: a satellite observation study. Mon. Weather Rev.143, 363–382. doi: 10.1175/MWR-D-14-00184.1
50
Supit I. Van Diepen C. A. De Wit A. J. W. Kabat P. Baruth B. Ludwig F. (2010). Recent changes in the climatic yield potential of various crops in Europe. Agric. Syst.103, 683–694. doi: 10.1016/j.agsy.2010.08.009
51
Thenkabail P. S. Biradar C. M. Noojipady P. Dheeravath V. Li Y. Velpuri M. et al . (2009). Global irrigated area map (GIAM), derived from remote sensing, for the end of the last millennium. Int. J. Remote Sens.30, 3679–3733. doi: 10.1080/01431160802698919
52
Tian F. Fensholt R. Verbesselt J. Grogan K. Horion S. Wang Y. (2015). Evaluating temporal consistency of long-term global NDVI datasets for trend analysis. Remote Sens. Environ.163, 326–340. doi: 10.1016/j.rse.2015.03.031
53
van Zuijlen K. Kassel M. Dorrepaal E. Lett S. (2024). Frost damage measured by electrolyte leakage in subarctic bryophytes increases with climate warming. J. Ecol.112, 220–232. doi: 10.1111/1365-2745.14236
54
Waha K. Dietrich J. P. Portmann F. T. Siebert S. Thornton P. K. Bondeau A. et al . (2020). Multiple cropping systems of the world and the potential for increasing cropping intensity. Glob. Environ. Chang.64:102131. doi: 10.1016/j.gloenvcha.2020.102131,
55
Wang J. Liu D. (2022). Vegetation green-up date is more sensitive to permafrost degradation than climate change in spring across the northern permafrost region. Glob. Chang. Biol.28, 1569–1582. doi: 10.1111/gcb.16011,
56
Woodward F. I. Lomas M. R. Kelly C. K. (2004). Global climate and the distribution of plant biomes. Philos. Trans. R. Soc. Lond. Ser. B Biol. Sci.359, 1465–1476. doi: 10.1098/rstb.2004.1525,
57
Wu W. Yu Q. You L. Chen K. Tang H. Liu J. (2018). Global cropping intensity gaps: increasing food production without cropland expansion. Land Use Policy76, 515–525. doi: 10.1016/j.landusepol.2018.02.032
58
Yang Y. Wang S. Bai X. Tan Q. Li Q. Wu L. et al . (2019). Factors affecting long-term trends in global NDVI. Forests10:372. doi: 10.3390/f10050372
59
Zhang S. Dai J. Ge Q. (2020). Responses of autumn phenology to climate change and the correlations of plant hormone regulation. Sci. Rep.10:9039. doi: 10.1038/s41598-020-65704-8,
60
Zhao Y. Qin F. Cui Q. Li Q. Cui Y. Birks H. J. B. et al . (2025). Three-and-a-half million years of Tibetan plateau vegetation dynamics in response to climate change. Nat. Ecol. Evol.9, 1153–1167. doi: 10.1038/s41559-025-02743-2,
Summary
Keywords
NDVI, vegetation, global warming, k-means clustering, Calinski–Harabasz-index
Citation
Choi W-J, Song H-J, Gim H-J, Kim M and Park H-S (2026) K-means classification of long-term global vegetation index variation. Front. For. Glob. Change 8:1696015. doi: 10.3389/ffgc.2025.1696015
Received
31 August 2025
Revised
12 November 2025
Accepted
28 November 2025
Published
08 January 2026
Volume
8 - 2025
Edited by
Mohammad Imam Hasan Reza, Presidency Education, Bangladesh
Reviewed by
Jing Fu, Hengyang Normal University, China
Kui Yang, Wuhan University, China
Updates
Copyright
© 2026 Choi, Song, Gim, Kim and Park.
This is an open-access article distributed under the terms of the Creative Commons Attribution License (CC BY). The use, distribution or reproduction in other forums is permitted, provided the original author(s) and the copyright owner(s) are credited and that the original publication in this journal is cited, in accordance with accepted academic practice. No use, distribution or reproduction is permitted which does not comply with these terms.
*Correspondence: Hwan-Jin Song, hwanjinsong@gmail.com
Disclaimer
All claims expressed in this article are solely those of the authors and do not necessarily represent those of their affiliated organizations, or those of the publisher, the editors and the reviewers. Any product that may be evaluated in this article or claim that may be made by its manufacturer is not guaranteed or endorsed by the publisher.