Abstract
Wildfires pose a major environmental threat to Mediterranean ecosystems, intensified by climate change and growing human pressures. Yet, limited research has combined machine learning (ML) and SHapley Additive exPlanations (SHAP) to jointly assess predictive accuracy and interpret wildfire-driving mechanisms, particularly in data-scarce regions such as Northern Morocco’s Tangier–Tétouan–Al Hoceima (TTA) area—a recognized wildfire hotspot requiring advanced predictive tools for effective risk mitigation. This study applied a multi-model ML framework to map wildfire susceptibility by integrating environmental, climatic, and topographic variables with historical fire records. Remote sensing indices (NDVI, LST, wind speed) from summer 2022 were combined with topographic parameters (elevation, slope, aspect, TWI) and proximity measures (distance to roads, settlements, streams) derived from regional datasets. Five ML algorithms—CART, k-NN, SVM, LightGBM, and XGBoost—were tested, with SHAP was employed to interpret model behavior. Among these, XGBoost achieved the highest performance (accuracy = 0.920; F1-fire = 0.926; F1-nonfire = 0.912), followed by LightGBM (accuracy = 0.905; AUC = 0.965), confirming the superiority of gradient boosting techniques over conventional models. SHAP analysis identified NDVI as the most influential predictor, underscoring vegetation density as the primary driver of fire susceptibility through its contribution to fuel load. Secondary predictors varied: LightGBM emphasized elevation and wind speed, whereas XGBoost highlighted LST and wind speed. Interaction effects revealed that concurrent high temperatures and strong winds during Chergui events, as well as interactions between vegetation density and terrain position, substantially increase fire likelihood. Overall, wildfire susceptibility in Mediterranean landscapes arises from complex, non-linear interactions among vegetation, topography, and meteorological extremes. The resulting susceptibility maps deliver actionable insights for targeted fire prevention, resource allocation, and early warning, providing a robust framework to enhance adaptive wildfire management in Morocco’s most vulnerable ecosystems.
1 Introduction
Wildfires represent a defining ecological process in Mediterranean ecosystems (Salis et al., 2023; Davis et al., 2025), shaped by hot, dry summers and extensive human land-use transformations. Recent years have witnessed an alarming escalation in wildfire activity, with the summer of 2022 emerging as a particularly catastrophic benchmark across the Mediterranean basin. Spain experienced its warmest summer in 700 years (Serrano-Notivoli et al., 2023), while France confronted unprecedented fires that revealed critical shifts in fire patterns. A detailed assessment of the 2022 French fire season documented 42,520 hectares burned, with particularly severe impacts on previously less vulnerable forest types (Vallet et al., 2023). Several other Mediterranean countries, including Portugal and Italy, reported their most severe fire seasons in decades (Couto et al., 2022; Rodrigues et al., 2023). This regional crisis has continued to intensify, with 2025 alone surpassing 1 million hectares burned across Europe and the Mediterranean, a new record was established even before the peak fire season concluded (Niranjan, 2025). Underscoring the regional scale crisis and highlighting the urgent need for improved predictive modeling and adaptive fire management strategies across the Mediterranean region.
Similarly, Northern Morocco’s Tangier-Tétouan-Al Hoceima (TTA) region faces escalating wildfire challenges, where fires increasingly endanger forest resources, disrupt communities, and threaten economic assets (Boubekraoui et al., 2023). Recent severe outbreaks include a major fire in Chefchaouen forest that burned over 500 hectares in August 2025 (Toutate, 2025), prompting extreme risk alerts and highlighting the region’s growing vulnerability to intense wildfire events.
Assessing wildfire susceptibility is vital for effective mitigation; however, traditional geospatial methods that depend on expert-assigned weighting often struggle to capture the nonlinear relationships among environmental, climatic, and anthropogenic factors (Iban and Aksu, 2024). Machine learning (ML) provides a data-driven alternative capable of modeling such complex interactions to enhance early warning systems and inform policy decisions (Abdollahi and Pradhan, 2023; Ejaz and Choudhury, 2025; Zhao et al., 2025). Various ML algorithms—including Classification and Regression Trees (CART), Random Forest (RF), Support Vector Machine (SVM), k-Nearest Neighbors (k-NN), XGBoost, and LightGBM—have demonstrated reasonable predictive performance in wildfire modeling (Abujayyab et al., 2022; Chen et al., 2024; Sheriff et al., 2025).
To address transparency and interpretability challenges inherent in ML models, explainable artificial intelligence (XAI) approaches—particularly the SHAP framework—have been increasingly applied in Mediterranean and global wildfire studies (Iban and Aksu, 2024; Lee et al., 2025; Liao et al., 2025). Together, these advancements highlight the potential of combining ML predictive power with SHAP-based interpretability to deepen the understanding of wildfire dynamics in Mediterranean ecosystems, where fragile landscapes, human activities, and climatic extremes intersect to amplify fire risk.
Accordingly, this study develops an interpretable wildfire susceptibility framework for Northern Morocco’s TTA region by: (1) evaluating five ML algorithms (CART, SVM, k-NN, XGBoost, and LightGBM) for predictive accuracy; (2) applying SHAP analysis to identify dominant drivers and their interactions; and (3) producing spatially explicit risk maps to guide prevention efforts and resource allocation. The integrated ML-XAI framework links advanced analytical capabilities with practical wildfire management needs in this highly vulnerable Mediterranean setting.
2 Materials and methods
2.1 Study area and recent wildfire trends in Northern Morocco
The TTA region, located in northwestern Morocco, is shown in Figure 1. The region is predominantly mountainous, as it encompasses a large portion of the Rif range, characterized by steep slopes, rugged terrain, and narrow valleys. These geomorphological conditions are combined with dense forest cover.
Figure 1
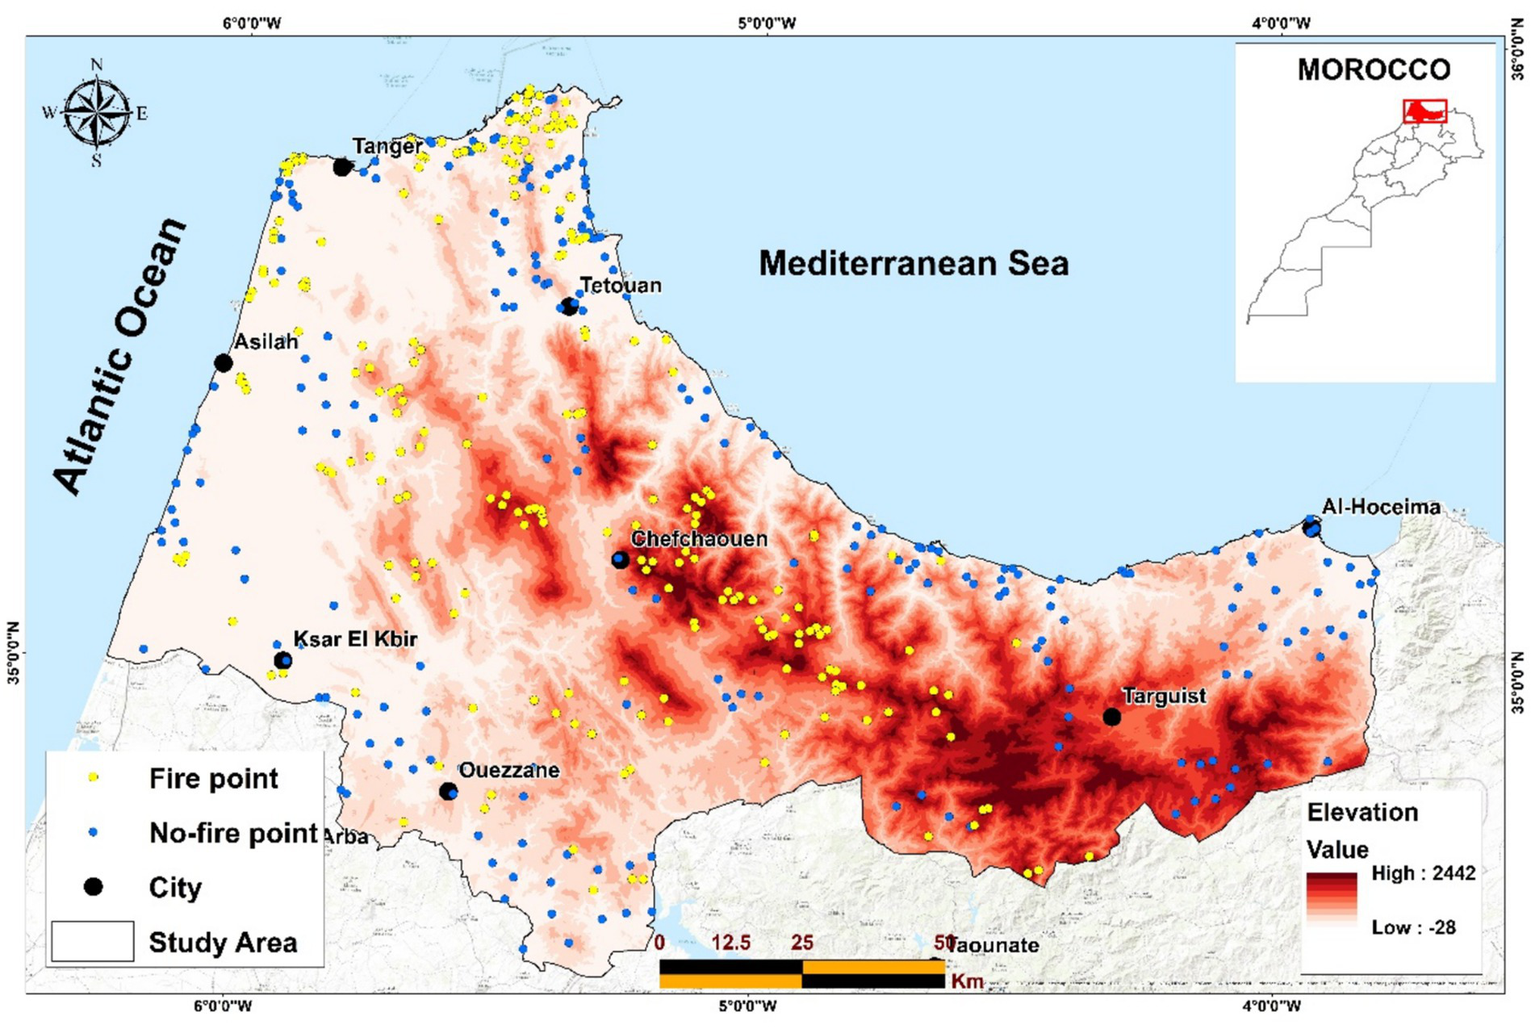
Location map of the TTA region, Northern Morocco.
Climatically, the region is under strong Mediterranean influence, with contrasting sub-humid to humid conditions in coastal and mid-altitude areas, and dry conditions in inland valleys. Elevations range from sea level to more than 2,400 meters. The region also has a 447 km coastline along both the Mediterranean and Atlantic, which moderates temperatures but does not prevent recurrent summer droughts and heatwaves.
From a demographic perspective, the region has a population of more than 4 million inhabitants (RGPH, 2024), with an average density of about 233 inhabitants/km2, making it one of the most densely populated regions in Morocco. This demographic pressure, particularly urban expansion and rural land-use change, intensifies pressures on natural resources.
The TTA region has consistently recorded Morocco’s highest wildfire frequency and burned areas in recent years (Badda et al., 2023; Boubekraoui et al., 2023). In 2022, Morocco experienced approximately 500 wildfires that burned 22,762 hectares nationwide. The TTA region accounted for a disproportionate share of this damage, representing 37.6% of all fire incidents (188 of 500 fires) and 82.2% of the total burned area (18,704 of 22,762 hectares) (L’Economiste, 2023). This concentration of fire activity underscores the region’s exceptional vulnerability within Morocco’s wildfire landscape. The pattern persisted through subsequent years, with the TTA region maintaining its status as the country’s most fire-affected area, culminating in the August 2025 Chefchaouen fires that consumed over 500 hectares under dry Chergui wind conditions (Figure 2).
Figure 2
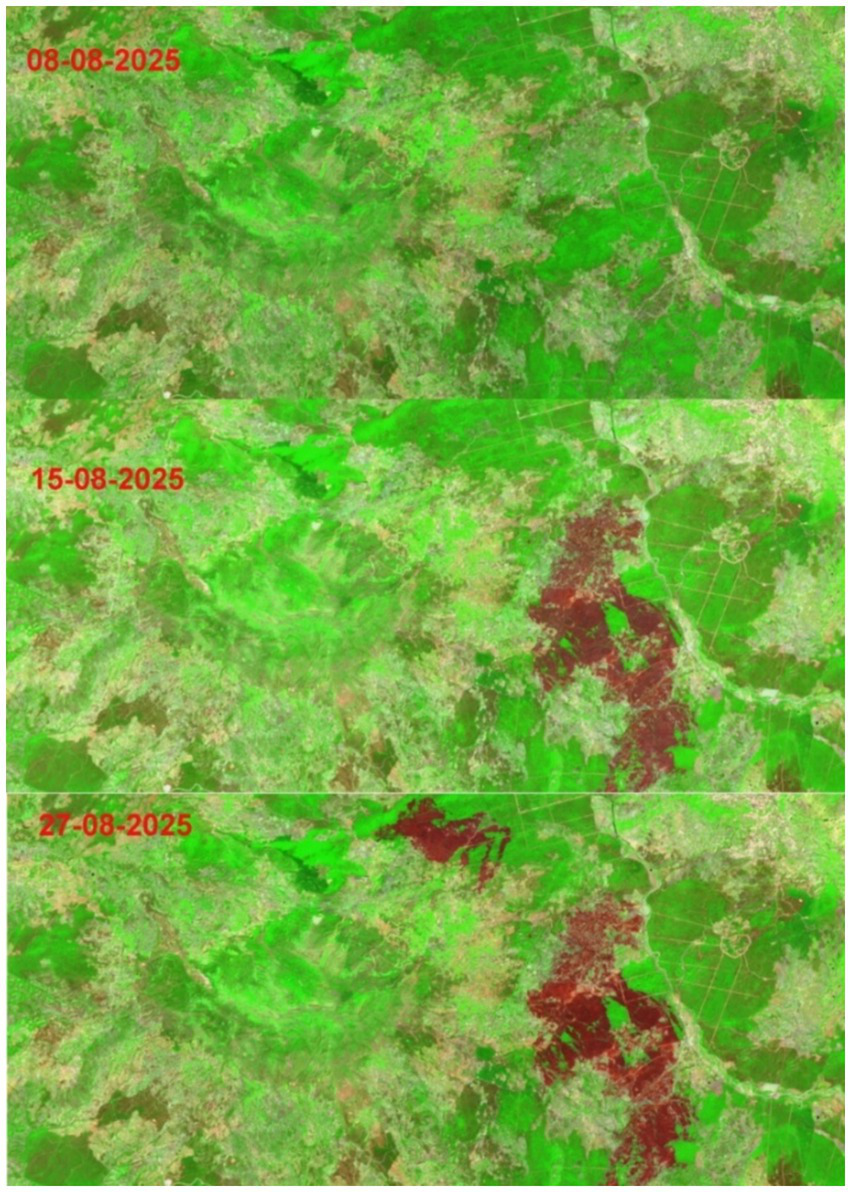
August 2025 Sentinel-2 Short-Wave Infrared (SWIR) Time-Series of Wildfires in Chefchaouen Province, Morocco. This figure shows false-color satellite imagery capturing two different wildfire events in August 2025. On 08 August 2025, the scene appears unaffected, with healthy vegetation highlighted in green. By 15 August 2025, the first fire is clearly visible as a large, burned scar in red tones on the eastern side of the image. A second fire event is detected by 27 August 2025, with new burned areas appearing in the northern part of the scene, while the earlier scar in the east remains evident. Together, these images illustrate the occurrence of two distinct wildfires within the same region over a short time span, emphasizing both the intensity and recurrence of fire activity.
2.2 Conditioning factors
In this study, a combination of environmental, topographic, climatic, and anthropogenic conditioning factors was integrated (Tables 1; Figure 3), as illustrated in the methodological framework (Figure 4). These factors, including aspect, elevation, slope, topographic wetness index (TWI), land surface temperature (LST), wind speed, vegetation indices (NDVI), and proximity indicators (roads, settlements, and water bodies), were selected due to their established influence on fire ignition, spread, and severity (Michael et al., 2021; Singha et al., 2024; Ahmad et al., 2025). Table 2 summarizes the conditioning factors, their effects on wildfire behavior, and the supporting literature.
Table 1
| Dataset/layer | Description | Original source | Platform/method |
|---|---|---|---|
| Training Dataset Construction | MODIS Fire Information for Resource Management System (FIRMS) (https://firms.modaps.eosdis.nasa.gov/data/download/DL_FIRE_J1V-C2_579033.zip) | MODIS FIRMS (NASA) | Downloaded and processed in GIS/GEE |
| Aspect | Slope orientation is used to assess solar radiation exposure. | SRTM DEM (NASA) | Processed in GIS |
| Elevation | Altitudinal variation influences temperature and moisture. | SRTM DEM (NASA) | Processed in GIS |
| Slope | Gradient derived from DEM, reflecting terrain steepness and fire spread. | SRTM DEM (NASA) | Processed in GIS |
| Topographic Wetness Index (TWI) | Hydrological index indicating soil moisture accumulation. | DEM (NASA–SRTM) | Processed in GIS |
| Land Surface Temperature (LST) | Surface thermal conditions influence ignition and fuel dryness. | MODIS LST (NASA) — Summer 2022 | Processed in GEE |
| Wind Speed | Climatic factors affecting fire spread and intensity. | ERA5 Climate Reanalysis (ECMWF) — Summer 2022 | Processed in GEE |
| NDVI | Vegetation index represents biomass and fuel condition. | Landsat 8/9 (USGS–NASA) — Summer 2022 | Processed in GEE |
| Proximity to Roads | Euclidean distance to major and minor road networks. | National Road Data | Processed in GIS |
| Proximity to Settlements | Distance to urban and rural settlements digitized from national topographic maps. | Moroccan Topographic Maps | Digitized in GIS |
| Proximity to Streams | Distance to rivers and streams digitized from topographic maps. | Moroccan Topographic Maps | Digitized in GIS |
Data utilized in the development of the wildfire susceptibility model.
SRTM DEM, Shuttle Radar Topography Mission Digital Elevation Model; ECMWF, European Centre for Medium-Range Weather Forecasts; GIS, Geographic Information Systems; GEE, Google Earth Engine.
Figure 3
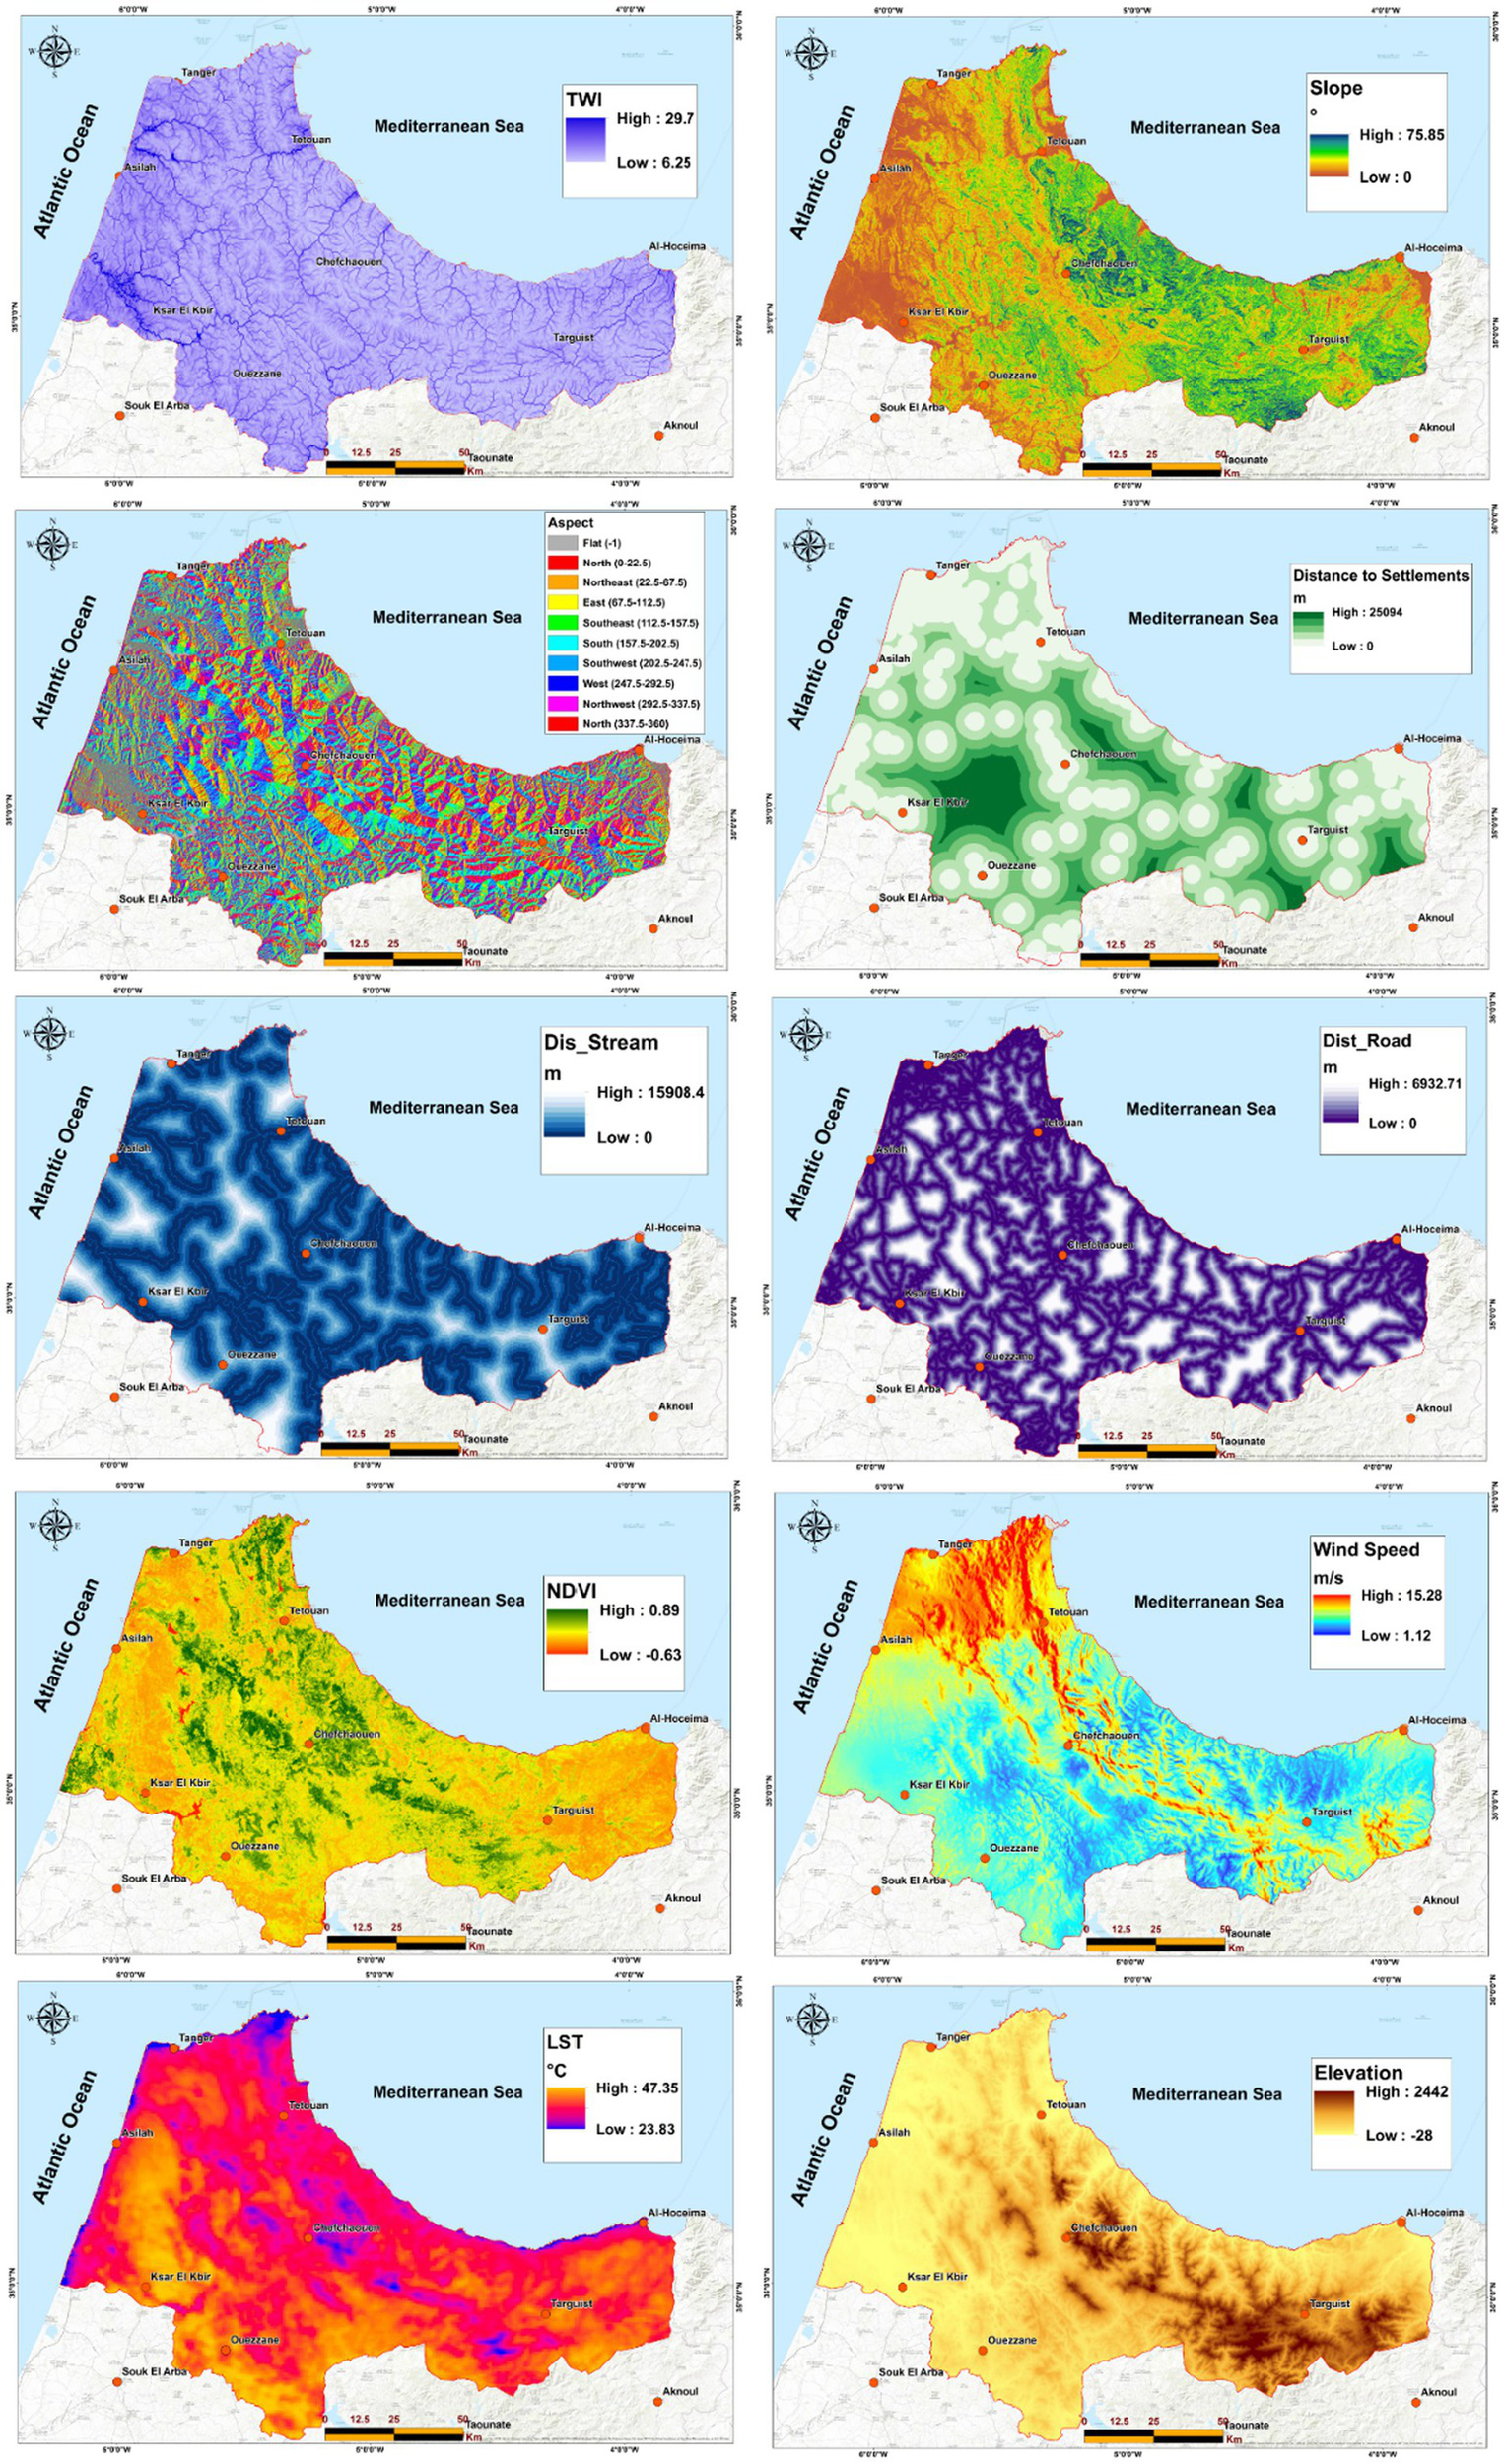
Conditioning variables influencing wildfire susceptibility.
Figure 4
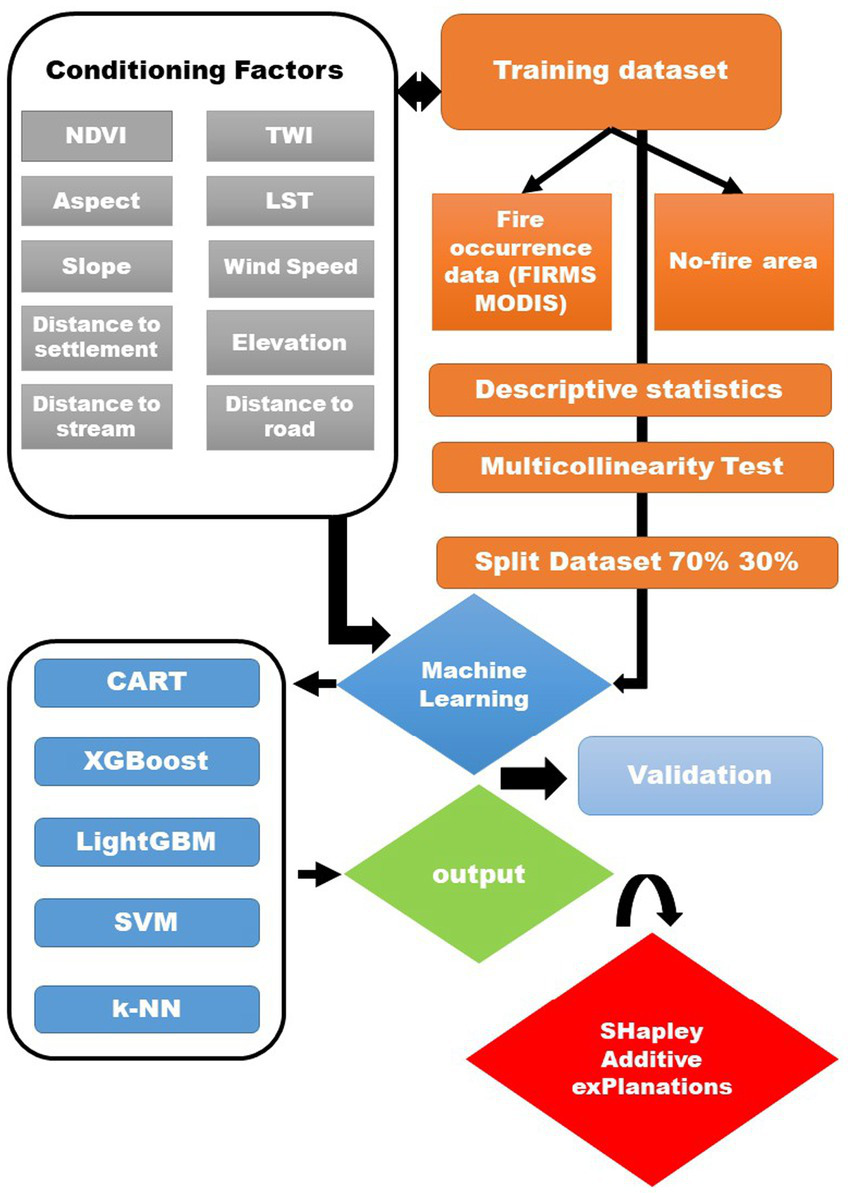
Workflow of wildfire susceptibility modeling using machine learning and SHAP analysis.
Table 2
| Conditioning factor | Effect on wildfire behavior | Reference |
|---|---|---|
| Aspect | South-facing slopes receive more solar radiation, creating warmer and drier conditions that favor fuel desiccation and increase the likelihood of ignition compared to cooler, shaded aspects. | Rogeau and Armstrong (2017) |
| Elevation | Higher elevations are generally cooler and moister, which reduces the probability of burning, whereas lower elevations provide warmer, drier fuels that are more conducive to fire activity. | Bar et al. (2023) |
| Slope | Steeper slopes enhance fire spread upslope due to heat transfer and preheating of fuels, while moderate slopes are more prone to ignition because they are more accessible and accumulate human activities. | Estes et al. (2017) |
| TWI (wetness index) | Areas with high TWI tend to be wetter and less flammable, while low TWI zones reflect drier soils that are more susceptible to ignition and sustain more severe burning conditions. | Gentilucci et al. (2024) |
| LST and Wind Speed | Elevated land surface temperatures dry out fuels and lower ignition thresholds, while strong winds accelerate flame spread by tilting fire fronts and supplying oxygen, thereby amplifying fire intensity. | Gentilucci et al. (2025). |
| NDVI | NDVI (Normalized Difference Vegetation Index) is widely used in fire-risk modeling: higher NDVI values indicate denser or more abundant vegetation, which provides more fuel and thus tends to correlate with higher fire risk in vegetated areas | Parajuli et al. (2020); Sultan et al. (2025) |
| Proximity to Roads/Settlements | Areas close to roads and settlements show higher fire incidence due to human activities, including accidental ignitions, recreation, and infrastructure-related sparks. | Molina et al. (2019); Nur et al. (2022) |
| Proximity to Water | Water bodies may reduce risk through higher moisture and microclimatic buffering, but in semi-arid regions, riparian zones often support dense fuels that increase ignition probability and fire spread. | Yue et al. (2023) |
Conditioning factors used in this study and their influence on wildfire behavior.
Dynamic variables such as NDVI, LST, and wind speed were derived from remote sensing products corresponding specifically to the summer of 2022, ensuring that all input layers reflect the same environmental and climatic conditions prevailing during that fire season. This temporal alignment between conditioning factors and fire occurrences was essential to preserve internal consistency. Using datasets from multiple years could introduce temporal mismatches, as post-fire vegetation loss or regeneration significantly alters NDVI and surface temperature values in subsequent years. Thus, using static 2022 layers allowed the model to capture realistic pre-fire conditions rather than post-disturbance states.
Spatial analysis layers were systematically generated using GIS-based methods (Table 3). In contrast, static variables such as topography (slope, aspect, and elevation), TWI, and proximity factors (roads, streams, and settlements) were derived from national datasets that remain stable over time. Population density was also included as a socio-demographic driver, using data from the most recent national census (2014), since updated spatial population data were unavailable.
Table 3
| Layer | Methodology |
|---|---|
| Distance from main streams | Distances to main streams were generated using the Euclidean Distance tool in ArcGIS, which computes the straight-line distance from each raster cell to the nearest stream. Stream networks were digitized from topographic maps and stored as vector datasets. |
| Elevation | Elevation values were obtained from a Digital Elevation Model (DEM) to represent topographic variability. The DEM was processed in ArcGIS to create a continuous raster surface of terrain height above sea level. |
| Slope | Slope was derived from the DEM using the Slope tool in ArcGIS, which calculates the maximum change in elevation between each cell and its neighbors. The resulting raster expresses terrain steepness in degrees or percentage rise, relevant for modeling fire spread. |
| Topographic Wetness Index (TWI) | TWI was calculated as: TWI = ln (, where A is the upslope contributing area and α is the slope angle. DEM data were processed using hydrological functions (flow accumulation and slope) to represent soil moisture distribution across the landscape. |
| Proximity to Roads/Settlements | Euclidean distances from roads and settlements were calculated using ArcGIS distance tools. Road and settlement networks were digitized from national topographic maps and converted to raster distance layers, representing potential ignition sources linked to human activity. |
| Population Density | Population density was derived from the Haut-Commissariat au Plan (HCP, 2014) census dataset. Population data were digitized, interpolated into raster format, and used as a socio-demographic factor representing human-caused fire ignition risk. |
GIS-based techniques are applied for generating spatial layers.
2.3 Machine learning in wildfire risk mapping
Machine learning has become a cornerstone in wildfire risk assessment, offering robust frameworks to model complex, nonlinear relationships between environmental factors and fire occurrence. Among the spectrum of ML approaches, methods such as Classification and Regression Trees (CART), Random Forest (RF), Support Vector Machine (SVM), k-Nearest Neighbors (k-NN), XGBoost, and LightGBM stand out for their proven effectiveness (Table 4).
Table 4
| ML model | Brief description | Example study |
|---|---|---|
| CART | A single decision tree model, known for its straightforward interpretability, often serves as a benchmark. | Used alongside RF to generate forest fire susceptibility maps; RF delivered slightly better performance (Sheriff et al., 2025) |
| SVM | A classifier that finds an optimal hyperplane for separation; effective with high-dimensional data. | SVM is also widely used in wildfire assessment due to its robust classification capabilities. A 2024 study in Frontiers in Remote Sensing compared SVM, Random Forest, and Neural Networks across pre-fire, fire, and post-fire stages using Sentinel-1B radar and Sentinel-2A optical imagery. Notably, SVM achieved the highest overall accuracy—94.97%—in the post-fire period when combining spectral and radar features, demonstrating exceptional effectiveness in delineating burned area (Chen et al., 2024) |
| k-NN | A non-parametric model that classifies based on the majority class among the closest training samples. | k-NN is a straightforward, instance-based classifier that assigns class labels based on the most common class among the nearest training samples in feature space. In the study conducted in central Portugal, researchers evaluated K-NN and Random Forest for mapping burned forest areas using Landsat-8, Sentinel-2, and Terra imagery. They found that both K-NN and Random Forest achieved high accuracy (Overall Accuracy > 89%, AUC between 0.88–0.94) across all satellite platforms, with no statistically significant difference in performance between the two methods (Pacheco et al., 2021) |
| XGBoost | A powerful boosting algorithm that builds models iteratively, often yielding top-tier performance in prediction tasks. | XGBoost, an efficient gradient boosting algorithm, has demonstrated strong performance in wildfire susceptibility modeling. In a case study of Antalya, southern Turkey, XGBoost achieved the highest accuracy (85.4%), slightly outperforming Random Forest (84.6%) and AdaBoost (78.9%). AUC metrics also favored XGBoost and Random Forest over AdaBoost by approximately 6 percent points, with McNemar’s test indicating comparable results between XGBoost and RF but significantly better performance than AdaBoost (Bilucan et al., 2024). |
| LightGBM | LightGBM is a highly efficient and scalable ensemble learning algorithm celebrated for its rapid execution and strong predictive performance. | In a wildfire susceptibility (Symeonidis et al., 2025) study targeting the Mediterranean provinces of Turkey—including Antalya—LightGBM achieved a commendable testing accuracy of 94.70%, outperforming XGBoost (88.8%), AdaBoost (86.0%), and standard Gradient Boosting (84.48%), though slightly trailing CatBoost (95.47%) (Abujayyab et al., 2022) |
Overview of machine learning models applied in wildfire susceptibility studies.
2.4 Construction of the training dataset
The construction of the training dataset followed a multi-step approach to ensure accuracy and representativeness. Wildfire occurrence records were obtained from the MODIS Fire Information for Resource Management System (FIRMS), which provides daily global fire detections based on thermal anomalies (Islam et al., 2017). To ensure temporal coherence with the dynamic conditioning factors, only fire points from 2022 were retained for model training and validation. This approach guarantees that the spectral and climatic characteristics at each fire location correspond to the actual environmental conditions at the time of the event. Including fire records from different years would have led to inconsistencies between fire locations and the static 2022 predictor maps, since post-fire changes can significantly alter vegetation and surface properties.
Following data compilation, extensive cleaning and verification were performed, including the removal of duplicates, exclusion of points outside the study area, and correction of spatial overlaps. Non-fire points were randomly generated across the study area while ensuring they did not overlap with recorded fires or buffer zones around them. To maintain class balance, an equal number of fire and non-fire points was retained.
The final dataset consisted of 228 fire points and 228 non-fire points, providing a balanced and representative sample of burned versus unburned areas. This dataset formed the foundation for training and validating the machine learning models, ensuring reliable and unbiased evaluation of wildfire susceptibility patterns.
2.5 Multicollinearity assessment
To guarantee the robustness of the analysis, it was necessary to examine the potential presence of multicollinearity among the explanatory variables. Multicollinearity arises when predictors are strongly interrelated, which can lead to redundancy and distort model outputs. A widely recognized approach for diagnosing this issue is the Variance Inflation Factor (VIF) (Moumane et al., 2025).
2.6 Performance metrics
To ensure a robust assessment of the machine learning models developed for wildfire susceptibility mapping, the dataset was divided into two subsets: 70% for training and 30% for testing. This partitioning allowed the algorithms to learn from a representative portion of the data while preserving an independent sample for unbiased validation (Moumane et al., 2025).
Model performance was evaluated using several complementary statistical indicators that collectively measure classification accuracy and predictive reliability. The confusion matrix provided a comprehensive summary of classification outcomes by quantifying true positives (TP), false positives (FP), true negatives (TN), and false negatives (FN). Beyond identifying misclassification patterns and class-specific biases, the confusion matrix was used to compute the overall accuracy of each model. Additionally, it served as the basis for calculating the F1-Score, which represents the harmonic mean of precision and recall, offering a balanced measure of model performance, particularly when handling datasets with class imbalance (Equations 1–4).
The Receiver Operating Characteristic (ROC) curve and its corresponding Area Under the Curve (AUC) were used to assess the models’ ability to discriminate between areas with high and low wildfire susceptibility. A higher AUC value indicates stronger model performance in distinguishing susceptible zones from non-susceptible ones.
2.7 Predictive susceptibility mapping
To create continuous fire susceptibility maps, the study area raster was first converted into a dense point dataset within ArcGIS 10.8. For each point, the values of the 10 conditioning factors were extracted and, following a data cleaning process to remove entries with missing values, the dataset was exported to Google Colab. There, the trained machine learning models were applied to predict a susceptibility value for each point, resulting in a value between 0 (non-fire point) and 1 (fire point) alongside its geographic coordinates. These predicted points were then re-imported into ArcGIS, where the Kriging interpolation method was employed to transform the discrete point data into a seamless spatial surface. Finally, this continuous output was classified into four distinct susceptibility zones: Low (0–0.25), Medium (0.25–0.5), High (0.5–0.75), and Very High (0.75–1).
2.8 SHAP Explainability analysis
To complement the machine learning models, we employed the SHAP framework to interpret the contribution of conditioning factors to wildfire susceptibility. SHAP is grounded in cooperative game theory and provides a unified measure of feature importance by assigning each predictor a marginal contribution to the model’s output. Unlike traditional importance metrics that only capture global relevance, SHAP values enable both global interpretation (ranking variables by their average influence across the study area) and local interpretation (examining how each factor drives individual predictions).
2.9 Computational environment
All machine learning modeling and computational experiments were conducted within the Google Colaboratory cloud-based environment. The analyses were performed using Python 3.10.12, leveraging a suite of standard data science and machine learning libraries, including `scikit-learn` for CART, SVM, and k-NN implementations, `XGBoost`, and `LightGBM`. To ensure the complete reproducibility of all results, a fixed random seed of `42` was implemented globally. This seed was consistently applied to the train-test data split and to the initialization of all stochastic algorithms.
All models were configured with their default hyperparameters to provide a baseline for comparison, with the exception of the random seed specification.
SHAP analysis was performed. The analysis was conducted using the `shap` Python library (version 0.44.0) on the same feature dataset used for model training. The SHAP analysis was applied to the LightGBM and XGBoost models, as these are natively supported by SHAP’s TreeExplainer for exact computation of Shapley values.
For each model, the analysis generated:
-
SHAP Summary Plots (Beeswarm plots): Visualizing the distribution of the impact each feature has on the model output for every individual prediction in a sampled dataset.
-
SHAP Feature Importance Plots: Ranking the features based on their mean absolute SHAP values, representing their overall importance in the model’s decision-making process.
-
SHAP Interaction Plots: Where computationally feasible, interaction values were calculated to reveal how feature pairs jointly impact the predictions.
3 Results
3.1 Descriptive statistics of features
Based on the comprehensive comparative analysis, the environmental factors distinguishing fire-prone areas from non-fire zones reveal a compelling pattern of fire susceptibility driven by specific topographic, vegetative, and anthropogenic conditions (Figures 5, 6; Tables 5, 6). The data confirm that fire occurrences are strongly associated with significantly higher elevation terrain, evidenced by a striking 115% increase in mean elevation at fire sites, moving from approximately 302 meters to 649 meters, indicating that fires predominantly affect higher altitude landscapes with distinct microclimates and vegetation types. This elevation effect is complemented by substantially steeper slopes in fire zones, showing a 69% increase in mean slope values (Table 7), which facilitates rapid drainage and enhances fire spread dynamics through improved air circulation and fuel drying. The vegetative profile further distinguishes fire-prone areas with a remarkable 93% increase in NDVI values, confirming that denser, healthier vegetation serves as the fundamental fuel source necessary for fire ignition and propagation. Spatial analysis reveals critical patterns of remoteness, with fire locations positioned considerably farther from human influence—showing a 118% increase in distance to settlements and 64% increase in distance to roads—highlighting how reduced human presence and limited fire response capability heighten vulnerability. Additionally, the hydrological context shows fire areas are 49% farther from streams, indicating moisture-deficient environments where reduced ambient humidity and limited water access create favorable fire conditions. The topographic wetness index further supports this aridity pattern with a 15% decrease in TWI values at fire sites, confirming that drier landscapes are more susceptible. While temperature and aspect show minimal differentiation, the consistency across all major environmental factors paints a clear portrait of fire-vulnerable landscapes as remote, high-elevation, densely vegetated territories where topographic steepness, vegetative abundance, and limited human intervention converge to create ideal conditions for fire occurrence, providing crucial validation for targeted fire susceptibility modeling and prevention strategies.
Figure 5
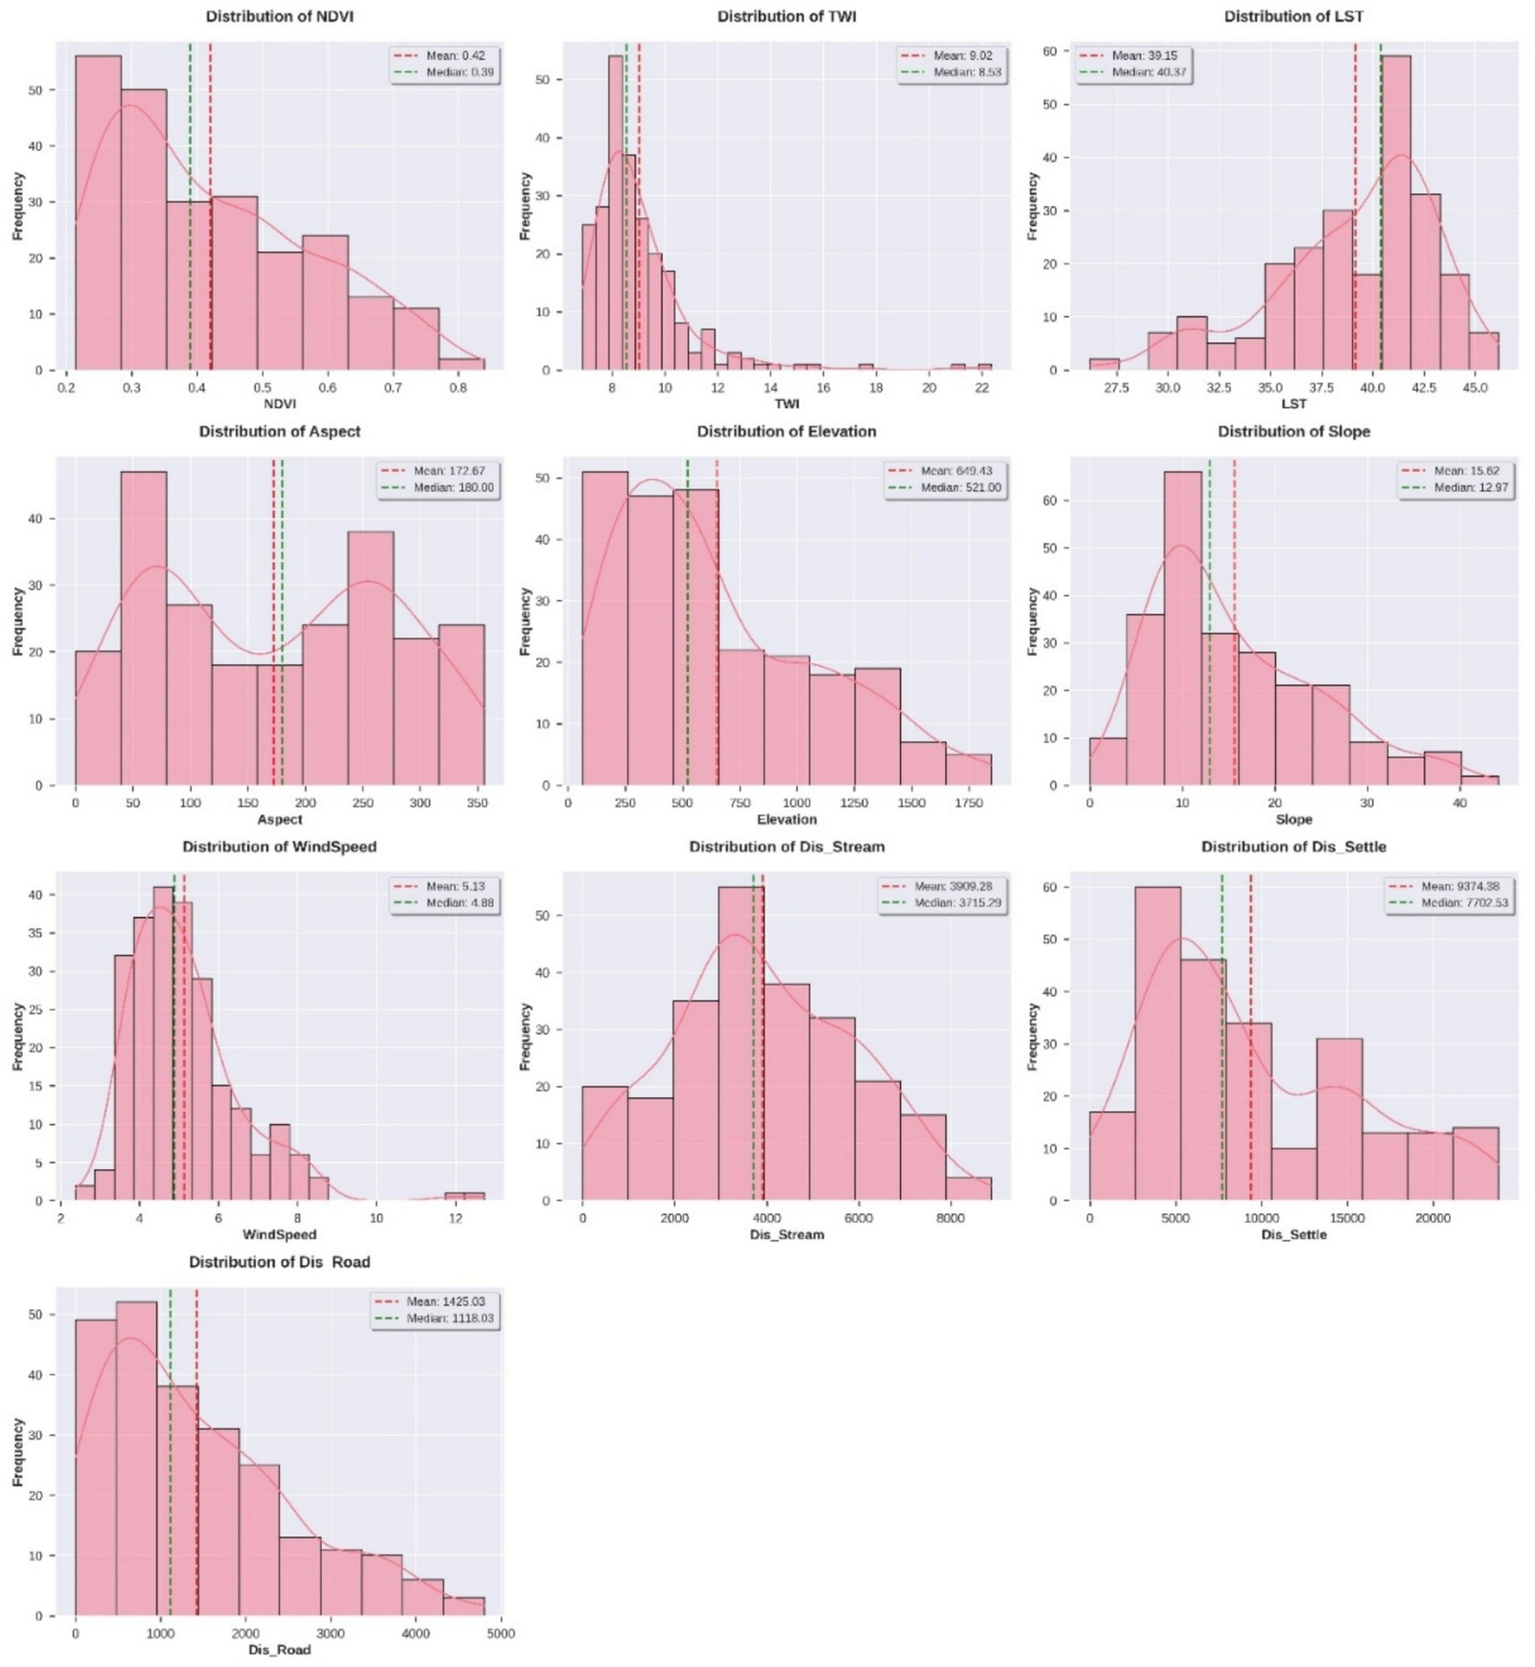
Distribution of environmental factors in wildfire training dataset (fire points).
Figure 6
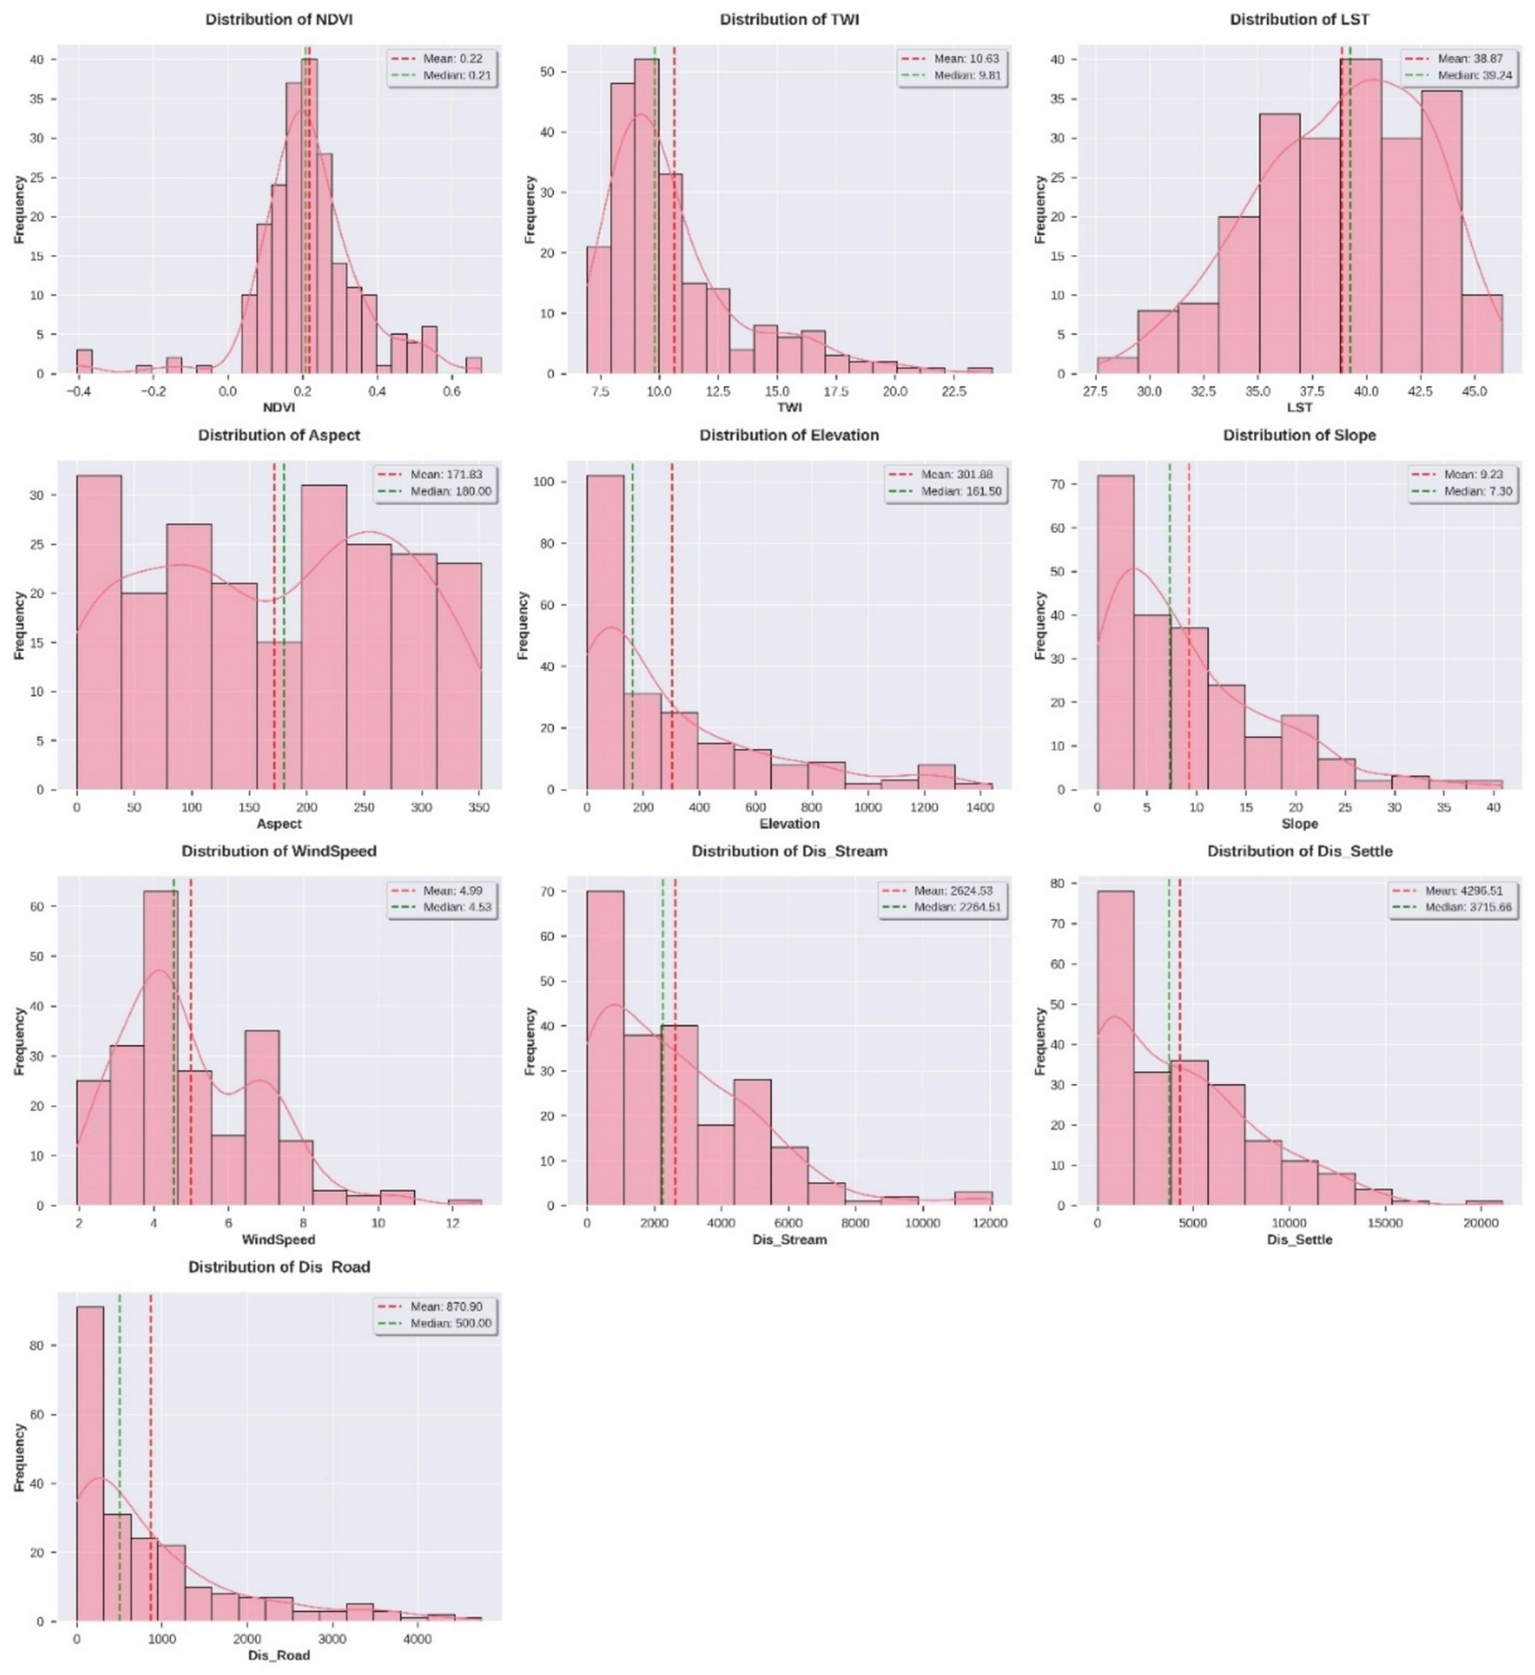
Distribution of environmental factors in wildfire training dataset (Non-fire points).
Table 5
| Features | Count | Mean | Min | Max | Mode | Range |
|---|---|---|---|---|---|---|
| NDVI | 228 | 0.42 | 0.21 | 0.83 | 0.21 | 0.62 |
| TWI | 228 | 9.02 | 6.88 | 22.35 | 6.92 | 15.47 |
| LST | 228 | 39.14 | 26.19 | 46.13 | 31.05 | 19.93 |
| Aspect | 228 | 172.67 | 0 | 355.62 | 270 | 355.62 |
| Elevation | 228 | 649.43 | 64 | 1848 | 150 | 1784 |
| Slope | 228 | 15.61 | 0 | 44.19 | 8.28 | 44.19 |
| WindSpeed | 228 | 5.13 | 2.38 | 12.72 | 3.53 | 10.34 |
| Dis_Stream | 228 | 3909.28 | 0 | 8882.13 | 3140.31 | 8882.13 |
| Dis_Settle | 228 | 9374.37 | 0 | 23,809 | 0 | 23,809 |
| Dis_Road | 228 | 1425.03 | 0 | 4802.33 | 250 | 4802.33 |
Descriptive statistics of environmental and topographic features in fire areas.
Table 6
| Features | Count | Mean | Min | Max | Mode | Range |
|---|---|---|---|---|---|---|
| NDVI | 228 | 0.21 | −0.40 | 0.67 | −0.4 | 1.08 |
| TWI | 228 | 10.62 | 6.94 | 24.11 | 10.11 | 17.17 |
| LST | 228 | 38.86 | 27.59 | 46.27 | 30.79 | 18.68 |
| Aspect | 228 | 171.82 | 0 | 352.27 | 0 | 352.27 |
| Elevation | 228 | 301.88 | 0 | 1,442 | 3 | 1,442 |
| Slope | 228 | 9.22 | 0 | 40.89 | 0 | 40.89 |
| WindSpeed | 228 | 4.98 | 1.93 | 12.77 | 1.93 | 10.83 |
| Dis_Stream | 228 | 2624.52 | 0 | 12064.70 | 0 | 12064.70 |
| Dis_Settle | 228 | 4296.5 | 0 | 21116.09 | 0 | 21116.09 |
| Dis_Road | 228 | 870.89 | 0 | 4,750 | 0 | 4,750 |
Descriptive statistics of environmental and topographic features in non-fire areas.
Table 7
| Feature | Mean difference (Non-fire – fire) | Mean % change |
|---|---|---|
| NDVI | 0.20265457 | 93.17839673 |
| TWI | −1.6 | −15.0659134 |
| LST | 0.27915923 | 0.71825937 |
| Aspect | 0.8479323 | 0.49348338 |
| Elevation | 347.5520392 | 115.1289235 |
| Slope | 6.390939604 | 69.27315471 |
| WindSpeed | 0.14815893 | 2.971510605 |
| Dis_Stream | 1284.754357 | 48.95183041 |
| Dis_Settle | 5077.870064 | 118.1859951 |
| Dis_Road | 554.1347153 | 63.62811735 |
Changes of features between fire and non-fire areas.
3.2 Multicollinearity diagnosis
The multicollinearity assessment presented in Figure 7 combines two complementary analyses to evaluate redundancy among the 10 conditioning factors used for forest fire susceptibility modeling.
Figure 7
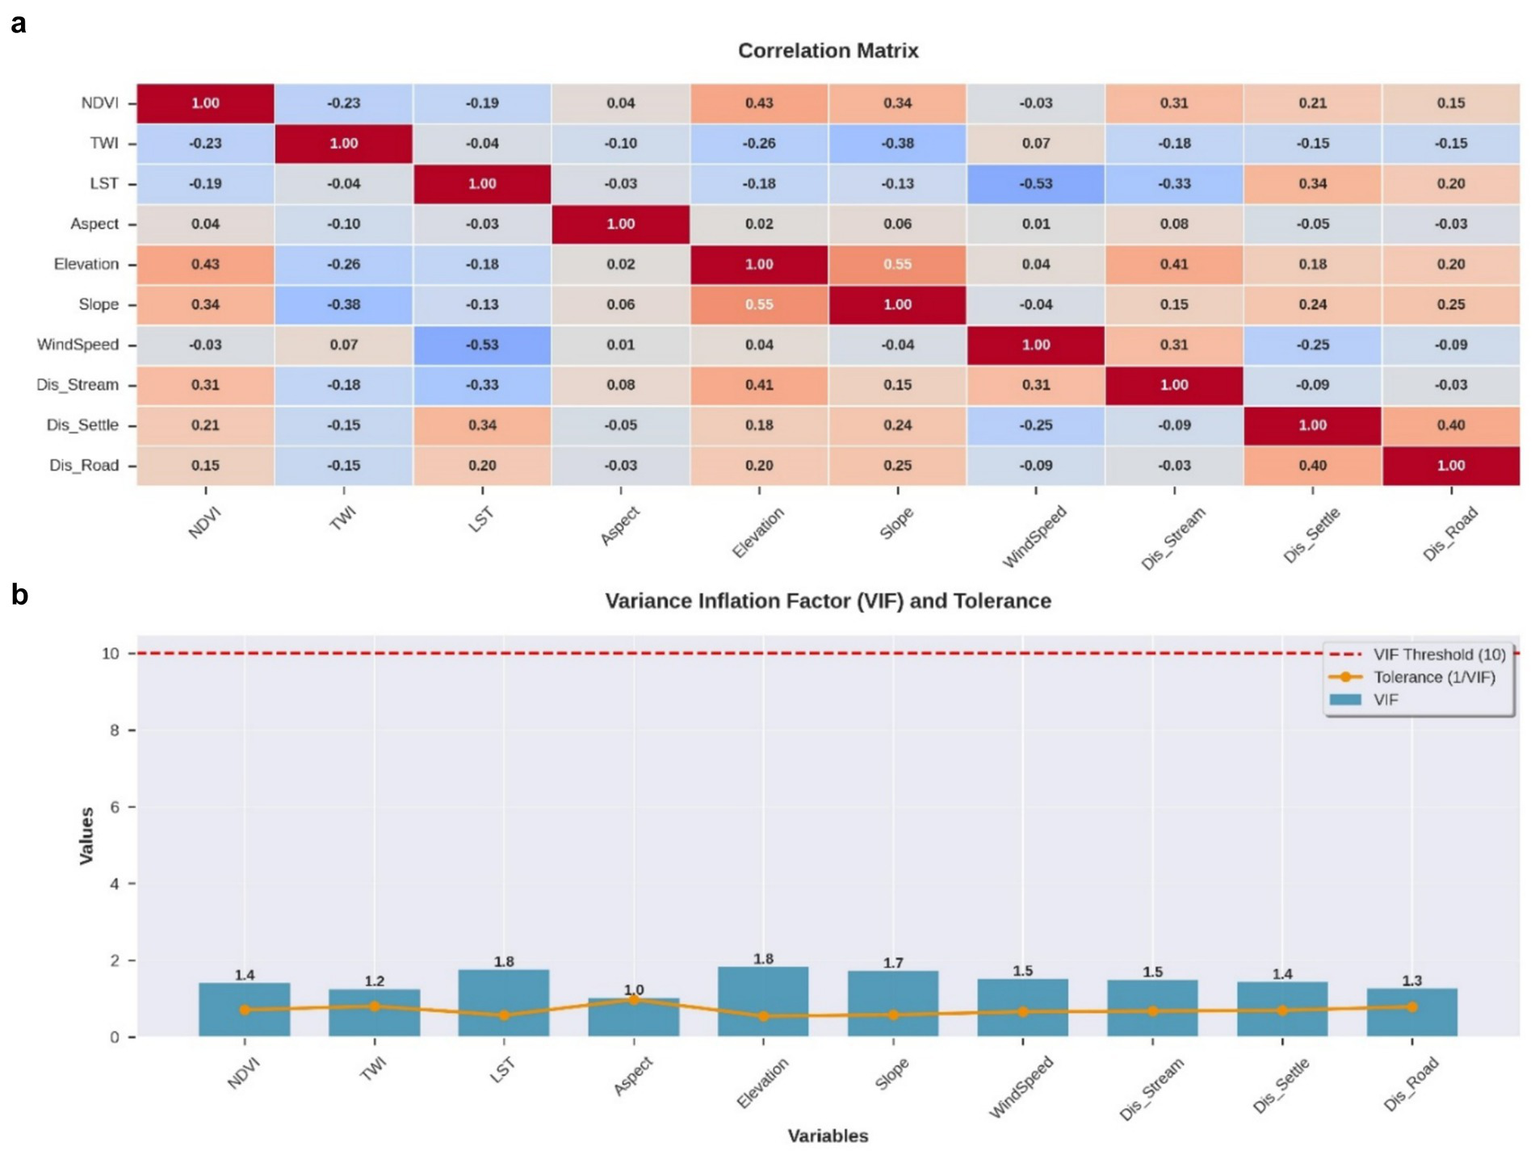
Multicollinearity assessment of conditioning factors used for forest fire susceptibility modeling: (a) Pearson correlation matrix showing pairwise relationships between environmental and anthropogenic variables; (b) Variance inflation factor.
The Pearson correlation matrix (Figure 7a) reveals that most pairwise correlation coefficients range from weak to moderate (|r| < 0.6), suggesting generally low linear dependency between variables. The strongest correlation is observed between distance to settlements and distance to roads (r = 0.69), indicating significant spatial overlap in anthropogenic infrastructure patterns. A notable negative correlation exists between LST and wind speed (r = −0.58), reflecting the inverse relationship between temperature and atmospheric dynamics in the study area. Moderate positive correlations are evident between elevation and distance to streams (r = 0.41), consistent with expected topographic-hydrological relationships, and between NDVI and slope (r = 0.34), suggesting vegetation preference for steeper terrain. Other correlations, such as between aspect and remaining variables, remain weak (|r| < 0.3), indicating minimal directional influence on other environmental factors.
The Variance Inflation Factor (VIF) and tolerance analysis (Figure 7b) confirm the absence of problematic multicollinearity across all predictors. VIF values for all variables remain well below the conservative threshold of 10, with most factors demonstrating VIF scores below 3. This indicates that each conditioning factor contributes unique explanatory power to the susceptibility model without significant redundancy, ensuring stable parameter estimates and reliable model interpretation for forest fire prediction.
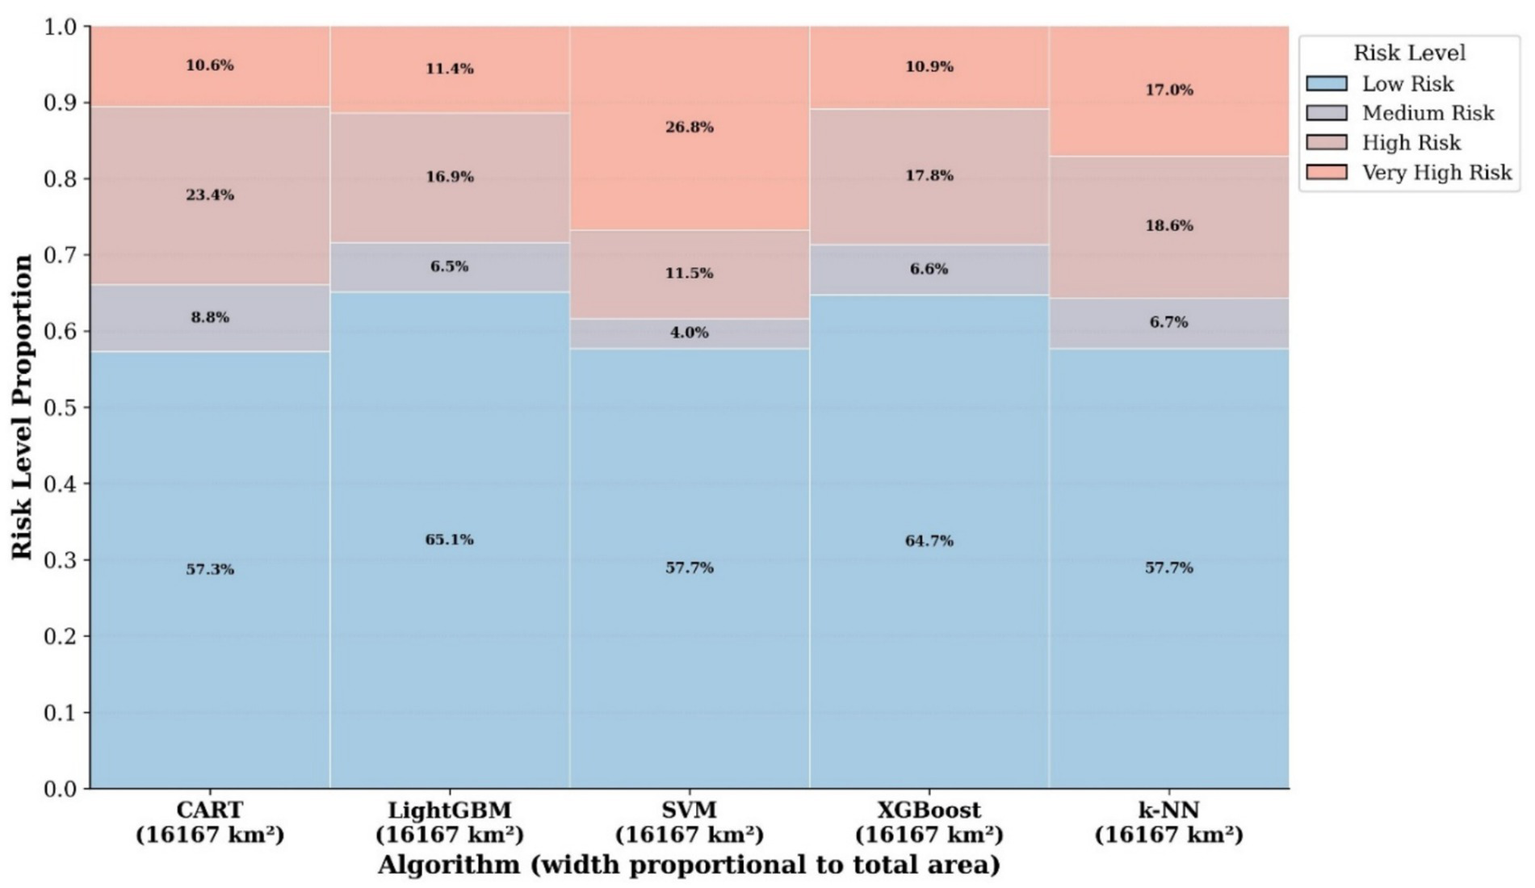
3.3 Comparative analysis of fire susceptibility areas across models
The comparative analysis of predicted fire susceptibility areas highlights clear spatial and quantitative differences among the five machine learning models (Figure 8). In the low-susceptibility class, LightGBM (65.1%) and XGBoost (64.7%) allocate the largest areas, indicating a classification approach that favors lower-risk identification across the landscape. In contrast, SVM (57.7%), k-NN (57.7%), and CART (57.3%) assign smaller extents to this class.
Figure 8
Area distribution of forest fire susceptibility classes predicted by machine learning algorithms.
For the medium-susceptibility class, CART records the highest estimate (8.8%), followed by k-NN (6.7%), while SVM predicts the lowest (4%).
Conversely, the very high-susceptibility class exhibits an opposite trend: SVM predicts a considerably large area (26.8%), more than double that of LightGBM (11.4%), with k-NN (17%) also showing a strong inclination toward extreme-risk mapping, while CART (10.6%) remains more restrained.
Ensemble-based models (LightGBM, XGBoost) tend to cluster their predictions toward low and medium hazard levels, while SVM and k-NN emphasize extreme-risk zones. CART occupies an intermediate position (Figure 9).
Figure 9
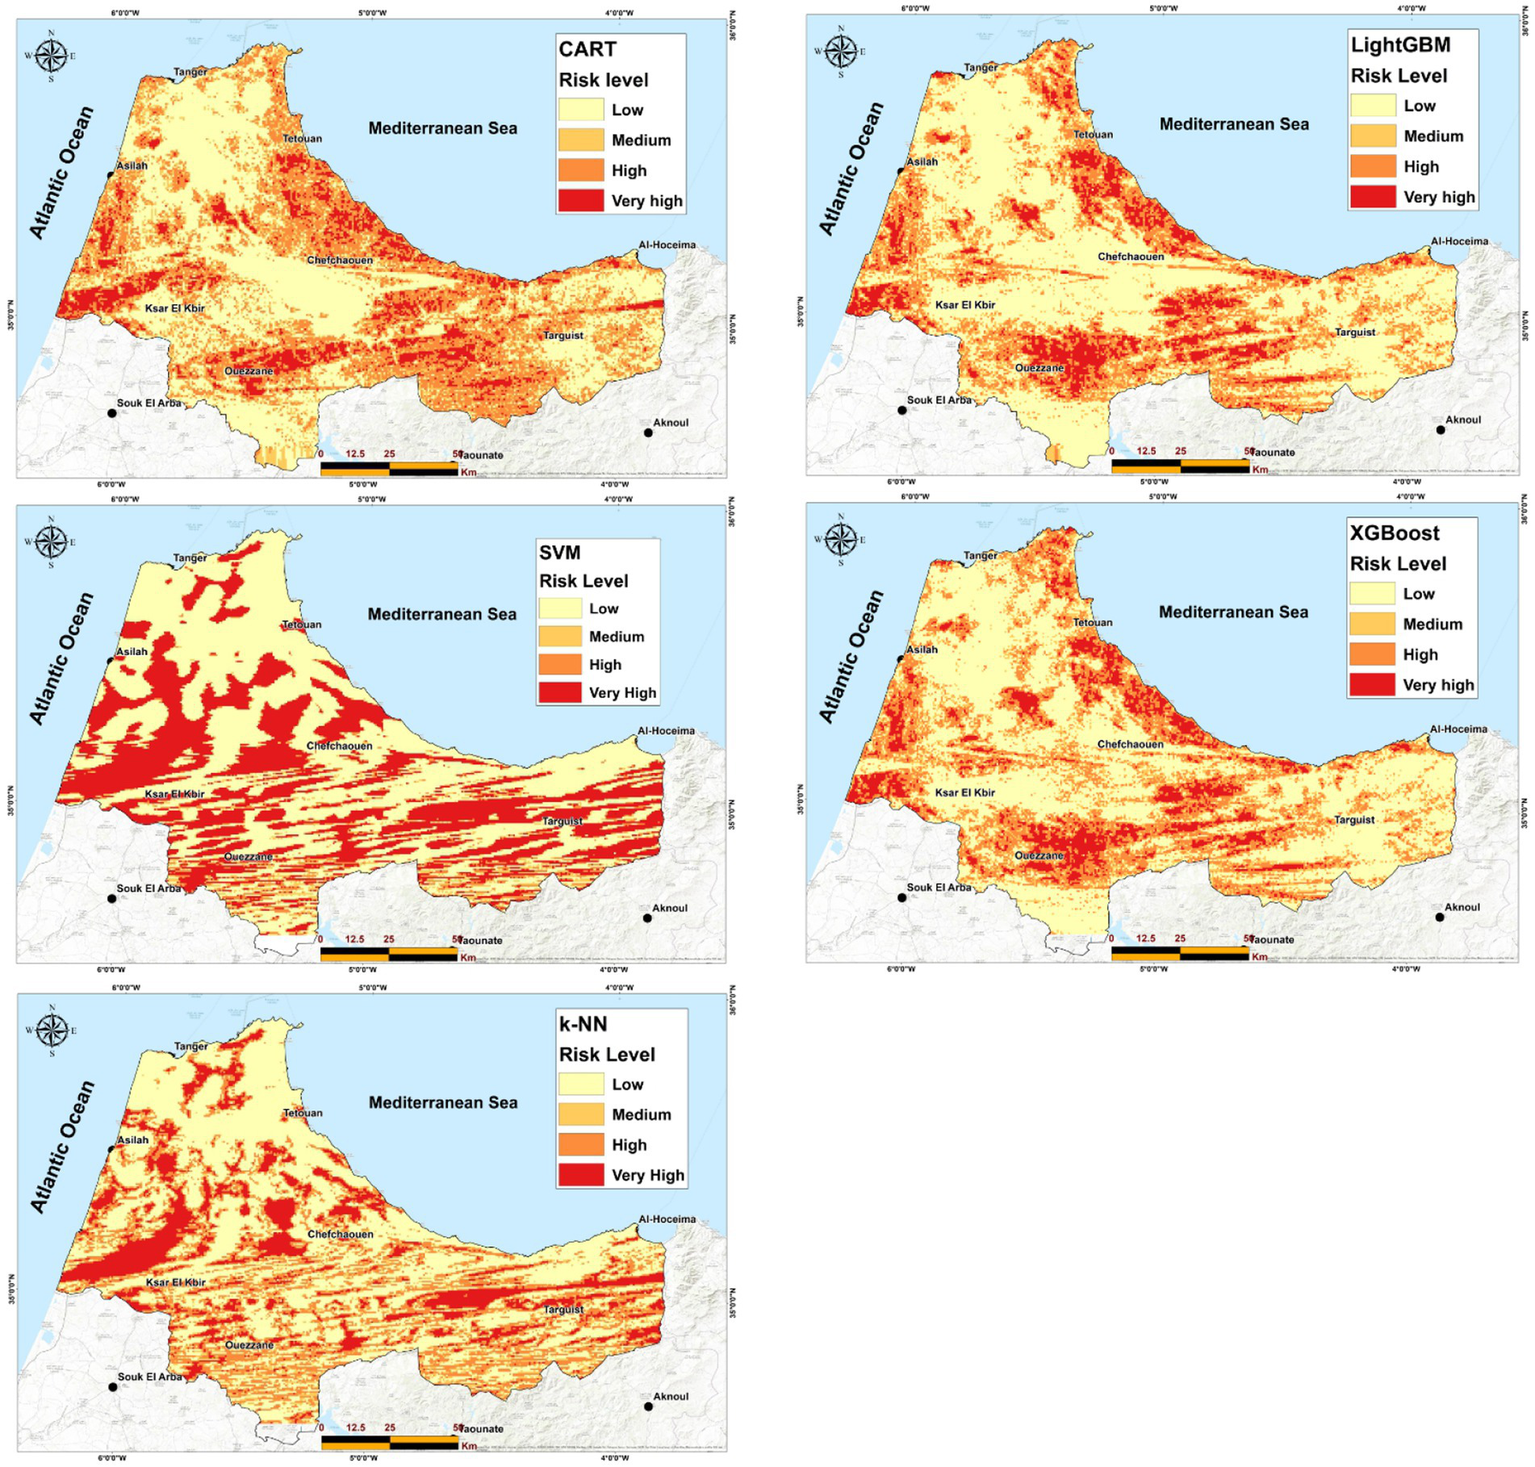
Spatial distribution of forest fire susceptibility across Northern Morocco as predicted by machine learning models.
3.4 Validation
The comparative assessment of five machine learning algorithms revealed clear differences in their predictive performance for wildfire susceptibility mapping. The CART model achieved moderate results (accuracy = 0.891, AUC = 0.889), whereas k-NN (accuracy = 0.766) and SVM (accuracy = 0.774) demonstrated noticeably weaker predictive capabilities (Figures 10, 11). In contrast, XGBoost yielded the most robust performance, attaining the highest accuracy (0.920) and excellent F1-scores for both fire (0.926) and non-fire (0.912) categories (Figures 12, 13), followed closely by LightGBM (accuracy = 0.905, AUC = 0.965). Both ensemble-based models substantially outperformed the conventional CART, k-NN, and SVM algorithms. The remarkably high AUC values (0.965) obtained for LightGBM and XGBoost underscore their exceptional ability to discriminate between fire and non-fire conditions, achieving a well-balanced trade-off between precision and recall. These findings confirm the superior efficiency of gradient boosting approaches in modeling complex environmental processes, particularly in capturing the nonlinear dependencies among wildfire-driving factors in Mediterranean landscapes.
Figure 10
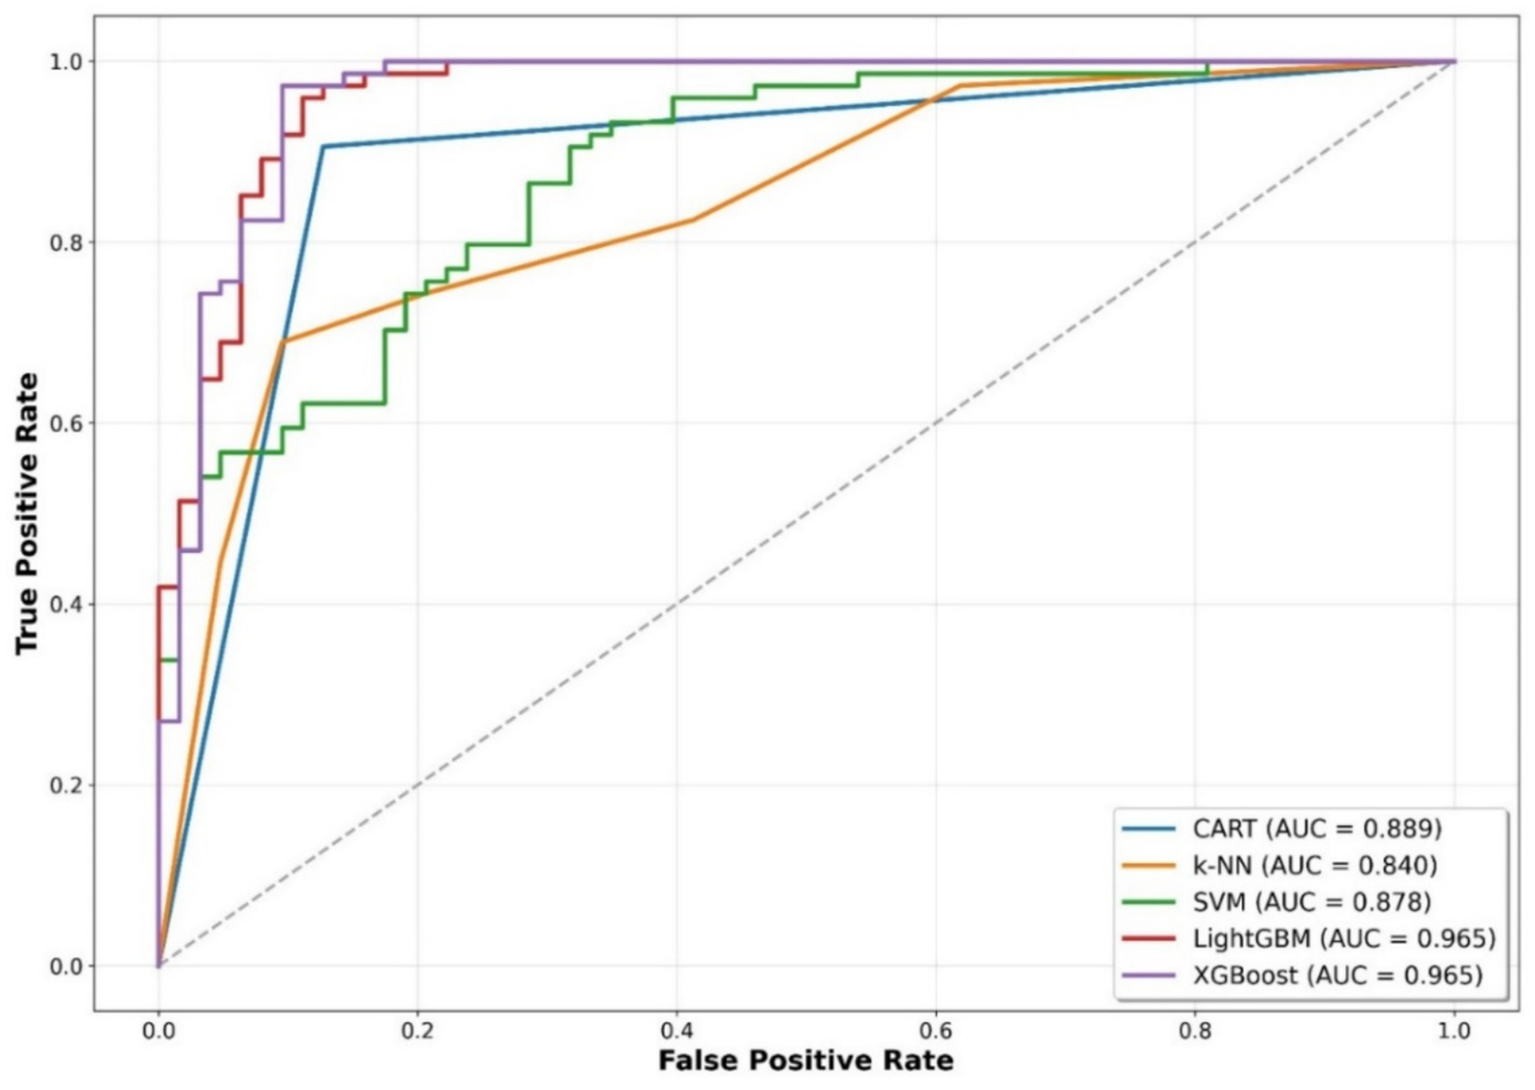
Combined ROC curves illustrating classification performance of all machine learning models.
Figure 11
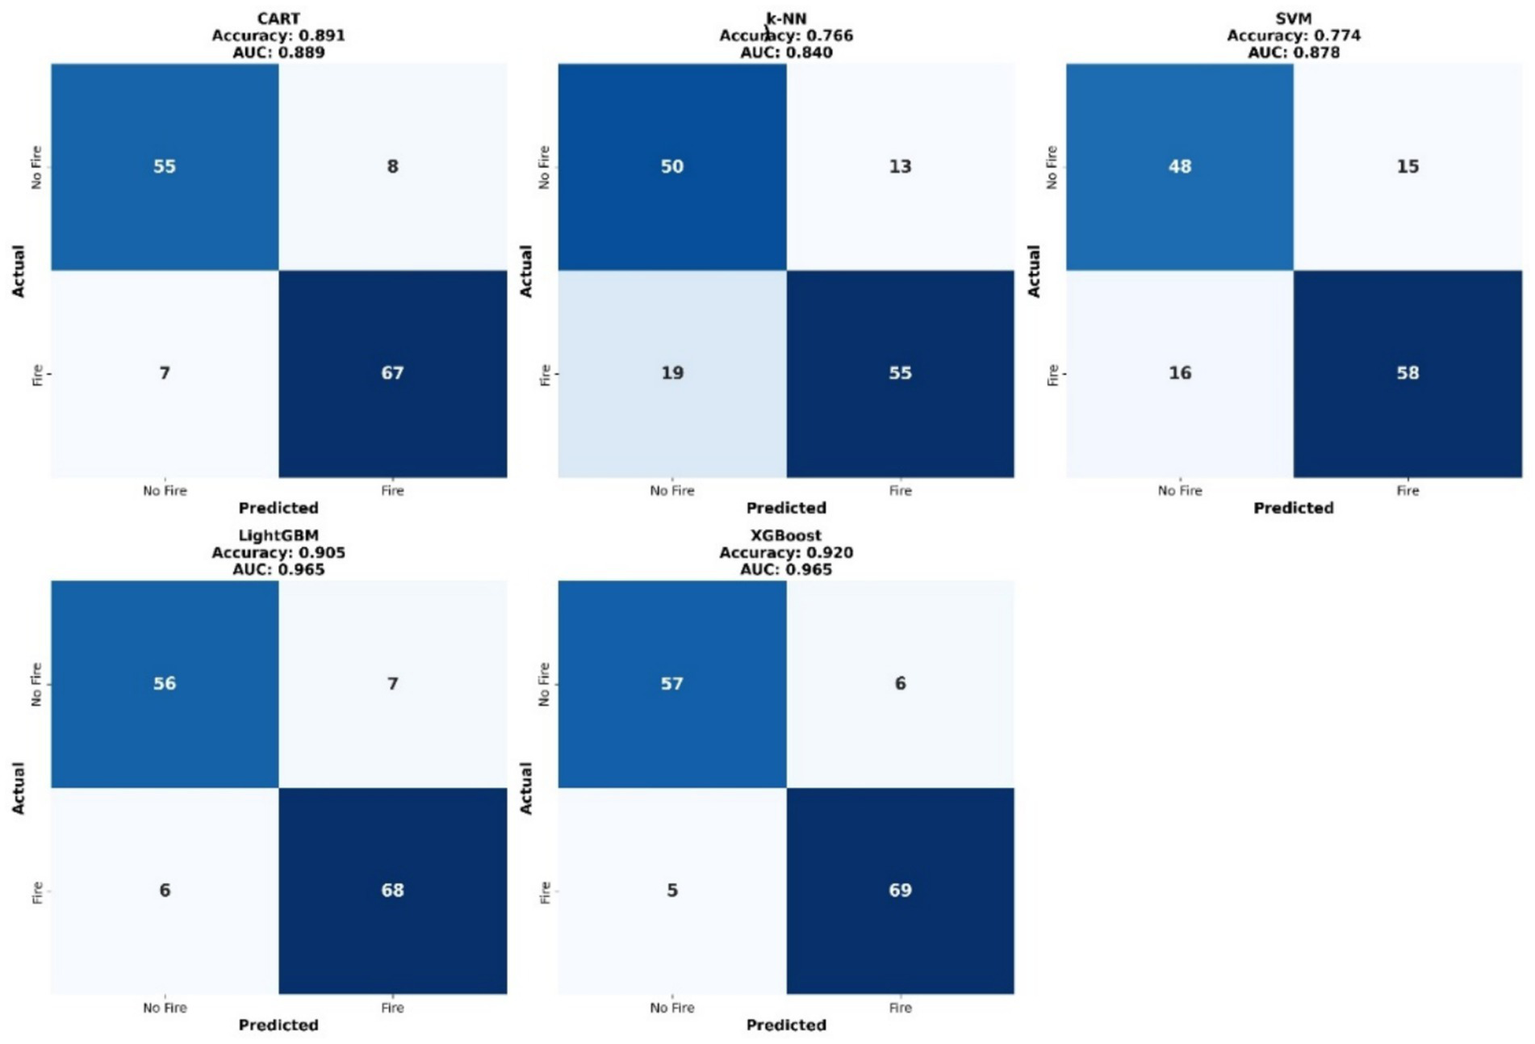
Comparative confusion matrices for all machine learning models.
Figure 12
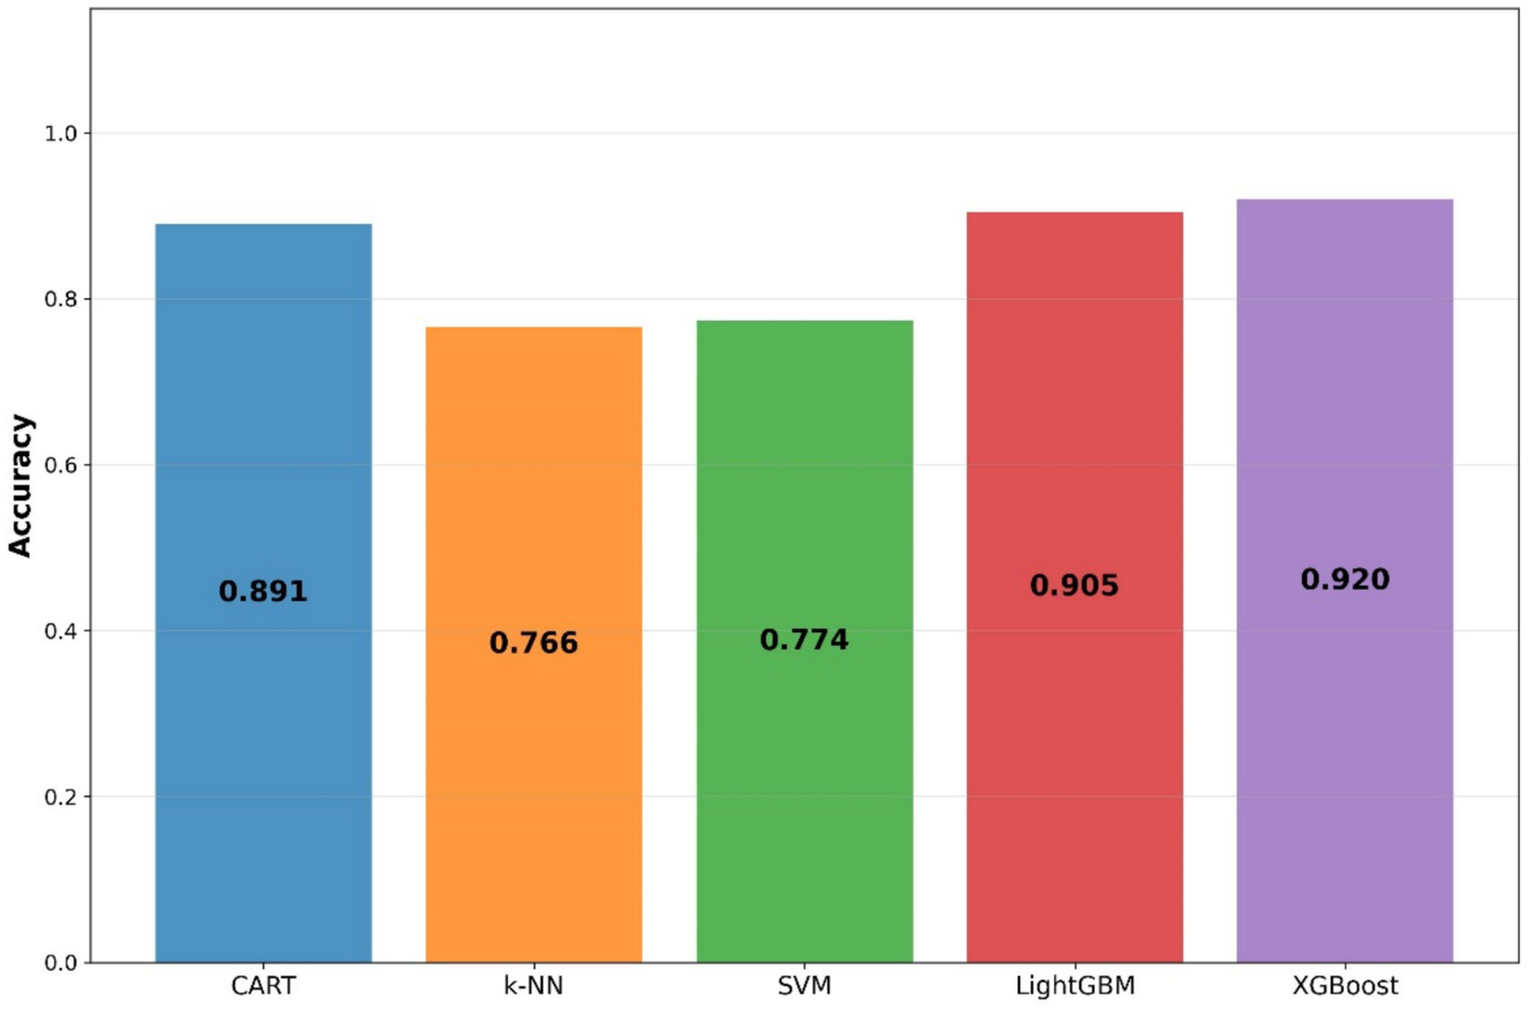
Accuracy assessment of all machine learning models.
Figure 13
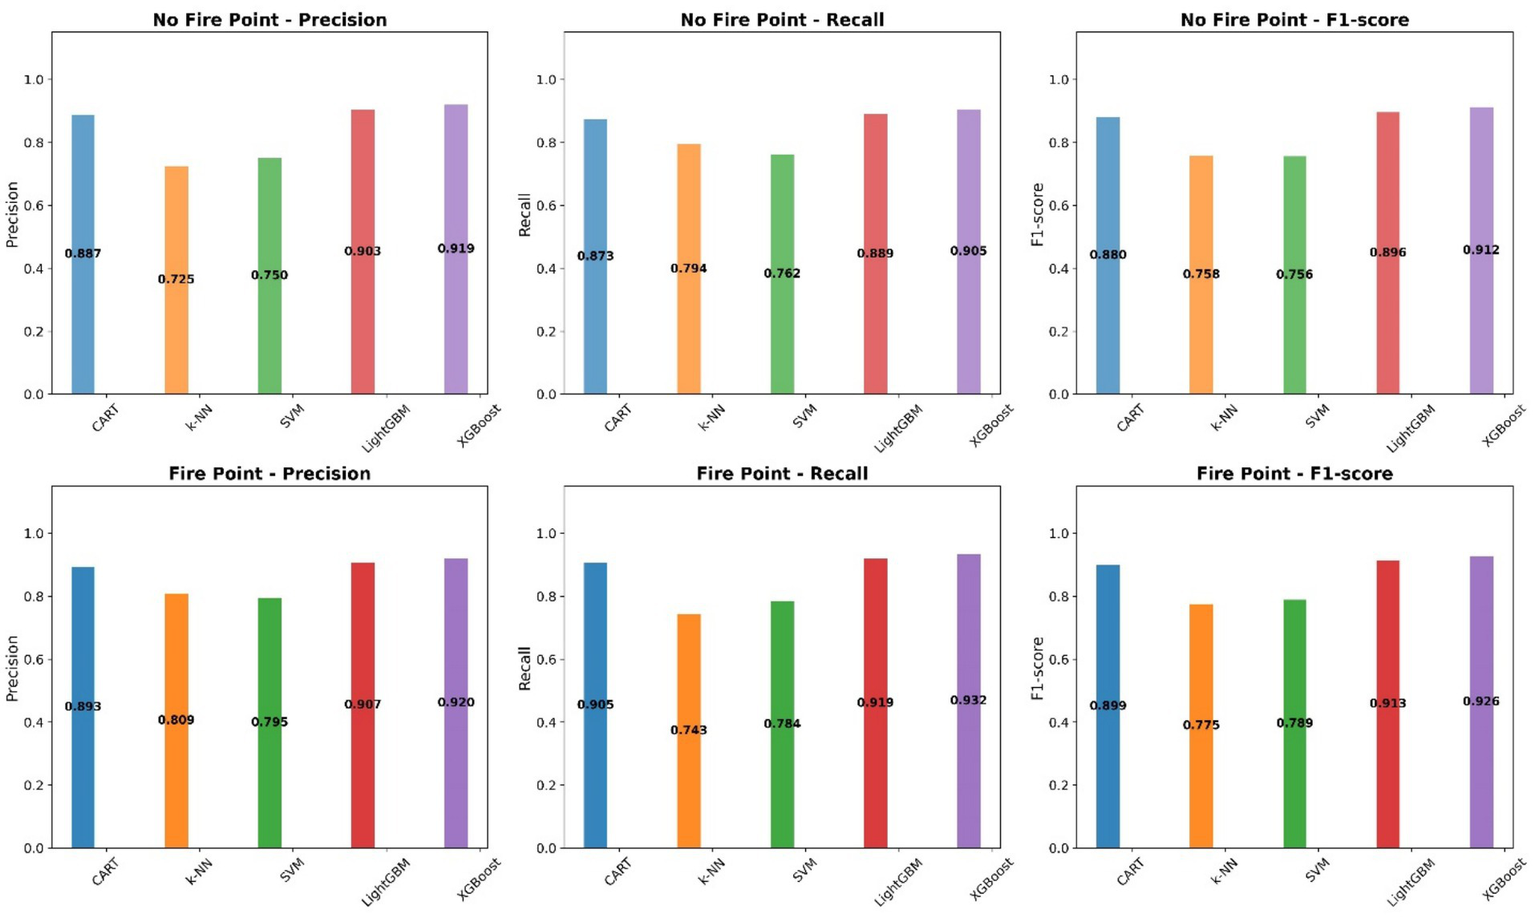
Comparative bar chart illustrating accuracy, precision, recall, and F1-score for fire and non-fire points across five machine learning models.
3.5 SHapley additive exPlanations analysis
3.5.1 Global feature importance
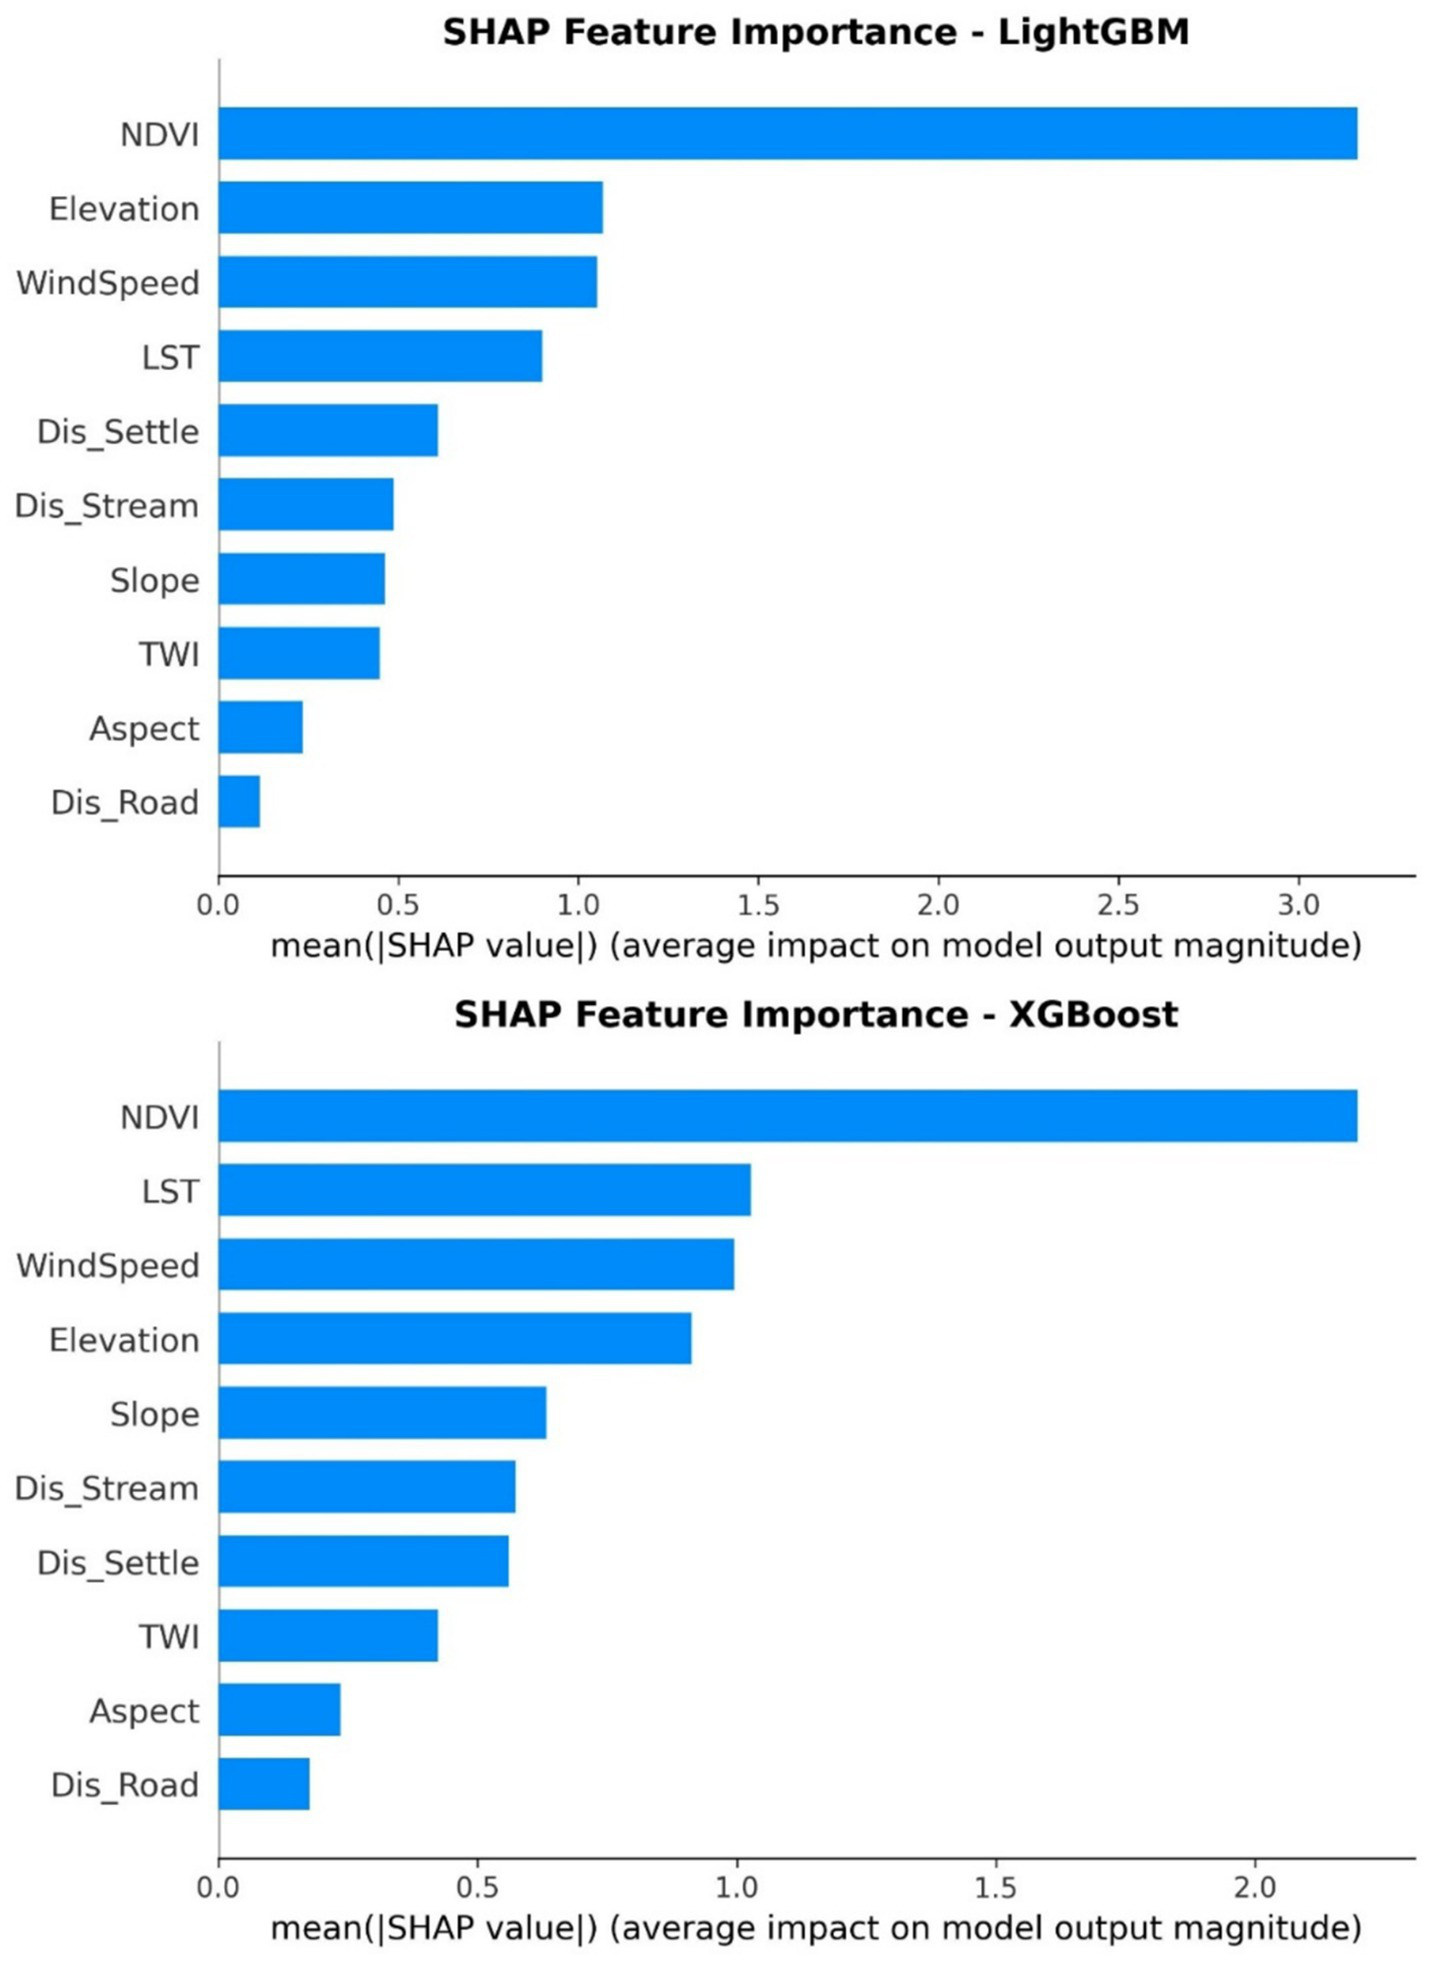
The SHAP global feature importance results reveal distinct patterns in wildfire susceptibility drivers between the two ensemble models (Figure 14). Both LightGBM and XGBoost consistently identify NDVI as the most influential variable, with mean SHAP values of approximately 3.0 and 2.0, respectively, indicating its dominant role in shaping wildfire predictions. High NDVI values, representing denser vegetation, consistently increase fire risk by providing abundant combustible biomass, while sparse vegetation (low NDVI) reduces susceptibility.
Figure 14
Global SHAP bar plot of average feature importance.
However, the models diverge in their secondary predictors. LightGBM prioritizes Elevation (≈2.5 SHAP) and WindSpeed (≈2.2 SHAP) as the next most important factors, suggesting this model emphasizes topographic and meteorological influences. Higher elevations may correlate with specific fuel types and microclimates, while increased wind speeds accelerate fire spread and intensity.
In contrast, XGBoost assigns greater importance to LST (Land Surface Temperature, ≈1.8 SHAP) as the second-most influential variable, followed by WindSpeed (≈1.6 SHAP) and Elevation (≈1.5 SHAP). This indicates XGBoost places stronger emphasis on thermal conditions that promote fuel drying and ignition probability.
Both models show moderate contributions from Distance to Streams and Distance to Settlements, though their relative importance differs between algorithms. Lower-impact variables include Slope, TWI, Aspect, and Distance to Roads, with minimal influence on model predictions.
The divergence in feature rankings between LightGBM and XGBoost highlights the complex, multi-factorial nature of wildfire susceptibility, where different algorithms capture varying aspects of the environmental drivers while converging on vegetation density as the primary determinant.
3.5.2 Beeswarm analysis of feature contributions
The SHAP beeswarm plot for LightGBM reveals distinct patterns in wildfire susceptibility drivers across the study area (Figure 15). NDVI dominates the model with the widest SHAP value spread (−8 to +4), where high vegetation density (red dots) strongly increases fire risk by providing abundant combustible biomass, while sparse vegetation (blue dots) significantly reduces susceptibility. Elevation shows a clear positive relationship, with higher elevations consistently pushing predictions toward higher risk, likely due to specific fuel types and microclimates in elevated terrain. WindSpeed demonstrates a strong directional effect where higher wind values substantially increase fire risk through accelerated spread and intensity, while calmer conditions provide protective effects. LST exhibits mixed but generally positive influence, with warmer conditions (red) tending to increase risk through enhanced fuel drying. Distance to settlements shows an interesting pattern where closer proximity moderately increases risk, suggesting human ignition sources, while more remote areas experience reduced fire probability. Distance to streams displays a protective effect, with closer water proximity reducing risk through moisture buffering, while drier distant areas show elevated susceptibility. Slope, TWI, Aspect, and Distance to roads show minimal but interpretable effects, with steeper slopes and drier conditions (low TWI) slightly increasing risk, while road proximity has negligible influence (Figure 16).
Figure 15

SHAP beeswarm plot of feature contributions to fire-risk prediction.
Figure 16
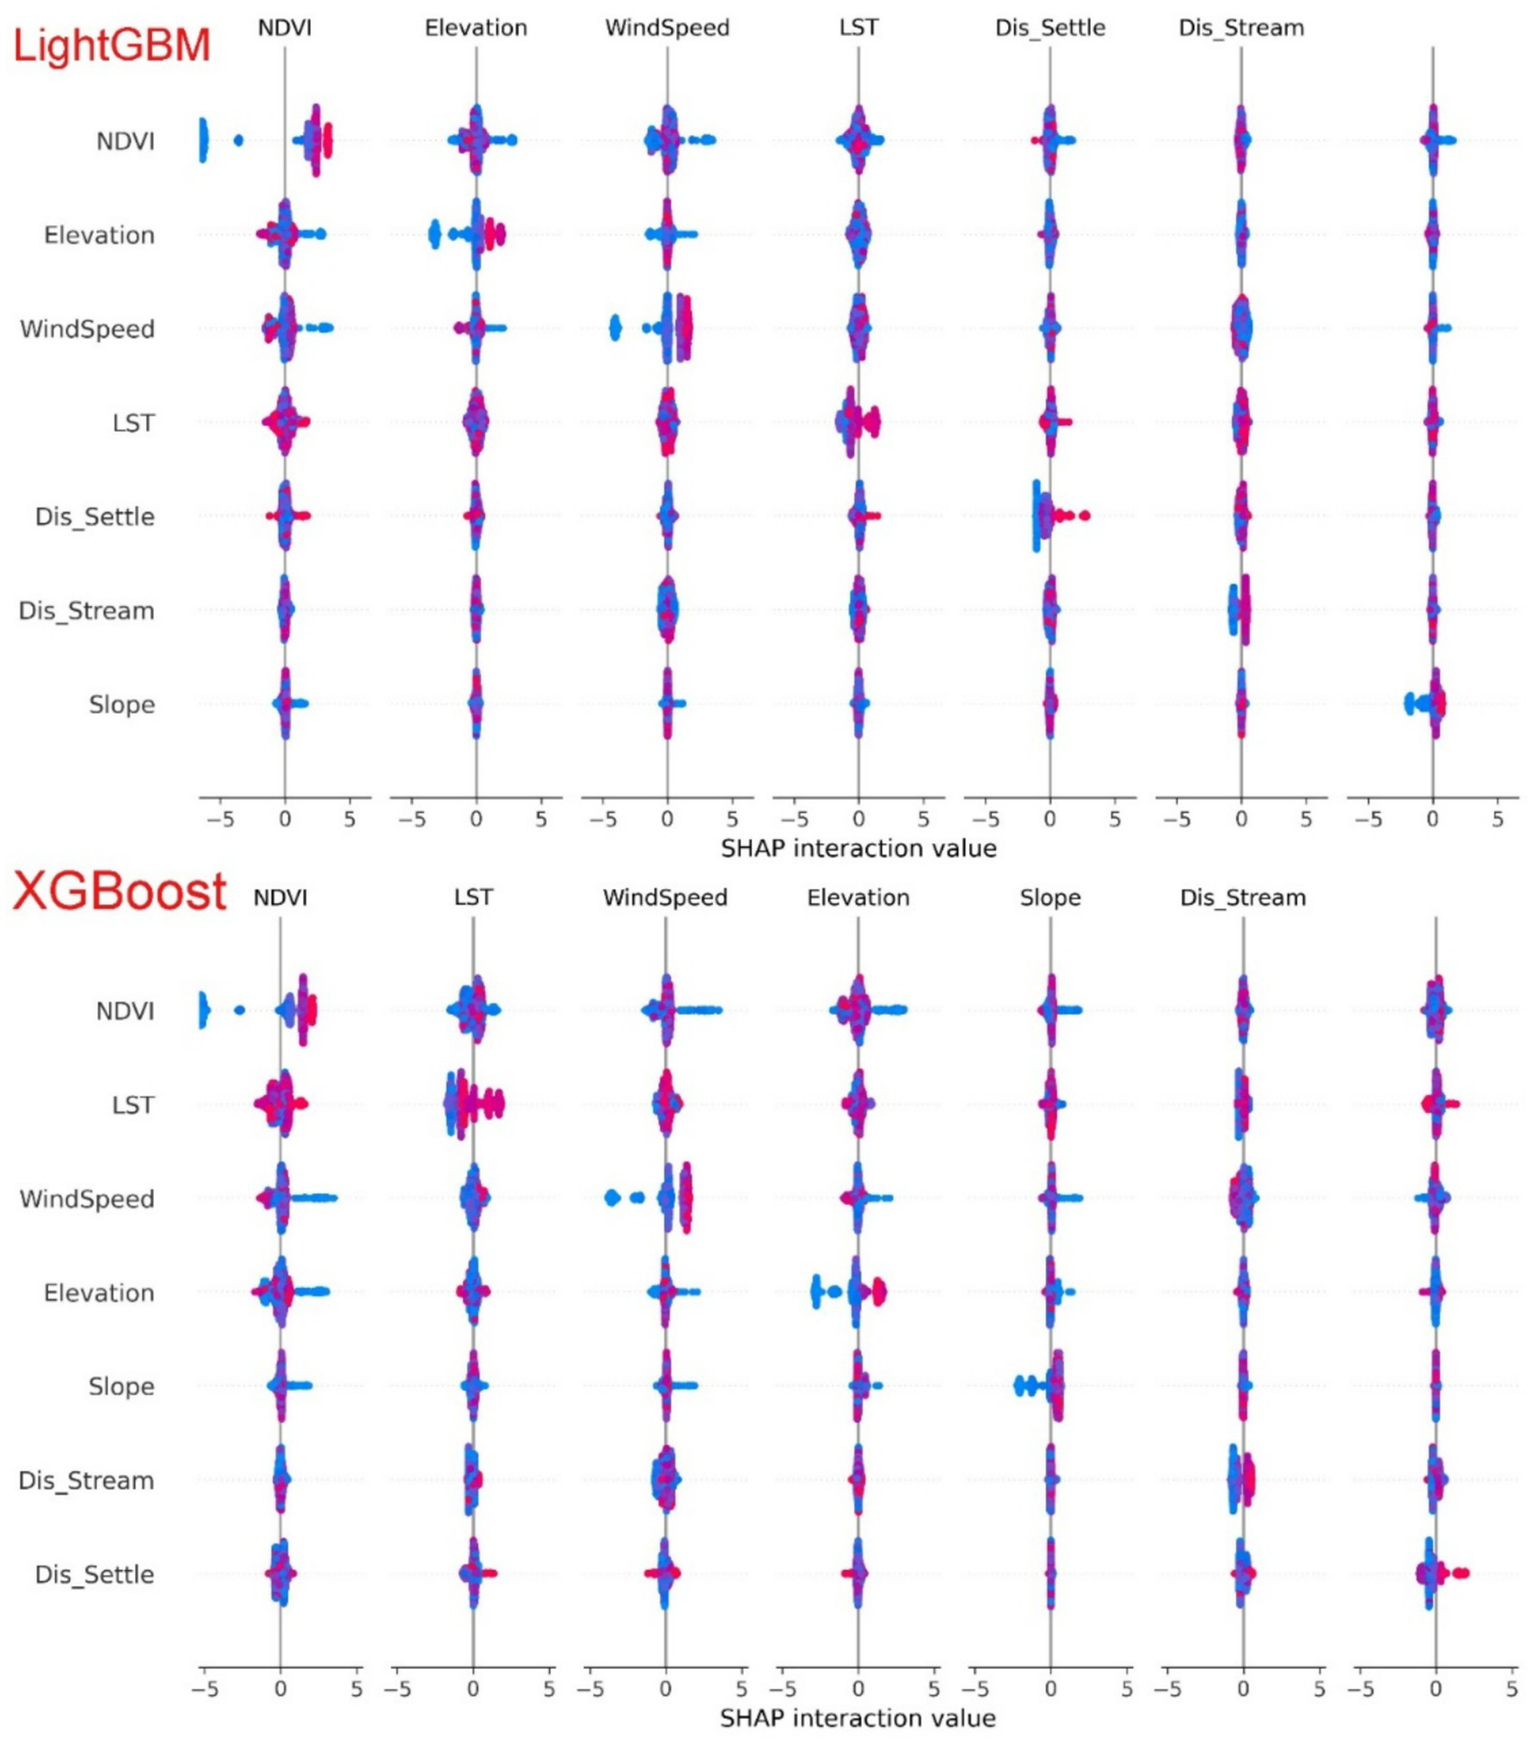
SHAP-based interaction analysis for LightGBM and XGBoost models.
The XGBoost SHAP beeswarm plot demonstrates a different feature importance hierarchy with unique interaction patterns. While NDVI remains the most influential predictor, its effect range is narrower (−6 to +2) compared to LightGBM, yet still shows high vegetation density strongly increasing risk and sparse vegetation providing protection. LST emerges as the second-most important variable in XGBoost, with a clear positive relationship where higher temperatures substantially increase fire risk through enhanced fuel desiccation, while cooler conditions reduce susceptibility. WindSpeed maintains a strong positive effect, with high wind values pushing predictions toward increased risk and calm conditions showing protective effects. Elevation displays a more moderate but consistent positive influence compared to LightGBM, with higher elevations associated with increased fire probability. Slope shows a noticeable positive effect in XGBoost, with steeper terrain increasing risk, possibly due to faster upslope fire spread. Distance to streams and settlements exhibit similar protective patterns as in LightGBM, with closer water proximity reducing risk and remote human settlements showing complex relationships. TWI, Aspect, and Distance to roads continue to show minimal influences, though XGBoost captures slightly stronger terrain moisture effects (TWI) than LightGBM, with drier conditions associated with marginally higher risk.
3.5.3 Feature interaction effects
The SHAP interaction plots reveal how environmental factors combine to shape wildfire susceptibility, with notable differences between LightGBM and XGBoost in capturing these complex relationships. Feature interactions are particularly important in fire modeling because fuel, weather, and topographic variables rarely act independently; their synergies often determine fire behavior and spread potential.
3.5.3.1 LightGBM interaction patterns
LightGBM captures distinct synergistic relationships between wildfire drivers, with elevation emerging as a key moderator of other factors (Table 8). The model shows strong positive interactions between NDVI and elevation, indicating that vegetation density has amplified effects in higher terrain, where fuel types and microclimates create heightened fire susceptibility. Wind speed interacts positively with multiple variables, particularly enhancing the effects of temperature and elevation to create extreme fire weather conditions. Interestingly, distance to settlements shows negative interactions with elevation, suggesting human presence modifies the fire risk typically associated with higher terrain. Water-related features (distance to streams) demonstrate buffering effects, particularly reducing wind impacts through moisture-mediated microclimate regulation.
Table 8
| Interaction pair | Effect direction | Ecological interpretation |
|---|---|---|
| NDVI × Elevation | Strong positive | Vegetation density has amplified effects in elevated terrain with specific fuel types |
| WindSpeed × LST | Strong positive | Wind and temperature combine to create extreme fire weather conditions |
| Elevation × WindSpeed | Positive | Mountainous areas experience amplified wind effects on fire behavior |
Key LightGBM interaction patterns.
3.5.3.2 XGBoost interaction patterns
XGBoost emphasizes thermal-driven interactions, with land surface temperature acting as a universal amplifier across multiple feature combinations (Table 9). The model shows the strongest positive interaction between LST and wind speed, creating maximum fire risk scenarios under hot, windy conditions. Unlike LightGBM, XGBoost reveals strong positive synergy between NDVI and LST, indicating that temperature enhances rather than diminishes vegetation-related fire risk, possibly through accelerated fuel curing. Elevation maintains consistent positive interactions but with reduced magnitude compared to LightGBM, while slope shows enhanced importance through its interactions with wind and elevation, suggesting topographic complexity modifies fire spread patterns.
Table 9
| Interaction pair | Effect direction | Ecological interpretation |
|---|---|---|
| LST × WindSpeed | Very strong positive | Hot, windy conditions create maximum fire risk scenarios |
| NDVI × LST | Strong positive | Temperature enhances vegetation-related risk through fuel curing acceleration |
| WindSpeed × Elevation | Strong positive | Mountain winds disproportionately influence fire spread and intensity |
| NDVI × WindSpeed | Positive | Wind conditions amplify the fire risk associated with dense vegetation |
| Elevation × Slope | Positive | Complex terrain creates compounded effects on fire behavior and spread |
Key XGBoost interaction patterns.
The contrasting interaction patterns between models highlight different aspects of wildfire ecology: LightGBM emphasizes elevation-mediated relationships, while XGBoost focuses on thermal amplification and vegetation-weather synergies, providing complementary perspectives on fire susceptibility drivers.
4 Discussion
This study demonstrates that the combined use of machine learning and SHAP explainability delivers both robust predictive accuracy and ecological interpretability for wildfire susceptibility mapping in Mediterranean landscapes. Our multi-model approach revealed that ensemble methods, particularly LightGBM and XGBoost, achieved superior performance compared to traditional algorithms, with LightGBM attaining the highest predictive accuracy (Accuracy = 0.93, AUC = 0.98) followed closely by XGBoost (Accuracy = 0.91, AUC = 0.97). These findings align with broader regional observations, such as in Türkiye’s Antalya region, where ensemble methods similarly excel in susceptibility mapping using comprehensive sets of environmental, climatic, and anthropogenic factors (Bilucan et al., 2024).
The exceptional performance of our models must be understood within the broader context of unprecedented regional warming. Our study period coincided with the exceptional summer of 2022 documented across the Mediterranean basin, where Serrano-Notivoli et al. (2023) revealed that Spain experienced its warmest summer in 700 years, with record-breaking temperatures affecting nearly half the country. Similar synoptic patterns influenced Northern Morocco during our study period, explaining the prominence of thermal factors in our models.
The use of SHAP transforms “black box” models into transparent tools by revealing consistent and interpretable drivers across algorithms, addressing a major limitation in prior wildfire modeling studies. This aligns with Cilli et al. (2022), who developed an XAI framework across the Italian peninsula, identifying pivotal variables like NDVI and emphasizing the utility of SHAP in decision-making contexts. Similarly, Iban and Aksu (2024) applied SHAP-based interpretation to machine learning models in Turkey’s İzmir region, finding that SHAP effectively revealed critical drivers including NDVI, wind speed, temperature, slope, and settlement proximity.
Our SHAP analysis consistently identified NDVI as the dominant predictor across both models, with mean SHAP values of 3.0 and 2.0 for LightGBM and XGBoost, respectively, highlighting vegetation density as the primary indicator of combustible fuel load. The significance of wind speed in our models must be understood within the context of regional atmospheric patterns, particularly the Chergui wind—a hot, dry easterly wind that characterizes Moroccan summers and interacts synergistically with elevated temperatures to create dangerous fire weather conditions (Seddouki et al., 2023). Land Surface Temperature (LST) emerged as another critical factor, reflecting the regional thermal amplification that accelerates fuel desiccation and extends high flammability periods. Ensemble modeling studies in Türkiye further confirm that these factors collectively shape fire susceptibility (Purnama et al., 2024).
SHAP interaction analysis further exposed synergistic combinations, such as elevation interacting with wind speed or LST, combining with vegetation density to elevate risk zones. These nuanced insights provide actionable intelligence, suggesting that susceptibility mapping should prioritize specific factor interactions, not just risk hotspots. The strong positive interaction between elevated temperatures and wind speed during Chergui events demonstrates how compound climate extremes create disproportionately high fire risk. Such an approach is crucial for targeting early-warning systems, deployment of firefighting resources, and community-level risk mitigation during periods of concurrent high temperatures and strong winds.
While the results demonstrate strong predictive capacity, several limitations should be acknowledged. First, the availability of ground-based climate data—including wind speed, temperature, and humidity, remain limited in Morocco. Most local meteorological stations are not easily accessible to researchers, forcing reliance on reanalysis products (e.g., ERA5) or remote sensing proxies. Although these sources provide useful spatial coverage, they may not capture the fine-scale climatic variability that directly shapes fire ignition and spread. Second, accessing official fire records remains a challenge: obtaining the precise geographic coordinates of fire events involves lengthy and complex procedures, which limit the timeliness of fire datasets. This dependency on external institutional processes highlights the need for more open-access fire databases in Morocco.
Additional limitations persist in our methodological framework. Our modeling is based on a single year (2022) of wildfire data, a constraint that may limit temporal applicability despite capturing an exceptionally hot period that may preview future climate conditions. The study could be made more effective if real-time or high-resolution in situ climate data were integrated with remote sensing indicators. The combination of localized meteorological observations and satellite-based indices would improve both the accuracy of machine learning models and the interpretability of SHAP analysis, thereby yielding more reliable susceptibility maps.
Future work should incorporate multi-year datasets to account for interannual variability in fire-weather interactions and distinguish between transient extremes and persistent trends. Additionally, incorporating climate projections and socio-economic risk scenarios would improve forward-looking risk forecasting.
Overall, this study contributes to a growing body of evidence that interpretable machine learning, especially when paired with explainability frameworks like SHAP, offers a powerful and actionable path for Mediterranean wildfire research. By demonstrating the superior performance of ensemble methods while providing transparent insights into their decision-making processes, we bridge the gap between predictive analytics and field-level fire management. The integration of explainable AI with robust environmental modeling provides a framework that can adapt to evolving climate conditions while maintaining ecological interpretability—a crucial combination for effective wildfire management in Morocco’s most vulnerable ecosystems under changing climatic conditions.
5 Conclusion
This study demonstrates that integrating machine learning with SHAP-based explainability offers a robust framework for wildfire susceptibility mapping in Mediterranean regions under changing climatic conditions. By combining environmental, climatic, topographic, and anthropogenic factors with recent fire records, the models achieved high predictive accuracy and ecological interpretability. Among all algorithms, XGBoost performed best, achieving an accuracy of 0.920 and F1-scores of 0.926 (fire) and 0.912 (non-fire), followed by LightGBM (508–511 in conclusion, AUC = 0.965), confirming the superior capability of gradient boosting approaches over conventional classifiers such as CART, k-NN, and SVM in complex wildfire risk modeling.
SHAP analysis identified NDVI as the most influential predictor (mean SHAP = 3.0 for LightGBM and 2.0 for XGBoost), underscoring vegetation density as a key determinant of fuel availability. Secondary drivers varied between models—LightGBM prioritized elevation and wind speed, whereas XGBoost emphasized land surface temperature and wind speed—reflecting model-specific sensitivities to environmental controls. Interaction effects revealed critical synergies, particularly between elevated temperatures and strong winds during Chergui events, and between vegetation density and topographic position, emphasizing how compound extremes amplify fire risk. The results confirm that wildfires in Mediterranean ecosystems arise from non-linear interactions among fuel, topography, and meteorological factors, intensified by ongoing regional warming, as observed during the extreme summer of 2022. The high-resolution susceptibility maps produced for the TTA region provide operational insights for agencies such as ANEF, supporting targeted prevention, optimized resource allocation, and climate-informed early warning during concurrent heat and wind extremes.
Despite these advances, limitations persist, including restricted access to ground-based meteorological data, dependence on institutional fire records, and reliance on a single-year dataset. Expanding to multi-year records, improving access to in-situ climate observations, and incorporating climate projections would enhance model robustness and temporal transferability. Future work should integrate climate and socio-economic scenarios to support adaptive wildfire management under evolving Mediterranean climate conditions. Overall, this research establishes an explainable AI–based environmental modeling framework that links predictive analytics with practical fire management, offering a scalable and scientifically grounded approach for safeguarding Morocco’s forest ecosystems amid accelerating climate change.
Statements
Data availability statement
The raw data supporting the conclusions of this article will be made available by the authors, without undue reservation.
Author contributions
AM: Conceptualization, Formal analysis, Investigation, Methodology, Supervision, Validation, Visualization, Writing – original draft, Writing – review & editing, Project administration, Software. AK: Conceptualization, Data curation, Formal analysis, Methodology, Validation, Visualization, Writing – original draft, Software, Supervision. AE: Formal analysis, Investigation, Methodology, Validation, Writing – original draft, Writing – review & editing, Resources. WA: Formal analysis, Funding acquisition, Resources, Writing – review & editing, Project administration. NR: Formal analysis, Resources, Visualization, Writing – review & editing. YY: Formal analysis, Visualization, Writing – review & editing, Funding acquisition, Methodology, Project administration, Supervision.
Funding
The author(s) declare that financial support was received for the research and/or publication of this article. This research was funded by the Princess Nourah bint Abdulrahman University Researchers Supporting Project number (PNURSP2025R680), Princess Nourah bint Abdulrahman University, Riyadh, Saudi Arabia.
Acknowledgments
The authors extend their appreciation to the Princess Nourah bint Abdulrahman University Researchers Supporting Project number (PNURSP2025R680), Princess Nourah bint Abdulrahman University, Riyadh, Saudi Arabia. The authors also gratefully acknowledge USGS–NASA for providing access to Landsat and DEM datasets via the Google Earth Engine platform.
Conflict of interest
The authors declare that the research was conducted in the absence of any commercial or financial relationships that could be construed as a potential conflict of interest.
Generative AI statement
The authors declare that no Gen AI was used in the creation of this manuscript.
Any alternative text (alt text) provided alongside figures in this article has been generated by Frontiers with the support of artificial intelligence and reasonable efforts have been made to ensure accuracy, including review by the authors wherever possible. If you identify any issues, please contact us.
Correction note
This article has been corrected with minor changes. These changes do not impact the scientific content of the article.
Publisher’s note
All claims expressed in this article are solely those of the authors and do not necessarily represent those of their affiliated organizations, or those of the publisher, the editors and the reviewers. Any product that may be evaluated in this article, or claim that may be made by its manufacturer, is not guaranteed or endorsed by the publisher.
Abbreviations
AUC, Area under the Curve (ROC curve); CART, Classification and Regression Trees; Dis_Road, Distance to roads; Dis_Settle, Distance to settlements; Dis_Stream, Distance to streams; Elevation, Elevation above sea level; k-NN, k-Nearest Neighbors; LightGBM, Light Gradient Boosting Machine; LST, Land Surface Temperature; NDVI, Normalized Difference Vegetation Index; SHAP, SHapley Additive exPlanations; Slope, Slope gradient/steepness; SVM, Support Vector Machine; TTA, Tangier–Tétouan–Al Hoceima region; TWI, Topographic Wetness Index; WindSpeed, Wind speed; XAI, Explainable Artificial Intelligence; XGBoost, Extreme Gradient Boosting.
References
1
Abdollahi A. Pradhan B. (2023). Explainable artificial intelligence (XAI) for interpreting the contributing factors feed into the wildfire susceptibility prediction model. Sci. Total Environ.879:163004. doi: 10.1016/j.scitotenv.2023.163004
2
Abujayyab S. K. M. Kassem M. M. Khan A. A. Wazirali R. Coşkun M. Taşoğlu E. et al . (2022). Wildfire susceptibility mapping using five boosting machine learning algorithms: the case study of the Mediterranean region of Turkey. Adv. Civil Eng.2022:3959150. doi: 10.1155/2022/3959150
3
Ahmad H. Wu Z. Huang H. Muhammad S. Hayat M. Abbas K. et al . (2025). A comparative evaluation of forest fire hazard vulnerability through geographic information system-based techniques. Front. For. Glob. Change8:1635041. doi: 10.3389/ffgc.2025.1635041
4
Badda H. Cherif E. K. Boulaassal H. Wahbi M. Yazidi Alaoui O. Maatouk M. et al . (2023). Improving the accuracy of random forest classifier for identifying burned areas in the Tangier-Tetouan-Al Hoceima region using Google earth engine. Remote Sens15:4226. doi: 10.3390/rs15174226
5
Bar S. Parida B. R. Pandey A. C. Shankar B. U. Kumar P. Panda S. K. et al . (2023). Modeling and prediction of fire occurrences along an elevational gradient in Western Himalayas. Appl. Geogr.151:102867. doi: 10.1016/j.apgeog.2022.102867
6
Bilucan F. Teke A. Kavzoglu T. (2024). “Susceptibility mapping of wildfires using XGBoost, random Forest and AdaBoost: a case study of Mediterranean ecosystem” in Recent research on geotechnical engineering, remote sensing, geophysics and earthquake seismology. eds. BezzeghoudM.ErgülerZ. A.Rodrigo-CominoJ.JatM. K.KalatehjariR.BishtD. S. (Cham, Switzerland: Springer Nature), 99–101.
7
Boubekraoui H. Maouni Y. Ghallab A. Draoui M. Maouni A. (2023). Wildfires risk assessment using hotspot analysis and results application to wildfires strategic response in the region of Tangier-Tetouan-Al Hoceima, Morocco. Fire6:314. doi: 10.3390/fire6080314
8
Chen X. Zhang Y. Wang S. Zhao Z. Liu C. Wen J. (2024). Comparative study of machine learning methods for mapping forest fire areas using sentinel-1B and 2A imagery. Front. Remote Sens.5:641. doi: 10.3389/frsen.2024.1446641
9
Cilli R. Elia M. D’Este M. Giannico V. Amoroso N. Lombardi A. et al . (2022). Explainable artificial intelligence (XAI) detects wildfire occurrence in the Mediterranean countries of southern Europe. Sci. Rep.12:16349. doi: 10.1038/s41598-022-20347-9
10
Couto F. T. Santos F. L. M. Campos C. Andrade N. Purificação C. Salgado R. (2022). Is Portugal starting to burn all year long? The transboundary fire in January 2022. Atmos.13:1677. doi: 10.3390/atmos13101677
11
Davis F. W. Parkinson A.-M. Moritz M. A. Park I. W. D’Antonio C. M. (2025). Increasing vulnerability of an endemic Mediterranean-climate conifer to changing climate and fire regime. Front. For. Glob. Change8:1516623. doi: 10.3389/ffgc.2025.1516623
12
Ejaz N. Choudhury S. (2025). A comprehensive survey of the machine learning pipeline for wildfire risk prediction and assessment. Ecol. Inform.90:103325. doi: 10.1016/j.ecoinf.2025.103325
13
Estes B. L. Knapp E. E. Skinner C. N. Miller J. D. Preisler H. K. (2017). Factors influencing fire severity under moderate burning conditions in the Klamath Mountains, northern California, USA. Ecosphere8:e01794. doi: 10.1002/ecs2.1794
14
Gentilucci M. Barbieri M. Younes H. Rihab H. Pambianchi G. (2024). Analysis of wildfire susceptibility by weight of evidence, using geomorphological and environmental factors in the Marche region, Central Italy. Geosciences14:112. doi: 10.3390/geosciences14050112
15
Gentilucci M. Younes H. Hadji R. Casagli N. Pambianchi G. (2025). Influence of land surface temperatures, precipitation, total water storage anomaly and fraction of absorbed photosynthetically active radiation anomaly, obtained from MODIS, IMERG and GRACE satellite products on wildfires in eastern Central Italy. Int. J. Remote Sens.46, 5465–5499. doi: 10.1080/01431161.2025.2522941
16
HCP . (2014). Recensement général de la population et de l’habitat. Haut-Commissariat au Plan du Maroc. Available online at: http://rgphentableaux.hcp.ma/Default1/ (Accessed April 16, 2020).
17
Iban M. C. Aksu O. (2024). SHAP-driven explainable artificial intelligence framework for wildfire susceptibility mapping using MODIS active fire pixels: an in-depth interpretation of contributing factors in Izmir, Türkiye. Remote Sens16:2842. doi: 10.3390/rs16152842
18
Islam T. Hulley G. C. Malakar N. K. Radocinski R. G. Guillevic P. C. Hook S. J. (2017). A physics-based algorithm for the simultaneous retrieval of land surface temperature and emissivity from VIIRS thermal infrared data. IEEE Trans. Geosci. Remote Sens.55, 563–576. doi: 10.1109/TGRS.2016.2611566
19
L’Economiste . (2023). Incendies de forêts au Maroc: plus de 22.700 ha touchés en 2022. L’Economiste. Available online at: https://www.leconomiste.com/flash-infos/incendies-de-forets-au-maroc-plus-de-22-700-ha-touches-en-2022/ (Accessed October 19, 2025).
20
Lee C. Choi E. H. Han Y. Lee Y. (2025). Year-round daily wildfire prediction and key factor analysis using machine learning: a case study of Gangwon state, South Korea. Sci. Rep.15:29910. doi: 10.1038/s41598-025-15508-5
21
Liao B. Zhou T. Liu Y. Li M. Zhang T. (2025). Tackling the wildfire prediction challenge: an explainable artificial intelligence (XAI) model combining extreme gradient boosting (XGBoost) with SHapley additive exPlanations (SHAP) for enhanced interpretability and accuracy. Forests16:689. doi: 10.3390/f16040689
22
Michael Y. Helman D. Glickman O. Gabay D. Brenner S. Lensky I. M. (2021). Forecasting fire risk with machine learning and dynamic information derived from satellite vegetation index time-series. Sci. Total Environ.764:142844. doi: 10.1016/j.scitotenv.2020.142844
23
Molina J. R. Lora A. Prades C. Rodríguez Y Silva F. (2019). Roadside vegetation planning and conservation: new approach to prevent and mitigate wildfires based on fire ignition potential. For. Ecol. Manag.444, 163–173. doi: 10.1016/j.foreco.2019.04.034
24
Moumane A. Elmotawakkil A. Hasan M. M. Kranjčić N. Batchi M. Karkouri J. A. et al . (2025). Integrating GIS, remote sensing, and machine learning to optimize sustainable groundwater recharge in arid Mediterranean landscapes: a case study from the middle Draa Valley, Morocco. Water17:2336. doi: 10.3390/w17152336
25
Niranjan A. (2025). EU wildfires worst on record as burning season continues. The Guardian. Available online at: https://www.theguardian.com/world/2025/aug/22/eu-wildfires-worst-year-on-record-as-season-continues (Accessed August 23, 2025).
26
Nur A. S. Kim Y. J. Lee C.-W. (2022). Creation of wildfire susceptibility maps in Plumas National Forest using InSAR coherence, deep learning, and metaheuristic optimization approaches. Remote Sens14:4416. doi: 10.3390/rs14174416
27
Pacheco A. d. P. Junior J. A. d. S. Ruiz-Armenteros A. M. Henriques R. F. F. (2021). Assessment of k-nearest neighbor and random forest classifiers for mapping forest fire areas in Central Portugal using Landsat-8, Sentinel-2, and Terra imagery. Remote Sens13:1345. doi: 10.3390/rs13071345
28
Parajuli A. Gautam A. P. Sharma S. P. Bhujel K. B. Sharma G. Thapa P. B. et al . (2020). Forest fire risk mapping using GIS and remote sensing in two major landscapes of Nepal. Geomatics Nat. Hazards Risk11, 2569–2586. doi: 10.1080/19475705.2020.1853251
29
Purnama M. I. Jaya I. N. S. Syaufina L. Çoban H. O. Raihan M. (2024). Predicting forest fire vulnerability using machine learning approaches in the Mediterranean region: a case study of Türkiye. IOP Conf. Ser.: Earth Environ. Sci.1315:012056. doi: 10.1088/1755-1315/1315/1/012056
30
RGPH . (2024). Recensement général de la population et de l’habitat 2014. Available online at: https://www.recensement.ma/ (Accessed December 4, 2023).
31
Rodrigues M. Cunill Camprubí À. Balaguer-Romano R. Coco Megía C. J. Castañares F. Ruffault J. et al . (2023). Drivers and implications of the extreme 2022 wildfire season in Southwest Europe. Sci. Total Environ.859:160320. doi: 10.1016/j.scitotenv.2022.160320
32
Rogeau M.-P. Armstrong G. W. (2017). Quantifying the effect of elevation and aspect on fire return intervals in the Canadian Rocky Mountains. For. Ecol. Manag.384, 248–261. doi: 10.1016/j.foreco.2016.10.035
33
Salis M. Del Giudice L. Alcasena-Urdiroz F. Jahdi R. Arca B. Pellizzaro G. et al . (2023). Assessing cross-boundary wildfire hazard, transmission, and exposure to communities in the Italy-France maritime cooperation area. Front. For. Glob. Change6:1241378. doi: 10.3389/ffgc.2023.1241378
34
Seddouki M. Benayad M. Aamir Z. Tahiri M. Maanan M. Rhinane H. (2023). Using machine learning coupled with remote sensing for forest fire susceptibility mapping. Case study Tetouan province, Northern Morocco. Int. Arch. Photogramm. Remote Sens. Spatial Inf. Sci.4, 333–342. doi: 10.5194/isprs-archives-XLVIII-4-W6-2022-333-2023
35
Serrano-Notivoli R. Tejedor E. Sarricolea P. Meseguer-Ruiz O. De Luis M. Saz M. Á. et al . (2023). Unprecedented warmth: a look at Spain’s exceptional summer of 2022. Atmos. Res.293:106931. doi: 10.1016/j.atmosres.2023.106931
36
Sheriff R. Meer M. S. Aslam R. W. Said Y. (2025). Machine learning-based forest fire susceptibility mapping using random forest and CART models. Rangeland Ecol. Manag.102, 96–109. doi: 10.1016/j.rama.2025.06.004
37
Singha C. Swain K. C. Moghimi A. Foroughnia F. Swain S. K. (2024). Integrating geospatial, remote sensing, and machine learning for climate-induced forest fire susceptibility mapping in Similipal Tiger Reserve, India. For. Ecol. Manag.555:121729. doi: 10.1016/j.foreco.2024.121729
38
Sultan Y. E. D. Pillai K. R. A. Sharma A. (2025). Wildfire indicators modeling for reserved forest of Vellore district (Tamil Nadu, India). Front. Remote Sens.6:1518539. doi: 10.3389/frsen.2025.1518539
39
Symeonidis P. Vafeiadis T. Ioannidis D. Tzovaras D. (2025). Wildfire susceptibility mapping in Greece using ensemble machine learning. Earth6:75. doi: 10.3390/earth6030075
40
Toutate I. (2025). Firefighters Control Three of Four Main Blazes in Morocco’s Chefchaouen Forest. Morocco World News. Available online at: https://www.moroccoworldnews.com/2025/08/237552/firefighters-control-three-of-four-main-blazes-in-moroccos-chefchaouen-forest/ (Accessed October 19, 2025).
41
Vallet L. Schwartz M. Ciais P. Van Wees D. De Truchis A. Mouillot F. (2023). High-resolution data reveal a surge of biomass loss from temperate and Atlantic pine forests, contextualizing the 2022 fire season distinctiveness in France. Biogeosciences20, 3803–3825. doi: 10.5194/bg-20-3803-2023
42
Yue W. Ren C. Liang Y. Liang J. Lin X. Yin A. et al . (2023). Assessment of wildfire susceptibility and wildfire threats to ecological environment and urban development based on GIS and multi-source data: a case study of Guilin, China. Remote Sens15:2659. doi: 10.3390/rs15102659
43
Zhao E. Wang N. Cui S. Zhao R. Yu Y. (2025). A new weighted rough set and improved BP neural network method for predicting forest fires. Reliab. Eng. Syst. Saf.263:111206. doi: 10.1016/j.ress.2025.111206
Summary
Keywords
machine learning, SHAP, wildfire, climatic extremes, Mediterranean region
Citation
Moumane A, Al Karkouri A, Elmotawakkil A, Alkhuraiji WS, Rebouh NY and Youssef YM (2025) Advancing wildfire susceptibility mapping through maching learning and SHapley Additive exPlanations-integrated geospatial analysis in Northern Morocco’s Mediterranean region. Front. For. Glob. Change 8:1705341. doi: 10.3389/ffgc.2025.1705341
Received
14 September 2025
Revised
30 October 2025
Accepted
17 November 2025
Published
01 December 2025
Volume
8 - 2025
Edited by
Himanshu Bargali, Gurukul Kangri University, India
Reviewed by
Liao Bin, Guizhou University of Finance and Economics, China
Oktay Aksu, Istanbul Okan Universitesi, Türkiye
Updates
Copyright
© 2025 Moumane, Al Karkouri, Elmotawakkil, Alkhuraiji, Rebouh and Youssef.
This is an open-access article distributed under the terms of the Creative Commons Attribution License (CC BY). The use, distribution or reproduction in other forums is permitted, provided the original author(s) and the copyright owner(s) are credited and that the original publication in this journal is cited, in accordance with accepted academic practice. No use, distribution or reproduction is permitted which does not comply with these terms.
*Correspondence: Adil Moumane, adil.moumane@uit.ac.ma; Youssef M. Youssef, youssef.ibrahim@pme.suezuni.edu.eg
ORCID: Adil Moumane, orcid.org/0000-0003-0296-2679; Adnane Al Karkouri, orcid.org/0009-0000-5957-658X
Disclaimer
All claims expressed in this article are solely those of the authors and do not necessarily represent those of their affiliated organizations, or those of the publisher, the editors and the reviewers. Any product that may be evaluated in this article or claim that may be made by its manufacturer is not guaranteed or endorsed by the publisher.