Abstract
Net Ecosystem Productivity (NEP) serves as a critical metric for evaluating the carbon sequestration capability of forest ecosystems. As a vast territory forming a vital ecological shield in northern China, Xinjiang possesses notably complex and varied forest environments, making an assessment of its ecosystem carbon cycle's spatial patterns and climatic responses highly significant. This study employed the Integrated Terrestrial Ecosystem Carbon-budget (InTEC) model, driven by multi-source remote sensing and reanalysis datasets for meteorology, vegetation, soil, and topography, to simulate the spatiotemporal dynamics of Xinjiang's forest NEP from 1901 to 2060. Using trend and partial correlation analyses, this study examined the spatiotemporal evolution of forest NEP and its response to changing climatic factors under three representative concentration pathways from the Coupled Model Intercomparison Project Phase 6 (CMIP6): SSP126, SSP245, and SSP585. The results indicate that: (1) For the 1901-2022 period, the average forest NEP in Xinjiang was 47.81 g C·m−2·yr−1, demonstrating a fluctuating upward trend at an average rate of 0.52 g C·m−2·yr−1. The overall spatial pattern showed higher values in the east and north compared to the west and south. (2) The carbon fixation potential of Xinjiang's forests under the SSP126 scenario is projected to be considerably higher than under other scenarios. The mean annual NEP values for 2023-2060 are estimated to be 122.88, 114.28, and 108.54 g C·m−2·yr−1 for the three respective scenarios. While NEP is expected to increase with fluctuations until around 2035 in all pathways, a decline may occur after 2045 under high-emission scenarios, potentially due to elevated temperatures, drought, frequent extreme events, and substantial increases in nitrogen deposition. This decrease is anticipated to be concentrated in the piedmont plains of the Tianshan Mountains and the areas surrounding the Tarim Basin. (3) The positive control of precipitation on Xinjiang's forest NEP is stronger than that of temperature. The partial correlation between temperature and NEP shows significant geographical differentiation, being positive in cool, humid montane forests and negative in hot, arid regions. Solar radiation and vapor pressure exhibit a distinct positive relationship with forest NEP, affecting 76.23% and 63.83% of the study area, respectively. These findings reveal the centennial-scale spatiotemporal dynamics of forest NEP in Xinjiang and its future carbon uptake potential, providing a valuable reference for assessing the region's carbon sequestration capacity.
1 Introduction
Forests play a pivotal part in regulating the global carbon budget and in strategies to counteract climate change (Houghton, 2005; Yin et al., 2015), with alterations in their carbon stock being a primary determinant of whether the terrestrial biosphere functions as a carbon source or sink. A dependable assessment of the contribution and potential of forest carbon sinks provides a crucial basis for developing climate governance policies and sustainable forest management plans. A key metric in this assessment is Net Ecosystem Productivity (NEP), calculated as the balance between Net Primary Productivity (NPP) and heterotrophic respiration (Rh). This metric serves as a robust indicator of an ecosystem's capacity for carbon uptake and release, thus classifying it as a carbon sink or source (Keenan et al., 2016; Li et al., 2020). When NEP is positive, it signifies that carbon accumulation by vegetation surpasses the respiratory carbon loss from soil microbes, characterizing the system as a carbon sink. In contrast, a negative NEP denotes that microbial respiration outpaces vegetation carbon storage, indicating a carbon source (Lu et al., 2023). Consequently, gaining an accurate knowledge of the spatial distribution, magnitude, and climatic drivers of forest NEP is fundamental for understanding carbon cycling mechanisms from local to global scales, for effective biodiversity conservation, and for designing policies aimed at carbon offsetting and mitigating global warming (Fang et al., 2018; Piao et al., 2022).
Scientific inquiry into forest ecosystem NEP has grown substantially in recent years (Piao et al., 2012), positioning its estimation as a central goal in carbon source-sink analysis. Investigations at broad spatial scales have significantly advanced our comprehension of shifts in global and regional carbon budgets (Li et al., 2021). While methods for assessing forest carbon budgets include field plots, micrometeorological techniques, remote sensing, and simulation modeling (Zheng et al., 2019), the inherent spatial limitations of in-situ surveys and observations prevent them from fully capturing internal ecosystem mechanisms or forecasting future productivity distributions. Consequently, for studies covering extensive spatial areas or long temporal durations, simulation modeling has become the predominant methodology for NPP and NEP research (Feng et al., 2014). These models are typically grouped into empirical, parametric, and process-based classes (Mao et al., 2022). It has been well-established that stand age is a critical parameter that exerts a profound influence on ecosystem productivity, making it indispensable for the simulation and prediction of forest carbon storage and sinks (Bradford et al., 2008; Li et al., 2016). The InTEC model, which is founded on the physiological and biochemical processes of the carbon cycle, explicitly incorporates the effects of forest disturbance and age dynamics, positioning it as a state-of-the-art tool for simulating the spatiotemporal variability of forest NEP (Zhao et al., 2019). The model is also capable of reconstructing historical carbon cycle characteristics and drivers, as well as projecting future spatiotemporal evolutions (Mao et al., 2022). It operates by iteratively calculating long-term carbon cycle trends based on reference-year NPP-Age relationships while integrating the impacts of climate change, rising CO2 concentrations, forest disturbances, and nitrogen deposition (Zheng et al., 2019). Concurrently, remote sensing technology provides an essential macroscopic approach for carbon cycle studies, valued for its capacity to deliver consistent, reliable, and repetitive measurements over large to global scales (Mngadi et al., 2022). The synergy achieved by integrating remote sensing with process-based models is particularly advantageous, as it facilitates large-scale simulations that capture both ecological and physiological vegetation processes. This combined approach effectively addresses the challenges posed by spatiotemporal heterogeneity and scale complexity in forest ecosystems, thereby substantially enhancing the reliability of terrestrial carbon cycle estimations at regional and global scales (Pan and Dong, 2018; Zhao et al., 2011).
The InTEC model has broad applicability in forest carbon cycle research, with its application spanning multiple spatial scales from global and national to provincial levels. At the global and national scales, the model has been successfully applied to assess forest carbon dynamics in Canada (Chen J. et al., 2000) and the United States (Zhang et al., 2012), and has also been used to simulate the century-long carbon balance (1901–2001) of Chinese forests (Wang et al., 2007) as well as soil organic carbon density (Shao et al., 2007). At the regional and provincial scales, it has been used to simulate the spatiotemporal patterns of forest NEP in Zhejiang Province from 1979 to 2079 (Mao et al., 2022), as well as to assess carbon stock changes in the Poyang Lake region (Zhao et al., 2013), with effective validation.
The forests of Xinjiang constitute a significant component of the northern forest belt that extends across Central Asia and the Eurasian continent, playing a crucial role in maintaining the ecological security of the entire arid region (Chen et al., 2023). As a typically arid and ecologically fragile area, Xinjiang's vast territory and complex topography result in pronounced variations in climate and soil conditions. These natural gradients, combined with anthropogenic activities such as cultivation and irrigation in oasis zones, have fostered diverse forest types. This unique context highlights the importance of quantitatively investigating the region's ecosystem NEP and its response to climatic factors (Zan, 2022).
A substantial body of international and domestic literature has explored the spatiotemporal patterns of NEP and its response to driving factors (Marc et al., 2018; Li et al., 2014; Zhang et al., 2020). However, there is a marked scarcity of reports on the carbon sink and its spatial distribution in Xinjiang. Research on the ecological impacts of climate change in this region has predominantly concentrated on NPP (Hao et al., 2025; Wang et al., 2023; Jiang et al., 2021), leaving a significant gap in studies on NEP, which more directly reflects the carbon sink function. Existing NEP-related work is often confined to localized areas (Lu et al., 2023; Li et al., 2024) and tends to lack process-based or mechanistic methodologies, thus failing to uncover the underlying carbon cycling principles. Critically, while projecting future forest carbon dynamics is paramount in the context of global climate change, no predictive research has yet addressed the future spatiotemporal evolution of forest NEP in Xinjiang. Based on the aforementioned background, this study focuses on Xinjiang forests as the research subject, using the process-based InTEC model in combination with multi-source remote sensing and reanalysis data to systematically simulate the spatiotemporal evolution of forest NEP from 1901 to 2060 and explore its response mechanisms to climate factors. The specific research objectives include: (1) to reveal the spatiotemporal variation characteristics of forest NEP in Xinjiang from 1901 to 2022 and predict the NEP evolution trends under three climate scenarios (SSP126, SSP245, SSP585) for the period 2023–2060; (2) to analyze the response mechanisms of NEP to key climate factors such as temperature, precipitation, radiation, and vapor pressure, and identify the dominant climate factors for the four forest types in Xinjiang; (3) to assess the applicability and simulation performance of the InTEC model in the arid region of Xinjiang. This study is the first to apply the InTEC model with a clear process mechanism in the Xinjiang region, conducting a 160 year simulation and prediction of forest carbon sources and sinks. Additionally, local calibration of key model parameters is performed using local forest inventory data, which enhances the model's simulation accuracy in arid regions.
2 Study area
Situated deep within the Eurasian continent, Xinjiang is located in northwestern China and is characterized by a typical temperate continental arid climate. This climate features significant temperature fluctuations, scarce precipitation, and high rates of evaporation. The region's vegetation is primarily composed of grassland, forest, and cropland. Forests cover an area of 8.96 × 10⁴ km2, which corresponds to a forest coverage rate of 5.02% (Shi et al., 2020). The total standing timber volume is 4.65 × 10⁸ m3, with a forest stock volume of 4.27 × 10⁸ m3. These forests serve as an invaluable ecological barrier for northwestern China. Given the region's environmental conditions and developmental needs, its forests are crucial for environmental optimization, the stabilization of ecological balance, and the support of sustainable socioeconomic progress (Zheng et al., 2016). As shown in Figure 1, forest resources in Xinjiang comprise four principal types. Evergreen Needleleaf Forest (ENF), dominated by Picea schrenkiana, is found on the northern and southern slopes of the Tianshan Mountains. Deciduous Needleleaf Forest (DNF) is primarily composed of Larix sibirica. The quintessential species of Deciduous Broadleaf Forest (DBF) is Populus euphratica, which grows rapidly in the Tarim River basin and is widespread despite having a relatively low average biomass. Lastly, Mixed Forest (MF) consists mainly of Picea obovata and Populus tremula, where the stands are typically sparse and composed of short trees (Chen et al., 2023).
Figure 1

Overview of the study area.
3 Materials and methods
3.1 Research methodology
3.1.1 The InTEC model
The InTEC model, developed by Chen W. et al. (2000), is a comprehensive land ecosystem carbon cycle model based on the Farquhar photosynthesis model for leaf photosynthesis, canopy radiation transfer model, CENTURY soil and nitrogen cycling model, Townsend et al.'s net nitrogen mineralization model, and the NPP-Age model. This model calculates the long-term trends of forest carbon cycling through iterative calculations, considering the NPP of the reference year, forest age, and the variation of NPP with age. It also integrates the effects of climate change, rising CO2 concentrations, forest disturbances, and nitrogen deposition on the carbon cycle. The model divides the forest ecosystem into four vegetation carbon pools (coarse root carbon pool, fine root carbon pool, leaf carbon pool, stem carbon pool) and nine soil carbon pools (surface structural litter carbon pool, surface metabolic litter carbon pool, soil structural litter carbon pool, soil metabolic litter carbon pool, woody litter carbon pool, surface microbial carbon pool, soil microbial carbon pool, soil slow carbon pool, and soil inert carbon pool), which are used to analyze the long-term carbon balance of forest ecosystems. To date, the model has been successfully utilized for simulating forest ecosystem carbon cycling in various national and regional contexts, including in Canada, the United States, and China (Chen J. et al., 2000; Shao et al., 2007; Zhang et al., 2012).
3.1.2 Trend analysis
To analyze temporal trends within the NEP time series, we employed the Theil-Sen Median method, a non-parametric statistical technique for estimating the magnitude of a trend. This approach is notably robust to the influence of errors and data outliers, making it highly suitable for time-series analysis (Zhu et al., 2007). The algorithm is defined in Equation 1
Where, SNEP represents the trend of NEP. A positive SNEP value indicates an increasing trend, while a negative value signifies a decreasing trend.
The Mann-Kendall (MK) test, a non-parametric statistical method, is not influenced by missing values or outliers and is frequently used to assess the significance of trends (Tian et al., 2022). Its calculation formulas are provided below (Equations 2–4).
In these formulas, NEPj and NEPi are the NEP values for the j-th and i-th year, respectively; sgn (x) is the sign function, which returns 1, 0, or−1 when the independent variable x is positive, zero, or negative; n is the length of the time series; and var is the variance function. At a given significance level α (0.05), the trend in NEP is considered significant if |Z| > Z1–α/2.
3.1.3 Partial correlation analysis
The relationships between NEP and key climatic variables—specifically precipitation, temperature, solar radiation, and vapor pressure—were investigated using partial correlation analysis. This statistical method makes it possible to assess the correlation between NEP and a single climatic factor while controlling for the potential influence of other variables (Luo et al., 2024). The calculation is performed using Equation 5
In this equation, rxy, z is the partial correlation coefficient between variables x and y, after fixing variable z. The terms rxy, rxz, and ryz are the simple correlation coefficients between the respective pairs of variables. A positive value for rxy, z indicates a positive correlation, while a negative value indicates a negative correlation. The absolute value of the coefficient, ranging from−1 to 1, denotes the strength of the relationship. The significance of the correlation was also evaluated at a significance level of α = 0.05.
3.2 Input data for the InTEC model
3.2.1 Meteorological data
The historical climate data required for monthly-scale temperature, precipitation, cloud cover and water vapor pressure from 1901 to 2022 are sourced from the CRU dataset. This is a global meteorological dataset with a resolution of 0.5°, generated by the Centre for Meteorological Research at the University of East Anglia in the UK. It is based on observational stations. Data for the Chinese region were generated and cropped using the Delta spatial downscaling scheme, with radiation data estimated from cloud cover data.
Data for the three representative concentration pathway scenarios for the period 2023–2060 were obtained from CMIP6, the most comprehensive database in terms of participating models, scientific experiment design, and simulation data provision since the International Coupled Model Intercomparison Project was implemented (Eyring et al., 2016). This study is based on BCC-CSM2-MR model data and selects three future climate change scenarios—SSP126, SSP245 and SSP585—for analysis. The data cover meteorological elements, carbon dioxide concentrations and nitrogen deposition for the three scenarios during the period 2023–2060. All data were downloaded from https://esgf-node.llnl.gov/projects/cmip6. SSP126 is an optimistic scenario involving global radiative forcing of around 2.6 W/m2 by 2,100, CO2 concentrations of 421 ppm, an increase in precipitation of between 0.9% and 12.9%, and a rise in surface temperature of 0.9 °C. SSP245 is a medium-emission scenario similar to current policies, with projected greenhouse gas concentrations of 450–500 ppm by mid-century and global radiative forcing of around 4.5 W/m2 by 2,100. This results in a surface temperature increase of 1.8 °C SSP585 is a high-emission scenario involving uncontrolled resource consumption and carbon emissions, resulting in a global radiative forcing of around 8.5 W/m2.
The future climate datasets, provided on a monthly scale, were processed to calculate vapor pressure (Vap) from relative humidity (RH) and temperature (Tmp). To match the historical data, the future data were interpolated to a 500 m resolution. First, bilinear interpolation was used to downscale the future meteorological data spatially. The correction coefficient (CC) was calculated by comparing the historical observed data from 2016 to 2022 with the corresponding future simulated data. This correction coefficient was then applied to correct the bias in the meteorological data from each model Equation 6. The corrected future data were then concatenated with the historical observed data from 1901 to 2022 to obtain a complete meteorological dataset from 1901 to 2060 (Mao et al., 2022).
Here, H2016 − 2022 is the provincial average of the historical data from 2016 to 2022, while F2016 − 2022, SSP126, F2016 − 2022, SSP245, and F2016 − 2022, SSP585 are the corresponding provincial averages from the future datasets under each scenario.
3.2.2 Forest inventory and type data
This study integrated data from Xinjiang's continuous national forest inventory (Type I, 5 year cycle) and its forest management planning and design surveys (Type II, 10 year cycle). The stand-level survey records contain essential forest information, including land class, stand age, area, dominant tree species, stock volume, origin, soil type, and soil depth. These data were processed to create a vector map after performing topological error correction and projection conversion, with missing fields such as age class and diameter at breast height being supplemented. An object-oriented classification method was then applied to remotely sensed imagery to classify Xinjiang's forest types and to categorize any unclassified stands (Bhaskaran et al., 2010). The final classification results were merged with the Type II survey data and converted into a raster format.
3.2.3 Soil, LAI, and other data
The soil data utilized in this study included soil depth, the percentage of silt and clay content, field capacity, and wilting point (Shangguan et al., 2013). Following the methodology of Liu et al. (2012), the Boreal Ecosystem Productivity Simulator (BEPS) model was used to generate an 8 day, 500 meter resolution Leaf Area Index (LAI) product for the year 2011. The maximum value compositing method was then applied to derive the annual maximum LAI (LAImax) for Xinjiang in 2011. Slope was calculated from a Digital Elevation Model (DEM), and a wetness index was subsequently estimated using both the DEM and the derived slope data.
3.2.4 CO2 concentration and nitrogen deposition data
Atmospheric CO2 concentration data for the period 1901-1998 were obtained from the results of the Carbon Cycle Model Linkage Project (CCMLP) (Sitch et al., 2003). For the years 1999-2022, we used direct measurement data from the Mauna Loa Observatory in Hawaii (20°N, 156°W). Nitrogen deposition data for 1960-2010 were sourced from a 0.1° national dataset generated by Gu Fengxue's research group at the Chinese Academy of Agricultural Sciences (Gu et al., 2016). For the period 1901-1959, nitrogen deposition was estimated using the algorithm developed by Chen et al. (2003), while data for 2011-2022 were extrapolated based on the trends observed from 1960-2010 (Zhang et al., 2013). Future CO2 concentrations and nitrogen deposition data for the three climate scenarios from 2023 to 2060 were downloaded from the CMIP6 database (https://esgf-node.llnl.gov/projects/cmip6).
3.2.5 Forest age, reference NPP, and NPP-age parameterization
The InTEC model requires physiological parameters such as the NPP-Age curve and reference year NPP to calibrate the dynamic processes of forest carbon cycling and obtain the initial state of the carbon and nitrogen pools (Zhang et al., 2012). In this study, we first organized the 2011 Xinjiang Forest Type II survey data and used remote sensing estimation methods to fill in missing forest age data, ultimately generating the 2011 Xinjiang forest age distribution map (Zan, 2022). Subsequently, the spatial distribution of forest NPP for 2011 was estimated using the Type II inventory data according to Equation 7. This 2011 NPP map served as the reference year NPP used to drive the InTEC model in this study.
where ΔBtree is the change in tree biomass, estimated from biomass and stand age; Ltree is the litterfall production, estimated from biomass; Mtree represents mortality and harvesting losses, extracted from forest inventory data; and Ftree is the fine root productivity, with values obtained from literature (Zan, 2022).
The InTEC model requires NPP-Age curves during its spin-up phase to calibrate the dynamic processes of the forest carbon cycle and to establish the initial state of the carbon and nitrogen pools (Zhang et al., 2012). In this research, we leveraged the 2011 forest age information and the corresponding estimated forest NPP values derived from the forest inventory data. These datasets were used to fit growth curves for the four major forest types in Xinjiang (Table 1), which provided essential parameters for driving the InTEC model (Zan, 2022). The relationship between NPP and stand age is described by Equation 8 (Chen et al., 2002).
Table 1
| Forest types | a | b | c | d | R2 | F-value | P-value | RMSE (g C m−2yr−1) | Fitted samples | Total sample |
|---|---|---|---|---|---|---|---|---|---|---|
| ENF | 3.864 | 0.394 | 35.498 | 3.952 | 0.589 | 219.219 | * | 1.045 | 155 | 59214 |
| DNF | 6.173 | 0.428 | 23.295 | 3.633 | 0.934 | 469.287 | * | 0.768 | 35 | 6722 |
| DBF | 5.672 | 2.414 | 17.463 | 1.531 | 0.900 | 288.941 | * | 0.610 | 34 | 7452 |
| MF | 7.682 | 0.219 | 22.472 | 3.198 | 0.804 | 114.843 | * | 0.866 | 30 | 2777 |
Fitted NPP-Age relationships for the four forest types in Xinjiang (Zan, 2022).
*Represents p < 0.01. In this context, a, b, c, d are model parameters. In this study, the nonlinear fitting tool in SPSS software was used to fit the parameters a, b, c, and d for the four forest types in Xinjiang. The optimal parameters for Xinjiang forests were then obtained and used for the InTEC model simulations.
4 Results
4.1 Spatiotemporal variation of Xinjiang forest NEP from 1901-2022
As illustrated in Figure 2, under the combined influence of non-disturbance factors (such as climate, CO2 concentration, and nitrogen deposition) and disturbance factors (namely, forest age structure), the mean NEP of Xinjiang's forests from 1901 to 2022 was 47.81 g C·m−2·yr−1. The overall trend showed a fluctuating increase, with an average annual growth rate of 0.52 g C·m−2·yr−1. When analyzed by forest type, the mean NEP values for ENF, DNF, DBF, and MF were 55.04, 72.82, 29.72, and 55.98 g C·m−2·yr−1, respectively. Their corresponding rates of change were 0.12,−0.14, 0.40, and 0.05 g C·m−2·yr−1. The highest NEP values were recorded in 1993 and 2021, at 137.0 and 142.0 g C·m−2·yr−1, respectively. Examining different time periods reveals distinct dynamics. From 1901 to 1920, the carbon sink capacity of most forest types was weak, with ENF (-15.45 g C·m−2·yr−1) and DBF (-10.27 g C·m−2·yr−1) functioning as carbon sources. After 1920, particularly between 1921 and 1940, ENF and DNF rapidly transitioned into carbon sinks, with DNF reaching a peak mean value of 87.42 g C·m−2·yr−1 for that period. The carbon sequestration capacity of ENF and DBF continued to rise steadily from 1940 to 1980. In the most recent period, from 1980 to 2022, ENF (104.4 g C·m−2·yr−1) and MF (101.2 g C·m−2·yr−1) emerged as the dominant high-carbon-sink types. This evolving trend is driven by a synergy of climatic and anthropogenic factors. Elevated atmospheric CO2 concentrations and a warming climate have extended the growing season, collectively promoting photosynthetic carbon fixation. Furthermore, modern forest protection policies, such as logging bans and afforestation projects, have reduced human disturbance, thereby enhancing the stability of the ecosystem's carbon sink function.
Figure 2

Annual mean NEP of Xinjiang forests from 1901 to 2022 (for all forests combined and for individual forest types), along with the mean values for each forest type over twenty-year intervals (with the 2001-2022 period covering 22 years).
The structural differentiation between mountains and basins creates disparities in hydrothermal conditions, which, combined with the influence of stand age, contributes to the overall spatial pattern of forest NEP in Xinjiang. Generally, NEP is higher in mountainous regions than in plains, greater in northern Xinjiang (north of the Tianshan Mountains) compared to southern Xinjiang (south of the Tianshan Mountains), and higher in the west than in the east. As shown in Figure 3, the 1901-2022 period, forest NEP exhibited a decreasing trend in northern Xinjiang, while it showed an increase in southern Xinjiang. Forests with an NEP increase rate exceeding 4.0 g C·m−2·yr−1 were primarily located in the Yili region, Qitai County, Hami, the Shaya section of the Tarim River, and along the Kaidu River. Conversely, areas where the rate of NEP change was less than−2.0 g C·m−2·yr−1 were mainly found in the Altay Prefecture, in the Tacheng Prefecture, and within the oasis zones of the Junggar Basin. Focusing on the 1960-2022 period, the average forest NEP for Xinjiang was 74.27 g C·m−2·yr−1, with all forest types showing a positive mean NEP. Certain areas, such as the western Tianshan Mountains (Yili region) and parts of the eastern Tianshan Mountains (Barkol, Yiwu, and Hami), exhibited mean NEP values exceeding 250 g C·m−2·yr−1. In stark contrast, most of the Tarim Basin recorded very low NEP values, ranging from just 0 to 50 g C·m−2·yr−1.
Figure 3

Spatial distribution map of average NEP and change rates of forests in Xinjiang from 1901 to 2022.
As depicted in Figure 4, an analysis of the entire forested area of Xinjiang from 1901 to 2022 reveals that 45.29% of the area experienced a significant increase in NEP, with an additional 23.46% showing a non-significant increase. Together, these areas of positive trend account for 68.75% of the total, while the proportion of area with a decreasing trend is relatively small. This indicates a general enhancement of the forest ecosystem's carbon sink capacity over the past century.
Figure 4
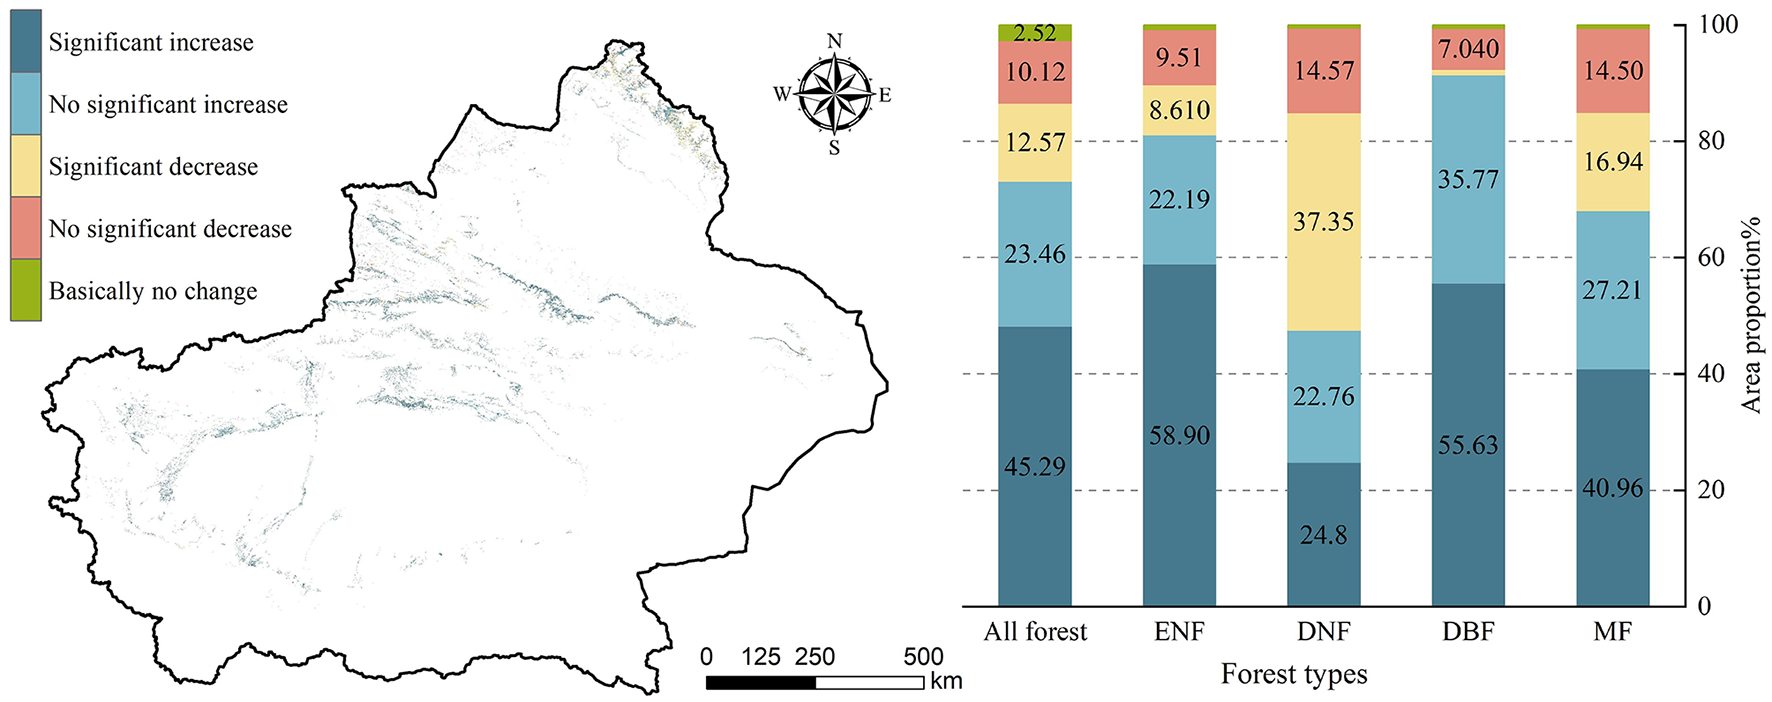
Trends in NEP and its proportion of forest area in Xinjiang.
The NEP trends, however, exhibit distinct differentiation among forest types. The strengthening of the carbon sink was most pronounced in ENF, where the area with a significant NEP increase was 58.90%, the highest among all types. Combined with the 22.19% showing a non-significant increase, over 80% of the ENF area demonstrated an improved carbon sink function. In contrast, DNF showed a notable decline in its carbon sink capacity, with 37.35% of its area experiencing a significant NEP decrease—the largest proportion of any type. Including the 14.57% with a non-significant decrease, over half of the DNF area saw a reduction, identifying it as the primary type contributing to NEP decline in Xinjiang's forests. DBF displayed the most stable enhancement of its carbon sink function. The combined area of significant (55.63%) and non-significant (35.77%) NEP increase surpassed 90%, with a negligible area showing a significant decrease. This suggests that the improvement in DBF's carbon sink function is both highly prevalent and stable, marking it as a key contributor to the region's overall carbon sink enhancement.
4.2 Relationship between Forest NEP and meteorological factors
This study employed partial correlation analysis to investigate the influence of four meteorological factors on forest NEP variations during the study period. The differential responses of the four main forest types—ENF, DNF, DBF, and MF—to these climatic variables were also examined.
As shown in Figure 5, temperature and NEP were positively correlated across 56.09% of Xinjiang's total forest area, with 12.27% of this area showing a significant positive correlation. Among the forest types, this positive relationship was most dominant in ENF, covering 75.78% of its distribution, particularly in the Tianshan and Altai mountain forest zones. This suggests that for ENF, rising temperatures have a marked promotional effect on NEP. Conversely, negative correlations were concentrated in the primary distribution areas of DNF, such as the coniferous belt surrounding the Junggar Basin, where the negative correlation reached 71.34%. This indicates that warming has a certain inhibitory effect on the carbon sink in these areas. Precipitation and NEP were also predominantly positively correlated, covering 78.78% of the total study area. A significant positive correlation was found in 14.62% of the area, mainly in Xinjiang's three major mountain ranges and the oasis regions of the Tarim Basin. This underscores that in the arid environment of Xinjiang, water availability is the primary limiting factor for the forest ecosystem's carbon sink function, and increased precipitation can directly enhance vegetation's carbon sequestration capacity. Vapor pressure primarily exhibited a positive relationship with forest NEP (63.83%). When analyzed by forest type, areas with a significant positive correlation were mainly located in more humid regions, such as the forest belt of the Tacheng-Yili River Valley. This indicates that DBF in humid areas responds more significantly to increases in vapor pressure. However, localized areas with significant negative correlations were found along the margins of the Tarim Basin, suggesting that excessively high vapor pressure in arid fringe zones may suppress the carbon sink. For both the entire Xinjiang forest region and for most individual forest types, solar radiation showed a highly positive correlation with NEP. A negative correlation between NEP and solar radiation was observed in only a few specific forest areas, primarily in some DBF distribution zones like the Irtysh River Valley. This may imply that for deciduous broadleaf forests in river valleys, elevated radiation levels could have a weak inhibitory effect on their carbon sink response.
Figure 5

Partial correlation between NEP and various factors in Xinjiang.
4.3 Model usability analysis
To validate the model, we selected sample plots for the four different forest types from the inventory data and extracted the average NEP values simulated by the InTEC model for the 1999-2019 period. These values were then compared with a global daily NEP simulation data product published by the team of Ju Weimin et al. (Chen et al., 2019; He et al., 2021). This validation dataset was generated using the mechanistic BEPS model at a daily time step, driven by vegetation parameters, remote sensing data, meteorological inputs, and atmospheric CO2 concentrations, covering the period from 1981 to 2019. To ensure temporal consistency, we calculated the mean values from this product for the 1999-2019 validation period. The scatter plot fitting results (Figure 6) show a high degree of correlation between the InTEC model simulations and the validation product for all forest types, with R2 from 0.69 to 0.77 and the RMSE values ranged from 29.42 to 52.44 g C·m−2·yr−1.
Figure 6

Error analysis of NEP estimation in Xinjiang.
Specifically, the evergreen coniferous forest (ENF) exhibited the highest R2 value of 0.77, with a root mean square error (RMSE) of 52.44 g C·m−2·yr−1, indicating the best match between model predictions and the validation data for this forest type. Conversely, MF showed the lowest R2 value. These discrepancies may be attributed to several factors. Our study utilized forest type data from the Type II inventory, whereas the validation product is based on MODIS land cover data, which can lead to inconsistencies in the delineated forest areas. Additionally, differences in the methodologies, model structures, and data sources used in the two approaches can also contribute to a certain degree of deviation in the results.
Furthermore, we compared our NEP estimates with those from other scholarly works (Table 2). The mean NEP for Xinjiang's forests in our study was calculated to be 91.56 g C·m−2·yr−1 for the period 2000-2022. Our estimate is generally lower than those from national-scale studies but shows smaller discrepancies when compared with studies focused on the same province or adjacent regions like Central Asia, Northwest China, and Qinghai (Table 1). For instance, Lu et al. (2023), using a modified Carnegie Ames Stanford Approach (CASA) model, estimated the vegetation NEP in Xinjiang to be 128.54 g C·m−2·yr−1 for 2000-2020. Li et al. (2024) simulated the total NEP in the Aksu River Basin for 2000-2020 using the PLUS model and reported a value of 119.41 g C·m−2·yr−1 for forest land. In another study, Zhang et al. (2021) combined the CASA model with an empirical model to estimate NEP in Central Asia from 2000-2019, yielding multi-year averages of 95.63 g C·m−2·yr−1 for broadleaf forests and 83.76 g C·m−2·yr−1 for coniferous forests. The mean value from our model simulation falls comfortably within the range of these high and low estimates. This comparative analysis suggests that the results from our application of the InTEC model reasonably reflect the forest carbon sink at a regional scale in Xinjiang, with simulation errors maintained within an acceptable range. This confirms the InTEC model's capability to accurately capture and represent the spatiotemporal characteristics of NEP in Xinjiang's forests.
Table 2
| Region | Type | Study period | Research method | NEP(g C/m2) | 文献 |
|---|---|---|---|---|---|
| Xinjiang | Vegetation | 2000-2020 | CASA model | 128.54 | Lu et al., 2023 |
| Aksu River Basin, Xinjiang | Forest | 2000-2020 | PLUS | 119.41 | Li et al., 2024 |
| Qinghai Province | Vegetation | 2000-2020 | Soil respiration model | 134.05 | Ye et al., 2022 |
| Northwest China | Vegetation | 2000-2022 | CASA model | 135.32 | Zhao et al., 2025 |
| China | Forest | 2003-2012 | FORCCHN | 252.51 | Lü et al., 2022 |
| China | Forest | 2003-2012 | Experimental observation | 283.56 | Lü et al., 2022 |
| Central Asia | Broadleaf forest | 2000-2019 | Combination of CASA model and empirical model | 95.63 | Zhang et al., 2021 |
| Central Asia | Coniferous forest | 2000-2019 | Combination of CASA model and empirical model | 83.76 | Zhang et al., 2021 |
Comparison with carbon sink estimation results from existing literature.
4.4 Spatiotemporal variation of Xinjiang forest NEP under future climate scenarios
Figure 7 illustrates the spatiotemporal trends of forest NEP in Xinjiang from 2023 to 2060, as simulated by the InTEC model. During this period, forest NEP is projected to exhibit distinct phases under the three SSP scenarios. Until 2035, a fluctuating upward trend is anticipated across all scenarios. This is followed by a period of fluctuating stability between 2035 and 2045. After 2045, however, a gradual decline in NEP is projected under the high-emission scenarios. The mean annual NEP values under the SSP126, SSP245, and SSP585 scenarios are projected to be 122.88, 114.28, and 108.54 g C·m−2·yr−1, respectively, with corresponding average annual growth rates of 0.34, 0.19, and 0.009 g C·m−2·yr−1. While the overall NEP trend remains positive compared to the historical period, the rate of increase is expected to slow significantly. For the 2045-2060 timeframe, the average growth rates are projected to be 0.18,−0.08, and−0.10 g C·m−2·yr−1 for the respective scenarios.
Figure 7

Spatial distribution and trends in average NEP in Xinjiang's forest regions under three future climate scenarios from 2023 to 2060.
A comparison of future carbon sequestration potential reveals that the capacity under the SSP126 scenario is markedly higher than the others. This suggests that under a low-emission pathway, more moderate warming and stable precipitation patterns would result in weaker water stress on forests, leading to optimal spatial effectiveness of carbon uptake (Pan et al., 2024; Liu et al., 2024) In contrast, under the SSP245 and SSP585 scenarios, the NEP growth rate is expected to decline noticeably after 2045, with some periods even showing a net decrease. This is likely attributable to uncontrolled greenhouse gas emissions leading to more frequent high-temperature events, droughts, and other extremes, which would particularly affect the desert forests of southern Xinjiang and high-altitude coniferous forests. The detrimental impact of high temperatures and drought on forest carbon sink capacity is well-documented. For instance, an extreme temperature event in Qianyanzhou in 2003 caused a 90% reduction in net ecosystem exchange (Zhang et al., 2018), and similar conditions in 2013 reduced forest carbon sequestration in southern China by approximately 100 Tg C (Yuan et al., 2016). Furthermore, as most of Xinjiang's forests are in high-altitude areas with cooler climates, a near-term temperature increase may initially enhance the carbon sink by extending the growing season. However, after 2045, continued warming could push temperatures beyond the optimum for photosynthesis, posing a significant risk of NEP decline (Niu et al., 2024).
5 Discussion
5.1 Influence of meteorological factors on NEP variation in different forest types
In this study, we analyzed the relationship between NEP and meteorological factors for different forest types using partial correlation coefficients on data from the recent 40 year period of 1982-2022. Spatially, the partial correlation between temperature and forest NEP in Xinjiang exhibits significant geographical differentiation. In cool, humid montane forests, rising temperatures can alleviate low-temperature limitations on photosynthesis and extend the growing season, resulting in a significant positive correlation with NEP (Jiang et al., 2024). In contrast, for the forests surrounding the hot and arid Tarim Basin, warming exacerbates water stress and increases respiratory consumption, leading to a negative correlation between temperature and NEP (Niu et al., 2024; Xiao et al., 2024). The response to temperature varies markedly among forest types. For ENF, a non-significant positive correlation was dominant, covering 57.85% of its area, with an additional 17.93% showing a significant positive correlation. This is likely because ENF is primarily distributed in cool, moist mountainous areas, and its leaf physiology is well-adapted to low temperatures; thus, warming can effectively relieve temperature constraints and promote carbon fixation (Wu et al., 2024). Conversely, DNF showed a significant negative correlation across 57.47% of its area. This may be because Xinjiang's deciduous needleleaf forests are mostly located at mid-to-high altitudes in the Tianshan and Altai mountains and are adapted to cold, wet conditions. When temperatures rise beyond their optimal threshold, stomatal conductance decreases due to heat stress, impeding CO2 absorption. Concurrently, in Xinjiang's arid context, warming intensifies evapotranspiration, leading to soil moisture deficits that further inhibit the synthesis of photosynthetic products (Zhang et al., 2022).
The positive control of precipitation on Xinjiang's forest NEP is stronger than that of temperature. Both for the region as a whole and for individual forest types, precipitation demonstrates the most significant positive effect on NEP. This is particularly true for forests in the arid zones of southern Xinjiang, which are under considerable water stress; here, increased precipitation effectively promotes carbon fixation, showing a significant positive correlation with NEP (Zhang et al., 2024). In the more humid areas of northern Xinjiang, the influence of precipitation on NEP is often modulated by other factors, resulting in non-significant correlations (Han et al., 2014). However, the uneven distribution of precipitation, especially the increasing frequency of extreme climate events, may cause large fluctuations in vegetation NEP. For instance, drought events are often accompanied by an increase in Vapor Pressure Deficit (VPD), which adversely affects plant photosynthesis and leads to a decline in NEP (Wang et al., 2024; Zhou et al., 2024). Furthermore, insufficient water supply during droughts prevents plants from effectively absorbing necessary water and nutrients (Wen et al., 2023), further suppressing their growth and carbon uptake (Heran et al., 2025). Consequently, under drought conditions, vegetation NEP is negatively impacted (Ding et al., 2025).
Solar radiation and forest NEP in Xinjiang exhibit a highly positive correlation. As the primary energy source driving photosynthesis, appropriate levels of solar radiation can promote vegetation photosynthesis and enhance carbon uptake capacity (Zhang et al., 2025). Research in the Mu Us Sandy Land has also found a significant positive correlation between solar radiation and vegetation water use efficiency, which further suggests that a moderate increase in solar radiation is beneficial for improving vegetation photosynthesis (Wang et al., 2020).
5.2 InTEC model sensitivity analysis
Sensitivity analysis was conducted to quantitatively assess the influence of model parameters and input data on the simulation results. In this study, we employed a one-at-a-time approach, where individual parameters or input variables were systematically altered while holding others constant. The resulting changes in simulated NEP were then compared against the baseline simulation to evaluate the model's sensitivity. To assess this, temperature was adjusted by ±1 °C, while precipitation, radiation, and vapor pressure were altered by ± 25%. The InTEC model was then run with each of these modified inputs, and the resulting changes in simulated NEP were analyzed (Table 3). Furthermore, we performed a sensitivity analysis on several key inputs: nitrogen deposition, reference year NPP (NPPref), forest age (age), and the temperature sensitivity coefficient of respiration (Q10). The temperature sensitivity coefficient for respiration, Q10, plays a key role in autotrophic respiration calculations. Studies have shown that the typical value of Q10 is around 1.5, but it can vary significantly under different ecosystem and soil conditions. In arid or wet environments, Q10 may reach values above 2.8 or below 1.2, respectively (Meyer et al., 2018). Q10 is calculated using the definition formula (Reichstein et al., 2000) (Equation 9):
Where RT + 10 represents the mineralization rate of soil organic carbon at a temperature of (T + 10), and RT represents the mineralization rate of soil organic carbon at temperature T. Additionally, the reference year NPP (NPPref) was estimated based on the 2011 Xinjiang Forest Type II survey data, as described in formula (7). The value reflects the baseline growth status of Xinjiang forests (Zan, 2022).
Table 3
| Control factors | NEP (g Cm−2·yr−1) | 变化率 |
|---|---|---|
| Original data simulation results | 74.27 | |
| Tmp increase of 1 °C | 73.88 | −0.53% |
| Tmp decrease of 1 °C | 74.95 | 0.92% |
| Pre increase of 25% | 74.45 | 0.24% |
| Pre decrease of 25% | 73.74 | −0.71% |
| Rad increase of 25% | 74.20 | −0.10% |
| Rad decrease of 25% | 74.28 | 0.02% |
| Vap increase of 25% | 74.43 | 0.21% |
| Vap decrease of 25% | 74.28 | 0.01% |
| Nitrogen deposition increase of 25% | 74.80 | 0.72% |
| Nitrogen deposition decrease of 25% | 73.60 | −0.90% |
| NPPref increase of 25% | 86.83 | 16.91% |
| NPPref decrease of 25% | 55.61 | −25.12% |
| Age increased by 5 years | 75.28 | 1.36% |
| Age decreased by 5 years | 71.68 | −3.49% |
| Q10 increased from 1.5 to 2.0 | 69.64 | −6.23% |
| Q10 decreased from 1.5 to 1.0 | 84.77 | 14.14% |
Sensitivity of Xinjiang forest NEP to various input data from 1960 to 2022.
Altering nitrogen deposition by ± 25% resulted in a 0.72% and−0.90% change in the simulated NEP, respectively. This aligns with existing research indicating that nitrogen deposition can enhance the net photosynthetic rate by increasing leaf nitrogen content, although excessive deposition may become inhibitory (Vries, 2011). In arid regions, where forest ecosystems are often nitrogen-limited, added nitrogen can boost forest productivity (Asner et al., 2001). However, this can also increase litterfall and its decomposition rate, consequently promoting soil CO2 emissions (Steudler et al., 1991). The analysis revealed that both NPPref and forest age introduce significant uncertainty into the InTEC model's outputs. When NPPref was adjusted by ±25%, the simulated NEP for Xinjiang's forests changed by over 16% and−25% relative to the baseline simulation. Similarly, a 5 year increase in stand age led to a 1.36% increase in total NEP change, whereas a 5 year decrease resulted in a 3.49% reduction in the annual average NEP change. This finding is consistent with studies at both national and provincial scales that have confirmed forest age as a critical factor influencing NEP (Chen W. et al., 2000; Mao et al., 2022), reinforcing our conclusion regarding the model's sensitivity to this parameter. The temperature sensitivity coefficient of respiration, Q10, which influences the calculation of autotrophic respiration, also proved to be a significant source of uncertainty. Adjusting the baseline Q10 value of 1.5 by ± 0.5 resulted in a decrease of over 6% and an increase of over 14% in the mean annual NEP change, respectively (Wu and Chen, 2014). In summary, the model results demonstrate considerable sensitivity to temperature, precipitation, nitrogen deposition, NPPref, forest age, and the Q10 parameter. In contrast, the model showed lower sensitivity to variations in radiation and vapor pressure data.
5.3 . Uncertainties and future prospects of forest NEP simulation
Climate change is undoubtedly a critical factor influencing present and future forest NEP (Grant et al., 2012; Fan et al., 2025). This study utilized future meteorological data to predict the spatiotemporal patterns of forest NEP in Xinjiang from 2023 to 2060 using the InTEC model. Although our analysis confirmed the model's usability and reliability at both plot and regional scales, several uncertainties persist, primarily from three sources.
First, future meteorological data are projected using general circulation models with coarse spatial resolutions (Xin et al., 2013). The Tianshan Mountains in Xinjiang significantly obstruct atmospheric circulation, and low-resolution models struggle to capture the fine-scale influence of topography on precipitation and temperature, leading to simulation biases (Jiang et al., 2015). Second, the InTEC model predicts future forest carbon cycling based on a static Land Use Cover Change (LUCC) assumption (Chen J. et al., 2000). In reality, future land use will evolve with socioeconomic development and policy shifts, and the composition and proportion of different tree species may also change (Ren et al., 2019). Therefore, the static LUCC assumption inevitably introduces uncertainty into carbon cycle simulations (Deng et al., 2017). Third, the forest carbon cycle is significantly affected by extreme weather events such as fires and droughts (Zhang et al., 2012). Due to the historical rarity of fires in Xinjiang and the lack of comprehensive historical fire data, this study did not incorporate their impact. However, the frequency of fires is expected to increase with a warming climate. Rising temperatures and solar radiation may also lead to more frequent droughts (Seidl et al., 2014). Such disturbances can severely inhibit vegetation growth and may cause deviations in the model's simulation results (Cao et al., 2022). Based on the aforementioned uncertainties, future research should focus on improving the accuracy of regional climate predictions by incorporating multi-model ensemble averaging and dynamic downscaling methods. Additionally, it is essential to further couple land use change scenario models, such as FLUS and CA-Markov, to enable dynamic simulations of LUCC and the carbon cycle. Furthermore, it is important to construct a historical disturbance database and integrate natural disturbance modules, including fire and drought, into the model, thereby enhancing the comprehensiveness and reliability of future carbon sink assessments.
6 Conclusion
In this study, we employed the InTEC model, driven by a comprehensive suite of multi-source remote sensing and reanalysis data covering meteorology, vegetation, soil, and topography, along with three representative concentration pathways (SSP126, SSP245, and SSP585) from the CMIP6 climate models. We simulated the spatiotemporal patterns of forest NEP in Xinjiang over the period 1901-2060 and analyzed its evolutionary characteristics and response to climatic factors using trend and partial correlation analyses. The main conclusions are as follows:
(1) For the period 1901-2022, the mean forest NEP in Xinjiang was 47.81 g C·m−2·yr−1, exhibiting a fluctuating upward trend at an average annual rate of 0.52 g C·m−2·yr−1. The spatial pattern was generally characterized by higher values in mountainous areas compared to plains, in northern Xinjiang (north of the Tianshan Mountains) relative to southern Xinjiang (south of the Tianshan Mountains), and in the west vs. the east. A significant increase in NEP was observed across 45.29% of the forested area, with an additional 23.46% showing a non-significant increase. The relatively small area of decrease indicates an overall enhancement of the forest ecosystem's carbon sink capacity over the last century.
(2) The future carbon sequestration potential of Xinjiang's forests is projected to be significantly greater under the SSP126 scenario compared to the others. For the period 2023-2060, the mean annual NEP values are estimated to be 122.88, 114.28, and 108.54 g C·m−2·yr−1 under the SSP126, SSP245, and SSP585 scenarios, respectively, with average annual growth rates of 0.34, 0.19, and 0.009 g C·m−2·yr−1, all of which are slower than the historical rate. While a fluctuating upward trend in NEP is expected until 2035 across all scenarios, a decline is possible after 2045 under high-emission pathways. This potential decrease, attributed to factors like high temperatures, drought, extreme events, and increased nitrogen deposition, is primarily concentrated in the piedmont plains of the Tianshan Mountains and the periphery of the Tarim Basin.
(3) The positive influence of precipitation on Xinjiang's forest NEP is stronger than that of temperature. The relationship between temperature and NEP displays significant geographical differentiation, being positive in cool, humid montane forests and negative in hot, arid regions. Both solar radiation and vapor pressure exhibit a predominantly positive correlation with forest NEP, affecting 76.23% and 63.83% of the study area, respectively. These findings reveal the centennial-scale spatiotemporal dynamics of forest NEP in Xinjiang and its response to climatic drivers, while also providing a projection of its future carbon sequestration potential. This work offers a valuable reference for assessing the region's carbon uptake capacity.
Statements
Data availability statement
The raw data supporting the conclusions of this article will be made available by the authors, without undue reservation.
Author contributions
JZ: Writing – original draft, Software, Visualization, Methodology, Conceptualization, Writing – review & editing. MZ: Writing – review & editing, Funding acquisition, Supervision, Formal analysis, Project administration, Investigation, Writing – original draft, Conceptualization. LZ: Resources, Visualization, Writing – original draft, Data curation. JK: Validation, Writing – original draft, Visualization. ZZ: Writing – original draft, Data curation, Validation.
Funding
The author(s) declare that financial support was received for the research and/or publication of this article. This research was funded by the National Natural Science Foundation of China (grant number 42261013) and the Natural Science Foundation of Xinjiang Uygur Autonomous Region (grant number 2023D01A49).
Conflict of interest
The authors declare that the research was conducted in the absence of any commercial or financial relationships that could be construed as a potential conflict of interest.
Generative AI statement
The author(s) declare that no Gen AI was used in the creation of this manuscript.
Any alternative text (alt text) provided alongside figures in this article has been generated by Frontiers with the support of artificial intelligence and reasonable efforts have been made to ensure accuracy, including review by the authors wherever possible. If you identify any issues, please contact us.
Publisher’s note
All claims expressed in this article are solely those of the authors and do not necessarily represent those of their affiliated organizations, or those of the publisher, the editors and the reviewers. Any product that may be evaluated in this article, or claim that may be made by its manufacturer, is not guaranteed or endorsed by the publisher.
References
1
Asner G. P. Townsend A. R. Riley W. J. Matson P. A. Neff J. C. Cleveland C. C. (2001). Physical and biogeochemical controls over terrestrial ecosystem responses to nitrogen deposition. Biogeochemistry54, 1–39. doi: 10.1023/A:1010653913530
2
Bhaskaran S. Paramananda S. Ramnarayan M. (2010). Per-pixel and object-oriented classification methods for mapping urban features using Ikonos satellite data. Appl. Geogr. Clim. Change Appl. Geogr. Place Policy Pract.30, 650–665. doi: 10.1016/j.apgeog.2010.01.009
3
Bradford J. B. Birdsey R. A. Joyce L. A. Ryan M. G. (2008). Tree age, disturbance history, and carbon stocks and fluxes in subalpine Rocky Mountain forests. Glob. Chang. Biol.14, 2882–2897. doi: 10.1111/j.1365-2486.2008.01686.x
4
Cao D. Zhang J. Han J. Zhang T. Yang S. Wang J. et al . (2022). Projected increases in global terrestrial net primary productivity loss caused by drought under climate change. Earth's Fut. 10:e2022EF002681. doi: 10.1029/2022EF002681
5
Chen J. Chen W. Liu J. Cihlar J. Gray S. (2000). Annual carbon balance of Canada's forests during 1895–1996. Glob. Biogeochem. Cycles14, 839–849. doi: 10.1029/1999GB001207
6
Chen J. M. Ju W. Ciais P. Viovy N. Liu R. Liu Y. et al . (2019). Vegetation structural change since 1981 significantly enhanced the terrestrial carbon sink. Nat. Commun.10:4259. doi: 10.1038/s41467-019-12257-8
7
Chen J. M. Ju W. Cihlar J. Price D. Liu J. Chen W. et al . (2003). Spatial distribution of carbon sources and sinks in Canada's forests. Tellus B55, 622–641. doi: 10.1034/j.1600-0889.2003.00036.x
8
Chen W. Chen J. Cihlar J. (2000). An integrated terrestrial ecosystem carbon-budget model based on changes in disturbance, climate, and atmospheric chemistry. Ecol. Modell.135, 55–79. doi: 10.1016/S0304-3800(00)00371-9
9
Chen W. Chen J. M. Price D. T. Cihlar J. (2002). Effects of stand age on net primary productivity of boreal black spruce forests in Ontario, Canada. Can. J. For. Res. 32, 833–842. doi: 10.1139/x01-165
10
Chen Z. Z. Zan M. Yang X. F. Dong Y. (2023). Prediction of forest vegetation carbon storage in Xinjiang. Ecol. Environ. Sci.32, 226–234.
11
Deng L. Liu S. Kim D. G. Peng C. Sweeney S. Shangguan Z. (2017). Past and future carbon sequestration benefits of China's grain for green program. Glob. Environ. Change47, 13–20. doi: 10.1016/j.gloenvcha.2017.09.006
12
Ding X. Liu J. Wei L. H. Xie D. W. Zheng Z. P. (2025). Spatiotemporal patterns and influencing factors of vegetation net ecosystem productivity in shandong province based on gsmsr model. Ecol. Environ. Sci. 34,1079–1089. doi: 10.16258/j.cnki.1674-5906.2025.07.008
13
Eyring V. Bony S. Meehl G. A. Senior C. A. Stevens B. Stouffer R. J. et al . (2016). Overview of the Coupled Model Intercomparison Project Phase 6 (CMIP6) experimental design and organization. Geosci. Model Dev.9, 1937–1958. doi: 10.5194/gmd-9-1937-2016
14
Fan Y. Yan Y. Gan F. Dai Q. Zhang X. (2025). Editorial: understanding the relationship between extreme climate events and forest soil hydrology: implications for ecosystem functions. Front. For. Glob. Change8:1579133. doi: 10.3389/ffgc.2025.1579133
15
Fang J. Yu G. Liu L. Hu S. Chapin F. S. (2018). Climate change, human impacts, and carbon sequestration in China. Proc. Nat. Acad. Sci.115, 4015–4020. doi: 10.1073/pnas,.1700304115
16
Feng X. Sun Q. Lin B. (2014). NPP process models applied in regional and global scales and responses of NPP to the global change. Ecol. Environ. Sci.23, 496–503. doi: 10.16258/j.cnki.1674-5906.2014.03.004
17
Grant R. F. Baldocchi D. D. Ma S. (2012). Ecological controls on net ecosystem productivity of a seasonally dry annual grassland under current and future climates: modelling with ecosys. Agric. For. Meteorol.152, 189–200. doi: 10.1016/j.agrformet.2011.09.012
18
Gu F. X. Huang M. Zhang Y. D. Yan H. M. L. I J Guo, R. et al . (2016). Modeling the temporal-spatial patterns of atmospheric nitrogen deposition in China during 1961-2010. Acta Ecol. Sinica36, 3591–3600. doi: 10.5846/stxb201409211868
19
Han Q. Luo G. Li C. Ye H. Feng Y. (2014). Simulation of carbon trend in forest ecosystem in northern slope of the tianshan mountains based on biome-BGC Model.31, 375–382. doi: 10.13866/j.azr.2014.03.025
20
Hao Y. Yang R. Wu J. Zhang J. Zhou L. (2025). Vegetation productivity in xinjiang's ecosystems: responses to natural and human factors across basins and land covers. Ecosyst. Health Sustain.11:0338. doi: 10.34133/ehs.0338
21
He Q. Ju W. Dai S. He W. Song L. Wang S. et al . (2021). Drought risk of global terrestrial gross primary productivity over the last 40 years detected by a remote sensing-driven process model. J. Geophys. Res. Biogeosci.126:e2020JG005944. doi: 10.1029/2020JG005944
22
Heran Y. Zou J. Wulala T. Ding J. L. Yang M. Huang S. Li J. Q. (2025). Decoupling analysis of drought-induced factors on carbon-water cycle in central asia. Acta Ecol. Sinica45, 9515–9528.
23
Houghton R. A. (2005). Aboveground forest biomass and the global carbon balance. Glob. Chang. Biol.11, 945–958. doi: 10.1111/j.1365-2486.2005.00955.x
24
Jiang M. Liu X. Liu L. (2024). Different responses of terrestrial carbon fluxes to environmental changes in cold temperate forest ecosystems. Forests15:1340. doi: 10.3390/f15081340
25
Jiang P. Ding W.G Xiao J. Pan X. M. (2021). Altitudinal difference of vegetation NPP and its response to climate change in Xinjiang[J]. Arid Land Geogr.44, 849–857. doi: 10.12118/j.issn.1000–6060.2021.03.27
26
Jiang Y. M. Huang A. Wu H. M. (2015): Evaluation of the performance of Beijing climate center climate system model with different horizontal resolution in simulating the annual surface temperature over Central Asia.Chin. J. Atmos. Sci.39, 535–547. 10.3878/j.issn.1006-9895.1408.14133
27
Keenan T. F. Prentice I. C. Canadell J. G. Williams C. A. Wang H. Raupach M. et al . (2016). Recent pause in the growth rate of atmospheric CO2 due to enhanced terrestrial carbon uptake. Nat. Commun.7:13428. doi: 10.1038/ncomms13428
28
Li C. Wang Y. Wu X. Cao H. Li W. Wu T. (2021). Reducing human activity promotes environmental restoration in arid and semi-arid regions: a case study in Northwest China. Sci. Total Environ.768:144525. doi: 10.1016/j.scitotenv.2020.144525
29
Li J. Zhang Y. D. Gu F. G. Huang M. Guo R. Hao W. P. et al . (2014). Temporospatial variations in net ecosystem productivity in Northeast China since. Acta Ecol. Sinica34, 1490–1502. doi: 10.5846/stxb201305291221
30
Li P. Y. Wang X. J. Xu S.X Gao S.H Xue Z. X. Heng R. (2024). Spatiotemporal pattern of NEP in Aksu River Basin based on PLUS land use simulation. Arid Zone Res. 41,1059–1068. doi: 10.13866/j.azr.2024.06.14
31
Li Y. Chen G. K. Lin D. M. Chen B. Gao L. M. Jian X. et al . (2016). Carbon storage and its distribution of forest ecosystems in Zhejiang Province, China. Chin. J. Plant Ecol.40:354.
32
Li Z. Chen Y. Zhang Q. Li Y. (2020). Spatial patterns of vegetation carbon sinks and sources under water constraint in Central Asia. J. Hydrol.590:125355. doi: 10.1016/j.jhydrol.2020.125355
33
Liu S. R Wang H. Li H. K Yu Z. Luan J. W . (2024). Projections of China's forest carbon storage and sequestration and ways of their potential capacity enhancement. Sci. Sil. Sinicae60, 157–172. doi: 10.11707/j.1001-7488.LYKX20230206
34
Liu Y. B. Ju W. M. Chen J M. et al . (2012). Spatial and temporal variations of forest LAI in China during 2000–2010. Chin. Sci. Bull.57, 2846–2856. doi: 10.1007/s11434-012-5064-8
35
Lü F. C. Ma J. Y. Cao Y. Yan X. D. (2022). Carbon fluxes simulation of China's typical forest ecosystem based on FORCCHN model. Acta Ecologica Sinica42, 2810–2821. doi: 10.5846/stxb202102070399
36
Lu X. Chen Y. Sun Y. Xu Y. Xin Y. Mo Y. (2023). Spatial and temporal variations of net ecosystem productivity in Xinjiang autonomous region, China based on remote sensing. Front. Plant Sci.14:1146388. doi: 10.3389/fpls.2023.1146388
37
Luo M. Meng F. Wang Y. Sachula B.ao, Y. Liu T. (2024). Mutual feedback relationship between vegetation GPP and soil moisture in China under climate change. Acta Geogr. Sinica218–239.
38
Mao F. Du H. Zhou G. Zheng J. Li X. Xu Y. et al . (2022). Simulated net ecosystem productivity of subtropical forests and its response to climate change in Zhejiang Province, China. Sci. Total Environ.838:155993. doi: 10.1016/j.scitotenv.2022.155993
39
Marc A. Quentin H. Henri C. Alain D. Anne D. L. Bernard H. et al . (2018). Inter-annual variability of net ecosystem productivity for a temperate mixed forest: a predominance of carry-over effects?Agric. For. Meteorol.262, 340–353. doi: 10.1016/j.agrformet.2018.07.024
40
Meyer N. Welp G. Amelung W. (2018). The Temperature Sensitivity (Q10) of Soil respiration: controlling factors and spatial prediction at regional scale based on environmental soil classes. Glob. Biogeochem. Cycles32, 306–323. doi: 10.1002/2017GB005644
41
Mngadi M. Odindi J. Mutanga O. Sibanda M. (2022). Estimating aboveground net primary productivity of reforested trees in an urban landscape using biophysical variables and remotely sensed data. Sci. Total Environ.802:149958. doi: 10.1016/j.scitotenv.2021.149958
42
Niu S. Chen W. Liáng L. L. Sierra C. A. Xia J. Wang S. et al . (2024). Temperature responses of ecosystem respiration. Nat. Rev. Earth Environ.5, 559–571. doi: 10.1038/s43017-024-00569-3
43
Pan J. Dong L. (2018). Spatio-temporal variation in vegetation net primary productivity and its relationship with climatic factors in the Shule River basin from 2001 to 2010. Hum. Ecol. Risk Assess. Int. J. 24, 797–818. doi: 10.1080/10807039.2017.1400373
44
Pan Y. Birdsey R. A. Phillips O. L. Houghton R. A. Fang J. Kauppi P. E. et al . (2024). The enduring world forest carbon sink. Nature631, 563–569. doi: 10.1038/s41586-024-07602-x
45
Piao S. He Y. Wang X. Chen F. (2022). Estimation of China's terrestrial ecosystem carbon sink: Methods, progress and prospects. Sci. China Earth Sci. 65, 641–651. doi: 10.1007/s11430-021-9892-6
46
Piao S. Tan K. Nan H. Ciais P. Fang J. Wang T. et al . (2012). Impacts of climate and CO2 changes on the vegetation growth and carbon balance of Qinghai–Tibetan grasslands over the past five decades. Glob. Planet. Change 98–99, 73–80. doi: 10.1016/j.gloplacha.2012.08.009
47
Reichstein M. Bednorz F. Broll G. Kätterer T. (2000). Temperature dependence of carbon mineralisation: conclusions from a long-term incubation of subalpine soil samples. Soil Biol. Biochemistr.32, 947–958. doi: 10.1016/S0038-0717(00)00002-X
48
Ren Y. Lü Y. Comber A. Fu B. Harris P. Wu L. (2019). Spatially explicit simulation of land use/land cover changes: Current coverage and future prospects. Earth Sci. Rev.190, 398–415. doi: 10.1016/j.earscirev.2019.01.001
49
Seidl R. Schelhaas M. Rammer W. Verkerk P. J. (2014). Increasing forest disturbances in Europe and their impact on carbon storage. Nat. Clim. Chang.4, 806–810. doi: 10.1038/nclimate2318
50
Shangguan W. Dai Y. Liu B. Zhu A. Duan Q. Wu L. et al . (2013). A China data set of soil properties for land surface modeling. J. Adv. Model Earth Syst.5, 212–224. doi: 10.1002/jame.20026
51
Shao Y. Pan J. Yang L. Chen J. M. Ju W. M. Shi X. (2007). Tests of soil organic carbon density modeled by InTEC in China's forest ecosystems. J. Environ. Manag. Carbon Sequestr. China's Forest Ecosyst.85, 696–701. doi: 10.1016/j.jenvman.2006.09.006
52
Shi L. Halik Ü. Mamat Z. Wei Z. (2020). Spatio-temporal variation of ecosystem services value in the Northern Tianshan Mountain Economic zone from 1980 to 2030. PeerJ.8:e9582. doi: 10.7717/peerj.9582
53
Sitch S. Smith B. Prentice I. C. Arneth A. Bondeau A. Cramer W. et al . (2003). Evaluation of ecosystem dynamics, plant geography and terrestrial carbon cycling in the LPJ dynamic global vegetation model. Glob. Chang. Biol.9, 161–185. doi: 10.1046/j.1365-2486.2003.00569.x
54
Steudler P. A. Melillo J. M. Bowden R. D. Castro M. S. Lugo A. E. (1991). The effects of natural and human disturbances on soil nitrogen dynamics and trace gas fluxes in a Puerto Rican wet forest. Biotropica. 23, 356–363. doi: 10.2307/2388252
55
Tian H. Ji X. Zhang F. (2022). Spatiotemporal variations of vegetation net primary productivity and its response to meteorological factors across the yellow river basin during the period 1981–2020. Front. Environ. Sci. 10:949564. doi: 10.3389/fenvs.2022.949564
56
Vries W. de (2011). Nitrogen as a Threat to European Terrestrial Biodiversity - Chapter 20. International Dairy Journal.
57
Wang J. Y. Qin S. G. Zhang Y. Q. (2020). Spatial-temporal patterns of vegetation water use efficiency in the Mu Us Desert. J. Desert Res.40, 120–129. doi: 10.7522/j.issn.1000-694X.2020.00005
58
Wang S. Chen J. M. Ju W. M. Feng X. Chen M. Chen P. et al . (2007). Carbon sinks and sources in China's forests during 1901–2001. J. Environ. Manage. Carbon Sequestr. China's Forest Ecosyst.85, 524–537. doi: 10.1016/j.jenvman.2006.09.019
59
Wang T. Bao A. Xu W. Zheng G. Nzabarinda V. Yu T. et al . (2023). Dynamics of forest net primary productivity based on tree ring reconstruction in the Tianshan Mountains. Ecol. Indic.146:109713. doi: 10.1016/j.ecolind.2022.109713
60
Wang Y. Liu X. Lan W. Yin S. Fan L. Mai B. et al . (2024). Distribution and main influencing factors of net ecosystem carbon exchange in typical vegetation ecosystems of Southern China. Aerosol. Air Qual. Res. 24:230320. doi: 10.4209/aaqr.230320
61
Wen R. Jiang P. Qin M. Jia Q. Cong N. Wang X. et al . (2023). Regulation of NDVI and ET negative responses to increased atmospheric vapor pressure deficit by water availability in global drylands. Front. For. Glob. Change6:1164347. doi: 10.3389/ffgc.2023.1164347
62
Wu C. Chen J. M. (2014). Reconstruction of interannual variability of NEP using a process-based model (InTEC) with climate and atmospheric records at Fluxnet-Canada forest sites. Int. J. Climatol.34, 1715–1722. doi: 10.1002/joc.3789
63
Wu L. Wang S. Ma Y. Yang R. Guan Y. Hai K. et al . (2024). Response of vegetation to climate change in Central Asia with remote sensing and meteorological data. Nat. Remote Sens. Bull.12, 2248–2267. doi: 10.11834/jrs.20209216
64
Xiao D. Liu D. L. Zhang X. Fan Y. (2024). Editorial: agricultural production in a warmer world: challenges and sustainable development strategies. Front. Earth Sci. 12:1368149. doi: 10.3389/feart.2024.1368149
65
Xin X. Zhang L. Zhang J. Wu T. Fang Y. (2013). Climate Change Projections over East Asia with BCC_CSM1.1 Climate Model under RCP Scenarios. J. Meteorol. Soc. Japan. Ser. II91, 413–429. doi: 10.2151/jmsj.2013-401
66
Ye X. J. Wang Y. H. Pan H. Z. Bai Y. Dong D. F. Yao H. M. (2022). Spatial-temporal variation and driving factors of vegetation net ecosystem productivity in Qinghai Province. Arid Zone Res.39, 1673–1683. doi: 10.13866/j.azr.2022.05.31
67
Yin G. Zhang Y. Sun Y. Wang T. Zeng Z. Piao S. (2015). MODIS Based Estimation of Forest Aboveground Biomass in China. PLoS ONE10:e0130143. doi: 10.1371/journal.pone.0130143
68
Yuan W. Cai W. Chen Y. Liu S.huguang, Dong, W. Zhang H. Yu G. et al . (2016). Severe summer heatwave and drought strongly reduced carbon uptake in Southern China. Sci. Rep.6:18813. doi: 10.1038/srep18813
69
Zan M. (2022). Spatiotemporal Variation Characteristics of Forest Carbon Flux and Carbon Storage and their Main Influencing Factors in Xinjiang. Nanjing University.
70
Zhang F. Chen J. M. Pan Y. Birdsey R. A. Shen S. Ju W. et al . (2012). Attributing carbon changes in conterminous U.S. forests to disturbance and non-disturbance factors from 1901 to 2010. J. Geophys. Res. Biogeosci.117:2011JG001930. doi: 10.1029/2011JG001930
71
Zhang J. Hao X. Hao H. Fan X. Li Y. (2021). Climate change decreased net ecosystem productivity in the arid region of Central Asia. Remote Sens. (Basel)13:4449. doi: 10.3390/rs13214449
72
Zhang M. Huang X. Chuai X. Xie X. Zhu Z. Wang Y. (2020). Spatial distribution and trends of net ecosystem productivity in China. Geogr. Geo Inform. Sci.69–74.
73
Zhang M. Wen X. Zhang L. Wang H. Guo Y. Yu G. (2018). Multi-temporal scale analysis of impacts of extreme high temperature on net carbon uptake in subtropical coniferous plantation. Ying Yong Sheng Tai Xue Bao29, 421–432. doi: 10.13287/j.1001-9332.201802.015
74
Zhang W. Zhao X. Li H. Fang Y. Shi W. Zhao S. et al . (2024). Dynamic analysis and risk assessment of vegetation net primary productivity in Xinjiang, China. Remote Sens. (Basel)16:3604. doi: 10.3390/rs16193604
75
Zhang X. Wang L. Yang Y. Chen Y. Feng K. (2025). Spatiotemporal Evolution of Carbon Sources/Sinks and Multi-Factor Driving Mechanisms in the Weihe River Basin. Environ. Sci. doi: 10.13227/j.hjkx.202504207
76
Zhang Y. He N. Zhang G. Huang J. (2013). Nitrogen deposition and Leymus chinensis leaf chlorophyll content in Inner Mongolian grassland. Acta Ecol. Sinica33, 6786–6794. doi: 10.5846/stxb201207050939
77
Zhang Y. Piao S. Sun Y. Rogers B. M. Li X. Lian X. et al . (2022). Future reversal of warming-enhanced vegetation productivity in the Northern Hemisphere. Nat. Clim. Change12, 581–586. doi: 10.1038/s41558-022-01374-w
78
Zhao G. Wang B. Fan W. Yin T. (2011). Vegetation net primary productivity in Northeast China in 2000-2008: simulation and seasonal change. J. Appl. Ecol.22, 621–630. doi: 10.13287/j.1001-9332.2011.0153
79
Zhao L. Wang S. Ju W. Zhe X. Georg K. Chen J. et al . (2013). Assessment of carbon dynamics of forest ecosystems in the Poyang Lake basin responding to afforestation and future climate change. Jore4, 11–19. doi: 10.5814/j.issn.1674-764x.2013.01.002
80
Zhao M. M. Zhao N. Liu Y. Yang J. L. Liu Y. Yue T.X . (2019). An overview of forest carbon measurement methods. Acta Ecol. Sinica39, 3797–3807.
81
Zhao X. Q. Luo M. Meng F. H. Wang Y. Q. Sa C. L. Dong J. Y. (2025). Spatiotemporal evolution characteristics and driving factors of vegetation carbon sources/sinks in arid and semi-arid regions of Northwest China. Acta Ecol. Sinica 45.
82
Zheng J. Mao F. Du H. Li X. Zhou G. Dong L. et al . (2019). Spatiotemporal simulation of net ecosystem productivity and its response to climate change in subtropical forests. Forests10:708. doi: 10.3390/f10080708
83
Zheng S. L. Xu W. Q. Yang L. Gao Y. Q. Li J.J Wang L. (2016). Carbon Density and Storage of Forest Ecosystem in Altay Mountains, Xinjiang. J. Nat. Res.31, 1553–1563. doi: 10.11849/zrzyxb.20151167
84
Zhou Z. Ren X. Shi L. He H. Zhang L. Wang X. et al . (2024). Vapor pressure deficit and temperature variability drive future changes to carbon sink stability in China's terrestrial ecosystems. Front. For. Glob. Change7:1518578. doi: 10.3389/ffgc.2024.1518578
85
Zhu W. Q. Pan Y. Z. Zhang J. S. (2007). Estimation of net primary productivity of chinese terrestrial vegetation based on remote sensing. Chin. J. Plant Ecol.31, 413–424. doi: 10.17521/cjpe.2007.0050
Summary
Keywords
net ecosystem productivity, InTEC model, spatiotemporal variation, CMIP6, Xinjiang
Citation
Zhou J, Zan M, Zhai L, Ke J and Zhao Z (2025) Study on the spatio-temporal dynamics of forest carbon sources and sinks in Xinjiang based on process models and their climate response mechanisms. Front. For. Glob. Change 8:1713711. doi: 10.3389/ffgc.2025.1713711
Received
02 October 2025
Revised
17 November 2025
Accepted
19 November 2025
Published
10 December 2025
Volume
8 - 2025
Edited by
Aldo Rafael Martínez Sifuentes, National Institute of Forestry and Agricultural Research (INIFAP), Mexico
Reviewed by
Tanzeel Javaid Aini Farooqi, Yibin University, China
Yuchuan Fan, Zhejiang Agriculture and Forestry University, China
Updates
Copyright
© 2025 Zhou, Zan, Zhai, Ke and Zhao.
This is an open-access article distributed under the terms of the Creative Commons Attribution License (CC BY). The use, distribution or reproduction in other forums is permitted, provided the original author(s) and the copyright owner(s) are credited and that the original publication in this journal is cited, in accordance with accepted academic practice. No use, distribution or reproduction is permitted which does not comply with these terms.
*Correspondence: Mei Zan, 107622007010058@xjnu.edu.cn
†These authors have contributed equally to this work and share first authorship
Disclaimer
All claims expressed in this article are solely those of the authors and do not necessarily represent those of their affiliated organizations, or those of the publisher, the editors and the reviewers. Any product that may be evaluated in this article or claim that may be made by its manufacturer is not guaranteed or endorsed by the publisher.