Abstract
Future forests will have to face compound climate events such as hotter droughts as climate keeps warming. A better understanding of tree growth resilience to such extreme droughts is key to better inform future forests capacity to provide ecosystem services. Arboreta provide a suitable setting to assess the capacity of tree species from different origins to respond to drought under similar climatic conditions. However, the comparison of growth trajectories and growth resilience to drought of arboretum trees are still scarce, particularly for temperate oaks, a major group of trees with remarkable ecological and economical values across the northern Hemisphere. We propose that the comparison of the post-drought growth resilience of oaks co-occurring in an arboretum along with bioclimatic variables, and functional (wood and leaf) traits can help to identify vulnerable species in sight of climate change. To this end, we studied 20 oak species originating from different regions around the world, planted in the Iturrarán botanical garden located in Northern Spain. Dendrochronology was used to calculate growth statistics and resilience indices during the exceptionally hot 2022 drought. These indices were related to: bioclimatic variables, tree diameter, leaf (leaf area, leaf mass per area) and xylem traits (wood density, hydraulic diameter, conductive area, Huber value). Additionally, we compared resilience and drought legacies for eight oak species sampled in the arboretum and in the field, respectively. All oak species showed marked growth reductions in the year 2022. Diameter and mean ring width covaried with leaf traits and wood density since wider rings were observed in species with lower leaf mass per area. Resilience to the 2022 drought was related to the precipitation of origin of each species. The resilience data of the eight oak species sampled in the arboretum and in the field showed a weak positive, but not significant relationship. Among-tested variables, precipitation-of-origin explains the largest share of the variation in resilience to drought. Tree-ring data from arboreta trees provide relevant information which can be used to better preserve and manage temperate forests subjected to more arid conditions.
1 Introduction
Compound drought and heatwave events or “hotter droughts” are increasing in severity and spatial coverage across the Northern hemisphere due to recent warming (Mukherjee and Mishra, 2021). These extreme climate events disproportionally impact socio-ecological systems including forests (Zscheischler et al., 2018), causing losses in productivity through reduced growth and elevated mortality rate (Reichstein et al., 2013; Gazol and Camarero, 2022; Gazol et al., 2025). For instance, the 2022 European summer compound drought and heatwave event reduced soil moisture due to precipitation deficits and very warm temperatures thus amplifying drought duration and severity (Tripathy and Mishra, 2023). In Iberia, record-breaking summer temperatures, unprecedented within the last 700 years, were experienced during 2022 leading to the driest conditions within the last 279 years in Northern Spain (Serrano-Notivoli et al., 2023). Such extreme soil and atmospheric dryness (elevated vapor pressure deficit-VPD) negatively impacted deciduous broadleaf forests causing canopy damage in temperate sites of the study region (Gharun et al., 2024). Particularly, canopies were negatively affected by elevated summer VPD, which raises concerns about the future climate mitigation capacity of forests (Forzieri et al., 2022).
In a biogeographically diverse species set, traits are shaped by climate-of-origin through macro-climatic filtering and adaptation, and traits in turn may contribute to drought resilience (Ramírez-Valiente et al., 2020, 2022). For instance, tree species displaying high recovery to extreme drought episodes tended to present higher wood density (Serra-Maluquer et al., 2022). A greater use of resources and higher growth rates would be expected in productive wet biomes, whereas a more conservative use and lower growth rates should prevail in drier biomes according to the fast-slow plant economics spectrum (Reich, 2014). In this context, common gardens or arboreta provide ideal settings to disentangle the relative roles played by climate conditions on traits and how traits impact drought resilience by limiting the confounding influences of environmental and phenotypic variation (e.g., Schwinning et al., 2022; Pan et al., 2025; Perez-Martinez et al., 2025).
Future forest productivity and resilience would depend on how compound drought and heatwave events reduce tree growth rates and increase the mortality risk (Camarero et al., 2015). Post-drought growth recovery may be also hampered by these extreme climate events, particularly in species showing a low resilience or capacity to restore growth rates after the drought event has finished (Gazol et al., 2018). For instance, deciduous oaks from mesic sites showed a more rapid recovery after drought across the northern Hemisphere, being more resistant to the negative influence of water shortage, and exhibited smaller drought legacies than did evergreen pines from dry sites (Anderegg et al., 2015). In these oaks, drought legacies were more prolonged in dry than in mesic sites, highlighting species-specific responses related to the climate of origin (Fontes et al., 2022; Bose et al., 2024).
Previous studies carried out in common gardens found relationships between the climate of origin and functional traits with tree species from wetter and warmer sites forming wider vessels and showing higher vessel lumen fraction (Hietz et al., 2022; Savage et al., 2022; Yang et al., 2024), patterns also observed in the field (Carlquist, 1975; Gleason et al., 2012; Pfautsch et al., 2016; García-Cervigón et al., 2020). However, common gardens often focus on seedlings or saplings of a few species which limits the extrapolation and applicability to a broader extent considering mature individuals in the field (Schwinning et al., 2022). To address this shortcoming, we evaluated drought resilience of mature individuals of 20 oak species using tree-ring data and focusing on the 2022 hot drought which impacted a common-garden arboretum located in Northern Spain. As potential drivers of resilience we considered the climate of origin, leaf and wood traits and radial-growth variables, being aware that climate of origin impacts both traits and growth (Sancho-Knapik et al., 2021; Martín-Sánchez et al., 2024a). The comparison of growth trajectories and growth resilience to drought in arboreta could provide important data to better manage temperate oak forests, which have remarkable ecological and economical values in the northern Hemisphere.
We aimed to answer the following questions: (i) is drought resilience related to climate-of-origin?; if so, (ii) are these effects potentially related to functional traits that themselves vary with climate-of-origin?, and (iii) is the resilience measured in arboretum individuals of a species similar to resilience measured in the field? We expect that post-drought resilience of temperate oak will increase as precipitation of origin decreases because oaks from drier regions should present traits associated to drought tolerance (e.g., higher wood density and leaf mass per area). We argue that analyzing the relationships between climate of origin, functional traits and growth resilience and extrapolating them to field data improve our knowledge and managing capacity to preserve and manage tree species under current aridification scenarios.
2 Materials and methods
2.1 Study site
The study was carried out in the arboretum of the Iturrarán botanical garden (hereafter Iturrarán, 43.249°N, 2.155°W, 70 m a.s.l., Gipuzkoa province, Basque country, Spain).1 The botanical garden is about 25 ha large, and its arboretum holds a living collection of around 300 oak species (Quercus spp.) with several mature individuals per species (typically 3–5 individuals). Previous studies have been done in this site to evaluate the interspecific variation in oak leaf morphology and hydraulic traits (Sancho-Knapik et al., 2021; Martín-Sánchez et al., 2024a,b). The site elevation varies between 120 and 210 m a.s.l. The soils are mainly composed of clay and their pH is neutral. The climate conditions are softened due to the influence of the Atlantic Ocean. The elevated precipitation of the site, between 1,500 and 1,800 mm per year, and mild temperature conditions (range of temperatures 5.7–22.5 °C) lead to oceanic climate conditions (data from Hernani station, 43.265°N, 1.976°W, 44 m a.s.l.). The potential tree species of the study area is Quercus robur L.
2.2 Sampling trees and processing tree-ring data
Sampling was carried out in May 2025 with the invaluable help of the former arboretum manager (Francisco Garin). We selected a total of 20 oak species represented for at least three adult individuals. Most sampled species were winter-deciduous (n = 14), and the rest were evergreen species (n = 6) (Supplementary Table S1). We measured the diameter at breast height (dbh) of each selected tree at 1.3 m and extracted two cores perpendicular to the maximum slope of the terrain using 5-mm-wide Pressler increment borers (Haglof, Sweden).
The extracted cores were processed and analyzed using dendrochronological methods including cross-dating and detrending of ring-width series (Fritts, 1976). Briefly, cores were air dried after collection, glued onto wooden supports, and sanded with progressively finer-grain sandpaper until ring boundaries were clearly visible. After that, we used a high-resolution scanner (Epson 13000 XL) to scan the processed wood samples at 2,400 dpi resolution, and the resulting images were used to measure ring widths (0.01 mm resolution) and cross-date the samples using the CooRecorder-CDendro software (Larsson and Larsson, 2022). The last complete ring we measured corresponded to the year 2024. The quality of cross-dating was checked using the COFECHA software. The cross-dating was done by calculating moving correlations between individual series of ring-width values and the mean series of the site (Holmes, 1983).
To evaluate trends in radial increment and compare growth trajectories between species, we converted ring-width series into mean basal area increment (BAI) series assuming a concentric stem growth (Biondi and Qeadan, 2008). To calculate BAI we used the formula:
where RWLt and RWLt-1 are the ring-width in the years t and t − 1, respectively. To evaluate year-to-year variations in radial increments we transformed ring-width measurements into dimensionless ring-width indices (RWI). Individual ring width measures were detrended using a smoothing spline with a frequency response of 0.5 and a wavelength of 15 years. Thus, BAI series contain low- and high-frequency variations, whilst RWI series mainly contain high-frequency variations. Thus, we used BAI as a measure of radial increment magnitude and trajectory, while RWI was used to study the relationship between climate variables, including a drought index, and growth variability.
For each species, we quantified the mean ring width and its standard deviation, the Gini coefficient and the first-order autocorrelation (AR1), which measure inequality and year-to-year similarity, respectively. These statistics were obtained by averaging the individual measures for each species (see Supplementary Table S1).
2.3 Functional traits, species occurrences and growth resilience measured in the field
As mentioned above, the site has been previously used as a quasi-common garden to study interspecific differences in leaf and hydraulic traits (Sancho-Knapik et al., 2021; Martín-Sánchez et al., 2024a). Thus, we take advantage of the data published in these studies to study the relationship between xylem and leaf traits and growth variables at the interspecific level. Particularly, Martín-Sánchez et al. (2024a,b) quantified the interspecific variation in leaf area (LA, in cm2), leaf dry weight (LW) and dry leaf mass per area (LMA, in g m−2) for 141 oak species in Iturrarán, and 85 of these samples were previously studied by Sancho-Knapik et al. (2021). Small leaves with high LMA, representative of slow resource use strategy (Reich, 2014) are more prevalent in oaks from arid regions while larger leaves with low LMA appear in cold-wet temperate regions (Martín-Sánchez et al., 2024a). We gathered the values of LA, LW and LMA that accompanied the publication of Martín-Sánchez et al. (2024a) and were publicly available in Zenodo (Martín-Sánchez et al., 2024b). Note that data was available for 19 out of the 20 species studied in our study since Quercus phellos L. was not considered by Martín-Sánchez et al. (2024a). We also obtained the Index of Lobation (ILB) from Martín-Sánchez et al. (2024a,b) because this morphological trait, used to measure the degree of indentation of leaf margins, also characterized oak tolerance to heat stress since narrow and deeply lobated leaves are better adapted to warmer conditions climates due to thinner boundary layers and enhanced hydraulic efficiency (Sisó et al., 2001).
We also obtained xylem traits, including wood density, of the selected species considering anatomical traits related to mechanical strength, sap transport and xylem vulnerability to embolism (Fontes et al., 2022). Specifically, we gathered data on hydraulic diameter (Dh), percentage conductive area (Cond.A) and the Huber Value (HV, i.e., conductive area per leaf area ratio). Stem wood density was measured using the water-displacement method for volume and oven drying at 101 °C for 72 h for mass (Fajardo, 2025). This was done in the laboratory using an additional core extracted at 1.3 m from 2 to 4 individuals per species. In the case of xylem variables, we obtained three to five 1-year-old shoots from different individuals of each species and cut 20-to-30-μm-thick cross sections using a sledge microtome (AS 200; Anglia Scientific Instruments, Cambridge, UK). Sections were mounted on glass slides, stained with safranin (0.5% in distilled water), Astra Blue (2%) and fixed with Eukitt®. Images of sections were taken at 20–40× magnification with a digital camera mounted on a light microscope (Olympus BH2). They were stitched with the ICE software (Microsoft©) and analyzed using ImageJ-Fiji4 (Schindelin et al., 2012). The same image analyses software as used to measure the total leaf area in order to calculate HV following García Saganta (2006). Lastly, the Dh was calculated as.
where D is the mean diameter (ellipses) of the n vessels measured in the whole ring (Scholz et al., 2013).
We gathered the species occurrence data from Martín-Sánchez et al. (2024a) dataset, since they evaluated how macroclimate conditions in species distribution range affects leaf trait variation, and obtained occurrence data for each species from GBIF.2 We complemented the dataset by including the geographical distribution coordinates of Quercus phellos L. from GBIF (see text footnote 1; 1 October 2025) (GBIF.org, 2025). The coordinates associated with the occurrence of each species were used to download bioclimatic variables (Supplementary Table S2) as done by Martín-Sánchez et al. (2024a) (Figure 1).
Figure 1
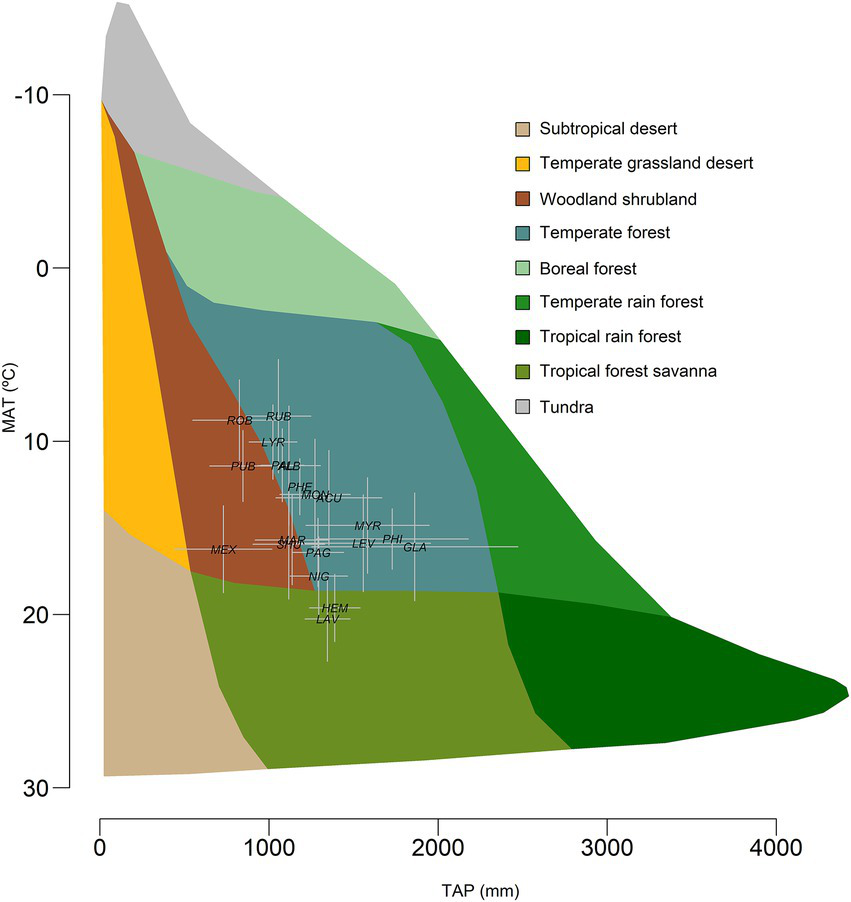
Bioclimate position of the study oak species in the Whittaker biome diagram. MAT is the mean annual temperature, and TAP is the total annual precipitation. Error bars are standard deviations.
Finally, we used the previous study done by Bose et al. (2024) to obtain the growth characteristics and growth response to drought of oak species in their regions. We retained the values in that study to check the coherence between them and the findings presented here. Only eight out of the 20 species studied were shared with previous dendrochronological records and allowed comparing resilience measured in Iturrarán and drought legacies in the field at large scale. Bose et al. (2024) quantified drought legacies as the departure of observed tree growth from expected tree growth based on the relationship between mean site series of ring-width indices and monthly climate variables. This is methodologically different but conceptually similar to the resilience components quantified in this study. Resilience measured in the field at large scale.
We quantified the radial increment responses of each species to drought using resilience indices (Lloret et al., 2011; Thurm et al., 2016; Schwarz et al., 2020). We focused on five indices that account for the magnitude of radial increment reductions following drought and the capacity and time required to recover after drought. We focused on the 2022 drought as it was the most intense (see Figure 2), and calculations were based on BAI and considering 2 years before and after drought occurrence as pre- and post-drought periods, respectively. We calculated: (i) drought resistance (Rt), which is the ratio between drought and pre-drought BAI; (ii) recovery (Rc), i.e., the ratio between post-drought and drought BAI; and (iii) resilience (Rs), which is the ratio between post- and pre-drought BAI (Lloret et al., 2011). Additionally, we also considered the recovery period (Rp) and the relative growth reduction (Gr) which accounts for the time required to recover pre-drought BAI (in years) and the percentage of BAI loss during the drought and recovery period (Thurm et al., 2016).
Figure 2
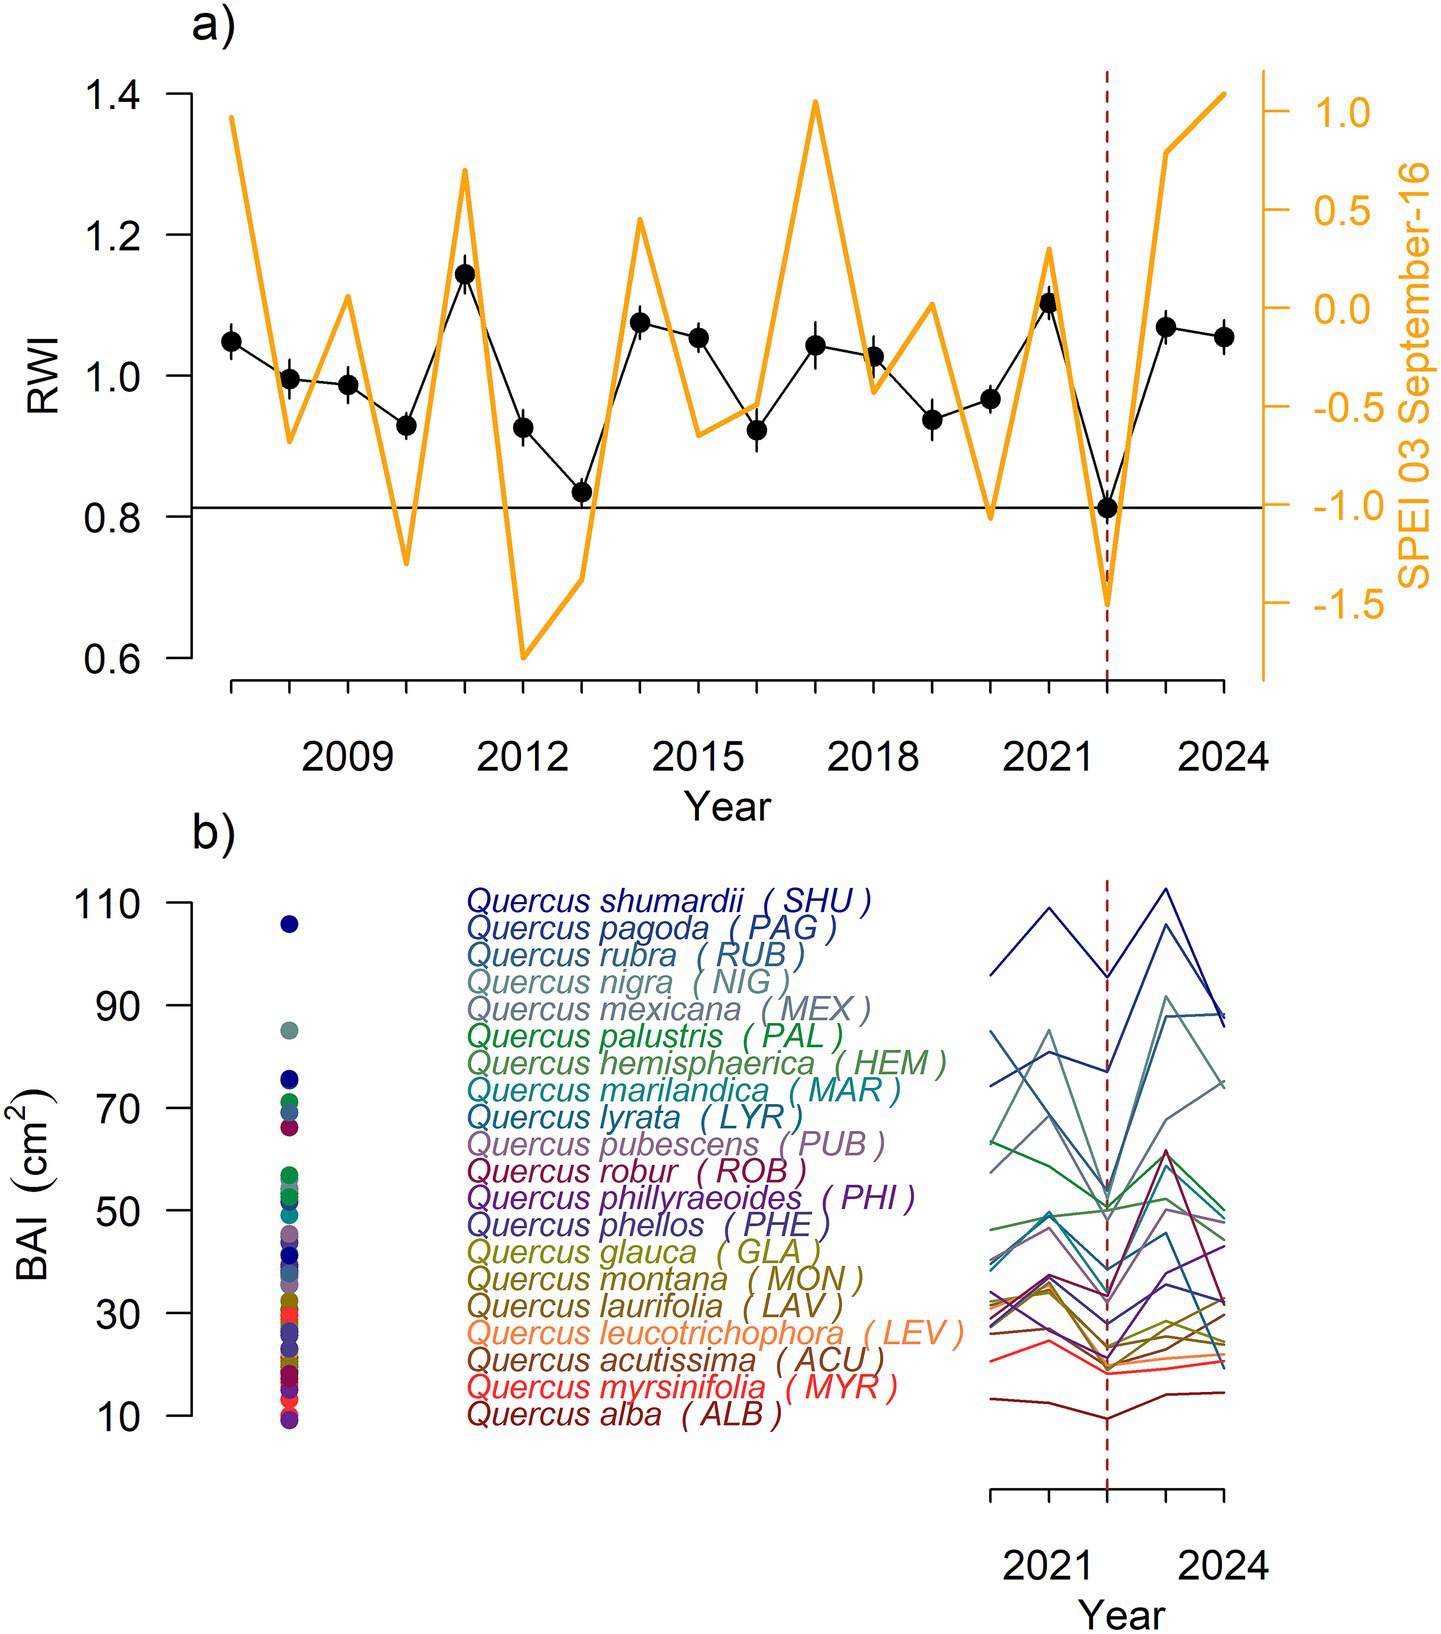
Mean series of (a) oak ring-width indices (RWI) (black lines with symbols) as related to the 3-month SPEI calculated for mid-September (right y axis, yellow line). (b) Data of basal area increment (BAI) considering individual values (points) or means for species (lines) calculated for the period 2020–2024. The dashed line indicates the 2022 drought.
2.4 Climate data
The average climate conditions and additional bioclimatic variables (19 bioclimatic variables; see Supplementary Table S2) were obtained for each site from WorldClim database.3 The bioclimatic variables are derived from monthly temperature and precipitation records and provide information on climate annual trends, seasonality, and extremes (Fick and Hijmans, 2017; Hijmans et al., 2005). We used the moderate resolution global data (2.5 min) to represent the bioclimatic conditions for each species occurrence. Additionally, mean values were calculated for each bioclimatic variable across species to represent the bioclimatic distribution for the species (Figure 1).
To calculated climate-growth relationships we used the 4-km gridded Terraclimate dataset (Abatzoglou et al., 2018). We downloaded the following monthly climate variables: mean maximum and minimum temperatures, precipitation, vapor pressure deficit and downward radiation. These variables were obtained for 2000–2024, a period which included most tree-ring series, but were available since 1958 (Supplementary Figure S1). We also used the Standardized Precipitation Evapotranspiration Index (SPEI) to represent drought severity in the same period. The SPEI is a multi-scalar drought index that measures drought severity through the quantification of its intensity and duration (Vicente-Serrano et al., 2010). The SPEI is computed from the difference between potential evapotranspiration (PET) and precipitation and thus it accounts for the effect of both temperature and precipitation on drought (Vicente-Serrano et al., 2015). Positive and negative values of the SPEI correspond to cumulative water surplus and water deficit, respectively (Vicente-Serrano et al., 2010). We obtained weekly SPEI data at 1-, 3-, 6-, 9-, 12-, and 24-month long temporal scales for 2000–2024 from the 1.1-km2 Spanish SPEI dataset (Vicente-Serrano et al., 2017) to analyze RWI-SPEI relationships.
2.5 Statistical analyses
The relationship between radial increment variability (RWI), climate variables and drought (SPEI) were studied by means of Pearson correlation (r) analyses considering the best-replicated period (2000–2024). A mean site chronology was calculated using the individual chronologies for all the species (20 species, 62 radii). We studied the relationship between RWI, climate variables and SPEI at different scales and for different months. In the case of climate variables, correlations were calculated from the previous October to the current September.
We used Pearson correlation, Principal Component Analysis (PCA) and path analysis to study the relationship between leaf (LA, LMA, LW, ILB), xylem traits (Dh, Cond.A, HV), wood density (WD), and size or radial growth traits (diameter, mean ring width, AR1, Gini coefficient) and resilience components (Rt, Rc, Rs, Gr, Rp). Correlation analyses were used to study bivariate relationships between all the variables. We used Principal Component Analysis (PCA) to decipher major axes of size and radial growth variables, and resilience components variation and the coordination between them (Legendre and Legendre, 2012). Finally, linear regression analyses and path analysis were used to study how climate variables and functional traits (leaf, xylem and wood traits) affect the interspecific variation in resilience components (Rt, Rc, Rs, Rp and Gr). In this sense, we tested how resilience was related to climate-of-origin, and whether this relationship was mediated by functional traits. Due to the reduced sampled size, we restricted the path analyses to the climate variables with the strongest correlation with resilience (Rs) and the functional trait significantly correlated to Rs. We proposed two path models: (1) climate-of-origin affects Rs through its effect on the functional trait; (2) as the previous one but including a direct effect of climate-of-origin. The two models were compared based on their Akaike Information Criterion (AIC).
All statistical analyses were done in the R statistical environment (R Core Team, 2025). The BIOMEplot package was used to create the Whittaker biomes figure (Kunstler, 2014). The package “dplR” (Bunn, 2008, 2010; Bunn et al., 2025) was used to calculate dendrochronological statistics, quantify BAI and detrend the ring-width series. The geodata (Hijmans et al., 2024) and raster (Hijmans, 2024) packages were used to download bioclimatic data and extract information for species occurrences. The pointRes (van der Maaten-Theunissen et al., 2015, 2021), corrplot (Wei and Simko, 2024), vegan (Oksanen et al., 2025), lavaan (Rosseel, 2012) and visreg (Breheny and Burchett, 2017) R packages were used to quantify resilience indices, perform statistical analyses and create graphs.
3 Results
3.1 Growth patterns and climate-growth relationships
Q. shumardii and Q. rubra displayed the largest diameter values while Q. phillyraeoides was the species with the lowest average diameter (Supplementary Table S1). All ring-width series covered the period 2007–2014 (Supplementary Figure S2). The BAI trajectory for all oak species together showed an increase until 2011 and a subsequent stabilization (Supplementary Figure S2). A marked BAI drop was observed in the dry years 2013 and 2022 (Figure 2). The mean ring-width index for the year 2022 was the lowest in the period 2007–2024 (Figure 2a), and summer maximum temperatures were extremely warm during that year (Supplementary Figure S1).
The growth index showed a significant positive relationship with the drought index (SPEI) at short temporal scales (Table 1). In particular, the 1-month SPEI from mid-July to early-August was strongly related with RWI (r ≥ 0.5) as well as the 3-month SPEI from late-September to early-October (Table 1). The strongest relationship with RWI was found for the 1-month SPEI in the first week of August (r = 0.700; p = 0.01) and for the 3-month SPEI in the third week of September (r = 0.775; p = 0.01). Oak growth was enhanced by warm and sunny April conditions, whereas elevated temperatures in the previous December and the current August reduced growth (Table 2). Sunny July-to-August conditions were also related to lower growth indices.
Table 1
| Month | Week | cor_1 | p_1 | cor_3 | p_3 | cor_6 | p_6 | cor_9 | p_9 | cor_12 | p_12 | cor_24 | p24 |
|---|---|---|---|---|---|---|---|---|---|---|---|---|---|
| January | 1 | 0.016 | 0.951 | −0.182 | 0.471 | −0.170 | 0.499 | −0.103 | 0.683 | 0.005 | 0.985 | −0.018 | 0.943 |
| 2 | −0.100 | 0.694 | −0.304 | 0.220 | −0.255 | 0.308 | −0.113 | 0.655 | −0.146 | 0.563 | −0.067 | 0.791 | |
| 3 | −0.108 | 0.670 | −0.246 | 0.326 | −0.266 | 0.286 | −0.137 | 0.587 | −0.202 | 0.421 | −0.111 | 0.662 | |
| 4 | −0.236 | 0.346 | −0.240 | 0.337 | −0.279 | 0.262 | −0.135 | 0.593 | −0.180 | 0.474 | −0.194 | 0.441 | |
| February | 5 | −0.228 | 0.363 | −0.229 | 0.361 | −0.311 | 0.209 | −0.208 | 0.408 | −0.194 | 0.441 | −0.273 | 0.272 |
| 6 | −0.160 | 0.525 | −0.320 | 0.196 | −0.370 | 0.131 | −0.316 | 0.201 | −0.273 | 0.273 | −0.357 | 0.146 | |
| 7 | −0.088 | 0.728 | −0.332 | 0.178 | −0.264 | 0.290 | −0.227 | 0.365 | −0.158 | 0.531 | −0.278 | 0.265 | |
| 8 | 0.113 | 0.656 | −0.117 | 0.643 | −0.227 | 0.365 | −0.175 | 0.488 | −0.104 | 0.683 | −0.238 | 0.342 | |
| March | 9 | 0.124 | 0.623 | −0.123 | 0.626 | −0.240 | 0.338 | −0.218 | 0.385 | −0.164 | 0.514 | −0.234 | 0.350 |
| 10 | 0.260 | 0.297 | −0.046 | 0.855 | −0.260 | 0.297 | −0.236 | 0.346 | −0.197 | 0.434 | −0.232 | 0.354 | |
| 11 | 0.172 | 0.494 | −0.008 | 0.974 | −0.191 | 0.448 | −0.250 | 0.317 | −0.141 | 0.577 | −0.212 | 0.399 | |
| 12 | 0.000 | 1.000 | −0.061 | 0.809 | −0.224 | 0.371 | −0.251 | 0.315 | −0.164 | 0.515 | −0.185 | 0.462 | |
| April | 13 | −0.121 | 0.633 | −0.116 | 0.648 | −0.274 | 0.272 | −0.318 | 0.199 | −0.233 | 0.353 | −0.253 | 0.311 |
| 14 | −0.040 | 0.875 | −0.018 | 0.945 | −0.301 | 0.224 | −0.282 | 0.257 | −0.151 | 0.549 | −0.276 | 0.267 | |
| 15 | −0.373 | 0.127 | −0.147 | 0.561 | −0.326 | 0.187 | −0.320 | 0.196 | −0.217 | 0.386 | −0.318 | 0.199 | |
| 16 | −0.481 | 0.044 | −0.125 | 0.622 | −0.285 | 0.251 | −0.288 | 0.247 | −0.190 | 0.449 | −0.337 | 0.171 | |
| May | 17 | −0.328 | 0.184 | −0.076 | 0.765 | −0.241 | 0.335 | −0.310 | 0.210 | −0.232 | 0.355 | −0.345 | 0.161 |
| 18 | −0.293 | 0.239 | 0.081 | 0.750 | −0.247 | 0.322 | −0.305 | 0.219 | −0.263 | 0.293 | −0.299 | 0.228 | |
| 19 | −0.156 | 0.538 | −0.175 | 0.488 | −0.393 | 0.107 | −0.326 | 0.186 | −0.297 | 0.231 | −0.380 | 0.120 | |
| 20 | −0.015 | 0.954 | −0.320 | 0.195 | −0.231 | 0.357 | −0.349 | 0.156 | −0.297 | 0.232 | −0.386 | 0.114 | |
| June | 21 | 0.086 | 0.734 | −0.265 | 0.288 | −0.199 | 0.428 | −0.321 | 0.194 | −0.310 | 0.210 | −0.388 | 0.112 |
| 22 | −0.074 | 0.770 | −0.232 | 0.354 | −0.111 | 0.661 | −0.336 | 0.173 | −0.315 | 0.204 | −0.359 | 0.143 | |
| 23 | 0.024 | 0.926 | −0.330 | 0.181 | −0.109 | 0.667 | −0.297 | 0.231 | −0.356 | 0.147 | −0.350 | 0.154 | |
| 24 | −0.015 | 0.953 | −0.380 | 0.120 | −0.195 | 0.439 | −0.337 | 0.172 | −0.360 | 0.142 | −0.345 | 0.161 | |
| July | 25 | 0.046 | 0.855 | −0.231 | 0.356 | −0.168 | 0.505 | −0.325 | 0.188 | −0.353 | 0.150 | −0.328 | 0.184 |
| 26 | 0.248 | 0.322 | −0.134 | 0.597 | −0.006 | 0.981 | −0.321 | 0.195 | −0.290 | 0.243 | −0.283 | 0.256 | |
| 27 | 0.634 | 0.005 | 0.182 | 0.471 | −0.007 | 0.977 | −0.264 | 0.289 | −0.250 | 0.316 | −0.242 | 0.333 | |
| 28 | 0.641 | 0.004 | 0.253 | 0.311 | 0.039 | 0.879 | −0.232 | 0.354 | −0.214 | 0.395 | −0.232 | 0.354 | |
| August | 29 | 0.700 | 0.001 | 0.291 | 0.242 | 0.066 | 0.794 | −0.133 | 0.598 | −0.210 | 0.402 | −0.226 | 0.367 |
| 30 | 0.516 | 0.028 | 0.251 | 0.316 | 0.166 | 0.511 | −0.158 | 0.531 | −0.217 | 0.386 | −0.208 | 0.407 | |
| 31 | 0.404 | 0.096 | 0.377 | 0.123 | 0.055 | 0.827 | −0.250 | 0.317 | −0.199 | 0.430 | −0.207 | 0.409 | |
| 32 | 0.307 | 0.215 | 0.544 | 0.020 | 0.012 | 0.961 | −0.032 | 0.901 | −0.193 | 0.444 | −0.171 | 0.497 | |
| September | 33 | 0.490 | 0.039 | 0.702 | 0.001 | 0.149 | 0.555 | 0.057 | 0.821 | −0.124 | 0.623 | −0.136 | 0.591 |
| 34 | 0.451 | 0.060 | 0.671 | 0.002 | 0.190 | 0.449 | 0.140 | 0.580 | −0.117 | 0.643 | −0.145 | 0.567 | |
| 35 | 0.525 | 0.025 | 0.775 | 0.000 | 0.188 | 0.456 | 0.165 | 0.513 | −0.042 | 0.868 | −0.154 | 0.541 | |
| 36 | 0.205 | 0.414 | 0.712 | 0.001 | 0.073 | 0.774 | 0.029 | 0.908 | −0.162 | 0.520 | −0.171 | 0.498 |
Correlations calculated by relating the mean series of ring-width indices (RWI) and the SPEI drought index calculated at different temporal scales (for n = 1, 3, 6, 9, 12 and 24 months) and for different months and weeks (period 2000–2024).
The Pearson correlations (cor_n) and associated probability levels (p_n) are shown. Significant (p < 0.05) correlations are shown in bold characters.
Table 2
| Year | Month | Maximum temperature | Minimum temperature | Precipitation | Vapor pressure deficit | Radiation |
|---|---|---|---|---|---|---|
| t − 1 | October | 0.181 | 0.193 | −0.136 | 0.059 | 0.170 |
| November | 0.025 | 0.024 | −0.055 | 0.274 | −0.141 | |
| December | −0.551 | −0.594 | −0.184 | 0.050 | 0.096 | |
| t | January | 0.084 | 0.079 | −0.311 | −0.016 | −0.058 |
| February | 0.122 | 0.050 | 0.092 | −0.148 | −0.090 | |
| March | −0.127 | −0.060 | 0.107 | −0.093 | −0.263 | |
| April | 0.515 | 0.510 | −0.241 | 0.219 | 0.442 | |
| May | 0.220 | 0.120 | 0.004 | 0.181 | −0.014 | |
| June | −0.006 | −0.103 | 0.121 | 0.014 | 0.088 | |
| July | −0.285 | −0.318 | 0.232 | −0.188 | −0.706 | |
| August | −0.461 | −0.540 | 0.069 | −0.332 | −0.531 | |
| September | 0.140 | 0.125 | −0.024 | −0.127 | 0.089 |
Correlations calculated by relating the mean series of ring-width indices (RWI) and monthly climate variables (period 2000–2024) from the previous October to the current September considering the oak species sampled in the arboretum.
Bold values indicate significant correlations (p < 0.05).
The first two axes of the PCA accounted for 56% of the variation in radial growth traits (diameter, mean ring width, AR1, Gini coefficient) and resilience components (Figure 3). The first axis separated species with large diameter at breast height and wide rings from (e.g., Q. pagoda) those species showing lower growth rates but presenting high values of the Gini coefficient (growth variability) and first-order autocorrelation (e.g., Q. acutissima). Accordingly, the tree diameter was positively related with the mean and the median ring width and also with the ring-width standard deviation (Figure 4). The second axis was mainly related with the separation of species with a high ring-width kurtosis coefficient and Rc (e.g., Q. phillyraeoides) and those with high values of standard deviation of ring-width (e.g., Q. palustris).
Figure 3
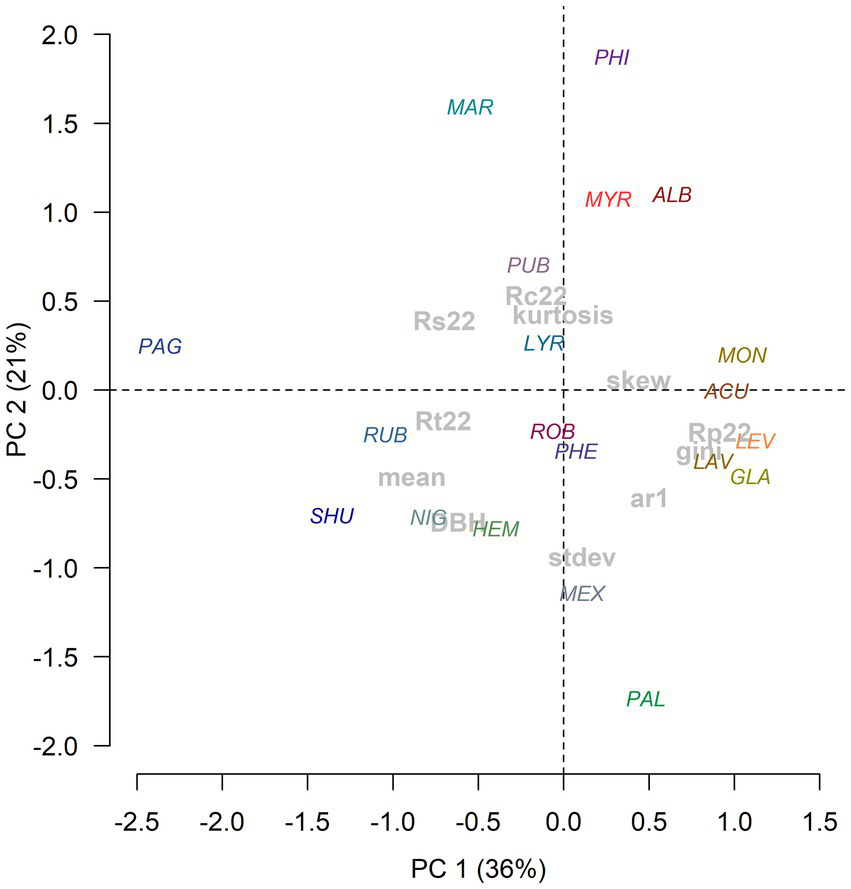
Biplot showing the scores of oak species (color characters) and size (diameter) and growth variables (gray characters) along the first (PC1) and second (PC2) principal components of a PCA. Variables’ abbreviations: DBH, diameter at breast height, stdev, standard deviation; ar1, first-order autocorrelation; gini, Gini coefficient; skew, skewness.
Figure 4
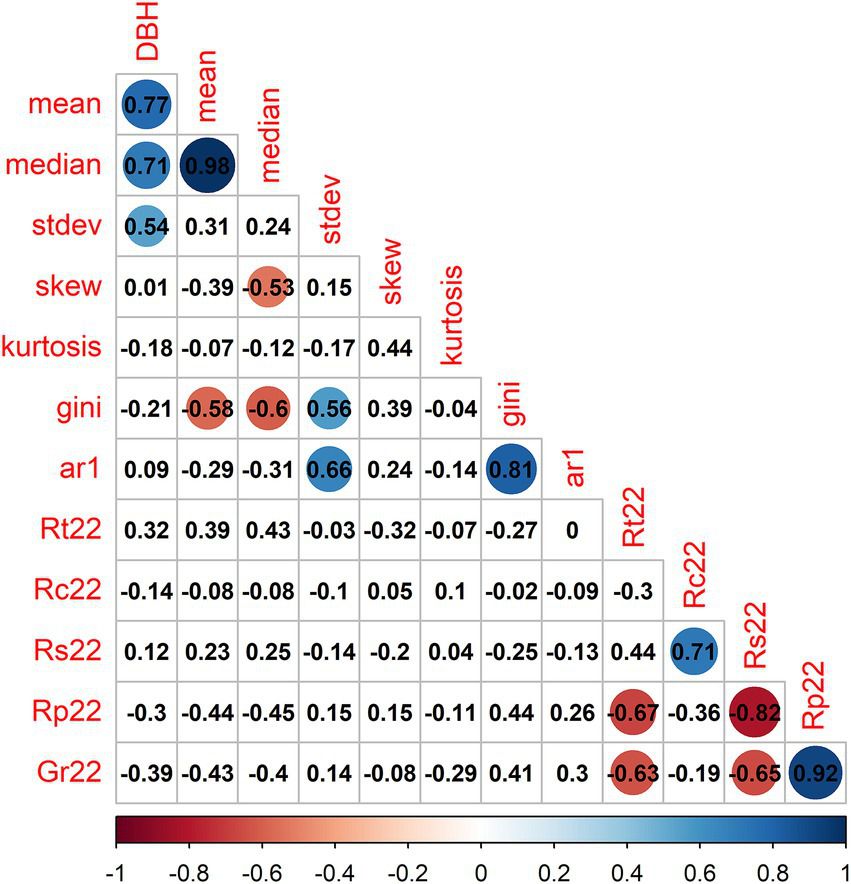
Correlation matrix relating diameter (DBH) and tree-ring statistics. Numbers show Pearson correlation coefficients classified according to the color scale. Variables’ abbreviations: DBH, diameter at breast height, stdev, standard deviation; skew, skewness; ar1, first-order autocorrelation; gini, Gini coefficient; Rt22, resistance; Rc22, recovery; Rs22, resilience; Rp22, recovery period; Gr22, relative growth reduction.
The Gini coefficient was negatively related with mean and median growth and positively with the standard deviation in mean growth rate and the Gini coefficient. The 2022 recovery (Rc) and resilience (Rs) indices were positively correlated between them. The 2022 recovery period (Rp) and the growth reduction (Gr) were also positively correlated, and negatively correlated with resistance (Rt) and resilience (Rs), indicating that larger growth reductions need more time to recover pre-drought radial increment.
We found that radial growth traits were related with leaf and wood traits (Supplementary Table S3). Particularly, tree diameter and the standard deviation in ring-width were negatively related to LMA. Similarly, the Dh was negatively related with mean ring-width, whereas the HV and the relative growth reduction (Gr22) presented a positive correlation. A negative correlation was found between Rs and LW.
3.2 Traits and resilience
Regarding functional traits, leaf area and LMA were negatively correlated, but LMA was positively correlated with the HV (Supplementary Figure S3). In contrast, the ILB was negatively correlated with LMA and the HV. We found that radial growth traits were related with leaf and wood traits (Supplementary Table S3). Particularly, tree diameter, mean ring-width and its standard deviation were negatively related to LMA. Similarly, the Dh and conductive area and the WD were negatively related with mean ring-width, and its standard deviation, whereas the HV and the relative growth reduction (Gr22) presented a negative correlation.
The resilience components varied between species, but they were rarely related to functional traits. Tree diameter was positively correlated with growth rates and their standard deviation (Figure 4). Interestingly, we found that the 2022 recovery (Rc) and resilience (Rs) indices were positively correlated between them. The 2022 recovery period (Rp) and the growth reduction (Gr) were also positively correlated indicating that larger growth reductions need more time to recover pre-drought radial increment.
3.3 Trait-climate-of-origin relationships
Tree diameter and growth rates showed positive correlations with BIO2, the mean diurnal range, but tree diameter was negative correlated with BIO12, BIO16 and BIO18, i.e., tree size increased with wetter conditions (Supplementary Table S4). However, resilience (Rs) decreased as climate conditions were wetter, but Rp and Gr increased. Resilience displayed the strongest negative correlation with the precipitation of the wettest quarter (BIO16) while Rp and Gr were positively related to this variable. Rc and Rs showed negative correlations with the minimum temperatures of the coldest month (BIO6). Regarding functional traits, LW, LMA and HV increased in response to temperate or mesic (e.g., higher BIO3) and wetter conditions (e.g., higher BIO13 and BIO16) (Supplementary Table S5), whereas LA and WD decreased. Additionally, LA increased in climates with wider thermal ranges and colder winters. Conductive area was negatively correlated with the mean diurnal range (BIO2) and Dh with the mean temperature of driest quarter (BIO9).
3.4 Resilience-climate-of-origin relationships
The minimum temperature of the coldest month (BIO6) was negatively correlated with the recovery (Rc) and resilience (Rs) indices (Table 3). The temperature annual range showed a negative association with the recovery period (Rp), and the mean temperatures of the wettest (BIO8) and coldest (BIO11) quarters showed negative correlations with Rs and Rc and Rs, respectively, In general, bioclimatic variables indicating wet conditions (e.g., BIO12, BIO13, BIO15, BIO16, BIO18) were negatively correlated with Rs, but positively with Rp and the growth reduction (Gr) The precipitation of the driest month (BIO14) showed negative associations with Rp and Gr.
Table 3
| Bioclimatic variable | Code | Rc | Rs | Rp | Gr |
|---|---|---|---|---|---|
| Min temperature of coldest month | BIO6 | −0.477* | −0.463* | – | – |
| Temperature annual range (BIO5–BIO6) | BIO7 | – | – | −0.460* | – |
| Mean temperature of wettest quarter | BIO8 | – | −0.478* | – | – |
| Mean temperature of coldest quarter | BIO11 | −0.444* | −0.444* | – | – |
| Annual precipitation | BIO12 | – | −0.505* | – | – |
| Precipitation of wettest month | BIO13 | – | −0.671*** | 0.616** | 0.576* |
| Precipitation of driest month | BIO14 | – | – | −0.463* | −0.462* |
| Precipitation seasonality (CV) | BIO15 | – | −0.597** | 0.621** | 0.573** |
| Precipitation of wettest quarter | BIO16 | – | −0.684*** | 0.622** | 0.580** |
| Precipitation of warmest quarter | BIO18 | – | −0.657** | 0.595** | 0.549* |
Significant (p < 0.05) correlations found between the 2022 resilience indices (Rc, Rs, Rp, and Gr) and selected bioclimatic variables.
Values are Pearson coefficients with asterisks showing significance levels: *p < 0.05, **p < 0.01, and ***p < 0.001.
The resilience index was correlated with the climate of origin, specifically precipitation (Figure 5). The results of the path analysis showed that the model including direct and indirect, through leaf weight (LW), effects of BIO16 on Rs was more parsimonious (lower AIC values; Table 4). According to the mode, the direct effect of BIO16 on Rs was significant, while the indirect effect through LW was not significant.
Figure 5
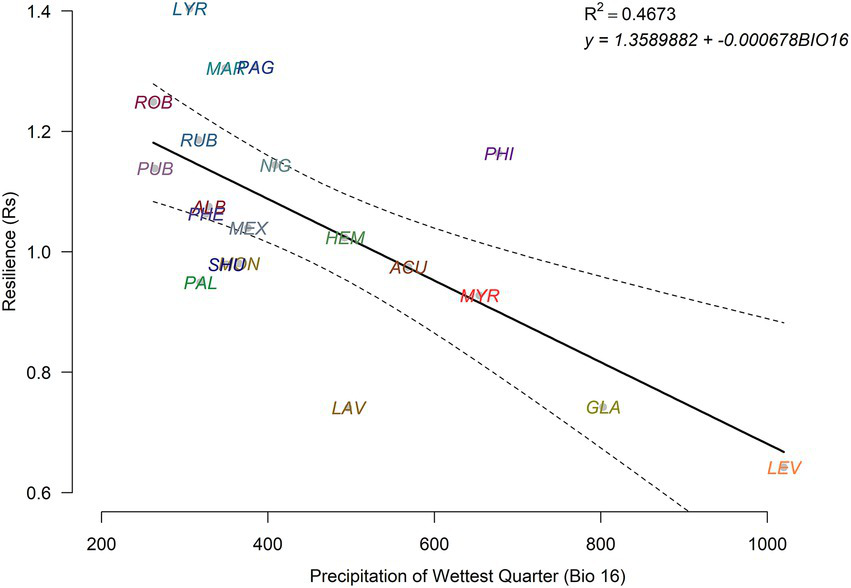
Negative relationship found between the precipitation of the wettest quarter and growth resilience in the study oak species. The dashed lines show the 95% confidence intervals of the linear regression.
Table 4
| Coefficient ± SE | Z-value | p value | |
|---|---|---|---|
| Path | |||
| Rs ~ LW | −0.491 ± 0.200 | −2.455 | 0.014 |
| LW ~ BIO16 | 0.514 ± 0.197 | 2.615 | 0.009 |
| Variance | |||
| Rs | 0.719 ± 0.233 | 3.082 | 0.002 |
| LW | 0.697 ± 0.226 | 3.082 | 0.002 |
| Model summary | AIC | R 2 Rs | R 2LW |
| 102.701 | 0.241 | 0.265 | |
| Path | |||
| Rs ~ LW | −0.191 ± 0.191 | −0.999 | 0.318 |
| Rs ~ BIO16 | −0.583 ± 0.191 | −3.056 | 0.002 |
| LW ~ BIO16 | 0.514 ± 0.197 | 2.615 | 0.009 |
| Variance | |||
| Rs | 0.482 ± 0.156 | 3.082 | 0.002 |
| LW | 0.697 ± 0.226 | 3.082 | 0.002 |
| Model summary | AIC | R 2 Rs | R 2LW |
| 97.114 | 0.491 | 0.265 | |
Results of the path analysis considering direct and indirect influences, through the effect of leaf weight (LW) and climate-of-origin (BIO16) on resilience (Rs).
For each path (effect) and variance the coefficient (and standard error), Z-value and associated probability (p) are shown. The Akaike Information Criterion (AIC) associated to each model and the coefficient of determination (R2) for each response variable are shown.
3.5 Resilience measured in the arboretum and the field
Considering the eight oak species sampled in Iturrarán and also in the field, we found that drought legacies previously reported for field oak populations were negatively related with Rs, but this relationship was not significant (r = −0.652; p = 0.08; Figure 6). That is, the species that were more resilient to drought in the studied arboretum presented lower drought legacies in the field.
Figure 6
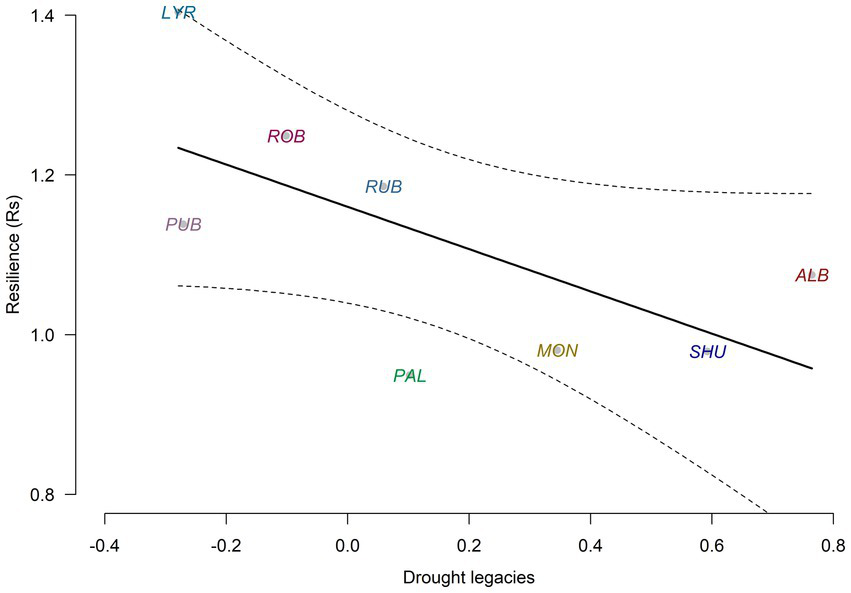
Negative relationship found between drought legacies and growth resilience in the eight oak species sampled in the arboretum and in the field (R2 = 0.43, p = 0.08). The dashed lines show the 95% confidence intervals of the linear regression.
4 Discussion
4.1 Resilience is related to climate of origin
The resilience of temperate oak species, growing under similar environmental conditions, in response to the unprecedented 2022 drought was related to the climate of origin, specifically the precipitation of the wettest quarter (BIO16; Figure 5). This inference is of correlational nature given that both traits and growth resilience depend on climate conditions and our approach does not allow disentangling these influences. Oak species from regions with drier conditions showed higher resilience and vice versa. Neither wood nor leaf traits showed significant correlations with growth resilience. A major novelty of our study is the use of retrospective growth data which allows framing the temporal context and impact of the 2022 drought in a common garden experiment.
4.2 How climate-of-origin influences traits and resilience
First, the cross-species correlation between resilience and BIO16 could be explained because traits associated with a conservative strategy and persistence under resource limitation increased with aridity, whereas traits associated with resource use increased in wet regions (Schwinning et al., 2022). An increase of tree size and leaf area with wetter origins and a decrease of WD and LMA have been already reported (Perez-Martinez et al., 2025). Second, a site-level mechanism of reduced recovery could be due to soil-water recharge. In Mediterranean climates, soils are mainly recharged by autumn–winter rainfall. After the 2022 drought, insufficient soil recharge may have limited growth recovery in the following spring differently impacting the study oak species. It is noteworthy that the climatic variables related to resilience did not correspond to climate variables enhancing growth in the study arboretum (Table 2), where wood production increased in response to cold winter and summer conditions, linked to reduced carbohydrate consumption and evapotranspiration rates, respectively, warm springs leading to an earlier and more rapid xylem resumption, and wet conditions in July–August (Table 1) enhancing latewood production (see García-González and Eckstein, 2003; Alla and Camarero, 2012).
The post-drought growth recovery could be mechanistically interpreted as an enhanced radial growth, which is linked to a higher HV, i.e., a greater production of conductive sapwood area relative to canopy leaf area, thus improving drought resilience (Rowland et al., 2023). This would explain why functional traits (e.g., LMA, hydraulic diameter) are related to radial growth rate (Supplementary Table S3). A dense wood is formed by xylem cells with thick walls and abundant fibers, which enhance mechanical support and resistance to embolism, thus providing drought tolerance (Chave et al., 2009; Hacke et al., 2001; Li et al., 2018) and reducing the drought-induced mortality risk (Anderegg et al., 2016). Moreover, the drought legacies were lower for more resilient oak species indicating that an improved recovery capacity lead to smaller carryover effects, which can be explained by a higher concentration of non-structural carbohydrates (NSC) used as source of osmolytes or as carbon sink for meristems (Anderegg et al., 2015). Future studies could relate resilience with the concentrations of NSCs in leaves, stem sapwood and roots (Wang and Wang, 2015).
4.3 Resilience indices measured in the arboretum and in the field differed
Growth resilience measured in the arboretum was negatively related to drought legacies measured in the field, as expected, but the relationship was not significant (Figure 6). This lack of significance may be explained by several reasons. First, we sampled a few individuals of each species growing under similar environmental conditions, whereas field studies are based on many individuals and populations occupying a wide range of environmental conditions (e.g., Anderegg et al., 2015; Bose et al., 2024; Gazol et al., 2018). Second, our analyses only considered a recent hot drought, whereas most studies dealt with several drought episodes of diverse intensity or timing differently impacting tree growth (Kannenberg et al., 2019). Third, the inconsistency between arboretum and field resilience data may be due to phylogeny. However, this was partly considered because most study species belong to the Lobatae and Quercus sections of the subgenus Quercus whose ancestors are inferred to have evolved at higher latitudes under short growing seasons (Hipp et al., 2018; Jiang et al., 2019).
5 Conclusion
To conclude, our findings show taxa from wetter origins are likely to be less resilient to severe hot droughts than those from drier origins (Figure 5). An implication of this result is that trees showed a low capacity to acclimate to the unprecedented 2022 drought because of the influence of climate of origin. We argue that a climate-matching perspective is needed to manage, preserve and restore temperate oak forests, making them more resilient to forecasted aridification by focusing on arid origins of widely distributed species. Another implication is the climate-dependent value of functional traits which should be further explored in combination with studies on phenotypic plasticity. To conclude, oak forest adaptive management requires considering not only drought frequency and intensity but also the climate of origin.
Statements
Data availability statement
The raw data supporting the conclusions of this article will be made available by the authors, without undue reservation.
Author contributions
JC: Conceptualization, Data curation, Formal analysis, Funding acquisition, Investigation, Methodology, Project administration, Resources, Software, Supervision, Validation, Visualization, Writing – original draft, Writing – review & editing. CV: Conceptualization, Data curation, Investigation, Methodology, Resources, Software, Writing – original draft, Writing – review & editing. AG: Conceptualization, Formal analysis, Investigation, Methodology, Project administration, Resources, Software, Supervision, Visualization, Writing – original draft, Writing – review & editing.
Funding
The author(s) declare that financial support was received for the research and/or publication of this article. This work was supported by projects PID2021-123675OB-C43, TED2021-129770B-C21 (Spanish Ministry of Science and Innovation) and “Study of silver fir dieback and growth” (Govt. Aragón). CV was supported by the Johannes Amos Comenius Programme (P JAC), project No. CZ.02.01.01/00/22_008/0004605, Natural and anthropogenic georisks.
Acknowledgments
We sincerely thank Francisco Garin for helping us to find and sample oaks in the Iturrarán arboretum and for his precious dedication to care those trees.
Conflict of interest
The authors declare that the research was conducted in the absence of any commercial or financial relationships that could be construed as a potential conflict of interest.
Generative AI statement
The authors declare that no Gen AI was used in the creation of this manuscript.
Any alternative text (alt text) provided alongside figures in this article has been generated by Frontiers with the support of artificial intelligence and reasonable efforts have been made to ensure accuracy, including review by the authors wherever possible. If you identify any issues, please contact us.
Publisher’s note
All claims expressed in this article are solely those of the authors and do not necessarily represent those of their affiliated organizations, or those of the publisher, the editors and the reviewers. Any product that may be evaluated in this article, or claim that may be made by its manufacturer, is not guaranteed or endorsed by the publisher.
Supplementary material
The Supplementary material for this article can be found online at: https://www.frontiersin.org/articles/10.3389/ffgc.2025.1730405/full#supplementary-material
References
1
Abatzoglou J. T. Dobrowski S. Z. Parks S. A. Hegewisch K. C. (2018). Terraclimate, a high-resolution global dataset of monthly climate and climatic water balance from 1958-2015. Sci Data5:170191. doi: 10.1038/sdata.2017.191,
2
Alla A. Q. Camarero J. J. (2012). Contrasting responses of radial growth and wood anatomy to climate in a Mediterranean ring-porous oak: implications for its future persistence or why the variance matters more than the mean. Eur. J. Forest Res.131, 1537–1550. doi: 10.1007/s10342-012-0621-x
3
Anderegg W. R. L. Klein T. Bartlett M. Sack L. Pellegrini A. F. A. Choat B. et al . (2016). Meta-analysis reveals that hydraulic traits explain cross-species patterns of drought-induced tree mortality across the globe. Proc. Natl. Acad. Sci. USA113, 5024–5029. doi: 10.1073/pnas.1525678113,
4
Anderegg W. R. L. Schwalm C. Biondi F. Camarero J. J. Koch G. Litvak M. et al . (2015). Pervasive drought legacies in forest ecosystems and their implications for carbon cycle models. Science349, 528–532. doi: 10.1126/science.aab1833,
5
Biondi F. Qeadan F. (2008). A theory-driven approach to tree-ring standardization: defining the biological trend from expected basal area increment. Tree-Ring Res.64, 81–96. doi: 10.3959/2008-6.1
6
Bose A. K. Doležal J. Scherrer D. Altman J. Ziche D. Martínez-Sancho E. et al . (2024). Revealing legacy effects of extreme droughts on tree growth of oaks across the northern hemisphere. Sci. Total Environ.926:172049. doi: 10.1016/j.scitotenv.2024.172049,
7
Breheny P. Burchett W. (2017). Visualization of regression models using visreg. R J.9, 56–71. doi: 10.32614/RJ-2017-046
8
Bunn A. G. (2008). A dendrochronology program library in R (dplR). Dendrochronologia26, 115–124. doi: 10.1016/j.dendro.2008.01.002
9
Bunn A. G. (2010). Statistical and visual crossdating in R using the dplR library. Dendrochronologia28, 251–258. doi: 10.1016/j.dendro.2009.12.001
10
Bunn A.G. Korpela M. Biondi F. Campelo F. Mérian P. Qeadan F. et al . (2025). dplR: dendrochronology program library in R. R package version 1.7.8. Available online at: https://CRAN.R-project.org/package=dplR (Accessed November 28, 2025).
11
Camarero J. J. Gazol A. Sangüesa-Barreda G. Oliva J. Vicente-Serrano S. M. (2015). To die or not to die: early-warning signals of dieback in response to a severe drought. J. Ecol.103, 44–57. doi: 10.1111/1365-2745.12295
12
Carlquist S. J. (1975). Ecological strategies of xylem evolution. Berkeley and Los Angeles, California: University of California Press.
13
Chave J. Coomes D. Jansen S. Lewis S. L. Swenson N. G. Zanne A. E. (2009). Towards a worldwide wood economics spectrum. Ecol. Lett.12, 351–366. doi: 10.1111/j.1461-0248.2009.01285.X,
14
Fajardo A. (2025). Standard and non-standard measurements of wood density: how big is the breach?Ann. Bot.136, 485–489. doi: 10.1093/aob/mcaf093,
15
Fick S. E. Hijmans R. J. (2017). Worldclim 2: new 1km spatial resolution climate surfaces for global land areas. Int. J. Climatol.37, 4302–4315. doi: 10.1002/joc.5086
16
Fontes C. G. Pinto-Ledezma J. Jacobsen A. L. Pratt R. B. Cavender-Bares J. (2022). Adaptive variation among oaks in wood anatomical properties is shaped by climate of origin and shows limited plasticity across environments. Funct. Ecol.36, 326–340. doi: 10.1111/1365-2435.13964
17
Forzieri G. Dakos V. McDowell N. G. (2022). Emerging signals of declining forest resilience under climate change. Nature608, 534–539. doi: 10.1038/s41586-022-04959-9,
18
Fritts H. C. (1976). Tree rings and climate. London: Academic Press.
19
García Saganta M. (2006). Caracterización de especies del género Quercus basada en el estudio comparativo de parámetros morfológicos e hidráulicos con aplicación ornamental. (Master Thesis). La Almunia de Doña Godina, Zaragoza, Spain: EUPLA-Univ. Zaragoza.
20
García-Cervigón A. I. Fajardo A. Caetano-Sánchez C. Camarero J. J. Olano J. M. (2020). Xylem anatomy needs to change, so that conductivity can stay the same: xylem adjustments across elevation and latitude in Nothofagus pumilio. Ann. Bot.125, 1101–1112. doi: 10.1093/aob/mcaa042,
21
García-González I. Eckstein D. (2003). Climatic signal of earlywood vessels of oak on a maritime site. Tree Physiol.23, 497–504. doi: 10.1093/treephys/23.7.497
22
Gazol A. Camarero J. J. (2022). Compound climate events increase tree drought mortality across European forests. Science of the Total Environment,816:151604. doi: 10.1016/j.scitotenv.2021.151604
23
Gazol A. Camarero J. J. Vicente-Serrano S. M. Sánchez-Salguero R. Gutiérrez E. de Luis M. et al . (2018). Forest resilience to drought varies across biomes. Glob. Change Biol.24, 2143–2158. doi: 10.1111/gcb.14082,
24
Gazol A. Pizarro M. Hammond W. H. Allen C. D. Camarero J. J. (2025). Droughts preceding tree mortality events have increased in duration and intensity, especially in dry biomes. Nature Comm.16:5779. doi: 10.1038/s41467-025-60856-5,
25
GBIF.org (2025). GBIF occurrence download. Available online at: doi:10.15468/dl.4s6r2q. (Accessed November 28, 2025).
26
Gharun M. Shekhar A. Xiao J. Li X. Buchmann N. (2024). Effect of the 2022 summer drought across forest types in Europe. Biogeosciences21, 5481–5494. doi: 10.5194/bg-21-5481-2024
27
Gleason S. M. Butler D. W. Ziemińska K. Waryszak P. Westoby M. (2012). Stem xylem conductivity is key to plant water balance across Australian angiosperm species. Funct. Ecol.26, 343–352. doi: 10.1111/j.1365-2435.2012.01962.x
28
Hacke U. G. Sperry J. S. Pockman W. T. Davis S. D. McCulloh K. A. (2001). Trends in wood density and structure are linked to prevention of xylem implosion by negative pressure. Oecologia126, 457–461. doi: 10.1007/s004420100628
29
Hietz P. Rungwattana K. Scheffknecht S. George J.-P. (2022). Effects of provenance, growing site, and growth on Quercus robur wood anatomy and density in a 12-year-old provenance trial. Front. Plant Sci.13:795941. doi: 10.3389/fpls.2022.795941,
30
Hijmans R. (2024). raster: Geographic Data Analysis and Modeling_. R package version 3.6–30. Available online at: https://CRAN.R-project.org/package=raster (Accessed November 28, 2025).
31
Hijmans R.J. Barbosa M. Ghosh A. Mandel A. (2024). Geodata: download geographic data_. R package version 0.6–2, https://CRAN.R-project.org/package=geodata (Accessed November 28, 2025).
32
Hijmans R. J. Cameron S. E. Parra J. L. Jones P. G. Jarvis A. (2005). Very high resolution interpolated climate surfaces for global land areas. Int. J. Climatol.25, 1965–1978. doi: 10.1002/joc.1276
33
Hipp A. L. Manos P. S. González-Rodríguez A. Hahn M. Kaproth M. McVay J. D. et al . (2018). Sympatric parallel diversification of major oak clades in the Americas and the origins of Mexican species diversity. New Phytol.217, 439–452. doi: 10.1111/nph.14773,
34
Holmes R. L. (1983). Program COFECHA user’s manual. Tucson, USA: Laboratory of Tree–Ring Research, The University of Arizona.
35
Jiang X. L. Hipp A. L. Deng M. Su T. Zhou Z.-K. Yan M.-X. (2019). East Asian origins of European holly oaks (Quercus section Ilex Loudon) via the Tibet-Himalaya. J. Biogeogr.46, 2203–2214. doi: 10.1111/jbi.13654
36
Kannenberg S. A. Maxwell J. T. Pederson N. D’Orangeville L. Ficklin D. L. Phillips R. P. (2019). Drought legacies are dependent on water table depth, wood anatomy and drought timing across the eastern US. Ecol. Lett.22, 119–127. doi: 10.1111/ele.13173
37
Kunstler G. (2014). BIOMEplot: Plot the Whittaker biomes_. R package version 0.1, commit 3edd582d7985a7330c411201289dc1076afb845b. Available online at: https://github.com/kunstler/BIOMEplot (Accessed November 28, 2025).
38
Larsson L. A. Larsson P. O. (2022). CDendro and CooRecorder (v. 9.8.1). Saltsjöbaden, Sweden: Cybis Elektronik and Data AB.
39
Legendre P. Legendre L. (2012). Numerical ecology. Amsterdam: Elsevier.
40
Li X. Blackman C. J. Choat B. Duursma R. A. Rymer P. D. Medlyn B. E. et al . (2018). Tree hydraulic traits are coordinated and strongly linked to climate-of-origin across a rainfall gradient: hydraulic traits coordination and link to climate. Plant Cell Environ.41, 646–660. doi: 10.1111/pce.13129,
41
Lloret F. Keeling E. G. Sala A. (2011). Components of tree resilience: effects of successive low-growth episodes in old ponderosa pine forests. Oikos120, 1909–1920. doi: 10.1111/j.1600-0706.2011.19372.x
42
Martín-Sánchez R. Sancho-Knapik D. Alonso-Forn D. López-Ballesteros A. Ferrio J. P. Hipp A. L. et al . (2024a). Oak leaf morphology may be more strongly shaped by climate than by phylogeny. Ann. For. Sci.81:14. doi: 10.1186/s13595-024-01232-z
43
Martín-Sánchez R. Sancho-Knapik D. Alonso-Forn D. López-Ballesteros A. Ferrio J. P. Hipp A. L. et al . (2024b). Oak morphology dataset from Iturrarán botanical garden and supplementary files. Zenodo. V2. doi: 10.5281/zenodo.10633924
44
Mukherjee S. Mishra A. K. (2021). Increase in compound drought and heatwaves in a warming world. Geophys. Res. Lett.48:e2020GL090617. doi: 10.1029/2020GL090617
45
Oksanen J. Simpson G. Blanchet F. Kindt R. Legendre P. (2025). vegan: Community ecology package. R package version 2.7–1. Available online at: https://CRAN.R-project.org/package=vegan (Accessed November 28, 2025).
46
Pan T. Britton T. G. Schrader J. Sumner E. Nicolle D. Choat B. et al . (2025). Adaptation in wood anatomical traits to temperature and precipitation-a common garden study. Plant Cell Environ.48, 6016–6031. doi: 10.1111/pce.15576,
47
Perez-Martinez L. V. Medlyn B. E. Nicolle D. Colin A.-C. Choat B. Tissue D. T. et al . (2025). Drought sensitivity is climate-adapted and consistently influenced by wood density and maximum height in eucalypts. Funct. Ecol.1–20. doi: 10.1111/1365-2435.70144
48
Pfautsch S. Harbusch M. Wesolowski A. Smith R. Macfarlane C. Tjoelker M. G. et al . (2016). Climate determines vascular traits in the ecologically diverse genus eucalyptus. Ecol. Lett.19, 240–248. doi: 10.1111/ele.12559,
49
R Core Team (2025). R: a language and environment for statistical computing, ver. 4.5.0. Vienna, Austria: R Foundation for Statistical Computing.
50
Ramírez-Valiente J. A. López R. Hipp A. L. Aranda I. (2020). Correlated evolution of morphology, gas exchange, growth rates and hydraulics as a response to precipitation and temperature regimes in oaks (Quercus). New Phytol.227, 794–809. doi: 10.1111/nph.16320,
51
Ramírez-Valiente J. A. Santos del Blanco L. Alía R. Robledo-Arnuncio J. J. Climent J. (2022). Adaptation of Mediterranean forest species to climate: lessons from common garden experiments. J. Ecol.110, 1022–1042. doi: 10.1111/1365-2745.13730
52
Reich P. B. (2014). The world-wide ‘fast–slow’ plant economics spectrum: a traits manifesto. J. Ecol.102, 275–301. doi: 10.1111/1365-2745.12211
53
Reichstein M. Bahn M. Ciais P. Frank D. Mahecha M. D. Seneviratne S. I. et al . (2013). Climate extremes and the carbon cycle. Nature, 500, 287–295. doi: 10.1038/nature12350
54
Rosseel Y. (2012). Lavaan: an R package for structural equation modeling. J. Stat. Softw.48, 1–36. doi: 10.18637/jss.v048.i02
55
Rowland L. Ramírez-Valiente J.-A. Hartley I. P. Mencuccini M. (2023). How woody plants adjust above- and below-ground traits in response to sustained drought. New Phytol.239, 1173–1189. doi: 10.1111/nph.19000,
56
Sancho-Knapik D. Escudero A. Mediavilla S. Scoffoni C. Zailaa J. Cavender-Bares J. et al . (2021). Deciduous and evergreen oaks show contrasting adaptive responses in leaf mass per area across environments. New Phytol.230, 521–534. doi: 10.1111/nph.17151,
57
Savage J. A. Kiecker T. McMann N. Park D. Rothendler M. Mosher K. (2022). Leaf out time correlates with wood anatomy across large geographic scales and within local communities. New Phytol.235, 953–964. doi: 10.1111/nph.18041,
58
Schindelin J. Arganda-Carreras I. Frise E. Kaynig V. Longair M. Pietzsch T. et al . (2012). Fiji: an open-source platform for biological-image analysis. Nat. Methods9, 676–682. doi: 10.1038/nmeth.2019,
59
Scholz A. Klepsch M. Karimi Z. Jansen S. (2013). How to quantify conduits in wood?Front. Plant Sci.4:56. doi: 10.3389/fpls.2013.00056,
60
Schwarz J. Skiadaresis G. Kohler M. Kunz J. Schnabel F. Vitali V. et al . (2020). Quantifying growth responses of trees to drought — a critique of commonly used resilience indices and recommendations for future studies. Curr. Forestry Rep.6, 185–200. doi: 10.1007/s40725-020-00119-2
61
Schwinning S. Lortie C. J. Esque T. C. DeFalco L. A. (2022). What common-garden experiments tell us about climate responses in plants. J. Ecol.110, 986–996. doi: 10.1111/1365-2745.
62
Serra-Maluquer X. Gazol A. Anderergg W. R. L. Martínez-Vilalta J. Mencuccini M. Camarero J. J. (2022). Wood density and hydraulic traits influence species' growth response to drought across biomes. Glob. Change Biol.28, 3871–3882. doi: 10.1111/gcb.16123
63
Serrano-Notivoli R. Tejedor E. Sarricolea P. Meseguer-Ruiz O. de Luis M. Saz M. Á. et al . (2023). Unprecedented warmth: a look at Spain’s exceptional summer of 2022. Atmos. Res.293:106931. doi: 10.1016/j.atmosres.2023.106931
64
Sisó S. Camarero J. J. Gil-Pelegrín E. (2001). Relationship between hydraulic resistance and leaf morphology in broadleaf Quercus species: a new interpretation of leaf lobulation. Trees Struct. Funct.15, 341–345. doi: 10.1007/s004680100110
65
Thurm E. A. Uhl E. Pretzsch H. (2016). Mixture reduces climate sensitivity of Douglas-fir stem growth. For. Ecol. Manag.376, 205–220. doi: 10.1016/j.foreco.2016.06.020
66
Tripathy K. P. Mishra A. K. (2023). How unusual is the 2022 European compound drought and heatwave event?Geophys. Res. Lett.50:e2023GL105453. doi: 10.1029/2023GL105453
67
van der Maaten-Theunissen M. Maaten E. Bouriaud O. (2015). Pointres: an R package to analyze pointer years and components of resilience. Dendrochronologia35, 34–38. doi: 10.1016/j.dendro.2015.05.006
68
van der Maaten-Theunissen M. Trouillier M. Schwarz J. Skiadaresis G. Thurm E. van der Maaten E. (2021). Pointres 2.0: new functions to describe tree resilience. Dendrochronologia70:125899. doi: 10.1016/j.dendro.2021.125899
69
Vicente-Serrano S. M. Beguería S. López-Moreno J. I. (2010). A multi-scalar drought index sensitive to global warming: the standardized precipitation evapotranspiration index - SPEI. J. Clim.23, 1696–1718. doi: 10.1175/2009JCLI2909.1
70
Vicente-Serrano S. M. Tomas-Burguera M. Beguería S. Reig F. Latorre B. Peña-Gallardo M. et al . (2017). A high resolution dataset of drought indices for Spain. Data2:22. doi: 10.3390/data2030022
71
Vicente-Serrano S. M. Van der Schrier G. Beguería S. Azorin-Molina C. Lopez-Moreno J. I. (2015). Contribution of precipitation and reference evapotranspiration to drought indices under different climates. J. Hydrol.526, 42–54. doi: 10.1016/j.jhydrol.2014.11.025,
72
Wang Z. Wang C. (2015). Dynamics of nonstructural carbohydrates during drought and subsequent recovery: a global meta-analysis. Agric. For. Meteorol.363:110429. doi: 10.1016/j.agrformet.2025.110429
73
Wei T. Simko V. (2024). R package 'corrplot': visualization of a correlation matrix (Version 0.95). Available online at: https://github.com/taiyun/corrplot (Accessed November 28, 2025).
74
Yang X. Yan H. Hao C. Hu J. Yang G. An S. et al . (2024). Climate of origin shapes variations in wood anatomical properties of 17 Picea species. BMC Plant Biol.24:414. doi: 10.1186/s12870-024-05103-7,
75
Zscheischler J. Westra S. van den Hurk B. J. J. M. Seneviratne S. I. Ward P. J. Pitman A. et al . (2018). Future climate risk from compound events. Nat. Clim. Chang.8, 469–477. doi: 10.1038/s41558-018-0156-3
Summary
Keywords
arboretum, drought, growth resilience, Quercus , functional traits
Citation
Camarero JJ, Valeriano C and Gazol A (2025) The impact of an unprecedented hotter drought on oak growth was related to climate of origin. Front. For. Glob. Change 8:1730405. doi: 10.3389/ffgc.2025.1730405
Received
22 October 2025
Revised
24 November 2025
Accepted
24 November 2025
Published
09 December 2025
Volume
8 - 2025
Edited by
Constanca Camilo-Alves, University of Évora, Portugal
Reviewed by
Augusta Costa, National Institute for Agricultural and Veterinary Research (INIAV), Portugal
Pengcheng Lv, Henan Agricultural University, China
Updates
Copyright
© 2025 Camarero, Valeriano and Gazol.
This is an open-access article distributed under the terms of the Creative Commons Attribution License (CC BY). The use, distribution or reproduction in other forums is permitted, provided the original author(s) and the copyright owner(s) are credited and that the original publication in this journal is cited, in accordance with accepted academic practice. No use, distribution or reproduction is permitted which does not comply with these terms.
*Correspondence: J. Julio Camarero, jjcamarero@ipe.csic.es
Disclaimer
All claims expressed in this article are solely those of the authors and do not necessarily represent those of their affiliated organizations, or those of the publisher, the editors and the reviewers. Any product that may be evaluated in this article or claim that may be made by its manufacturer is not guaranteed or endorsed by the publisher.