 Mayank Gupta
 Amy Reinert
 C. O. West2
 Rose Province-Azalde
- 1Neuroscience Research Center, LLC, Overland Park, KS, United States
- 2Nevro Corporation, Redwood City, CA, United States
Background: Pulse dosing of high frequency spinal cord stimulation at 10 kHz (10 kHz SCS) may offer comparable clinical benefits as continuous 10 kHz SCS, but extreme pulse dosing (EPD) has not been studied.
Methods: Patients using an implantable pulse generator (IPG) with 10 kHz SCS to treat chronic back or leg pain were enrolled. After baseline assessments, patients underwent “EPD titration” starting at an EPD setting of 3%. Patients who preferred the EPD tried progressively lower EPD settings (0.6%, 0.3%, 0.14%, 0.06%), each for 7–10 days, until reaching an EPD they did not prefer over that previously tried. Patients were then followed up for 3 months at their lowest preferred EPD. All study visits included assessment of adverse events and patient-reported outcomes, including the numeric rating score (NRS) for pain intensity, Patient Global Impression of Change (PGIC), Oswestry Disability Index (ODI), and the PROMIS-SF for sleep disturbance. Device charging information was uploaded from the IPG at each visit.
Results: Eighteen patients completed testing (13 M/5 F; mean age, 61 years); 14 patients (78%) reporting a preferred EPD (at any setting) to standard 10 kHz SCS. Among 18 patients, the most common lowest preferred EPD was 0.14% (28%), followed by 0.06% (22%) and 3% (17%). All post-SCS pain scores were lower than pre-SCS pain scores (median NRS, 8.5 vs. 3.0; p = .004). For overall pain, NRS values did not vary significantly across timepoints after the pre-SCS period (median range, 3.0–4.0; p > .05). Similarly, patient satisfaction, PGIC, ODI, PCS, and PROMIS-SF scores for EPD did not vary significantly from those at baseline. Daily IPG recharge times were significantly shorter using the patient's lowest preferred EPD than at baseline (median minutes, 3.0 vs. 31.8; p = .0001).
Conclusions: EPD 10 kHz SCS may offer the same pain relief and quality-of-life benefits as standard 10 kHz SCS, while reducing recharge requirements and potentially lowering the risk of therapy habituation.
1 Introduction
Chronic lower back pain affects about 10% of adults in the United States and over 8% of adults globally (1). This condition is often not amenable to standard therapies, including analgesic treatments or back surgery, contributing to the complexity of its management as well as high care costs, estimated to total about 40 billion dollars annually in the United States (1, 2). As an effective, non-pharmacological treatment for pain, high frequency spinal cord stimulation at 10 kHz (10 kHz SCS) provides an alternative approach for the management of chronic back pain. Evidence from randomized clinical trials of patients with chronic back pain indicate that, compared with paresthesia-based low frequency SCS, 10 kHz SCS provides significantly more pain relief and improvement in quality-of-life, with effects durable up to 24 months (3–5). Indeed, evidence suggests that neurons involved in inhibiting chronic pain (dorsal horn GABAergic neurons) may be selectively driven by 10 kHz SCS but not by SCS of lower frequencies (6).
Notably, all SCS therapies, whether low frequency or 10 kHz SCS, are usually programmed to deliver continuous stimulation. While continuously-delivered 10 kHz SCS may require more device recharging than lower frequency SCS systems, patients have reported similar or better satisfaction with their device charging experience using the 10 kHz SCS system (7). Nevertheless, the greater demand for energy with continuous 10 kHz SCS could affect the convenience to patients provided by rechargeable implantable pulse generators (IPGs), a device introduced in the early 2000s that eliminates the need for frequent re-implantation or wearable external power sources (8). Furthermore, it has been hypothesized that continuous activation of neurons may promote central nervous system adaptation over time, leading to reduced therapeutic efficacy in some patients (9).
In this context, interest has grown in the idea of pulse dosing (PD) to deliver 10 kHz SCS at regular intervals, reducing device recharge times and potentially extending the long-term durability of pain control (10). However, few studies have evaluated this issue and data remain sparse regarding the lowest interval duration needed for PD to remain effective in reducing chronic lower back pain. To help address this knowledge gap, we evaluated the effect of extreme pulse dosing (EPD) with 10 kHz SCS on patient outcomes, using PD settings up to 50 times lower than the smallest studied PD values.
2 Methods
2.1 Study design
This study was a prospective case series of patients being treated for chronic back or leg pain with 10 kHz SCS delivered via the SENZA SCS IPG (the SENZA SCS IPG is fully-implantable, electrical pulse generator consisting of a rechargeable battery and electronics which are hermetically sealed within a titanium can; the IPG is fully programmable via two-way transcutaneous radiofrequency telemetry; to deliver stimulation, the IPG is connected to two thin catheter-type “leads” each containing eight platinum-iridium electrode contacts, which are positioned in the dorsal epidural space over the low thoracic spinal segment to deliver the electrical stimulation to the spinal cord; the IPG itself is implanted in the upper buttock region). Investigational review board approval was obtained prior to subject enrollment (WCG Investigational Review Board Study Number: 1309273, 5/26/2021) and all subjects provided informed consent. The study was conducted in accordance with local clinical research and data protection regulations, good clinical practice guidelines (ISO14155), and the Declaration of Helsinki. Due to an administrative oversight prior to enrollment, this study was retrospectively registered on clinicaltrials.gov on March 26, 2025 (NCT06897280); post hoc study registration is not believed to affect study execution or results, since the study is a post-market evaluation of commercially-available program settings and all subjects were enrolled from a single study center.
After completing eligibility screening, enrolled patients underwent a baseline assessment (Visit 1) before entering the study's EPD titration phase involving successive 7-to-10 day assessment periods of progressively lower PD settings (Visits 2–6; Figure 1). All PD settings used stimulation at a frequency of 10 kHz but varied regarding the duration of delivered electrical stimulation (i.e., SCS is “On”; Figure 2). PD settings were programmed into the patients' IPG at clinic-based EPD titration visits. For the first EPD titration assessment the IPG was set at a 3% PD setting, implemented as 20 s on and 10 min off. After 7–10 days, patients who reported not finding the 3% PD setting to be as good as or preferable to the baseline 10 kHz SCS exited the study. All other patients proceeded to a 7-to-10-day assessment of the next lowest dose (0.6% PD). This process continued through progressively lower PD settings (0.3%, 0.14%, 0.06%), until the patient reached a PD setting they did not prefer or find as good as the previous PD setting. After reaching their lowest preferred PD setting, patients entered a 3-month observation period. At the end of the observation period, patients returned to the clinic for their final visit (Visit 7).
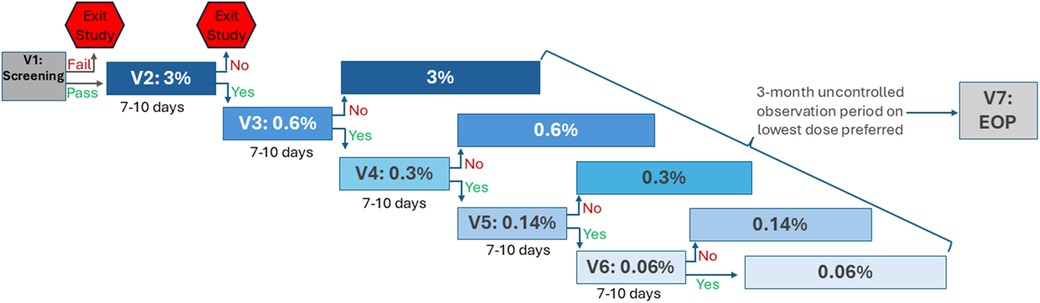
Figure 1. Study design. EOP, end of observation period; PD, pulse dosing; V, visit. Patients who passed eligibility screening (V1) entered the EPD titration phase (V2–V6), in which progressively lower PD settings were assessed sequentially, each for 7–10 days. At V2, PD was set to 3%; patients who did not find equivalent or prefer 3% PD to the baseline setting exited the study. All other patients progressed through 7-to-10-day assessments of lower PD settings (0.6%, 0.3%, 0.14%, 0.06%) until reaching a PD they did not find equivalent or prefer over the previous setting. After the EPD titration phase, patients entered a 3-month observation period on their lowest preferred PD setting. Patients completed the final study visit, V7, at the end of the observation period (EOP).
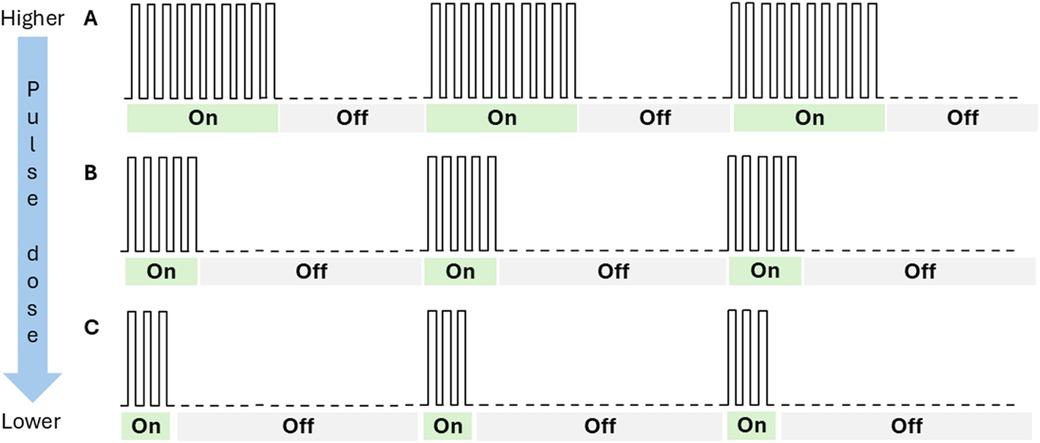
Figure 2. Depiction of pulse dosing settings. This figure is a conceptual drawing and not a representation of actual pulse dose settings. “On” represents periods of electrical stimulation; “Off” represents periods of no stimulation. At higher pulse dose settings, patients receive longer durations of electrical stimulation than at lower pulse dose settings. The duration of “On” and “Off” periods is independent of the frequency or amplitude of the stimulation. In the current study, the “On” periods were delivered at a frequency of 10 kHz. In the figure, panel A would represent a 50% pulse dose setting, while panel B would represent a 25% pulse dose setting, and panel C would represent a 16% pulse dose setting.
2.2 Patient population
Patient enrollment was conducted from September 2021 through November 2023 at a single clinical site in the United States. Patients receiving 10 kHz SCS treatment for chronic back or leg pain were invited by site staff to participate in the study. Interested patients were screened for eligibility using the following criteria: chronic intractable back pain or leg pain of neuropathic origin, as determined by the physician; has a permanent implant of the 10 kHz SENZA IPG System, implanted at least 3 months before baseline; 18 years of age or older; and willing and capable of giving informed consent. Patients who passed eligibility screening were enrolled in the study.
2.3 Outcome measures
The primary outcome assessed in this study was the response rate, defined as the proportion of patients reporting that EPD at any PD setting (i.e., 3%, 0.6%, 0.3%, 0.14%, or 0.06%) was as good as or preferable to their baseline 10 kHz SCS treatment. To further understand the response rate, the distribution of patients' lowest preferred PD setting was also evaluated. In addition, several patient reported outcomes (PROs) were evaluated at the following four time points: pre-SCS therapy, baseline, after the EPD titration assessment period of the patient's lowest preferred dose setting, and at the end of the 3-month observation period (End of OP). Pain intensity was measured using the numerical rating scale (NRS), a visual analogue scale in which 0 indicates no pain and 10 indicates the worst pain imaginable. The pre-SCS NRS score was obtained from the pre-surgical assessment conducted before the patient's 10 kHz SCS implant (i.e., before entering the study). During study follow-up, NRS scores were obtained by averaging the daily values recorded in patient diaries, completed at home during the 7 days before the study visit.
Other PROs were measured at all study visits but not assessed for the pre-SCS therapy period. PROs included responses to questions on patient satisfaction and the Patient Global Impression of Change (PGIC) assessment. The PGIC is a single, self-administered question in which patients used a 7-point scale to evaluate the change in their condition compared with the level at the baseline visit. PGIC responses range from “much worse” to “much improved”. Patients also completed questionnaires for the Oswestry Disability Index (ODI), a 10-item index used worldwide to assess functional disability associated with back pain.10 Total scores for the ODI range from 0 (minimal disability) to 100 (severe disability; e.g., bedridden). To evaluate the frequency of emotional and cognitive responses to pain, patients were administered the Pain Catastrophizing Scale (PCS), a 13-item index widely used in research, including clinical trials, to assess the impact of back pain on patient's well-being (11–14). For each PCS item, responses range from 0 (“not at all”) to 4 (“all the time”), leading to a total score range of 0–52. Self-reported sleep disturbance was assessed using the PROMIS Sleep Disturbance short form (PROMIS-SF 8a), an 8-item survey regarding sleep quality, sleep depth, and sleep-associated restoration with a score range of 0–40 (15). Patients were also administered the Brief Pain Inventory (BPI) short form, a 9-item questionnaire validated for pain assessment in patients with lower back pain (16). The BPI comprises items that assess pain intensity, use of pain treatments, and pain interference with daily life activities and has a total score ranging from 0 to 10. In addition to PROs, the study evaluated IPG charging duration by downloading data directly from the IPG during study visits.
2.4 Statistical analysis
Study data were descriptively analyzed to assess frequencies and distributions of patient outcomes. Continuous variables were summarized using medians, ranges, means, and standard deviations. Categorical variables were summarized using frequency distributions. Shapiro–Wilk tests were used to assess the normality of data distributions, which determined the choice of parametric (normal) or non-parametric analyses (non-normal). In particular, to compare patient outcomes across time periods repeated measures (RM) ANOVA tests were used for normally distributed data, and Friedman/Friedman-Nemenyi-Q tests were used for non-normally distributed data.
3 Results
3.1 Patient characteristics
A total of 22 patients were screened for study eligibility, among whom 2 were excluded, 1 for having a co-existing implantable device and the other for having had an interventional procedure to treat their back/leg pain within the preceding 30 days (Table 1). Thus, the study enrolled 20 patients. Of these, two subjects withdrew consent prior to study completion, yielding 18 patients completing the study. These 18 patients consisted of 13 men and 5 women, with ages ranging from 37 to 76 years old (mean age, 61 years). Most enrolled patients were White (n = 16). The most common pain indication among enrolled patients was failed back surgery syndrome with lumbar radiculopathy (n = 11), followed by lumbar radiculopathy (n = 4). Eight patients presented with a Baseline program that used PD, ranging from 14% to 67%. There was no significant correlation between Baseline PD and chosen EPD (p = 0.75). Review of study log files indicated that subjects had Baseline and EPD titration stimulation delivered continuously for over 95% of the duration of each titration evaluation period.
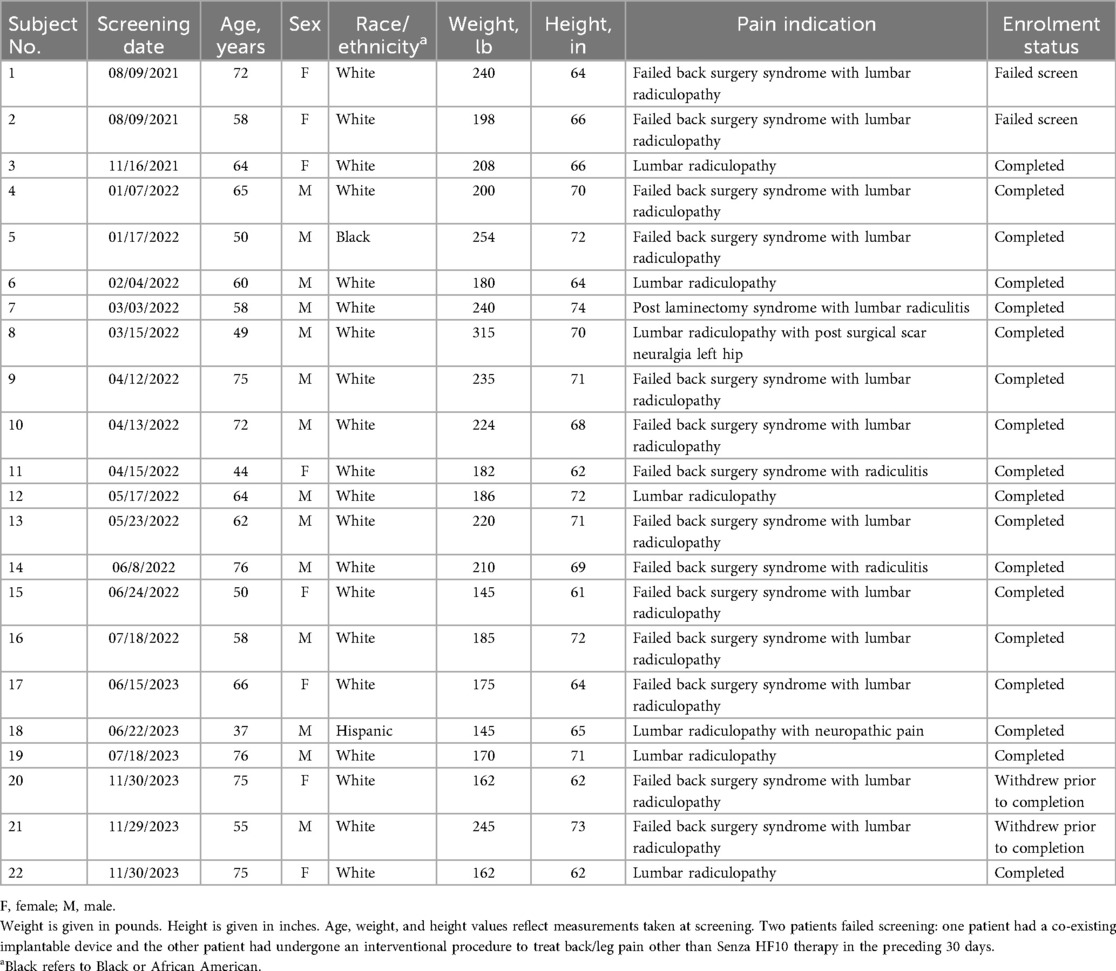
Table 1. Characteristics of screened patients.
3.2 Extreme pulse dosing response rate
Fourteen of 18 patients reported that EPD was as good as or preferable to their baseline 10 kHz SCS treatment, yielding an EPD responder rate of 78% (Figure 3). This response rate was significantly higher than predicted from previous clinical studies (p = 0.04; Fisher's Exact Test). The most common lowest preferred PD was 0.14% (n = 5; 28%), followed by 0.06% (n = 4; 22%) and 3% (n = 3; 17%). One patient selected a PD of 0.6% and 1 patient selected a PD of 0.3%.
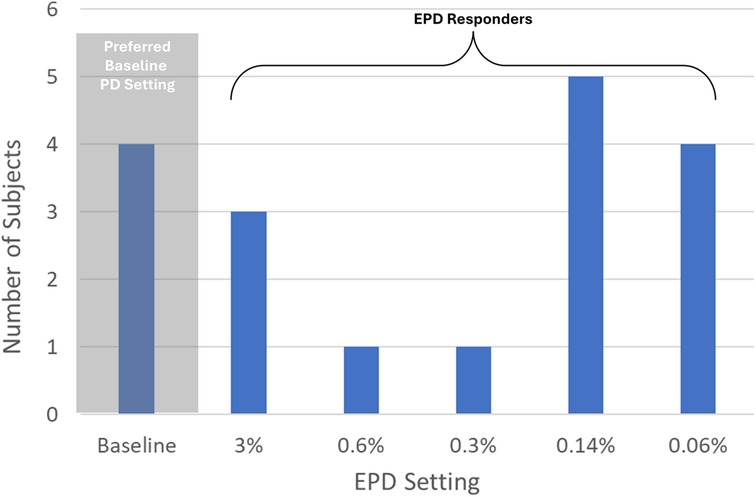
Figure 3. Distribution of lowest preferred pulse dose setting in 18 patients. PD, pulse dose; EPD, extreme pulse dose; Responders, subjects who preferred EPD settings ≤3% PD. This figure shows the preferred PD setting (determined during the EPD titration phase) for each subject who completed the study.
3.3 Pain intensity
Regarding overall pain, the patient NRS values fell significantly from the pre-SCS period (median, 8.5) compared with the other study periods, including baseline (median, 3.0), during the EPD titration assessment of the lowest preferred PD setting (median, 2.5), and the End of OP (Friedman's Test: median, 4.0; p < .004; Figure 4A). For overall pain, NRS values did not vary significantly across timepoints after the pre-SCS period through the End of OP (Friedman-Nemenyi-Q Test: median range, 2.5–4.0; p > .05). Regarding back pain, patient NRS values were not significantly higher during the EPD titration assessment of the lowest preferred PD setting (median, 3.0) than at the End of OP (Wilcoxon signed ranks: median, 2.0; p = .824; Figure 4B). For leg pain, the patient NRS values did vary significantly between the EPD titration assessment of the lowest preferred PD setting and the End of OP (Wilcoxon signed ranks: median values, 1.3 vs. 2.8; p = .002; Figure 4C).
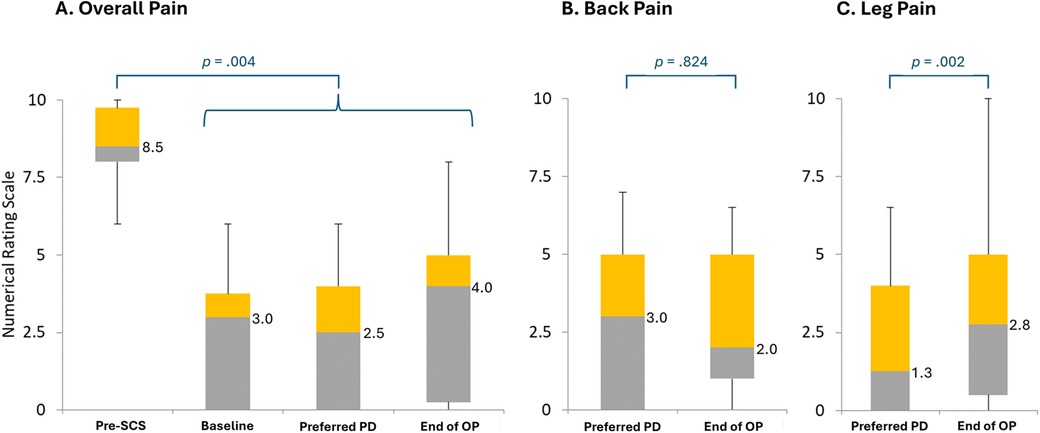
Figure 4. Pain intensity without treatment, at baseline, during an assessment period of the lowest preferred pulse dosing, and at follow-up. End of OP, end of 3-month observation period; PD, pulse dosing; SCS, 10 kHz spinal cord stimulation. (A) Overall pain intensity. (B) Back pain intensity. (C) Leg pain intensity. Preferred PD refers to the EPD titration assessment of the patient's lowest preferred pulse dose setting. Bars represent the distribution of patient scores on the numerical rating scale. Gray bars represent the range from the lowest quartile to the median; orange bars, from the median to the third quartile. Numbers to the right of the bars represent median values. Figure based on diary data collected in all who completed Visit 3 (n = 14).
3.4 Other patient-reported outcomes
Most patients reported being satisfied or very satisfied after the EPD titration assessment of their lowest preferred PD setting (11 of 14; 79%) and no patients were dissatisfied with EPD 10 kHz SCS therapy (Figure 5A). Similarly, at End of OP, 12 of 14 patients (86%) were satisfied or very satisfied, and none were dissatisfied. Patient satisfaction did not differ significantly after the EPD titration assessment of their initial lowest preferred PD compared with End of OP (Friedman-Nemenyi-Q Test: p > .67). PGIC responses regarding changes in pain compared with baseline were also similar across time periods, with most patients reporting no change or an improvement after the EPD titration assessment of their initial lowest preferred PD setting (13 of 14; 93%) and at End of OP (12 of 14; 92%; PGIC at lowest preferred PD vs. PGIC at End of OP: Wilcoxon signed ranks: p = .83; Figure 5B).
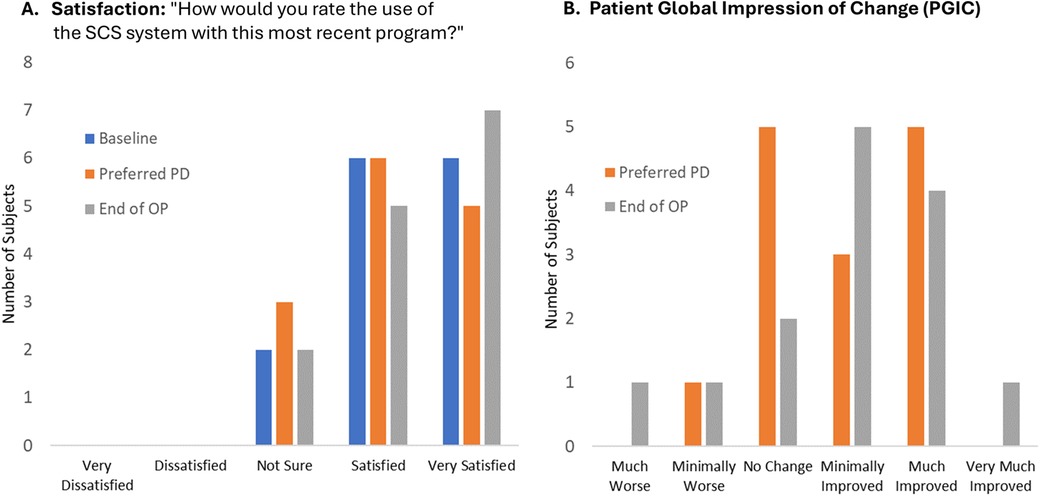
Figure 5. Patient satisfaction and global impression of change. End of OP, end of 3-month observation period; PD, pulse dosing; PGIC, patient global impression of change; SCS, 10 kHz spinal cord stimulation. (A) Patient satisfaction with SCS system using most recent program. (B) Patient global impression of change from Baseline using most recent program. Lowest PD refers to the EPD titration assessment of the patient's lowest preferred dose setting. Figure data reflect self-reported values recorded in patient diaries at the end of each period.
As shown in Figure 6, other PROs also remained similar throughout patient follow-up. Mean scores for the ODI, a measure of disability, did not differ significantly across assessments taken at baseline (23.7 ± 17.2), after the EPD titration assessment of the patient's lowest preferred PD setting (24.5 ± 17.2), and at End of OP [30.9 ± 20.5; RM-ANOVA: F(2, 13) = (2.3), p = 0.12; Panel A]. Self-reported sleep disturbance also varied little by study period, with mean values of the PROMIS-SF ranging across study periods from 20.8 to 21.0 [RM ANOVA: F(2, 13) = (0.01), p = 0.99; Panel C]. Similarly, the impact of pain on the patient's daily life, as measured by mean values of the Brief Pain Inventory, did not vary significantly across baseline (3.8 ± 2.7), after the EPD titration assessment of the patient's initial lowest preferred PD setting (2.9 ± 2.5), and at End of OP [3.5 ± 2.7; RM-ANOVA: F(2, 13) = (0.78), p = 0.47; Panel D]. Finally, emotional and cognitive responses to pain, as measured by the PCS, also did not vary across time periods, with mean values of 17.0 at baseline, 15.3 after the EPD titration assessment of the patient's lowest preferred PD setting, and 20.3 at End of OP [RM-ANOVA: F(2, 13) = (0.61), p = 0.55; Panel B].
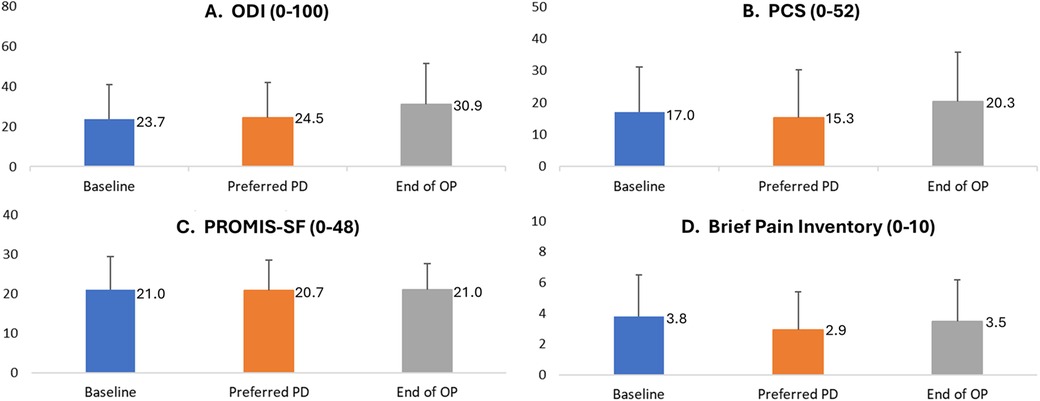
Figure 6. Patient-reported disability, catastrophizing, sleep disturbance, and pain inventory by study period. End of OP, end of 3-month observation period; ODI, Oswestry Disability Index; PCS, Pain Catastrophizing Scale; PD, pulse dose. (A) ODI is a self-reported index of disability. (B) PCS: Patient Catastrophizing Scale. (C) PROMIS-SF is a self-reported index of sleep disturbance. (D) Brief Pain Inventory. The bars represent mean scores (with the mean value labelled to the right of each bar), and positive error bars representing standard deviation. Score data were collected in patient diaries at the end of each period. Figure represents information was collected in all patients who completed Visit 3 (n = 14). Preferred PD refers to the EPD titration assessment of the patient's lowest preferred pulse dose setting.
3.5 Recharging duration
The median daily time required to recharge the IPG was significantly shorter during the EPD titration assessment of the patient's lowest preferred PD setting than at baseline (median minutes/day, 3.0 vs. 31.8; Wilcoxon signed ranks: p = .0001; Figure 7).
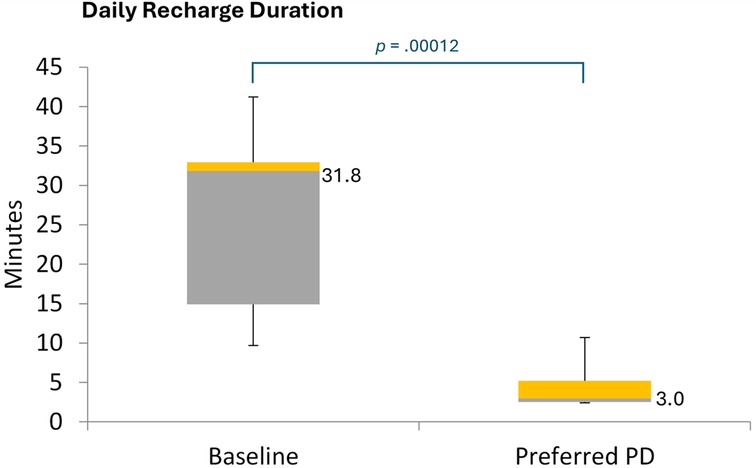
Figure 7. Daily recharge duration. PD, pulse dose. Figure shows the distribution of daily recharge durations for EPD-based 10 kHz SCS, based on diary entries recording over 7 days during each period. The values to the right of the box plots reflect median values.
3.6 Adverse events
Three adverse events were noted during the study: one subject developed wrist, hip, and back pain post-motor vehicle accident; another subject developed new pain where MRI showed progression of spine disease, which was treated with medication, device reprogramming, and facet joint RFA procedure; a third subject contracted COVID, which was treated with medication. None of the adverse events were study-related.
4 Discussion
In this prospective case series, we conducted EPD titration for 10 kHz SCS therapy for the treatment of chronic back or leg pain, finding that in 78% of patients, PDs ranging from 3% to 0.06% were as effective in controlling chronic pain as standard 10 kHz SCS over 3 months of follow-up. Notably, our findings showed that EPD had similar effectiveness as standard 10 kHz SCS in relieving both leg and back pain, as well as in achieving good results for PROs assessing patient satisfaction with therapy, global impression of change, sleep disturbance, pain-related impact, and disability.
These findings help expand our understanding of EPD 10 kHz SCS for chronic pain treatment, extending the range of PDs evaluated beyond those of a study by Provenzano et al., which assessed PDs ranging from 3% to 50% (8). Provenzano et al., which to our knowledge is the only other study reporting on PD 10 kHz SCS, found that 81% of patients responded to PD 10 kHz SCS and that outcomes for pain, PGIC, and treatment satisfaction were similar or better than those of standard 10 kHz (8). Taken together, our findings and those of Provenzano et al. suggest that PD 10 kHz SCS, even at very low PDs, may be highly effective in treating chronic back and leg pain. As in the study by Provenzano et al., in the current study, patient follow-up ranged from 11 to 24 weeks and was thus too short to evaluate the long-term durability of EPD. Nevertheless, the trajectory of pain outcomes and PROs were similar to those observed during the first 3 months of trials of standard 10 kHz SCS reporting sustained reductions in pain through 12 and 24 months (3, 17). Thus, our findings provide a positive signal, warranting further investigation of durability of EPD effectiveness in reducing chronic back and leg pain.
While our study findings suggest that EPD 10 kHz may be effective for treating chronic back and leg pain, the mechanisms underlying this approach remain unclear. Electrophysiological data suggest that cycling of SCS stimulation can affect neurocircuitry in ways that support pain suppression (9, 18). For example, burst stimulation, in which “on” and “off” cycles of 500 Hz stimulation are intended to mimic natural neuronal firing patterns, affects multiple neuronal activities in the spinal cord and brain, leading to moderate pain suppression (9, 19). However, clinical data indicate that, to be effective, burst stimulation requires substantially more “On” time than PDs used in the current study (20, 21). Moreover, different SCS modalities appear to rely on different mechanisms of action (18). Notably, 10 kHz SCS exhibits substantially greater selective activation of inhibitory superficial dorsal horn neurons than either burst stimulation or low-frequency SCS highlighting its unique mechanisms of action (5, 18).
Furthermore, PD 10 kHz SCS enables reduced exposure to electrical stimulation; whereas continuous stimulation may promote neuroplasticity changes, fibrosis, and other physiological factors that lead to habituation and reduced long-term efficacy of SCS therapy (22, 23). Indeed, habituation is the most common reason for device explantation, with real-world data showing that the risk of habituation increases with exposure time, reaching over 17% by 5 years after of implant (9, 24). Thus, by reducing the exposure time to SCS stimulation, EPD 10 kHz SCS may reduce the burden of therapy habituation among patients treated with SCS. Furthermore, in a study of patients experiencing loss of efficacy of 10 kHz SCS, a 1-month stimulation holiday led to significantly higher pain relief (23). Thus, by providing a period of very low stimulation, EPD 10 kHz SCS could potentially serve as a rescue therapy for patients experiencing therapy habituation.
Beyond its potential to address therapy habitation, EPD may also increase the convenience of 10 kHz SCS therapy for patients with chronic pain. In the current study, we found that the median IPG recharge time for EPD 10 kHz SCS was only 3 min, which was substantially lower than the 30-minute median value for standard 10 kHz SCS. This finding accords with that of Provenzano et al. who reported a mean recharge times for PD 10 kHz SCS of about 8–26 min compared with 43.8 min for standard 10 kHz SCS (8). Lower recharge times may also extend the longevity of the IPG device, which could help reduce overall treatment costs for 10 kHz SCS therapy (25). However, the actual impact of recharge times on IPG longevity is unknown and will depend on multiple factors, including whether recharging is done on continual basis or all at once (7, 8).
The current study had limitations that merit consideration. The study was conducted in a small and pragmatically selected sample of patients; thus, findings may not be generalizable to all patients eligible for 10 kHz SCS for the treatment of chronic back or leg pain. Nevertheless, mean NRS pain scores taken at pre-SCS (8.6) and baseline (2.4) in this study closely match those reported in trials of 10 kHz SCS for chronic back and leg pain, providing reassurance that our study patients are broadly representative of this patient population (3, 26). The non-blinded nature of the study, though inherent to the intervention, may have influenced patients' responses, potentially biasing study results. Notably, this limitation applies to all studies evaluating SCS therapy for chronic pain treatment. Some patients were already using a PD setting at baseline. However, EPD is more similar to PD than to standard 10 kHz SCS; thus, any bias induced by the baseline use of PD setting is likely to have reduced, not increased, the likelihood of observing that EPD is an effective treatment.
5 Conclusion
Using prospectively collected data in a well-defined patient group, this study found that 78% of patients receiving standard 10-kHz SCS continued to experience similar levels of pain relief and quality-of-life outcomes at extremely low PD levels. Given its much lower stimulation output and energy requirements, EPD 10 kHz SCS could substantially lower the risk of therapy habituation, while potentially enhancing patient convenience and treatment costs due to reduced recharge times. Future studies should evaluate the durability of EPD 10-kHz SCS in maintaining pain relief and quality-of-life outcomes over a longer term of follow-up.
Data availability statement
The datasets presented in this article are not readily available because data is proprietary, but data may be available via reasonable request. Requests to access the datasets should be directed to Kerry Bradley,YnJhZGxleUBuZXZyby5jb20=.
Ethics statement
The studies involving humans were approved by WCG Investigational Review Board, Study Number: 1309273, 5/26/2021. The studies were conducted in accordance with the local legislation and institutional requirements. The participants provided their written informed consent to participate in this study.
Author contributions
MG: Conceptualization, Funding acquisition, Investigation, Methodology, Project administration, Resources, Supervision, Writing – original draft, Writing – review & editing. AR: Conceptualization, Data curation, Investigation, Methodology, Project administration, Supervision, Writing – original draft, Writing – review & editing. CW: Conceptualization, Data curation, Investigation, Methodology, Project administration, Resources, Software, Supervision, Writing – original draft, Writing – review & editing. RP-A: Data curation, Formal analysis, Methodology, Resources, Software, Writing – original draft, Writing – review & editing, Funding acquisition. KB: Conceptualization, Data curation, Formal analysis, Methodology, Project administration, Resources, Software, Supervision, Visualization, Writing – original draft, Writing – review & editing.
Funding
The author(s) declare that financial support was received for the research and/or publication of this article. The study was supported by an unrestricted research grant from Nevro.
Conflict of interest
MG is President and CEO, and AR is the Lead Research Clinical Coordinator of the Neuroscience Research Center, LLC. MG reports grants and personal fees from Nevro Corp., and consulting agreements from Averitas Pharma, US WorldMeds, Nalu Medical, Foundation Fusion Solutions, SPR Therapeutics, Inc., outside the submitted work. KB, RP-A, and CW are employees and shareholders of Nevro Corp.
Generative AI statement
The author(s) declare that no Generative AI was used in the creation of this manuscript.
Any alternative text (alt text) provided alongside figures in this article has been generated by Frontiers with the support of artificial intelligence and reasonable efforts have been made to ensure accuracy, including review by the authors wherever possible. If you identify any issues, please contact us.
Publisher's note
All claims expressed in this article are solely those of the authors and do not necessarily represent those of their affiliated organizations, or those of the publisher, the editors and the reviewers. Any product that may be evaluated in this article, or claim that may be made by its manufacturer, is not guaranteed or endorsed by the publisher.
Abbreviations
BPI, Brief Pain Inventory; End of OP, End of Observational Period; EPD, Extreme Pulse Dose, Extreme Pulse Dosing; IPG, Implantable Pulse Generator; kHz, Kilohertz; ODI, Oswestry Disability Index; NRS, Numerical Rating Scale, Numeric Rating Score; PCS, Patient Catastrophizing Scale; PD, Pulse Dose, Pulse Dosing; PGIC, Patient Global Impression of Change; PRO, Patient Reported Outcome; PROMIS-SF, Patient Reported Outcomes Measurement Information Scale – Short Form; SCS, Spinal Cord Stimulation.
References
1. Chang D, Lui A, Matsoyan A, Safaee MM, Aryan H, Ames C. Comparative review of the socioeconomic burden of lower back pain in the United States and globally. Neurospine. (2024) 21(2):487–501. doi: 10.14245/ns.2448372.186
2. Buchbinder R, van Tulder M, Oberg B, Costa LM, Woolf A, Schoene M, et al. Low back pain: a call for action. Lancet. (2018) 391(10137):2384–8. doi: 10.1016/S0140-6736(18)30488-4
3. Amirdelfan K, Yu C, Doust MW, Gliner BE, Morgan DM, Kapural L, et al. Long-term quality of life improvement for chronic intractable back and leg pain patients using spinal cord stimulation: 12-month results from the SENZA-RCT. Qual Life Res. (2018) 27(8):2035–44. doi: 10.1007/s11136-018-1890-8
4. Kapural L, Yu C, Doust MW, Gliner BE, Vallejo R, Sitzman BT, et al. Comparison of 10-kHz high-frequency and traditional low-frequency spinal cord stimulation for the treatment of chronic back and leg pain: 24-month results from a multicenter, randomized, controlled pivotal trial. Neurosurgery. (2016) 79(5):667–77. doi: 10.1227/NEU.0000000000001418
5. Patel NP, Jameson J, Johnson C, Kloster D, Calodney A, Kosek P, et al. Durable responses at 24 months with high-frequency spinal cord stimulation for nonsurgical refractory back pain. J Neurosurg Spine. (2024) 40(2):229–39. doi: 10.3171/2023.9.SPINE23504
6. Lee KY, Bae C, Lee D, Kagan Z, Bradley K, Chung JM, et al. Low-intensity, kilohertz frequency spinal cord stimulation differently affects excitatory and inhibitory neurons in the rodent superficial dorsal horn. Neuroscience. (2020) 428:132–9. doi: 10.1016/j.neuroscience.2019.12.031
7. Amirdelfan K, Kapural L, Yu C, Doust MW, Gliner BE, Vallejo R, et al. Subject satisfaction with paresthesia-free 10 kHz and paresthesia-based low-frequency spinal cord stimulation systems. Neuromodulation. (2016) 19(3):e35.
8. Provenzano D, Tate J, Gupta M, Yu C, Verrills P, Guirguis M, et al. Pulse dosing of 10-kHz paresthesia-independent spinal cord stimulation provides the same efficacy with substantial reduction of device recharge time. Pain Med. (2022) 23(1):152–63. doi: 10.1093/pm/pnab288
9. Patil AS, Levasseur B, Gupta M. Neuromodulation and habituation: a literature review and conceptional analysis of sustaining therapeutic efficacy and mitigating habituation. Biomedicines. (2024) 12(5):930–41. doi: 10.3390/biomedicines12050930
10. Sheahan PJ, Nelson-Wong EJ, Fischer SL. A review of culturally adapted versions of the oswestry disability Index: the adaptation process, construct validity, test-retest reliability and internal consistency. Disabil Rehabil. (2015) 37(25):2367–74. doi: 10.3109/09638288.2015.1019647
11. Darnall BD, Roy A, Chen AL, Ziadni MS, Keane RT, You DS, et al. Comparison of a single-session pain management skills intervention with a single-session health education intervention and 8 sessions of cognitive behavioral therapy in adults with chronic low back pain: a randomized clinical trial. JAMA Netw Open. (2021) 4(8):e2113401. doi: 10.1001/jamanetworkopen.2021.13401
12. Fernandes L, Storheim K, Lochting I, Grotle M. Cross-cultural adaptation and validation of the Norwegian pain catastrophizing scale in patients with low back pain. BMC Musculoskelet Disord. (2012) 13:111. doi: 10.1186/1471-2474-13-111
13. Franchignoni F, Giordano A, Ferriero G, Monticone M. Measurement precision of the pain catastrophizing scale and its short forms in chronic low back pain. Sci Rep. (2022) 12(1):12042. doi: 10.1038/s41598-022-15522-x
14. Senturk IA, Askin Turan S, Senturk E, Icen NK. Validation, reliability, and cross-cultural adaptation study of graded chronic pain scale revised into Turkish in patients with primary low back pain. Pain Pract. (2022) 22(3):306–21. doi: 10.1111/papr.13070
15. Health Measures. PROMIS. Updated March 27, 2023. Available online at: https://www.healthmeasures.net/explore-measurement-systems/promis (Accessed November 25, 2024)
16. Garg A, Pathak H, Churyukanov MV, Uppin RB, Slobodin TM. Low back pain: critical assessment of various scales. Eur Spine J. (2020) 29(3):503–18. doi: 10.1007/s00586-019-06279-5
17. De Andres J, Monsalve-Dolz V, Fabregat-Cid G, Villanueva-Perez V, Harutyunyan A, Asensio-Samper JM, et al. Prospective, randomized blind effect-on-outcome study of conventional vs high-frequency spinal cord stimulation in patients with pain and disability due to failed back surgery syndrome. Pain Med. (2017) 18(12):2401–21. doi: 10.1093/pm/pnx241
18. Lee KY, Lee D, Kagan ZB, Wang D, Bradley K. Differential modulation of dorsal horn neurons by various spinal cord stimulation strategies. Biomedicines. (2021) 9(5):568–80. doi: 10.3390/biomedicines9050568
19. Chakravarthy K, Kent AR, Raza A, Xing F, Kinfe TM. Burst spinal cord stimulation: review of preclinical studies and comments on clinical outcomes. Neuromodulation. (2018) 21(5):431–9. doi: 10.1111/ner.12756
20. Deer TR, Patterson DG, Baksh J, Pope JE, Mehta P, Raza A, et al. Novel intermittent dosing burst paradigm in spinal cord stimulation. Neuromodulation. (2021) 24(3):566–73. doi: 10.1111/ner.13143
21. Vesper J, Slotty P, Schu S, Poeggel-Kraemer K, Littges H, Van Looy P, et al. Burst SCS microdosing is as efficacious as standard burst SCS in treating chronic back and leg pain: results from a randomized controlled trial. Neuromodulation. (2019) 22(2):190–3. doi: 10.1111/ner.12883
22. Levy RM, Mekhail N, Kramer J, Poree L, Amirdelfan K, Grigsby E, et al. Therapy habituation at 12 months: spinal cord stimulation versus dorsal root ganglion stimulation for Complex regional pain syndrome type I and II. J Pain. (2020) 21(3-4):399–408. doi: 10.1016/j.jpain.2019.08.005
23. D’Souza RS, Her YF. Stimulation holiday rescues analgesia after habituation and loss of efficacy from 10-kilohertz dorsal column spinal cord stimulation. Reg Anesth Pain Med. (2022) 47(12):722–7. doi: 10.1136/rapm-2022-103881
24. Deer TR, Pope JE, Falowski SM, Pilitsis JG, Hunter CW, Burton AW, et al. Clinical longevity of 106,462 rechargeable and primary cell spinal cord stimulators: real world study in the medicare population. Neuromodulation. (2023) 26(1):131–8. doi: 10.1016/j.neurom.2022.04.046
25. Taylor RS, Bentley A, Campbell B, Murphy K. High-frequency 10 kHz spinal cord stimulation for chronic back and leg pain: cost-consequence and cost-effectiveness analyses. Clin J Pain. (2020) 36(11):852–61. doi: 10.1097/AJP.0000000000000866
Keywords: 10 kHz, chronic low back pain, duty cycling, high-frequency stimulation, pulse dosing, spinal cord stimulation
Citation: Gupta M, Reinert A, West CO, Province-Azalde R and Bradley K (2025) Extreme pulse dosing of 10 kHz spinal cord stimulation: how low can you go?. Front. Pain Res. 6:1633424. doi: 10.3389/fpain.2025.1633424
Received: 22 May 2025; Accepted: 27 August 2025;
Published: 1 October 2025.
Edited by:
Linlin Sun, Peking University, ChinaReviewed by:
Yue Lupeng, Chinese Academy of Sciences (CAS), ChinaChi-Kun Tong, Columbia University, United States
Copyright: © 2025 Gupta, Reinert, West, Province-Azalde and Bradley. This is an open-access article distributed under the terms of the Creative Commons Attribution License (CC BY). The use, distribution or reproduction in other forums is permitted, provided the original author(s) and the copyright owner(s) are credited and that the original publication in this journal is cited, in accordance with accepted academic practice. No use, distribution or reproduction is permitted which does not comply with these terms.
*Correspondence: Kerry Bradley, YnJhZGxleUBuZXZyby5jb20=