
- 1Department of Pediatrics, Texas Tech University Health Sciences, El Paso, TX, USA
- 2Department of Social Sciences and Administration, Universidad Autonoma de Ciudad Juarez, Ciudad Juarez, Chihuahua, Mexico
Remarkable progress in medicine has provided people with the potential for longer and healthier lives. However, health disparities (e.g., poverty, access to health care, educational inequalities, higher exposure to health risks, etc.), make individuals, families, and communities miss most of the benefits of this progress (1, 2). Pediatric populations are affected by these disparities during crucial years of development. The result is poor health or disease, which develops over short and/or long term periods (3–5). The adverse contributions of these disparities have a different effect on each individual. However, they have a powerful effect on pediatric outcomes. One of the most recognized factors associated with health disparities is the problem of poor communication with parents/caretakers. Poor communication prevents them from receiving health benefits, participating in research studies, and actively contributing to disease prevention and health care for their children (6–9). Decades of effort and research on strategies to reduce health disparities have led to inconclusive and conflicting results, and there has been little improvement in leading health indicators (10). Some interventions could have a true beneficial effect on the participants. However, it is possible that the findings have been affected by misclassification of outcomes, exposures, or health conditions due to assessment disparities (11–13).
Research, screening, and diagnosis of pediatric health problems rely on the parents/caretakers ability to understand and respond to health questionnaires and other assessment tools. The accuracy and precision of the results might be compromised when the parents respond to written consent forms, questionnaires, and/or screening tools (14). The root of this communication problem has been attributed to disparities caused by lower levels of education, lack of language proficiency, low literacy, and cultural differences (15, 16).
It is possible that, due to these communication problems, we are missing a critical component of measurement because assessment disparities prevent us from substantially measuring baseline and follow up indicators simply because the assessments used are not understood. The result is inaccurate data. This issue might contribute to differences between and within an ethnic group and affect the final results of interventions, planning health needs, and early interventions. Therefore, it is essential that we include measures that allow us to increase our precision and discover the real needs, status, and results of interventions among those that are confronting disparities. This approach can benefit our knowledge of groups affected by heath disparities through increasing their participation in research studies, which is preferable to simply looking for associations that lead to better health outcomes (e.g., Hispanic paradox, healthy migrant effect, etc.) (17–22).
Strategies to increase research participation and funding have been proposed by various institutions (e.g., the National Institute on Minority Health and Health Disparities in the United States and the World Health Organization) (23). The central theme has included innovative methods of transmitting information (24–28); for example, oral and/or video instructions combined with written material could increase understanding of the information (29–32). These strategies have proven effective at increasing communication with participants however, study accuracy can still be compromised when studies include written-format questions, requiring the participant to read and write (33–35). When the participant is unable to read and/or write, the questions are often read aloud by the investigator, which can introduce bias and confounding factors. For example, a questionnaire with validity and reliability that was tested as a written instrument might not have the same validity when the responses are obtained in another way.
Pictorials have been used for communication since ancestral times. Pictorial descriptions with written instructions enhance understanding of questions for parents confronting literacy barriers and have proven value in cross-cultural communication of information (36, 37). Early studies in psychology and other sciences have demonstrated that pictorials increase cross-cultural communication because they can be used to explain procedures with few images. Pictorial representations can effectively convey simple sentences across language barriers because people share almost the same ability to understand the content of pictures (38–40).
Our experience with pictorial descriptions has focused on mental health assessments. We found that adding pictorial descriptions to psychosocial and behavioral assessment tools increased detection and understanding of the questions without a need to change the content. We selected pictorials after unsuccessfully attempting to use other visual communication methods, because the pictorials were more effective at connecting actions and events (40). Pictorial development was complicated because our intention was to develop pictorials that would be used by different groups without depicting a specific ethnic group. Additionally, the pictorials needed to support the questions without suggesting different meanings, and finally, they needed to be user-friendly images instead of still, complicated images (see Figure 1). Pictorial descriptions reduce the complexity of the questions by mapping words to pictures. Compared with separate verbal and visual explanations, this approach promotes more effective creative problem solving (41, 42). A learner can construct and coordinate visual and verbal representations of the material, which leads to meaningful understanding of the written content.
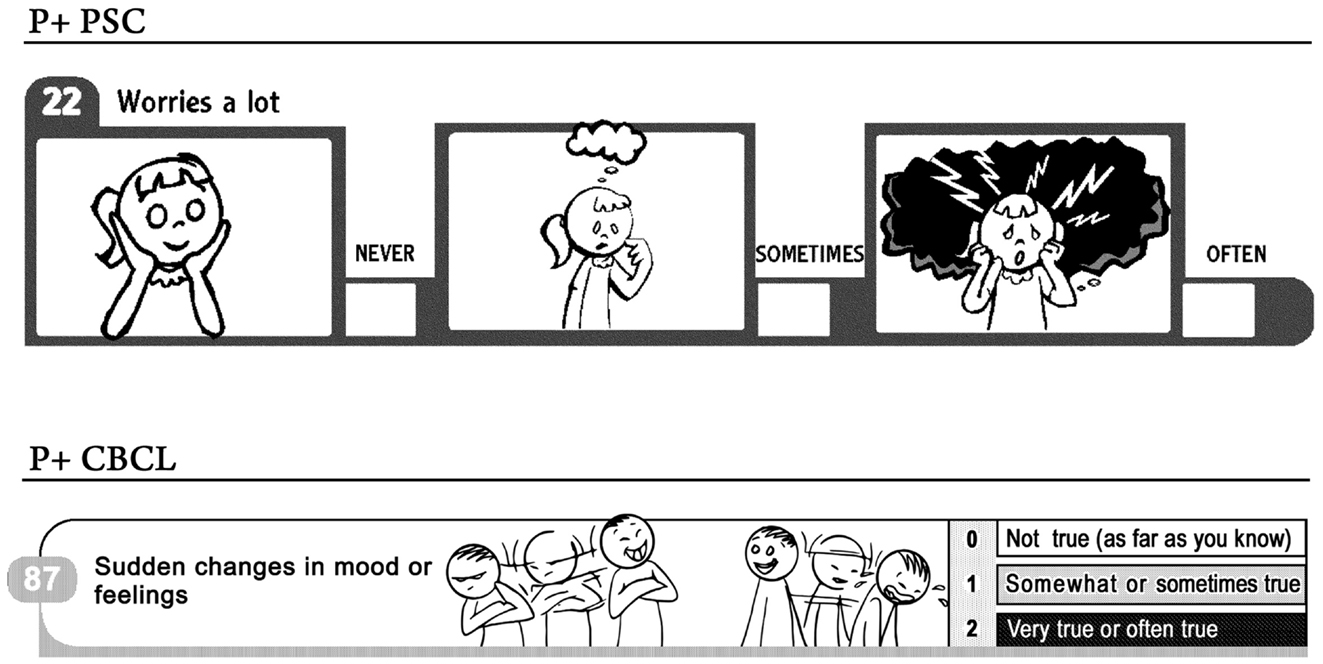
Figure 1. Pictorial sample of questions from Pediatric Symptom Checklist (PSC) and Child Behavior Checklist (CBCL).
Our first pictorial instrument included the Pediatric Symptom Checklist (43), which the Academy of Pediatrics recommends should be used to detect cognitive, emotional, and behavioral problems in children 4–16 years in age. We developed a version of the original instrument by adding pictorial descriptions to each of the 35 questions. We tested the results in participants confronting disparities (e.g., living in poverty, having lower health literacy) in the United States and Mexico. Compared with the original written instrument, the participant prevalence rate was more than double (44, 45). The next pictorial instrument we developed included the Child behavior Checklist (CBCL), which is the most used and recognized tool available for analyzing children with potential emotional and behavioral issues (46, 47).
The results of our study indicated that, when used for English and Spanish populations with low levels of literacy, the pictorial CBCL (P + CBCL) was equivalent to the written instrument (48). Pictorial descriptions added to the original CBCL helped parents confronting disparities to respond to the original questions in the survey instrument.
In our studies, we found that detection was improved by adding pictorial descriptions to a screening tool (44, 45, 49). Most importantly, the pictorial questionnaire produced an equivalent assessment when compared to the original questionnaire (48).
The advantageous characteristics of pictorial descriptions demonstrated in these studies should help increase their use and lead to benefits in a variety of areas. The use of pictorial descriptions in preventative material and other types of health communication may reduce communication gaps. Consent procedures could be simplified by the use of pictorial descriptions, which would increase research participation by improving understanding about the benefits of research studies (50, 51). For baseline indicator data collected via assessments or questionnaires, pictorial descriptions are very cost-effective, because the original assessments are not modified. Customizing a validated questionnaire to apply it to a specific population often requires extensive time and resources to change it, and to assess its validity and reliability. After the questionnaire is created, tested, and used in a population, the results are often not comparable to the results from the original questionnaire. In addition, the revised questionnaire might be applicable only to a specific population, so changes, and validation, for other populations are usually necessary.
Pictorial adaptations to other validated screening tools may facilitate greater use of these tools, with only a low added cost and reduce assessment disparities. A large number of subgroups worldwide would benefit, including those that encounter health disparities. The use of pictorial descriptions is complex. However, the benefits they can provide for measuring the impact of strategies and to increase communication between patient-providers lead us to conclude that their use is worth the effort.
References
1. Arredondo A, Reyes G. Health disparities from economic burden of diabetes in middle-income countries: evidence from Mexico. PLoS One (2013) 8(7):e68443. doi:10.1371/journal.pone.0068443
2. Kim JY, Chan M. Poverty, health, and societies of the future. JAMA (2013) 310(9):901–2. doi:10.1001/jama.2013.276910
3. Ryan-Wenger NA, Gardner W. Hospitalized children’s perspectives on the quality and equity of their nursing care. J Nurs Care Qual (2012) 27(1):35–42. doi:10.1097/NCQ.0b013e31822f71a3
4. Perkins RB, Brogly SB, Adams WG, Freund KM. Correlates of human papillomavirus vaccination rates in low-income, minority adolescents: a multicenter study. J Womens Health (2012) 21(8):813–20. doi:10.1089/jwh.2011.3364
5. Naranjo D, Hessler DM, Deol R, Chesla CA. Health and psychosocial outcomes in U.S. adult patients with diabetes from diverse ethnicities. Curr Diab Rep (2012) 12(6):729–38. doi:10.1007/s11892-012-0319-y
6. Wood DL, Goldhagen JL. Promoting child health equity: family-centered care coordination is just one piece of the puzzle. Pediatrics (2013) 131(2):336–7. doi:10.1542/peds.2012-3248
7. Toomey SL, Chien AT, Elliott MN, Ratner J, Schuster MA. Disparities in unmet need for care coordination: the national survey of children’s health. Pediatrics (2013) 131(2):217–24. doi:10.1542/peds.2012-1535
8. Watts KD. Healthcare inequalities in paediatric respiratory diseases. Paediatr Respir Rev (2012) 13(1):57–62. doi:10.1016/j.prrv.2011.05.004
9. Stewart SM, Simmons A, Habibpour E. Treatment of culturally diverse children and adolescents with depression. J Child Adolesc Psychopharmacol (2012) 22(1):72–9. doi:10.1089/cap.2011.0051
10. Egan M, Tannahill C, Petticrew M, Thomas S. Psychosocial risk factors in home and community settings and their associations with population health and health inequalities: a systematic meta-review. BMC Public Health (2008) 8:239. doi:10.1186/1471-2458-8-239
11. Clarke LC, Rull RP, Ayanian JZ, Boer R, Deapen D, West DW, et al. Validity of race, ethnicity, and National origin in population-based cancer registries and rapid case ascertainment enhanced with a Spanish surname list. Med Care (2013). doi:10.1097/MLR.0b013e3182a30350
12. Akinyemiju TF, Soliman AS, Yassine M, Banerjee M, Schwartz K, Merajver S. Healthcare access and mammography screening in Michigan: a multilevel cross-sectional study. Int J Equity Health (2012) 11:16. doi:10.1186/1475-9276-11-16
13. Grey C, Wells S, Riddell T, Kerr A, Gentles D, Pylypchuk R, et al. A comparative analysis of the cardiovascular disease risk factor profiles of Pacific peoples and Europeans living in New Zealand assessed in routine primary care: PREDICT CVD-11. N Z Med J (2010) 123(1309):62–75.
14. Flores G, Fuentes-Afflick E, Barbot O, Carter-Pokras O, Claudio L, Lara M, et al. The health of Latino children: urgent priorities, unanswered questions, and a research agenda. JAMA (2002) 288(1):82–90. doi:10.1001/jama.288.1.82
15. Weiss BD, Mays MZ, Martz W, Castro KM, DeWalt DA, Pignone MP, et al. Quick assessment of literacy in primary care: the newest vital sign. Ann Fam Med (2005) 3(6):514–22. doi:10.1370/afm.405
16. Guerra CE, Krumholz M, Shea JA. Literacy and knowledge, attitudes and behavior about mammography in Latinas. J Health Care Poor Underserved (2005) 16(1):152–66. doi:10.1353/hpu.2005.0012
17. Dinwiddie GY, Zambrana RE, Garza MA. Exploring risk factors in Latino cardiovascular disease: the role of education, nativity, and gender. Am J Public Health (2013). doi:10.2105/AJPH.2013.301280
18. Espinoza SE, Jung I, Hazuda H. The hispanic paradox and predictors of mortality in an aging biethnic cohort of Mexican Americans and European Americans: the San Antonio longitudinal study of aging. J Am Geriatr Soc (2013) 61(9):1522–9. doi:10.1111/jgs.12421
19. Alderete TL, Toledo-Corral CM, Desai P, Weigensberg MJ, Goran MI. Liver fat has a stronger association with risk factors for type 2 diabetes in African-American compared with hispanic adolescents. J Clin Endocrinol Metab (2013) 98(9):3748–54. doi:10.1210/jc.2013-1138
20. Salinas JJ, Su D, Al Snih S. Border health in the shadow of the hispanic paradox: issues in the conceptualization of health disparities in older Mexican Americans living in the southwest. J Cross Cult Gerontol (2013) 28(3):251–66. doi:10.1007/s10823-013-9202-9
21. Barnes DM, Keyes KM, Bates LM. Racial differences in depression in the United States: how do subgroup analyses inform a paradox? Soc Psychiatry Psychiatr Epidemiol (2013). doi:10.1007/s00127-013-0718-7
22. Thomson EF, Nuru-Jeter A, Richardson D, Raza F, Minkler M. The hispanic paradox and older adults’ disabilities: is there a healthy migrant effect? Int J Environ Res Public Health (2013) 10(5):1786–814. doi:10.3390/ijerph10051786
23. Ingleby D. How Health Systems can Address Health Inequities Linked to Migration and Ethnicity. Copenhagen: WHO Regional Office (2010).
24. Rhodes SD, Duck S, Alonzo J, Ulloa JD, Aronson RE. Using community-based participatory research to prevent HIV disparities: assumptions and opportunities identified by the Latino partnership. J Acquir Immune Defic Syndr (2013) 63(Suppl 1):S32–5. doi:10.1097/QAI.0b013e3182920015
25. Reilly N, Harris S, Loxton D, Chojenta C, Forder P, Milgrom J, et al. Disparities in reported psychosocial assessment across public and private maternity settings: a national survey of women in Australia. BMC Public Health (2013) 13:632. doi:10.1186/1471-2458-13-632
26. Protheroe J, Brooks H, Chew-Graham C, Gardner C, Rogers A. ‘Permission to participate?’ A qualitative study of participation in patients from differing socio-economic backgrounds. J Health Psychol (2013) 18(8):1046–55. doi:10.1177/1359105312459876
27. Hofman K, Blomstedt Y, Addei S, Kalage R, Maredza M, Sankoh O, et al. Addressing research capacity for health equity and the social determinants of health in three African countries: the INTREC programme. Glob Health Action (2013) 6:19668. doi: 10.3402/gha.v6i0.19668
28. Harun A, Harrison JD, Young JM. Interventions to improve patient participation in the treatment process for culturally and linguistically diverse people with cancer: a systematic review. Asia Pac J Clin Oncol (2013) 9(2):99–109. doi:10.1111/j.1743-7563.2012.01531.x
29. Jonnalagadda S, Bergamo C, Lin JJ, Lurslurchachai L, Diefenbach M, Smith C, et al. Beliefs and attitudes about lung cancer screening among smokers. Lung Cancer (2012) 77(3):526–31. doi:10.1016/j.lungcan.2012.05.095
30. Mainous AG III, Smith DW, Geesey ME, Tilley BC. Factors influencing physician referrals of patients to clinical trials. J Natl Med Assoc (2008) 100(11):1298–303.
31. Hamilton LA, Aliyu MH, Lyons PD, May R, Swanson CL Jr, Savage R, et al. African-American community attitudes and perceptions toward schizophrenia and medical research: an exploratory study. J Natl Med Assoc (2006) 98(1):18–27.
32. Robinson SB, Ashley M, Haynes MA. Attitudes of African Americans regarding screening for prostate cancer. J Natl Med Assoc (1996) 88(4):241–6.
33. Shukla AN, Daly MK, Legutko P. Informed consent for cataract surgery: patient understanding of verbal, written, and videotaped information. J Cataract Refract Surg (2012) 38(1):80–4. doi:10.1016/j.jcrs.2011.07.030
34. Lloyd CE, Johnson MR, Mughal S, Sturt JA, Collins GS, Roy T, et al. Securing recruitment and obtaining informed consent in minority ethnic groups in the UK. BMC Health Serv Res (2008) 8:68. doi:10.1186/1472-6963-8-68
35. Shaw BR, Hawkins R, Arora N, McTavish F, Pingree S, Gustafson DH. An exploratory study of predictors of participation in a computer support group for women with breast cancer. Comput Inform Nurs (2006) 24(1):18–27. doi:10.1097/00024665-200601000-00007
36. Li Q, Li X, Stanton B, Wang B. Psychometric properties of a pictorial scale measuring correct condom use. AIDS Behav (2011) 15(2):432–40. doi:10.1007/s10461-010-9838-1
37. Baxter AL, Watcha MF, Baxter WV, Leong T, Wyatt MM. Development and validation of a pictorial nausea rating scale for children. Pediatrics (2011) 127(6):e1542–9. doi:10.1542/peds.2010-1410
38. van Bakel HJ, Maas AJ, Vreeswijk CM, Vingerhoets AJ. Pictorial representation of attachment: measuring the parent-fetus relationship in expectant mothers and fathers. BMC Pregnancy Childbirth (2013) 13:138. doi:10.1186/1471-2393-13-138
39. Pinna B. Perceptual organization of shape, color, shade, and lighting in visual and pictorial objects. Iperception (2012) 3(5):257–81. doi:10.1068/i0460aap
40. Ghiassi R, Murphy K, Cummin AR, Partridge MR. Developing a pictorial Epworth Sleepiness Scale. Thorax (2011) 66(2):97–100. doi:10.1136/thx.2010.136879
41. Houts PS, Doak CC, Doak LG, Loscalzo MJ. The role of pictures in improving health communication: a review of research on attention, comprehension, recall, and adherence. Patient Educ Couns (2006) 61(2):173–90. doi:10.1016/j.pec.2005.05.004
42. Houts PS, Witmer JT, Egeth HE, Loscalzo MJ, Zabora JR. Using pictographs to enhance recall of spoken medical instructions II. Patient Educ Couns (2001) 43(3):231–42. doi:10.1016/S0738-3991(00)00171-3
43. Murphy JM, Jellinek M. Screening for psychosocial dysfunction in economically disadvantaged and minority group children: further validation of the Pediatric Symptom Checklist. Am J Orthopsychiatry (1988) 58(3):450–6. doi:10.1111/j.1939-0025.1988.tb01605.x
44. Leiner MA, Puertas H, Caratachea R, Perez H, Jimenez P. Sensitivity and specificity of the pictorial Pediatric Symptom Checklist for psychosocial problem detection in a Mexican sample. Rev Invest Clin (2010) 62(6):560–7.
45. Leiner MA, Balcazar H, Straus DC, Shirsat P, Handal G. Screening Mexicans for psychosocial and behavioral problems during pediatric consultation. Rev Invest Clin (2007) 59(2):116–23.
46. Rescorla LA, Achenbach TM, Ivanova MY, Harder VS, Otten L, Bilenberg N, et al. International comparisons of behavioral and emotional problems in preschool children: parents’ reports from 24 societies. J Clin Child Adolesc Psychol (2011) 40(3):456–67. doi:10.1080/15374416.2011.563472
47. Ivanova MY, Achenbach TM, Rescorla LA, Harder VS, Ang RP, Bilenberg N, et al. Preschool psychopathology reported by parents in 23 societies: testing the seven-syndrome model of the child behavior checklist for ages 1.5–5. J Am Acad Child Adolesc Psychiatry (2010) 49(12):1215–24. doi:10.1016/j.jaac.2010.08.019
48. Leiner M, Rescorla L, Medina I, Blanc O, Ortiz M. Psychometric comparisons of the pictorial child behavior checklist with the standard version of the instrument. Psychol Assess (2010) 22(3):618–27. doi:10.1037/a0019778
49. Canceko-llego C, Castillo-Carandang N, Reyes A. Validation of the pictorial pediatric symptom checklist – Filipino version for the psychosocial screening of children in a low-income urban community. Acta Med Philipp (2009) 43(4):62–8.
50. Williams MT, Beckmann-Mendez DA, Turkheimer E. Cultural barriers to African American participation in anxiety disorders research. J Natl Med Assoc (2013) 105(1):33–41.
Keywords: assessment disparities, pediatric patients, pictorial descriptions, health literacy, health disparities
Citation: Leiner M, Peinado J, Villanos MTM and Jimenez P (2013) Assessment disparities among pediatric patients: advantages of pictorial descriptions. Front. Pediatr. 1:28. doi: 10.3389/fped.2013.00028
Received: 24 September 2013; Accepted: 02 October 2013;
Published online: 15 October 2013.
Edited by:
Frederick Robert Carrick, Carrick Institute, USACopyright: © 2013 Leiner, Peinado, Villanos and Jimenez. This is an open-access article distributed under the terms of the Creative Commons Attribution License (CC BY). The use, distribution or reproduction in other forums is permitted, provided the original author(s) or licensor are credited and that the original publication in this journal is cited, in accordance with accepted academic practice. No use, distribution or reproduction is permitted which does not comply with these terms.
*Correspondence:bWFyaWUubGVpbmVyQHR0dWhzYy5lZHU=