 Luis Moral1*
 Teresa Toral1
 Agustín Clavijo2
 María Caballero3
 Francisco Canals4María José Forniés5Jorge Moral6Raquel Revert7Raquel Lucas8
 Ana María Huertas3María Cristina González5
 Belén García-Avilés9
 Mónica Belda10Nuria Marco11
- 1Pediatric Respiratory and Allergy Unit, Alicante University General Hospital, Alicante Institute for Health and Biomedical Research (ISABIAL), Alicante, Spain
- 2Department of Pediatrics, Marina Baixa Hospital, Villajoyosa, Spain
- 3Department of Pediatrics, Vinalopó University Hospital, Elche, Spain
- 4Department of Pediatrics, Elche University General Hospital, Elche, Spain
- 5Department of Pediatrics, Virgen de la Salud University General Hospital, Elda, Spain
- 6Faculty of Medicine, Miguel Hernández University, Sant Joan d'Alacant, Spain
- 7Department of Pediatrics, Alicante University General Hospital, Alicante, Spain
- 8Department of Pediatrics, Marina Salud Hospital, Denia, Spain
- 9Department of Pediatrics, Sant Joan d'Alacant University Clinical Hospital, Sant Joan d'Alacant, Spain
- 10Department of Pediatrics, Virgen de los Lirios Hospital, Alcoy, Spain
- 11Department of Pediatrics, Vega Baja Hospital, Orihuela, Spain
Introduction: The most appropriate treatment for parapneumonic effusion (PPE), including empyema, is controversial. We analyzed the experience of our center and the hospitals in its reference area after adopting a more conservative approach that reduced the use of chest tube pleural drainage (CTPD).
Methods: Review of the clinical documentation of all PPE patients in nine hospitals from 2010 to 2018.
Results: A total of 318 episodes of PPE were reviewed; 157 had a thickness of <10 mm. The remaining 161 were 10 mm or thicker and were subdivided into three increasing sizes: PE+1, PE+2, and PE+3. There was a strong relationship between the size of the effusion and complicated effusion/empyema, defined by its appearance on imaging studies or by the physical or bacteriological characteristics of the pleural fluid. The size of effusion was also strongly related to the duration of fever and intravenous treatment and was the best independent predictor of the length of hospital stay (LHS) (p < 0.001). CTPD was placed in 2.9% of PE+1 patients, 19.3% of PE+2, and 63.9% of PE+3 (p < 0.001). The referral of patients with PE+1 decreased over time (p = 0.033), as did the use of CTPD in the combined PE+1/PE+2 group (p = 0.018), without affecting LHS (p = 0.814). There were no changes in the use of CTPD in the PE+3 group (p = 0.721).
Conclusions: The size of the PPE is strongly correlated with its severity and with LHS. Most patients can be treated with antibiotics alone.
Introduction
Parapneumonic effusion (PPE), including simple and complicated effusion and empyema, is the most common complication of pneumonia in children. Most clinical studies on PPE are reference hospital-based, and there is currently no consensus on the most appropriate treatment (1–3). Small PPE (<10 mm thick) can usually be managed conservatively. Several clinical trials have been carried out to verify the most appropriate method to drain complicated effusion and empyema (CE/E) (4, 5). Conservative treatment of CE/E is based primarily on antibiotics, restricting chest tube pleural drainage (CTPD) or video-assisted thoracoscopy to the most severe or treatment-resistant cases. This approach has never been addressed in clinical trials, although some centers have published their experience with good results (6, 7). Little is known about risk factors for prolonged length of hospital stay (LHS) (8).
In 2010, we changed our approach to treating CE/E. The decision to use CTPD was personalized according to practicing physicians' (non-standardized) clinical criteria (e.g., persistent septic appearance, marked respiratory distress) rather than the radiological criteria used previously (size and complexity of effusion). As a result, draining of CE/E cases dropped from 83% in the period 2005–2009 to 47% in 2010–2013, without significant differences in outcomes, including LHS (9). After 9 years we wanted to review the treatments and outcomes of our patients, but more than 70% of them came from the eight community hospitals (CH) to which we serve as a reference. Those eight CH are similar in size and all have a dedicated pediatric service, but they lack pediatric interventional radiology services, pediatric surgery and pediatric intensive care, so many patients with PPE must be transferred to our center. As a consequence of our shift to a conservative treatment, those CH might have also progressively changed their referral criteria, raising the severity threshold and reducing the number of transfers. There were no hospital guidelines for antibiotic selection or transfer criteria, which were at the discretion of practicing pediatricians. The size of the PPE was usually perceived as one important objective factor for transfer and management decisions. To avoid the biased view of a reference center, we decided to review all the patients attended in the nine hospitals of our geographic area, including those not transferred. The main objectives of this study were (a) to describe the characteristics, treatment and outcomes of a population-based cohort of children admitted with PPE after adoption of the conservative treatment policy, and (b) to identify factors associated with the LHS in patients with large PPE (≥10 mm thick).
Patients and Methods
Selection of Patients
Patients were recruited from our hospital and the other eight public CH, together covering a population of just over 250,000 children under the age of 15. Ours is the only reference center for all children in the area requiring invasive procedures or intensive care. Episodes of PPE that met the following three criteria were reviewed: (a) patients under 15 years of age at the time of admission; (b) hospitalized from 1 January 2010 to 31 December 2018; and (c) diagnosed with pleural effusion or empyema, either as the primary or secondary diagnosis (ICD9 diagnostic codes 510.0, 510.9, 511.1, 511.81, 511.89, 511.9 or ICD10 diagnostic codes J86.0, J86.9, J90, J91, J91.8). Medical records were individually reviewed to rule out patients who met any of the exclusion criteria: (a) non-infectious pleural effusion; (b) tuberculosis; (c) nosocomial pneumonia; (d) concurrent severe diseases that influenced the treatment, clinical course and LHS more than the PPE itself; (e) patients transferred to distant hospitals outside the study area. Patients who met the eligibility criteria were selected to complete the case report form by reviewing their medical history and image studies.
Variables
We recorded patient data at admission, including sex, age (years old), year and month of admission, previous diseases, days of fever and antibiotics administered before hospitalization. Vaccination status was not available for most of the patients and was not analyzed. The worst recorded values of blood leukocytes, neutrophils, C-reactive protein, sodium and urea during hospitalization were reviewed. For an easy and simple multicenter retrospective classification, the size of the PPE was divided into four groups, based on the maximum thickness of the effusion observed in any diagnostic imaging: <10 mm (PE–), 10–20 mm (PE+1), >20 mm but not massive (PE+2), and massive (PE+3), the latter considered as the complete or almost complete opacification of the affected hemithorax. To perform some of the analyses, all patients with effusions of 10 mm or greater (PE+1, PE+2, and PE+3) were pooled into a single group (PE+). The total number of leukocytes, percentage of neutrophils, and protein and glucose concentration in the pleural fluid (PF) were recorded when available. Blood culture and PF culture results were recorded. The etiologic agent was considered confirmed when the growth of a characteristically pathogenic bacterium was reported in the blood or PF culture, after exclusion of presumed contaminant or doubtfully pathogenic bacteria (10). Other microbiological studies (Mycoplasma pneumoniae serology, bacterial antigen detection, viral detection) were not analyzed due to the great variability between participant centers or uncertain interpretation. CE/E was defined by the observation, if available, of echogenic (by ultrasound) or radiopaque (by computed tomography) images inside the pleural effusion, by direct observation of an opalescent or purulent PF, or by growth of any confirmed pathogenic bacteria in the PF, in cases in which a sample was obtained by means of puncture or drainage. Intravenous and oral antibiotics administered and the duration of treatment since admission were retrieved. CTPD placement, administration of oxygen, admission to the intensive care unit and assistance with mechanical ventilation were noted. The presence of pneumothorax and the timing of its detection were recorded as well as the duration of fever during hospitalization. LHS was counted in days from the first admission to a hospital for the episode of PPE until the final discharge, even if it was in a different hospital after having been transferred. Calculation of LHS also included the days spent at home after discharge when readmission was required for the same episode. Data were reviewed and recorded by investigators from each of the participating hospitals. In case of any doubt or incongruity, especially about diagnostic imaging, the main investigator reviewed the conflicting information to make a decision and ensure consistent criteria.
Statistical Analysis
The data collected in the case report forms were entered into a database for statistical processing using the SPSS v.26 and the R v.4.0.2. programs. Statistical significance was set at P < 0.05.
A descriptive analysis of the whole cohort was performed, calculating the frequencies and percentages for the qualitative variables, and the median and the interquartile range for quantitative variables. Pearson's χ2 test (or Fisher's exact test in 2×2 tables) was used for the comparative analysis of qualitative variables, and the Mann-Whitney U-test or the Kruskall-Wallis H-test for the quantitative variables, as appropriate. The χ2 test for linear trend was used for qualitative variables with ordered values (size of the effusion, year of hospitalization).
In patients with PE+, we analyzed mean LHS according to each explanatory categorical variable, using Welch's robust test or the Mann-Whitney U-test, as appropriate. For explanatory quantitative variables, we calculated Spearman's correlation coefficient. Finally, we fitted a log-linked Gamma generalized linear model to explain the LHS. This variable is not symmetrical nor is it normally distributed, and a linear model does not meet the goodness-of-fit criteria. The Gamma model does not require parametric distributions, and it is a good alternative for performing transformations of the response variable (11). The log-linked function means that the coefficients calculated are exponential, so the interpretation is similar to that of an odds ratio estimated by logistic regression: if it is over 1, the explanatory variable is associated with an increase in the mean LHS, whereas values of <1 mean that the variable is associated with a decrease. The effect magnitude is calculated as [1 – exp(beta)] × 100%, which is the percentage of mean change in LHS associated with the corresponding variable. A complete table with these coefficients is shown for the final model, fitted using a stepwise selection approach from the baseline variables, according to the Akaike Information Criterion (AIC). We present the results of the deviance test for goodness-of-fit as well as residual plots to test the linearity of the predictors and the appropriateness of the Gamma model.
Ethics
The study was approved by the research ethics committee of our hospital.
Results
We evaluated 337 cases of non-tuberculous PPE; 14 were excluded from analysis due to nosocomial pneumonia or concurrent severe diseases that influenced the treatment, clinical course, and LHS more than the PPE itself (Supplementary Table 1). Another five patients were transferred to distant hospitals for unrelated reasons and were also excluded. Thus, a total of 318 PPE episodes were included: 157 patients (49.4%) had a PE- and 161 (50.6%) a PE+, distributed as 68 (21.4%) PE+1, 57 (17.9 %) PE+2 and 36 (11.3%) PE+3. Table 1 presents the descriptive analysis of the cohort. Seventy-six patients (23.9%) had previous or concomitant diseases (Supplementary Table 2). The strong relationship between the size of the effusion and CE/E is reflected in Table 1. A significant correlation was also observed between the size of the effusion and the results of blood (but not PF) tests. The total number of leukocytes in PF varied widely and was not related to the size of the effusion (p = 0.621). The result of blood or PF culture was documented in 259 patients (81.4%). The etiologic agent was considered confirmed in 24 patients (7.4% of the total and 9.1% of those with known cultures): Streptcoccus pneumoniae in 18, Streptococcus pyogenes in 5, and Haemophilus influenzae in 1 patient. In 19 patients, bacteria that grew in the blood or PF culture were presumed contaminant or doubtfully pathogenic (Supplementary Table 3). The duration of treatment and the antibiotics used, the administration of oxygen, and admission to intensive care, were related to the size of the effusion, as observed in Table 1. Pneumothorax was detected in 15 patients, all of them with PE+2 (5.3% of this group) or PE+3 (33.3% of this group), but only four had pneumothorax before CTPD placement. Both the duration of fever and LHS were strongly correlated with the size of the effusion (Table 1).
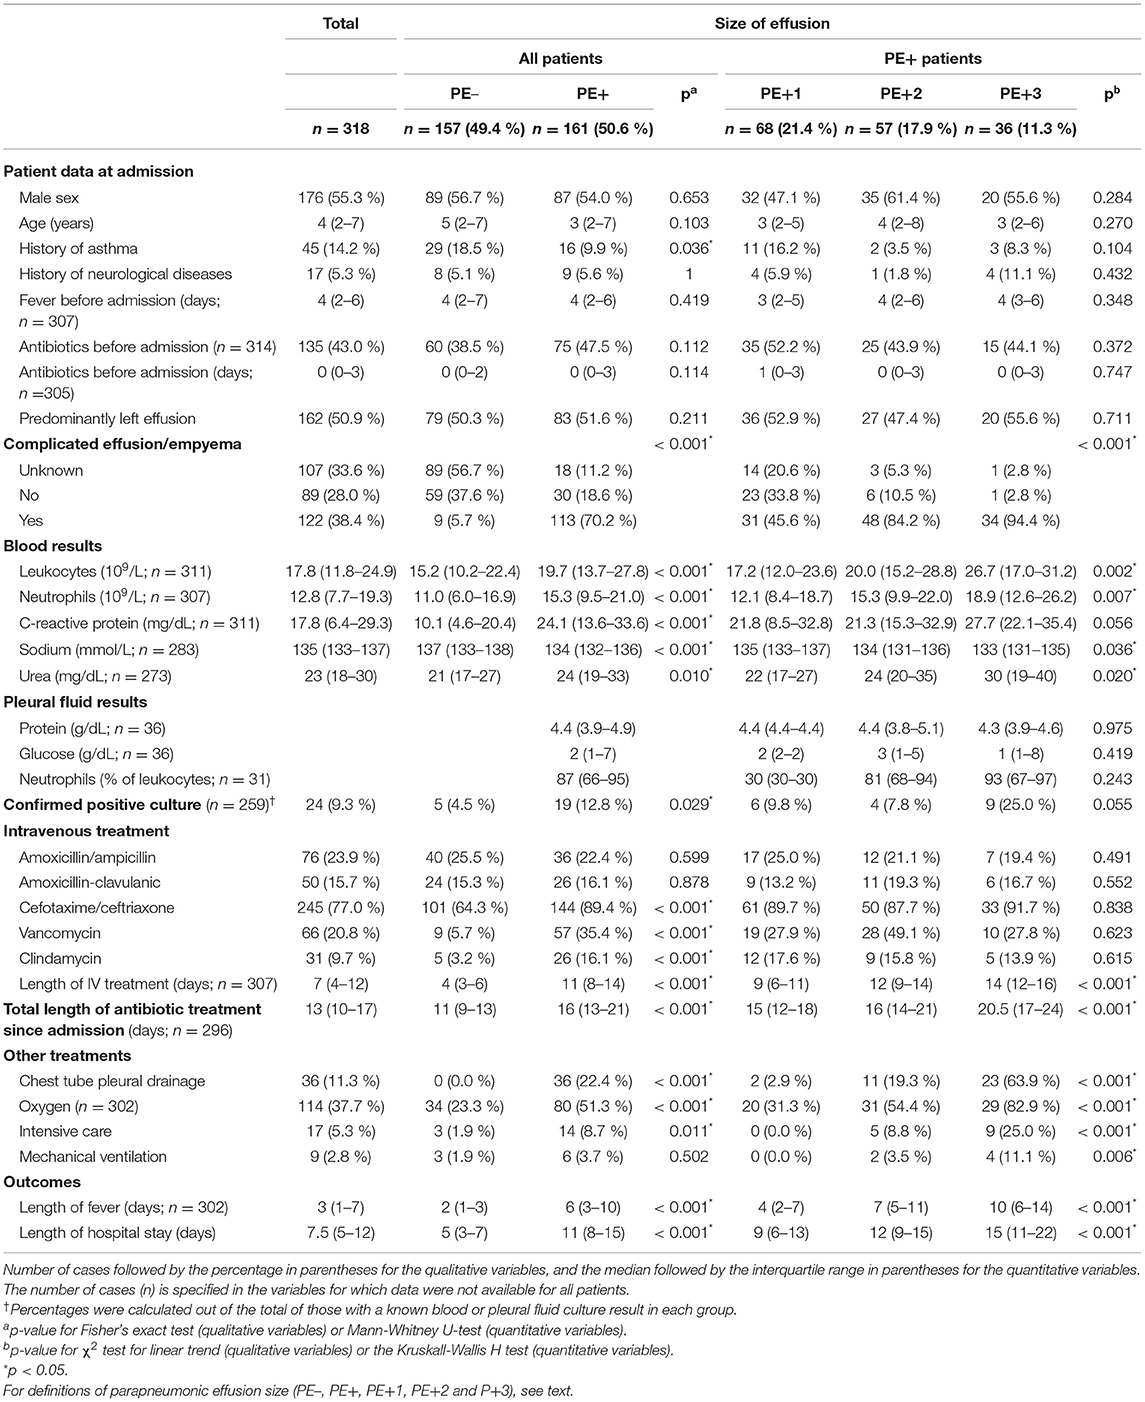
Table 1. Patient characteristics, treatment, and outcomes separated by size of effusion.
A CTPD was inserted in 36 patients (11.3%), all of them with PE+ (22.4% of this group) or CE/E (29.5% of this group), generally with urokinase (72.2%, no difference in LHS: p = 0.614). Only 1 of the 318 patients, who was previously managed with a CTPD, required video-assisted thoracoscopic surgery after readmission for a reinfection of PPE and had the longest LHS, 54 days, including 24 days at home between admissions. Supplementary Table 4 shows a significant decreasing trend in the use of CTPD over time only in the combined PE+1 and PE+2 group. Of the 249 patients initially admitted to the eight CH in our reference area, 80 (32.1%) were transferred to our center: 7/126 (5.6%) PE–, 18/56 (32.1 %) PE+1, 31/43 (72.1%) PE+2, and 24/24 (100%) PE+3. There was a significant decrease in the transfer only for those in the PE+1 group (Supplementary Table 4). There was no variation over time in the duration of intravenous treatment, fever, or LHS in the whole group of children with PPE or specifically in subgroups of PE+ patients (Supplementary Table 5).
Supplementary Tables 6, 7 present the analysis of factors associated with a longer hospital stay in patients with PE+. Table 2 shows the estimation of the multivariable Gamma model, showing that the magnitude of the PPE is the best predictor of LHS, with a pronounced gradient and positive correlation between the two. We also observed a significant relationship between LHS and several explanatory variables, including duration of pre-hospital antibiotic treatment (the longer the treatment, the shorter the hospital stay), C-reactive protein value, and season (trimester). Sex, year of admission, and hospital of origin were not associated with LHS. The model showed a good fit with the data, showing linearity with the predictors and normality of the residuals (Supplementary Data Sheet 1).
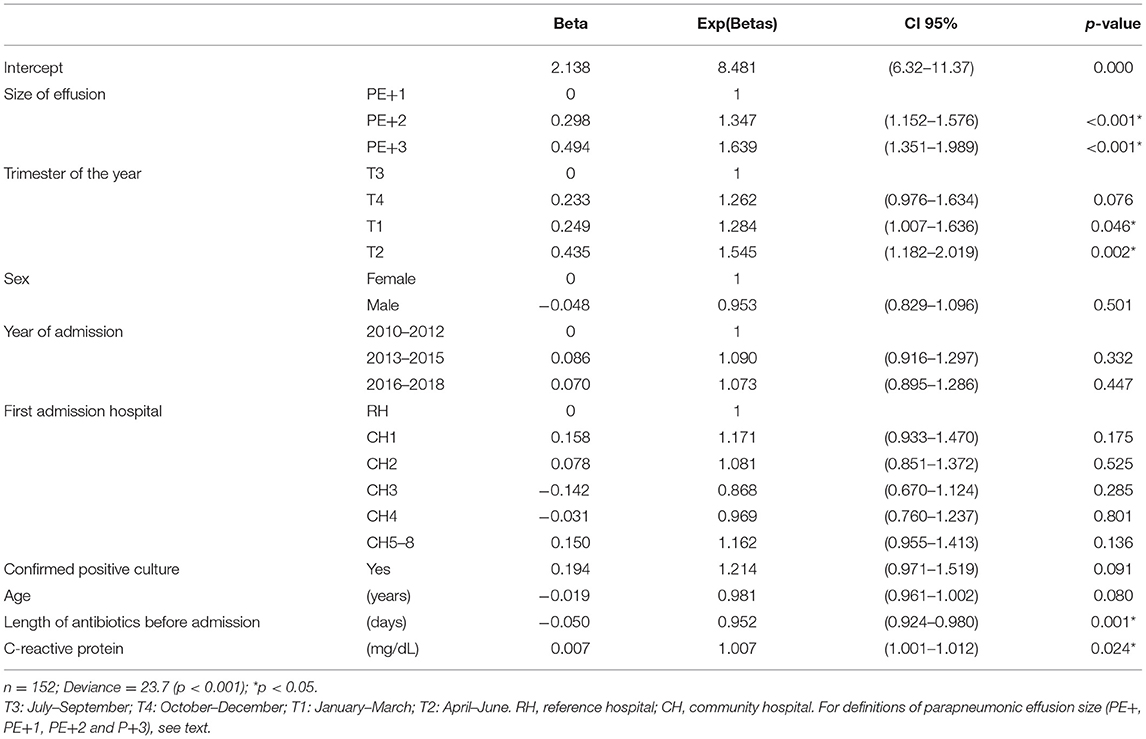
Table 2. Multivariate Gamma model for the length of hospital stay for patients with PE+.
Discussion
Our study is unique in showing the detailed characteristics of a complete cohort of patients hospitalized for PPE (including empyema) over a wide geographic area and period of time, providing a panoramic view of the full spectrum of the disease without the bias of the perspective of a reference hospital. We have found no similar population-based reports of children with PPE. Furthermore, given the conservative approach to CTPD, this study offers an overview of the evolution of PPE, managed in many cases only with antibiotics.
The size of the PPE is strongly correlated with CE/E, patient characteristics, treatments, and outcomes. Patients with small effusions (PE–) usually have simple effusions, with moderate analytical changes. They rarely require referral or CTPD, and the fever subsides in a few days, which generally limits the length of intravenous treatment and LHS to <1 week. As the size of the PPE increases, other variables related to its severity and to the intensity of treatment simultaneously increase, such as leukocytosis with neutrophilia, C-reactive protein, sodium (decrease) and urea values in the blood, growth of evident pathogenic organisms in the cultures, CTPD placement, need for oxygen therapy, admission to intensive care, and the length of fever, antibiotic treatment and LHS. The analytical values in the PF show few differences related to the size and severity of the effusion, although these data may suffer from selection bias due to the limited number of patients in which a sample was obtained, mostly those undergoing CTPD. The need for mechanical ventilation was similarly rare in large and small effusions. In patients with PE+, the size of PPE is the best independent predictor of the LHS, followed by the maximum level of C-reactive protein. On the other hand, LHS in PE+ patients decreases with increasing days of antibiotic treatment before admission and in those admitted in the summer. To the best of our knowledge, these findings have never been described before.
Before 2010, more than 80% of patients with CE/E underwent CTPD in our center; this percentage markedly decreased after changing the initial approach to treatment, without significant changes in the outcomes, especially in the LHS (9). As a result, most CE/E are being treated only with antibiotics. Treatment of patients with PE+3 changed the least in this period, and most of them are still treated with CTPD, although about one in three are treated conservatively. Clinical guidelines usually recommend the treatment of CE/E using drainage techniques, mainly CTPD or video thoracoscopy (12–14). However, in real life, many differences in daily clinical practice can be observed (1, 2). Many centers adopt a conservative treatment approach, using only antibiotics, at least initially. Epaud et al. reduced the use of CTPD from 52 to 25% by changing to a more conservative approach, with no change in the outcomes (6). Carter et al. reported extensive experience of conservative treatment of empyema, and 52% of their patients, including 23% with mediastinal deviation, were treated with antibiotics alone (7). Picard et al. followed a conservative approach, using only antibiotics in a third of their patients with empyema (15). Proesmans et al. treated 37% of children with empyema with antibiotics alone, and only 8% required further interventions (16). Long et al. treated 27% of children with empyema with antibiotics, and only 3% required a subsequent intervention (17). In the USA, more than half of children with PPE were treated with antibiotics alone, with an upward trend in the last decade, and similar outcomes were achieved across the most interventional and the most conservative centers (18, 19). In other recent studies, no differences were found in children treated conservatively or with drainage procedures (20, 21).
Our study has limitations, mainly related to its observational and retrospective nature, as the data depend on the quality of the records. For variables with missing data (fewer than 318 observations), the dataset may be less reliable than those with data from all patients in the cohort. It is also not possible to record, in a case report form, all the complexity of the clinical course in some patients, which is simplified into the most objective and quantifiable data. The classification of the size of the effusion may be influenced by various factors, such as the technique used (x-ray, ultrasound, computed tomography), patient position, the timing of the studies, or the early or late placement of the CTPD, among others. Moreover, pleural thickness on diagnostic imaging may be imperfectly related to the volume of the effusion (due to loculated effusion, patient age, or other factors). Microbiological studies other than cultures were not systematically performed, and only clearly pathogenic bacteria growing in blood or pleural fluid were considered, resulting in a low rate of etiological diagnosis. However, the multicenter, population-based nature of the study, collecting extensive clinical and radiological data in patients from a large cohort spanning almost a decade, makes the results highly robust.
In patients without significant comorbidities, PPE mortality, including empyema, is practically nil (4, 18, 20–23), and the medium-term prognosis is good (24, 25). Therefore, the objective of treatment is to shorten hospitalization and simplify treatment, thereby reducing iatrogenesis and costs. Observational studies are not useful to know whether there is a difference between conservative and interventional treatment. It would be interesting to know the predictors of a prolonged or complicated course of PPE to identify, at least theoretically, those who could benefit the most from interventional treatment. Studies carried out in this regard have been scarce and inconclusive (8, 15, 23, 26, 27). To conclude, we have verified that the size of PPE is strongly correlated with its severity and with LHS, so it could be used as a prognostic factor and for treatment decision-making. Most patients can be treated with antibiotics alone, even in CE/E. Clinical trials should determine if and which patients may benefit from early treatment with drainage techniques, to significantly reduce the LHS.
Data Availability Statement
The raw data supporting the conclusions of this article will be made available by the authors, without undue reservation.
Ethics Statement
The studies involving human participants were reviewed and approved by Comité Ético de Investigación del Hospital General Universitario de Alicante. Written informed consent for participation was not provided by the participants' legal guardians/next of kin because: Retrospective observational research. Authorized by the ethics committee.
Author Contributions
LM had primary responsibility for protocol development, preliminary data analysis, and writing the manuscript. TT, AC, MC, FC, MF, JM, RR, RL, AH, MG, BG-A, MB, and NM participated in the collection of patients' data and contributed to the writing of the manuscript. All authors contributed to the article and approved the submitted version.
Conflict of Interest
The authors declare that the research was conducted in the absence of any commercial or financial relationships that could be construed as a potential conflict of interest.
Supplementary Material
The Supplementary Material for this article can be found online at: https://www.frontiersin.org/articles/10.3389/fped.2021.621943/full#supplementary-material
Abbreviations
PPE, parapneumonic effusion, including empyema; CE/E, complicated effusion and empyema; CH, community hospital; CTPD, chest tube pleural drainage; LHS, length of hospital stay; PE–, parapneumonic effusion <10 mm; PE+, parapneumonic effusion of 10 mm or greater; PE+1, parapneumonic effusion of 10–20 mm; PE+2, parapneumonic effusion >20 mm but not massive; PE+3, massive parapneumonic effusion (complete or almost complete opacification of the affected hemithorax); PF, pleural fluid.
References
1. Hafen GM, Grenzbach AC, Moeller A, Rochat MK. Lack of concordance in parapneumonic effusion management in children in central Europe. Pediatr Pulmonol. (2016) 51:411–7. doi: 10.1002/ppul.23263
2. Richards MK, McAteer JP, Edwards TC, Hoffman LR, Kronman MP, Shaw DW, et al. Establishing equipoise: National survey of the treatment of pediatric para-pneumonic effusion and empyema. Surg Infect (Larchmt). (2017) 18:137–42. doi: 10.1089/sur.2016.134
3. Bueno Fischer G, Teresinha Mocelin H, Feijó Andrade C, Sarria EE. When should parapneumonic pleural effusions be drained in children? Paediatr Respir Rev. (2018) 26:27–30. doi: 10.1016/j.prrv.2017.05.003
4. Redden MD, Chin TY, van Driel ML. Surgical versus non-surgical management for pleural empyema. Cochr Datab Syst Rev. (2017) 3:CD010651. doi: 10.1002/14651858.CD010651.pub2
5. Pacilli M, Nataraja RM. Management of paediatric empyema by video-assisted thoracoscopic surgery (VATS) versus chest drain with fibrinolysis: systematic review and meta-analysis. Paediatr Respir Rev. (2019) 30:42–8. doi: 10.1016/j.prrv.2018.09.001
6. Epaud R, Aubertin G, Larroquet M., Ducou-le Pointe H, Helardot P, Clement A, et al. Conservative use of chest-tube insertion in children with pleural effusion. Pediatr Surg Int. (2006) 22:357–62. doi: 10.1007/s00383-006-1645-4
7. Carter E, Waldhausen J, Zhang W, Hoffman L, Redding G. Management of children with empyema: pleural drainage is not always necessary. Pediatr Pulmonol. (2010) 45:475–80. doi: 10.1002/ppul.21200
8. Breuer O, Picard E, Benabu N, Erlichman I, Reiter J, Tsabari R, et al. Predictors of prolonged hospitalizations in pediatric complicated pneumonia. Chest. (2018) 153:172–80. doi: 10.1016/j.chest.2017.09.021
9. Moral L, Loeda C, Gómez F, Pena MÁ, Martínez M, Cerdán JM, et al. Complicated pleural infection: analysis of two consecutive cohorts managed with a different policy. An Pediatr (Barc). (2016) 84:46–53. doi: 10.1016/j.anpede.2015.02.001
10. Jain S, Williams DJ, Arnold SR, Ampofo K, Bramley AM, Reed C, et al. Community-acquired pneumonia requiring hospitalization among US children. N Engl J Med. (2015) 372:835–45. doi: 10.1056/NEJMoa1405870
12. Balfour-Lynn IM, Abrahamson E, Cohen G, Hartley J, King S, Parikh D, et al. BTS guidelines for the management of pleural infection in children. Thorax. (2005) 60:i1–21. doi: 10.1136/thx.2004.030676
13. Islam S, Calkins CM, Goldin AB, Chen C, Downard CD, Huang EY, et al. The diagnosis and management of empyema in children: a comprehensive review from the APSA outcomes and clinical trials committee. J Pediatr Surg. (2012) 47:2101–10. doi: 10.1016/j.jpedsurg.2012.07.047
14. Feola GP, Hogan MJ, Baskin KM, Cahill AM, Connolly BL, Crowley JJ, et al. Quality improvement standards for the treatment of pediatric empyema. J Vasc Interv Radiol. (2018) 29:1415–22. doi: 10.1016/j.jvir.2018.04.027
15. Picard E, Joseph L, Goldberg S, Mimouni FB, Deeb M, Kleid D, et al. Predictive factors of morbidity in childhood parapneumonic effusion-associated pneumonia: a retrospective study. Pediatr Infect Dis J. (2010) 29:840–3. doi: 10.1097/INF.0b013e3181dd1fc4
16. Proesmans M, Gijsens B, Van de Wijdeven P, De Caluwe H, Verhaegen J, Lagrou K, et al. Clinical outcome of parapneumonic empyema in children treated according to a standardized medical treatment. Eur J Pediatr. (2014) 173:1339–45. doi: 10.1007/s00431-014-2319-1
17. Long AM, Smith-Williams J, Mayell S, Couriel J, Jones MO, Losty PD. “Less may be best” - pediatric parapneumonic effusion and empyema management: lessons from a UK center. J Pediatr Surg. (2016) 51:588–91. doi: 10.1016/j.jpedsurg.2015.07.022
18. Goldin AB, Parimi C, LaRiviere C, Garrison MM, Larison CL, Sawin RS. Outcomes associated with type of intervention and timing in complex pediatric empyema. Am J Surg. (2012) 203:665–73. doi: 10.1016/j.amjsurg.2012.01.005
19. Dorman RM, Vali K, Rothstein DH. Trends in treatment of infectious parapneumonic effusions in U.S. children's hospitals, 2004-2014. J Pediatr Surg. (2016) 51:885–90. doi: 10.1016/j.jpedsurg.2016.02.047
20. Segerer FJ, Seeger K, Maier A, Hagemann C, Schoen C, van der Linden M, et al. Therapy of 645 children with parapneumonic effusion and empyema—a German nationwide surveillance study. Pediatr Pulmonol. (2017) 52:540–7. doi: 10.1002/ppul.23562
21. Erlichman I, Breuer O, Shoseyov D, Cohen-Cymberknoh M, Koplewitz B, Averbuch D, et al. Complicated community acquired pneumonia in childhood: different types, clinical course, and outcome. Pediatr Pulmonol. (2017) 52:247–54. doi: 10.1002/ppul.23523
22. Bender JM, Ampofo K, Sheng X, Pavia AT, Cannon-Albright L, Byington CL. Parapneumonic empyema deaths during past century, Utah. Emerg Infect Dis. (2009) 15:44–8. doi: 10.3201/eid1501.080618
23. Livingston MH, Cohen E, Giglia L, Pirrello D, Mistry N, Mahant S, et al. Are some children with empyema at risk for treatment failure with fibrinolytics? A multicenter cohort study. J Pediatr Surg. (2016) 51:832–7. doi: 10.1016/j.jpedsurg.2016.02.032
24. Maffey A, Colom A, Venialgo C, Acastello E, Garrido P, Cozzani H, et al. Clinical, functional, and radiological outcome in children with pleural empyema. Pediatr Pulmonol. (2019) 54:525–30. doi: 10.1002/ppul.24255
25. de Benedictis FM, Carloni I, Osimani P, Cobellis G, Martino A, Lanza C, et al. Prospective evaluation of lung function in children with parapneumonic empyema. Pediatr Pulmonol. (2019) 54:421–7. doi: 10.1002/ppul.24204
26. Stelle KA, Mornand A, Bajwa N, Vidal I, Anooshiravani M, Kanavaki A, et al. Should empyema with or without necrotizing pneumonia in children be managed differently? Health (Irvine Calif). (2017) 09:209–22. doi: 10.4236/health.2017.92014
Keywords: parapneumonic effusion, pleural empyema, pleural drainage, population-based study, length of stay
Citation: Moral L, Toral T, Clavijo A, Caballero M, Canals F, Forniés MJ, Moral J, Revert R, Lucas R, Huertas AM, González MC, García-Avilés B, Belda M and Marco N (2021) Population-Based Cohort of Children With Parapneumonic Effusion and Empyema Managed With Low Rates of Pleural Drainage. Front. Pediatr. 9:621943. doi: 10.3389/fped.2021.621943
Received: 27 October 2020; Accepted: 24 June 2021;
Published: 21 July 2021.
Edited by:
Silvia Bielsa, University Hospital Arnau de Vilanova, SpainReviewed by:
Philipp Agyeman, University of Bern, SwitzerlandArturo Solis-Moya, Dr. Carlos Sáenz Herrera National Children's Hospital, Costa Rica
Copyright © 2021 Moral, Toral, Clavijo, Caballero, Canals, Forniés, Moral, Revert, Lucas, Huertas, González, García-Avilés, Belda and Marco. This is an open-access article distributed under the terms of the Creative Commons Attribution License (CC BY). The use, distribution or reproduction in other forums is permitted, provided the original author(s) and the copyright owner(s) are credited and that the original publication in this journal is cited, in accordance with accepted academic practice. No use, distribution or reproduction is permitted which does not comply with these terms.
*Correspondence: Luis Moral, bG1vcmFsZ0BnbWFpbC5jb20=