 Xiaotian Chen1†
 Chunlan Liu2†Song Yang3†Yaming Yang4Yanchun Chen3Xianghai Zhao3Weiguang Zhu5Qihui Zhao5Chuan Ni5
 Xiangyuan Huang1
 Weili Yan1
 Chong Shen2*
 Harvest F. Gu6*
- 1Department of Clinical Epidemiology, Children's Hospital of Fudan University, Shanghai, China
- 2Department of Epidemiology, School of Public Health, Nanjing Medical University, Nanjing, China
- 3Department of Cardiology, People's Hospital of Yixing City, Affiliated Yixing People's Hospital of Jiangsu University, Yixing, China
- 4Center for Disease Control and Prevention of Yixing City, Yixing, China
- 5Center for Disease Control and Prevention of Suqian City, Suqian, China
- 6School of Basic Medicine and Clinical Pharmacy, China Pharmaceutical University, Nanjing, China
Objective: Growth hormone receptor (GHR) mediates most GH biological actions. This study is aimed to evaluate whether GHR fl/d3 polymorphism contributes to the inter-individual variability of growth and metabolism in healthy children and adolescents.
Methods: A total of 4,730 students aged 6-16 years from Yixing and Suqian City in China were included in this cross-sectional study. Height and body mass index (BMI) were transformed into the form of z-score corresponding to age and gender. Logistic regression was used to evaluate the associations of GHR fl/d3 polymorphism with height, BMI, metabolic traits, and hypertension by estimating the odds ratios (ORs) and 95% confidence intervals (CIs).
Results: GHR d3 allele was inversely associated with overweight, total cholesterol (TC) and triglyceride (TG) levels (OR [95% CI] for overweight: 0.754 [0.593-0.959], P = 0.021; OR [95% CI] for TC: 0.744 [0.614-0.902], P = 0.003; OR [95% CI] for TG: 0.812 [0.654-0.998], P = 0.047). GHR d3 allele was associated with decreased odds of pre-hypertension in boys (OR [95% CI]: 0.791 [0.645-0.971], P = 0.025), but associated with increased odds of pre-hypertension and hypertension in girls (ORs [95% CIs]: 1.379 [1.106-1.719], P = 0.004; OR [95% CI]: 1.240 [1.013-1.519], P = 0.037). Interaction of GHR fl/d3 polymorphism with gender contributed to increased odds of pre-hypertension and hypertension (interactive ORs [95% CIs]: 1.735 [1.214-2.481], P = 0.003; OR [95% CI]: 1.509 [1.092-2.086], P = 0.013). Stratification analysis showed that the correlation tendencies of GHR fl/d3 polymorphism and BMI with age were different between two cities with discrepant economic development levels.
Conclusion: GHR fl/d3 polymorphism is associated with growth, metabolism, and hypertension in children and adolescents with the gender specificity, and the genetic effect of GHR fl/d3 may be modified by the local socioeconomic levels.
Introduction
Growth hormone receptor (GHR), a member of the cytokine receptor family, mediates the majority of growth hormone (GH) biological actions (1), which plays a major role in the postnatal linear growth and metabolic activity during childhood and adolescence (2). In humans, there are two isoforms of recognized GHR transcripts, full-length GHR (GHR fl) and exon 3-deleted GHR (GHR d3) (3). It is of importance to investigate the genetic effects of GHR fl/d3 polymorphism on inter-individual variability of growth, metabolic traits, and blood pressure (BP) in general children and adolescent population.
Children growth and development is one of the important issues in public health (4). GH exerts multiple complex biological effects on carbohydrate and lipid metabolism such as decrease in insulin sensitivity, ensuing glucose intolerance, and protein anabolism (5). All these actions are mediated through its interaction with GHR. A previous study conducted in 48 Turner syndrome girls showed that, compared with GHR fl/fl and fl/d3 genotype, GHR d3 allele homozygote was associated with a unique GH responsiveness and had a lower body mass index (BMI) level (6). Another case-control study with 262 morbidly obese subjects reported that GHR d3 allele carriers had higher BMI than GHR fl allele individuals, but GHR fl/d3 polymorphism was not associated with any other components of metabolic syndrome (7). Another cohort study included 385 community healthy subjects followed from birth to adult life observed that GHR d3 allele was not associated with body height or weight in young adults (8), while these findings were contrary to Gao et al.'s findings performed in 715 children (9). Moreover, Turgut et al. found that systolic blood pressure (SBP) was significantly increased in GHR d3/d3 genotype carriers compared to GHR fl/d3 subjects in acromegalic patients (n = 35) (10). Park et al. also performed a genetic study in acromegalic patients (n = 30), but no significant association of GHR fl/d3 polymorphism and SBP or diastolic blood pressure (DBP) was found (11).
Thereby, results from the previous studies are contradictive, and no socioeconomic issue has been considered in those analyses. Our study was aimed to evaluate whether GHR fl/d3 polymorphism was associated with growth, metabolic traits, and hypertension risk with a relatively large healthy children and adolescent population.
Materials and Methods
Study Population
This is a cross-section study that initially included a total of 6,160 subjects aged 6-16 years using a cluster sampling approach from Yixing and Suqian City in China (12, 13), which are, respectively, located in southern and northern Yangtze river (Supplementary Figure 1). Yixing City has a higher economy development level than Suqian City. One survey in Suqian City was conducted from October to November 2008 (n = 2,373), while another one in Yixing City was done in September 2014 (n = 3,787). All subjects were students from the local primary and junior high schools in a routine healthy examination program. The students aged under 6 years (n = 457), over 16 years (n = 40), and those with an incomplete physical examination record (n = 345) or refused to draw blood samples (n = 588) were excluded. Eventually, 4,730 children and adolescents were included in this study. The study protocols were approved by the Research Ethics Committee of Nanjing Medical University.
Anthropometric Measurements
Anthropometric data including body height, weight, and BP were measured by standard methods (14). Body height was measured to the nearest 0.1 cm using a standard column stadiometer placed on a level ground. The students stood upright on bare feet, with heels together, and buttocks and back touching the meter rule. Body weight was measured to the nearest 0.1 kg using an electronic weightier, and the children were weighed wearing minimum clothing and without shoes. Both height and weight were measured twice. BMI value was calculated as weight (kg)/height squared (m2). Height and BMI were transformed to a z-score corresponding to age and gender (15), and normalized according to a nationwide study of height and weight standardized growth charts (16). All participants were classified into “height z-score < −1, −1 ≤ height z-score <1 and height z-score ≥1” groups, according to the World Health Organization (WHO) reference of height for different age and gender groups (17). In addition, subjects were divided into low body weight, overweight, and obesity groups based on the cut off points of the 3rd, 85th, and 95th centiles of BMI for age and gender (18, 19).
BP measurements were performed twice after resting for at least 5 min under a quiet position using the electronic sphygmomanometers (OMROM, HEM-7207, Dalian, China) according to a standard protocol (20). If the difference between these two measurements of either SBP or DBP was over 8 mmHg, an additional measurement was needed. Finally, the average values of two or three measurements of SBP and DBP were calculated for analysis. Likewise, BP value was transformed into BP z-score corresponding to age, gender, and height (21).
According to the reference values of “The Fourth Report on the Diagnosis, Evaluation, and Treatment of High Blood Pressure in Children and Adolescents” (22), the subjects were classified into normal BP, pre-hypertension, and hypertension groups. The normal BP group was defined as both SBP and DBP <90th percentile; average SBP and/or DBP at least 90th, but <95th, and/or SBP ≥ 120 or DBP ≥ 80 mmHg regardless of age, gender, and height was divided into the pre-hypertension group; the hypertension group was identified as the average SBP and/or DBP persistently above the 95th percentile, and/or SBP ≥ 140 or DBP ≥ 90 mmHg regardless of age, gender, and height.
Biochemical Indices
Non-fasting peripheral venous blood was retained, and serum TC, TG, and GLU concentrations were measured by an automated biochemical profiling (Mindray BS-800, Shenzhen, China). Because there were no specifical cut-off values to identify the relative high levels of TC, TG, and GLU in children and adolescents, we calculated the value of the 90th percentile of TC, TG, and GLU to classify the students into normal group and relative high-level group in the association analyses.
GHR fl/d3 Genotyping
DNA was extracted from the leukocyte of peripheral blood by using standard phenol-chloroform method (23). The polymerase chain reaction (PCR) method was used for genotyping GHR fl/d3 polymorphism in a 384-well plate. PCR was conducted in 10 μl of a reaction mixture containing about 10 ng of DNA sample, 1 μl reaction buffer, 1 μl MgCl2, 0.15 μl of platinum Taq DNA polymerase, and 100 pmol each of primer. This assay was carried out with primers G1, G2, and G3 (GenBank association no. AF155912) as follows (3): initial step of denaturation of 5 min at 95°C followed by 39 cycles consisting of 30 s at 95°C, 30 s at 64.8°C, 1 min 30 s at 72°C, followed by an extension period of 72°C for 10 min. Application of DNA fragments was analyzed by electrophoresis on a 1.5% agarose gel and visualized by ethidium bromide staining under ultraviolet (UV) light. The polymorphism detected by PCR was evident as a 592 bp fragment in the presence of the deletion (d3/d3) and a 935 bp product in the presence of the full-length fragment (fl/fl) of exon 3 in the GHR gene. Each sample was genotyped as GHR d3/d3, fl/d3, or fl/fl.
Statistical Analysis
Continuous variables were expressed as mean ± standard deviation (SD) or as median (interquartile range). Independent sample t-test and analysis of variance (ANOVA) were used to analyze differences in continuous variables with normal distribution. Mann–Whitney U-test and Kruskal–Wallis test were used to analyze differences in continuous variables with non-Gaussian distribution. A chi-square test (χ2) was used for comparison of nominal variables between groups.
In the primary analyses, multivariate logistic regression model was used to estimate the associations of GHR fl/d3 polymorphism with height z-score levels (reference group: −1 ≤ height z-score < 1 group), obesity (reference group: normal weight group), and hypertension (reference group: normotensive group), while the binary logistic regression model was applied in the analysis of GHR fl/d3 polymorphism with metabolic traits using additive (fl/fl vs. fl/d3 vs. d3/d3), dominant (fl/fl + fl/d3 vs. d3/d3), and recessive (fl/fl vs. fl/d3 + d3/d3) models. Odds ratio (OR) and 95% confidence interval (CI) were calculated to quantify these associations. In the secondary analyses, we explored the modification effect of socioeconomic levels on the associations of GHR fl/d3 polymorphism with childhood height, BMI, metabolic traits, and hypertension through a stratification analysis. To evaluate the relationship of GHR fl/d3 polymorphism and BMI z-score among the subjects in different age groups, the consecutive tendencies of predicted BMI z-score by age stratified by gender and region were separately depicted by using the quadratic prediction plot. Besides, to explore the potential interaction between GHR fl/d3 polymorphism and gender on hypertension risk, Breslow-Day test for heterogeneity was performed and interaction figures were depicted using R-package “desctools” and “meta.” All the statistical analysis above was performed using Stata version 16.0 (Stata Corp LLC, College Station, TX) and R package (version 3.6.1). Two-tailed P-value <0.05 was defined to be statistically significant.
Results
Characteristics of the Participants
Demographic and clinical characteristics according to the genotypes of the GHR exon 3 polymorphisms were summarized in Table 1. A total of 4,730 students (2,465 boys and 2,265 girls) were included in the current study, with an average (SD) age of 10.83 (2.96) years. Totally, the numbers of GHR fl/fl, fl/d3, and d3/d3 genotype carriers were 3,287 (69.5%), 1,267 (26.8%), and 176 (3.7%), respectively. The percentage of GHR fl/fl, fl/d3, and d3/d3 carriers was significantly different among boys and girls with a P-value of 0.024. But no significant difference of age, height z-score, BMI z-score, SBP z-score, DBP z-score, TC, TG, and GLU was found among the three GHR genotypes.
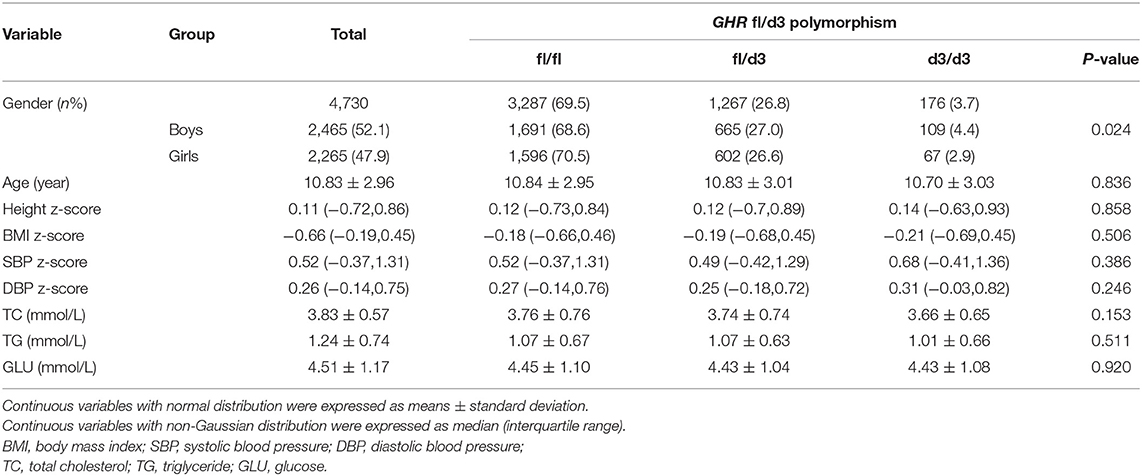
Table 1. Demographic and clinical characteristics for the participants.
Associations of GHR fl/d3 Polymorphism With Height, BMI, and Hypertension
No statistical association of GHR d3 polymorphism and height z-score was observed in total subjects. In boys, the GHR d3 allele was significantly associated with lower height z-score, and ORs (95% CIs) for the additive model and dominant model were 1.221 (1.009-1.478) and 1.285 (1.016-1.624) with P-values of 0.040 and 0.036, respectively (Table 2). In girls, an inverse association was observed between GHR d3 allele and height z-score, and ORs (95% CIs) for the additive model and dominant model were 0.773 (0.614-0.972) and 0.749 (0.577-0.972) with P-values of 0.028 and 0.030, respectively.
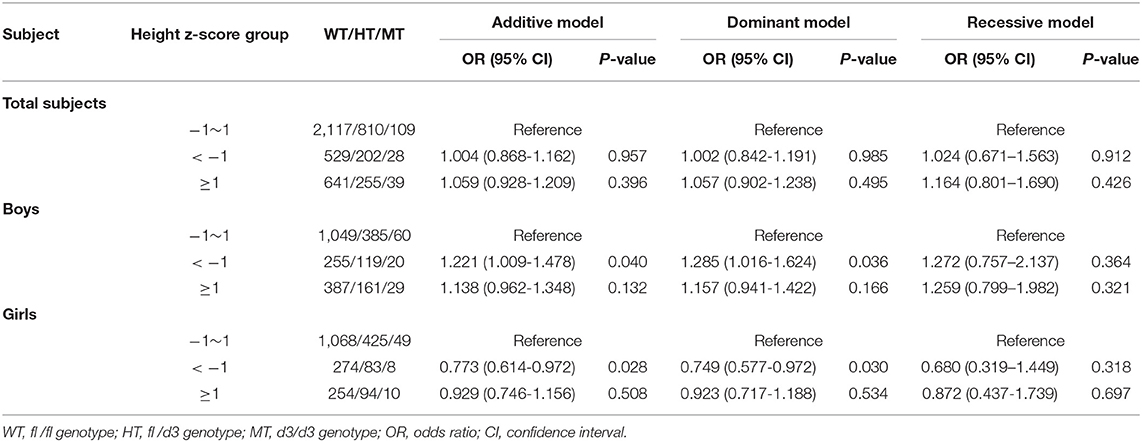
Table 2. Association analysis of GHR fl/d3 polymorphism with height.
GHR d3 allele variation was associated with decreased odds of overweight in the entire population and ORs (95% CIs) for the additive model and dominant model were 0.754 (0.593-0.959) and 0.738 (0.561-0.971) with P-values of 0.021 and 0.030, respectively (Table 3). In boys, similar association of GHR d3 allele with overweight was observed (OR [95% CI] for the additive model was 0.717 [0.515-0.998], P = 0.049), while no significant association was found in girls.
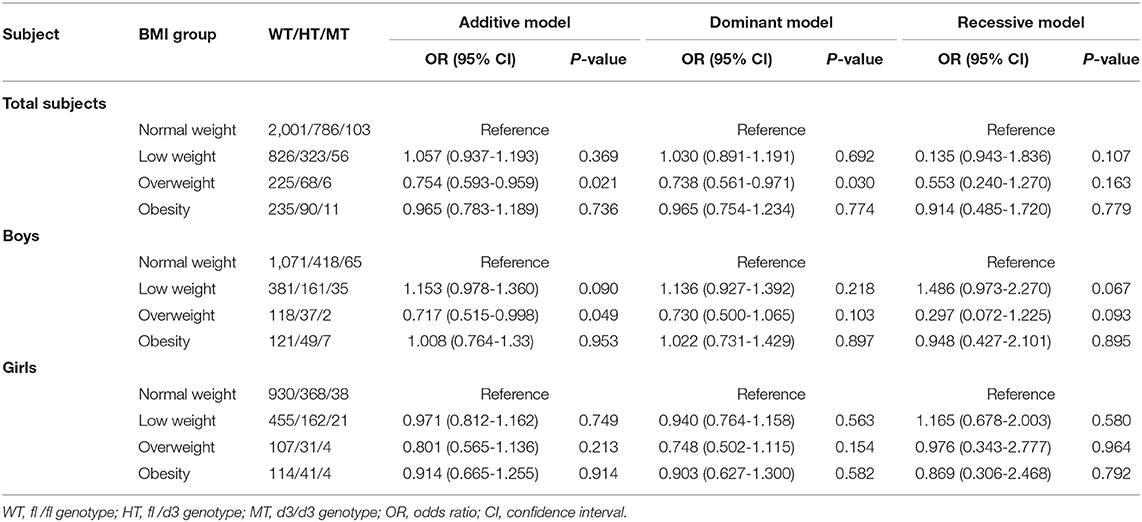
Table 3. Association analysis of GHR fl/d3 polymorphism with BMI.
No statistical associations of GHR d3 polymorphism with pre-hypertension or hypertension were observed in total subjects. Boys with GHR d3 allele were associated with decreased odds of pre-hypertension, and ORs (95% CIs) for the additive model and dominant model were 0.791 (0.645-0.971) and 0.777 (0.609-0.990) with P-values of 0.025 and 0.042, respectively (Table 4). In girls, GHR d3 allele was associated with increased odds of pre-hypertension and hypertension, and ORs (95% CIs) for the additive model were 1.379 (1.106-1.719) and 1.240 (1.013-1.519) with P-values of 0.004 and 0.037, respectively.
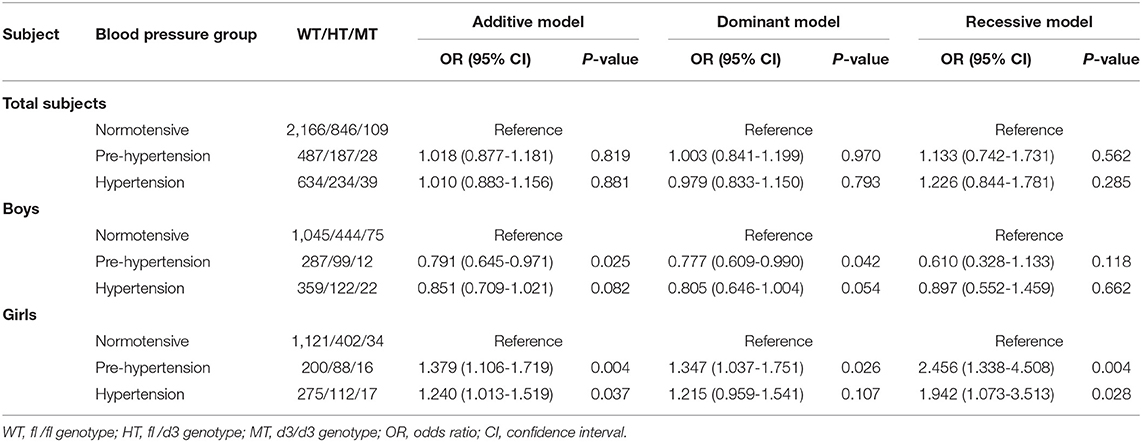
Table 4. Association analysis of GHR fl/d3 polymorphism with pre-hypertension and hypertension.
Associations of GHR fl/d3 Polymorphism With Metabolic Traits
In total population, GHR d3 allele was inversely associated with higher TC level, and ORs (95% CIs) of additive, dominant, and recessive models were 0.744 (0.614-0.902), 0.757 (0.608-0.942), and 0.372 (0.173-0.799) with P-values of 0.003, 0.013, and 0.011, respectively (Table 5). The significant association between GHR d3 allele and higher TC level was further observed in the subgroup of boys and girls, and ORs (95% CIs) of additive model were 0.742 (0.565-0.973) and 0.747 (0.568-0.982) with P-values of 0.031 and 0.037, respectively. GHR d3 allele was inversely associated with higher TG level and OR (95% CI) was 0.812 (0.654-0.998) with a P-value of 0.047.
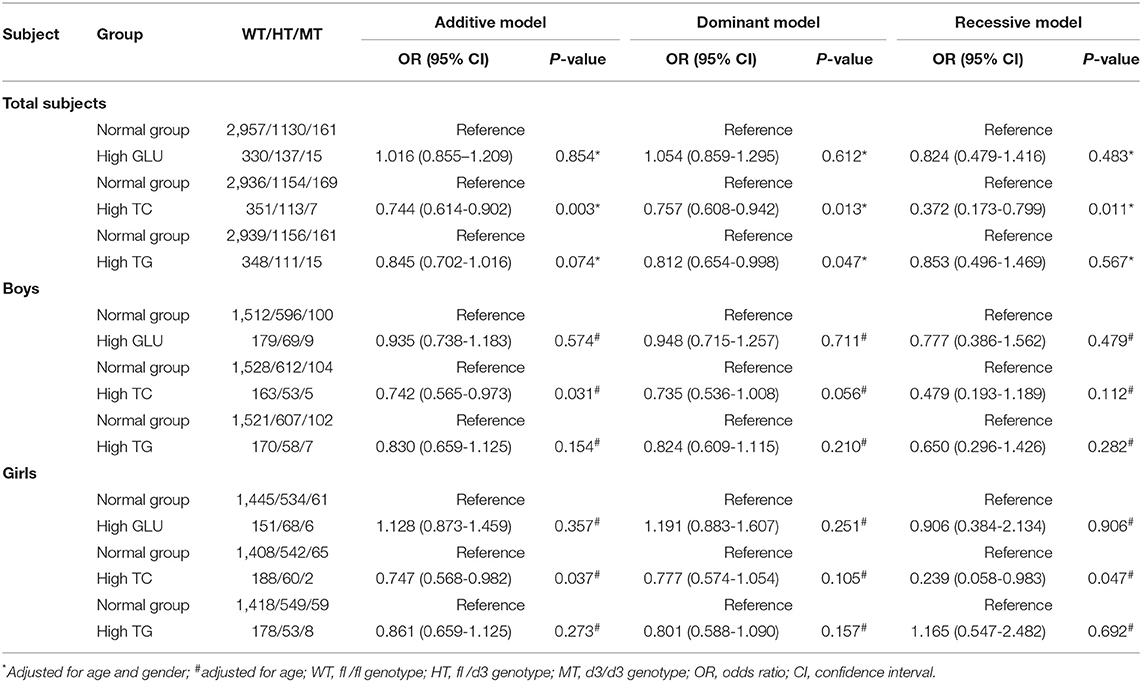
Table 5. Association analysis of GHR fl/d3 polymorphism with metabolic traits.
Stratification Analysis
Stratification analysis of GHR fl/d3 polymorphism with height, BMI, hypertension, and metabolic traits by region was performed (Supplementary Tables 1–4). GHR d3 variation was associated with increased odds of low BMI levels in Suqian boys and OR (95% CI) of additive model was 1.323 (1.034-1.693) with P-value of 0.026. GHR d3 allele was associated with reduced odds of overweight in Suqian girls, and OR (95% CI) for the dominant model was 0.456 (0.209-0.996) with P of 0.049. No significant associations between GHR d3 variation and height levels were observed among Yixing and Suqian students.
Compared with GHR fl/fl and fl/d3 genotypes, a unimodal shape of GHR d3/d3 on BMI z-score by age was visually observed in boys and girls (Supplementary Figure 2). This tendency of GHR d3/d3 on BMI was further displayed in Yixing and Suqian city (Supplementary Figure 3). After we stratified by region and gender, a similar effect of GHR fl/d3 and d3/d3 genotypes on BMI was observed in Yixing boys, while the effect of GHR d3/d3 on BMI was inversed in Yixing girls. For GHR fl/fl and fl/d3 carriers in Suqian, BMI z-score was decreased with the increase of age in boys, which was contrary to the d3/d3 genotype. In Suqian girls, the fluctuating range of GHR d3/d3 on BMI was obviously enlarged and its peak approximately appeared in the 10- or 11-year groups (Supplementary Figure 4).
GHR d3 allele was associated with reduced odds of pre-hypertension and hypertension in Yixing boys (ORs [95% CIs] for the additive model and dominant model: 0.750 [0.585-0.962], P = 0.023; 0.757 [0.587-0.976], P = 0.031; Supplementary Table 3). Conversely, GHR d3 allele was associated with increased odds of pre-hypertension and hypertension in Yixing girls (ORs [95% CIs] for the additive model: 1.366 [1.055-1.770], P = 0.018; 1.273 [1.009-1.606], P = 0.042). No significant associations were found between GHR fl/d3 polymorphism and hypertension in Suqian City.
Interaction Between GHR fl/d3 Polymorphism and Gender on Hypertension
Breslow-Day test showed significant interactive effects of GHR fl/d3 polymorphism and gender on pre-hypertension and hypertension risk existed, and the P-values of the homogeneity test were 0.002 and 0.013, respectively (Supplementary Figure 5). GHR fl/d3 dominant model had positive multiplicative interactions on pre-hypertension and hypertension (interactive ORs [95% CIs]: 1.735 [1.214-2.481], P = 0.003; 1.509 [1.092-2.086], P = 0.013; Supplementary Tables 5, 6).
Discussion
In the current study, we investigated the associations of GHR fl/d3 polymorphism with height, BMI, hypertension, and metabolic traits in healthy children and adolescents with the largest sample size. We observed the multiplicative interaction of GHR fl/d3 polymorphism with gender contributing to increased odds of pre-hypertension and hypertension and found that GHR d3 allele was likely to have a protective effect against high TC level. Furthermore, genetic effect of this polymorphism on BMI was inconsistent in different age groups, which may be modified by the local socioeconomic levels.
Hypertension in children and adolescents has been recognized as a challenge (24), to which genetic polymorphism and their interaction with environmental factors may contribute (25). Lack of GHR signaling causes a reduction in SBP and plasma renin levels as well as an increase in aortic eNOS expression (26). Animal studies showed GHR knockout mice led to a 25% reduction in SBP compared with wild-type mice (26). In the current study, we assessed the associations of this polymorphism with hypertension status in general childhood population. GHR d3 allele is found to be associated with decreased odds of pre-hypertension and hypertension in boys, while increased odds of pre-hypertension and hypertension in girls was observed. Furthermore, interaction between GHR fl/d3 polymorphism and gender on pre-hypertension and hypertension was first illustrated, suggesting genetic effects of this polymorphism may have a gender specificity.
Socioeconomy is a conspicuous environmental factor that affects physical growth in children. Yixing and Suqian are two cities located in south and north of the Yangtze River, China. Traditionally and currently, the socioeconomic level in Yixing is significantly higher than that in Suqian (Supplementary Figure 1). These two cities are different not only in geography but also in social developing stages from history until now. We thus separately analyzed the associations of GHR fl/d3 polymorphism with growth and metabolic traits in children and adolescents from Yixing and Suqian Cities. Data demonstrated that the carriers with GHR d3 allele are associated with low BMI levels in Suqian children. A similar trend of this association in Yixing children was observed but not statistically significant. These findings are consistent with the previous studies (9, 27). The association of GHR d3 allele with low BMI is speculated that biological function of this allele may increase lipolytic effect (28), which is helpful in keeping a relatively low body fat mass composition (29). We have further depicted the different GHR genotypes of BMI fluctuation among 6-16 years age groups in boys and girls. The large swing of BMI variation among GHR fl/d3 genotypes with age was displayed in Yixing and Suqian, indicating that genetic effects of GHR fl/d3 polymorphism on childhood BMI could be modified by the local socioeconomic levels.
A previous study has reported that GHR d3 allele had a 30% higher bioactivity than GHR fl allele (27). Data from the current study demonstrated that GHR d3/d3 on BMI had a larger fluctuation with age than fl/fl and fl/d3 genotypes. Together with the implication from the previous study (27), our data consistently suggest that GHR d3 allele may have a vital role on BMI in children and adolescents. A unimodal peak of GHR d3/d3 on BMI with age approximately appeared at 10 or 11 years group, indicating the relationship between GHR fl/d3 polymorphism and BMI is significantly different at puberty in boys and girls. Stratified by region and gender, compared with Suqian City, the effect of GHR d3/d3 genotype on BMI was relatively moderated in Yixing City. This finding may also support our postulate that socioeconomy modifies the genetic effect of GHR fl/d3 polymorphism on BMI. Furthermore, the direction of association of GHR d3 allele on height levels was opposite in boys and girls, further investigations to understand how puberty interacts with GH in the regulation of BMI and height could be taken into consideration.
Previous studies showed that no significant difference of lipids profile in GHR fl/d3 genotype carriers in children and adolescents was observed (7, 8). The relatively small sample sizes of those studies may be a likely reason for the null association. Whether GHR fl/d3 polymorphism associates with metabolic traits is still not well investigated. Our study presented GHR d3 allele may have a negative relationship with higher levels of TC and TG, suggesting that the GHR d3 allele may have a protective function against the abnormal lipid metabolism. One possible explanation is that the bioactivity of GHR regulated the carbohydrate and lipid metabolism via several downstream insulin signaling events (30).
Several limitations existed in this study. First, potential confounding factors, such as calorie intake and physical exercise, that may introduce bias by modifying the associations between GHR fl/d3 polymorphism, BMI, metabolic traits, and hypertension were not examined. Second, this population with Han nationality were from east China, the generalizability of our findings to other regions needs further validation. Third, in this study, the distribution of GHR fl/d3 polymorphism was deviated from Hardy-Weinberg equilibrium (HWE) in the total population. Nevertheless, we excluded the genotyping error by checking the raw data of the genotyping results among each batch, where no large deviation of GHR fl/d3 frequency among each batch was found. Thus, the interpretation of our findings could be convincing to some extent in the case of departure from HWE. Moreover, the exploratory nature of our study without a prespecified power calculation precludes us from drawing any confirmative conclusions.
In conclusion, the current study demonstrated that GHR fl/d3 polymorphism was associated with BMI, metabolism, and hypertension in children and adolescents, which may be modified by local socioeconomic levels.
Data Availability Statement
The datasets generated for this study are available on request to the corresponding author.
Ethics Statement
The studies involving human participants were reviewed and approved by Research Ethics Committee of Nanjing Medical University. Written informed consent to participate in this study was provided by the participants' legal guardian/next of kin.
Author Contributions
HG and CS proposed and designed the study. CL, XC, SY, CN, QZ, YY, YC, XZ, WZ, and QZ collected the data. CL, XC, XH, SY, and CS carried out all analyses. CL and XC wrote the draft. WY, CS, and HG edited the manuscript. All authors contributed to data interpretation, discussion, and revision of the article.
Funding
This work was supported by the National Natural Science Foundation of China (Grant Nos. 81872686 and 81573232), Jiangsu Provincial Fourth 333 Project, and the Priority Academic Program for the Development of Jiangsu Higher Education Institutions (Public Health and Preventive Medicine). The funders had no role in the design and conduct of the study, collection, management, analysis, interpretation of the data, preparation, review, or approval of the manuscript, and decision to submit the manuscript for publication.
Conflict of Interest
The authors declare that the research was conducted in the absence of any commercial or financial relationships that could be construed as a potential conflict of interest.
Publisher's Note
All claims expressed in this article are solely those of the authors and do not necessarily represent those of their affiliated organizations, or those of the publisher, the editors and the reviewers. Any product that may be evaluated in this article, or claim that may be made by its manufacturer, is not guaranteed or endorsed by the publisher.
Acknowledgments
We would like to thank the children and their parents, the teachers in Yixing and Suqian Cities for participating in this study. We thank Hailong Zhao, Lijun Zhu, Ting Zhang, and Jinbo Wen for their assistance in data collection and genotyping. We also thank physical examination staff from local hospitals for the anthropometric measurements.
Supplementary Material
The Supplementary Material for this article can be found online at: https://www.frontiersin.org/articles/10.3389/fped.2022.546080/full#supplementary-material
References
1. Laron Z. Natural history of the classical form of primary growth hormone (GH) resistance (Laron syndrome) J Pediatr Endocrinol Metab. (1999) 12(Suppl 1):231-49.
2. Veldhuis JD, Roemmich JN, Richmond EJ, Rogol AD, Lovejoy JC, Sheffield-Moore M, et al. Endocrine control of body composition in infancy, childhood, and puberty. Endocr Rev. (2005) 26:114-46. doi: 10.1210/er.2003-0038
3. Pantel J, Machinis K, Sobrier ML, Duquesnoy P, Goossens M, Amselem S. Species-specific alternative splice mimicry at the growth hormone receptor locus revealed by the lineage of retroelements during primate evolution. J Biol Chem. (2000) 275:18664-9. doi: 10.1074/jbc.M001615200
5. Moller N, Jorgensen JO. Effects of growth hormone on glucose, lipid, and protein metabolism in human subjects. Endocr Rev. (2009) 30:152–77. doi: 10.1210/er.2008-0027
6. Binder G, Trebar B, Baur F, Schweizer R, Ranke MB. Homozygosity of the d3-growth hormone receptor polymorphism is associated with a high total effect of GH on growth and a low BMI in girls with Turner syndrome. Clin Endocrinol. (2008) 68:567–72. doi: 10.1111/j.1365-2265.2007.03090.x
7. Espinosa E, Salame L, Marrero-Rodriguez D, Romero-Nieves AM, Cuenca D, Castelan-Martinez OD, et al. Expression of the growth hormone receptor isoforms and its correlation with the metabolic profile in morbidly obese subjects. Endocrine. (2019) 63:573–81. doi: 10.1007/s12020-018-1794-y
8. Martins CS, Fernandesrosa FL, Espineira AR, de Souza RM, De CM, Barbieri MA, et al. The growth hormone receptor exon 3 polymorphism is not associated with height or metabolic traits in healthy young adults. Growth Hormone IGF Res. (2014) 24:123–9. doi: 10.1016/j.ghir.2014.04.005
9. Gao LL, Zheng ZQ, Cao LF, Shen SX, Yang Y, Zhao ZH, et al. The growth hormone receptor (GHR) exon 3 polymorphism and its correlation with metabolic profiles in obese Chinese children. Pediatr Diabetes. (2011) 12:429–34. doi: 10.1111/j.1399-5448.2010.00747.x
10. Turgut S, Akin F, Ayada C, Topsakal S, Yerlikaya E, Turgut G. The growth hormone receptor polymorphism in patients with acromegaly: relationship to BMI and glucose metabolism. Pituitary. (2012) 15:374–9. doi: 10.1007/s11102-011-0329-9
11. Park H, Hwang I, Seo J, Kim S, Seo H, Lee I, et al. Association between the growth hormone receptor exon 3 polymorphism and metabolic factors in Korean patients with acromegaly. Endocrinol Metab. (2015) 30:312–7. doi: 10.3803/EnM.2015.30.3.312
12. Guo D, Shen C, Chen Y, Yang S, Wang L, Jin Y, et al. Polymorphisms of the TGFBRAP1 gene in relation to blood pressure variability and plasma TGF-beta1. Clin Exp Hypertens. (2015) 37:420–5. doi: 10.3109/10641963.2015.1013113
13. Chen XT, Yang S, Yang YM, Zhao HL, Chen YC, Zhao XH, et al. Exploring the relationship of peripheral total bilirubin, red blood cell, and hemoglobin with blood pressure during childhood and adolescence. J Pediatr. (2018) 94:532–38. doi: 10.1016/j.jpedp.2017.11.006
14. Lohman TJ, Roache AF, Martorell R. Anthropometric standardization reference manual. Med Sci Sports Exerc. (1991) 24:952. doi: 10.1249/00005768-199208000-00020
15. Kuczmarski RJ, Ogden CL, Guo SS, Grummerstrawn LM, Flegal KM, Mei Z, et al. 2000 CDC growth charts for the United States: methods and development. Vital Health Statistics 11. (2002) 246:1.
16. Li H, Ji CY, Zong XN, Zhang YQ. [Height and weight standardized growth charts for Chinese children and adolescents aged 0 to 18 years]. Zhonghua Er Ke Za Zhi. (2009) 47:487–92. doi: 10.3760/cma.j.issn.0578-1310.2009.07.003
17. Listed N. Physical Status: The Use and Interpretation of Anthropometry. Report of a WHO Expert Committee. Geneva: World Health Organization (1995).
18. Barlow SE, Dietz WH. Obesity evaluation and treatment: expert Committee recommendations. The Maternal and Child Health Bureau, Health Resources and Services Administration and the Department of Health and Human Services. Pediatrics. (1998) 102:E29.
19. Cole TJ, Flegal KM, Nicholls D, Jackson AA. Body mass index cut offs to define thinness in children and adolescents: international survey. BMJ. (2007) 335:194. doi: 10.1136/bmj.39238.399444.55
20. Perloff D, Grim C, Flack J, Frohlich ED, Hill M, Mcdonald M, et al. Human blood pressure determination by sphygmomanometry. Circulation. (1993) 88:2460–70. doi: 10.1161/01.CIR.88.5.2460
21. Yan W, Liu F, Li X, Wu L, Zhang Y, Cheng Y, et al. Blood pressure percentiles by age and height for non-overweight Chinese children and adolescents: analysis of the china health and nutrition surveys 1991–2009. BMC Pediatrics. (2013) 13:195. doi: 10.1186/1471-2431-13-195
22. National High Blood Pressure Education Program Working Group on High Blood Pressure in Children and Adolescents. The fourth report on the diagnosis, evaluation, and treatment of high blood pressure in children and adolescents. Pediatrics. (2004) 114:555. doi: 10.1542/peds.114.2.S2.555
23. Sambrook J, Russell DW. Isolation of high-molecular-weight DNA from mammalian cells using formamide, chapter 6.13. Cold Spring Harb Protoc. (2006). doi: 10.1101/pdb.prot3225
24. Danaei G, Finucane MM, Lin JK, Singh GM, Paciorek CJ, Cowan MJ, et al. National, regional, and global trends in systolic blood pressure since 1980: systematic analysis of health examination surveys and epidemiological studies with 786 country-years and 5.4 million participants. Lancet. (2011) 377:568–77. doi: 10.1016/S0140-6736(10)62036-3
25. Waken RJ, de Las Fuentes L, Rao DC. A review of the genetics of hypertension with a focus on gene-environment interactions. Curr Hypertens Rep. (2017) 19:23. doi: 10.1007/s11906-017-0718-1
26. Egecioglu E, Andersson IJ, Bollano E, Palsdottir V, Gabrielsson BG, Kopchick JJ, et al. Growth hormone receptor deficiency in mice results in reduced systolic blood pressure and plasma renin, increased aortic eNOS expression, and altered cardiovascular structure and function. Am J Physiol Endocrinol Metab. (2007) 292:E1418-25. doi: 10.1152/ajpendo.00335.2006
27. Dos Santos C, Essioux L, Teinturier C, Tauber M, Goffin V, Bougneres P. A common polymorphism of the growth hormone receptor is associated with increased responsiveness to growth hormone. Nat Genet. (2004) 36:720–4. doi: 10.1038/ng1379
28. Berryman DE, List EO. Growth hormone's effect on adipose tissue: quality versus quantity. Int J Mol Sci. (2017) 18:1621. doi: 10.3390/ijms18081621
29. van der Klaauw AA, van der Straaten T, Baak-Pablo R, Biermasz NR, Guchelaar HJ, Pereira AM, et al. Influence of the d3-growth hormone (GH) receptor isoform on short-term and long-term treatment response to GH replacement in GH-deficient adults. J Clin Endocrinol Metab. (2008) 93:2828–34. doi: 10.1210/jc.2007-2728
Keywords: gender specificity, GHR fl/d3 polymorphism, growth hormone receptor, metabolism, socioeconomic levels
Citation: Chen X, Liu C, Yang S, Yang Y, Chen Y, Zhao X, Zhu W, Zhao Q, Ni C, Huang X, Yan W, Shen C and Gu HF (2022) Gender Specificity and Local Socioeconomic Influence on Association of GHR fl/d3 Polymorphism With Growth and Metabolism in Children and Adolescents. Front. Pediatr. 10:546080. doi: 10.3389/fped.2022.546080
Received: 27 March 2020; Accepted: 24 January 2022;
Published: 23 March 2022.
Edited by:
Jean Marc Guile, University of Picardie Jules Verne, FranceReviewed by:
Ericka Trarbach, University of São Paulo, BrazilTiago Jeronimo Dos Santos, Instituto Hispalense de Pediatría, Spain
Copyright © 2022 Chen, Liu, Yang, Yang, Chen, Zhao, Zhu, Zhao, Ni, Huang, Yan, Shen and Gu. This is an open-access article distributed under the terms of the Creative Commons Attribution License (CC BY). The use, distribution or reproduction in other forums is permitted, provided the original author(s) and the copyright owner(s) are credited and that the original publication in this journal is cited, in accordance with accepted academic practice. No use, distribution or reproduction is permitted which does not comply with these terms.
*Correspondence: Chong Shen, c2MxMDBAMTI2LmNvbQ==; Harvest F. Gu, ZmVuZy5ndUBjcHUuZWR1LmNu
†These authors have contributed equally to this work