 Gang Yi Lee1,†
 Young-Ah Youn2,†
 Yong Hun Jang1Hyuna Kim1
 Joo Young Lee1Young Jun Lee3
 Minyoung Jung4*‡
 Hyun Ju Lee5,6,7*‡
- 1Department of Translational Medicine, Hanyang University Graduate School of Biomedical Science and Engineering, Seoul, Republic of Korea
- 2Department of Pediatrics, College of Medicine, Seoul St. Mary's Hospital, The Catholic University of Korea, Seoul, Republic of Korea
- 3Department of Radiology, Hanyang University Hospital, Hanyang University College of Medicine, Seoul, Republic of Korea
- 4Cognitive Science Research Group, Korea Brain Research Institute, Daegu, Republic of Korea
- 5Department of Pediatrics, Hanyang University Hospital, Hanyang University College of Medicine, Seoul, Republic of Korea
- 6Division of Neonatology and Development Medicine, Hanyang University Hospital, Seoul, Republic of Korea
- 7Hanyang Institute of Bioscience and Biotechnology, Hanyang University, Seoul, Republic of Korea
Early-life experiences play a crucial role in the development of the fronto-limbic regions, influencing both macro- and microstructural changes in the brain. These alterations profoundly impact cognitive, social-emotional functions. Recently, early limbic structural alterations have been associated with numerous neurological and psychiatric morbidities. Although identifying normative developmental trajectories is essential for determining brain alterations, only a few studies have focused on examining the normative trajectories in the fronto-limbic regions during preschool-aged children. The aim of this study was to investigate the structural-developmental trajectory of the fronto-limbic regions using the cortical thickness, volume, and subcortical volume in 57 healthy and typical preschool-aged children between 1 and 5 years and examined the early lateralization patterns during the development of the fronto-limbic regions. Regarding brain lateralization, remarkable asymmetry was detected in the volume of thalamus and the cortical regions excluding the lateral orbitofrontal cortex in the fronto-limbic regions. This study of preschool-aged children may fill the knowledge gaps regarding the developmental patterns and hemispheric asymmetries of the fronto-limbic regions between newborns and adolescents.
1 Introduction
Brain development is a complex process that includes micro- and macrostructural changes (1, 2), accompanied by regional structural brain changes. Structural cortical development begins in the fetal and changes significantly throughout life, overlapping nonlinear trajectories (3, 4). Cortex maturation involves its integration into the higher-order brain areas such as the frontal cortices following the development of lower-order somatosensory and visual cortices. This leads to an intricate and asynchronous developmental pattern, with the sequence influenced by phylogenetic factors and anatomical location (5). These brain morphological and microstructural changes can be indirectly quantified through MRI (6–8).
Cortical volume generally follows a logarithmic growth pattern in most regions over the preschool-aged range, reflecting the maturation and organization of neural connections and structures that underpin cognitive development (9). However, frontal and cingulate brain regions followed a quadratic trajectory with peak volume values obtained around 5–6 years of age (10). The phenomenon of cortical thinning is closely tied to the concept of neural connections such as synaptic pruning and intracortical myelination (2, 11). The development trajectories of cortical thickness differ across the brain in their functions and locations. The pattern of cortical thickness development in chronological development shows the largest peak at 1–2 years of age (12), followed by a logarithmic decreasing pattern in most regions until 6 years of age (13). However, that of several regions in the frontal and posterior regions exhibited increasing pattern, following a quadratic trajectory during childhood (10, 14).
The age of 1–5 years is considered a critical period for the emergence and development of various cognitive functions, with dynamic brain structural changes (15). The fronto-limbic regions were established and evolved into a crucial neural network as a critical process in early neurodevelopment (16). The period from 1 to 5 years old holds significance as it coincides with the emergence and initial refinement of the fronto-limbic circuit (17, 18). Moreover, it is the time when numerous developmental, behavioral, and intellectual disorders are thought to initially manifest (19, 20). Social cognitive functions are shaped by the neural network structure of the fronto-limbic regions, which is organized through complex interconnections between the frontal and subcortical regions (21). Although cognitive development is better understood through systemic changes in functional connectivity among various core regions (22), it is important to note that the fronto-limbic regions significantly contribute to diverse cognitive processes such as executive functions, decision-making, attention, and emotional regulation. Of note, many of the socio-emotional disorders are believed to arise during early neurodevelopment (19, 23) and are likely to be associated with or caused by abnormal cortical development of the fronto-limbic regions (24).
The early development of brain lateralization exhibits a multivariate nature, influenced by various exogenous factors, and raises questions regarding the generalizability of early brain lateralization patterns (25–27). The lateralization of the fronto-limbic regions appears to be organized for specialization in processing social information and emotional functioning in both children (28) and adults (29). Our previous study demonstrated the altered asymmetry of neonatal brain in the fronto-limbic regions connection is associated with social–emotional scores at 18 months of age, using diffusion tensor imaging tractography and structural network analysis. Alterations in lateralization within the frontal cortex, specifically related to reduced asymmetry in cortical thickness, could play a significant role in the early onset of autism spectrum disorder (ASD) in childhood (30). Greater asymmetry of the anterior cingulate correlated with a higher score inattention subscale of Barratt Impulsiveness Scale in adult patients with personality disorder than healthy controls (23). Recent studies show that an abnormal asymmetry in cortical thickness and volume may be linked to various neuropsychiatric conditions, such as attention deficit hyperactivity disorder (11, 31), schizophrenia (32, 33), and autism spectrum disorder (11). Understanding the developmental trajectory of cortical asymmetry and its regional variations may contribute to identifying deviations that may be associated with neurodevelopmental disorders or cognitive impairments.
Although brain lateralization of cortical volume (19, 34) and thickness (35, 36) has been extensively studied over the past few years, the intricate patterns of lateralization in children across the fronto-limbic regions remain a complex issue that has not been fully elucidated. The direction and magnitude of lateralization in the fronto-limbic regions during critical stages of childhood, as an evolutionary adaptation, remain unclear. Furthermore, owing to the challenges associated with acquiring and processing infant brain MRI data, our understanding of the evolving patterns of cortical volume and thickness and the age-related change in hemispheric lateralization is currently limited.
We investigated the structural-developmental trajectory and early lateralization patterns of the fronto-limbic regions by measuring the cortical thickness, volume, and subcortical volume in typically developing preschool-aged children aged between 1 and 5 years.
2 Materials and methods
2.1 Clinical characteristics
Eighty healthy and typically developing children aged 1–5 years were recruited from Hanyang University Hospital in Seoul, Korea (Supplementary Figure S1). Children who underwent a detailed neurological examination and developmental assessment conducted by a pediatrician at the Hanyang Inclusive Clinic for Developmental Disorders were recruited for this study between 2018 and 2021. The Institutional Review Board of Hanyang University Hospital approved the protocol and scanning procedures of this study, and informed consent was obtained from the parents of all children participating in the study. Developmental screening was performed during a routine health checkup using the Korean-Developmental Screening Test (K-DST) for children at the Hanyang University Medical Center Pediatrics Department. Children with developmental scores within 2 standard deviations of the mean on all subscales of the K-DST were included. We excluded 3 preschool-aged children with signs of developmental delay and known risk factors for abnormal development, such as complications during pregnancy, a family history of psychiatric or neurological disorders, pervasive developmental disorders, congenital malformations, chromosomal anomalies, and neurological events or disorders (e.g., head trauma or epilepsy). Also, 20 children were excluded from image quality check analysis due to motion artifacts and poor image quality. Finally, we used data from 57 children aged 14–71 months (Table 1).
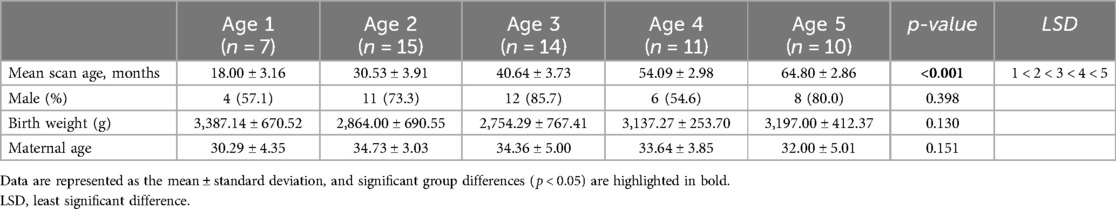
Table 1. Participant demographic information.
2.2 MRI acquisitions
Individuals underwent a 3 T MRI scan (Philips, Achieva, 16-channel phase-array head coil, Best, Netherlands) without sedation. On T1-weighted images, the single-shot three-dimensional echo-planar images were acquired using the following parameters: slice thickness = 1 mm, voxel sizes = 0.9 mm2, field of view = 224 mm2, repetition time = 8.3 ms, echo time = 4.6 ms, inverse time = 1 ms, and flip angle = 8°. The slice orientation was axially parallel to the anterior-posterior commissure line.
2.3 Image preprocessing
Automated reconstruction and segmentation of T1-weighted images were conducted using FreeSurfer version 7.2.0. This pipeline enables motion correction, automated Talairach transformation, non-brain tissue removal, signal intensity normalization, automated topological defect correction, subcortical segmentation, and cortical parcellation. To reduce the influence of low-frequency signal intensity nonuniformity when generating the original surface, bias field estimation was performed on the T1-weighted images using the N4 bias field correction of Advanced Normalization Tools (37). The cerebral cortex was parcellated into 68 anatomical regions (34 bilateral regions) according to the Desikan-Killiany Atlas.
2.4 Image quality check
Due to the challenges associated with cortical surface parcellation in the developing brain, two independent researchers conducted automatic and manual quality assessments in five steps on all reconstructed imaging data (Supplementary Figure S2). The initial visual inspection categorized motion artifacts, ghosting, and ringing in the raw imaging data into three ratings: good, moderate, and bad (38–40) (Supplementary Figure S3). Of these, data in the bad ratings was excluded from further processing.
Given the rapid and considerable development of the brain during preschool-aged children, special consideration is essential to examine the contrast imaging and brain morphology in preschool-aged children (26). In this study, we identified the remaining images that underwent visual assessment using Quality Assurance (QA) tools and ENIGMA (Enhancing Neuro Imaging Genetics through Meta-Analysis) algorithms, generating quantitative and qualitative information regarding the image quality. The two automatic assessments are as follows: First, all subcortical segmentation of regional volumes was evaluated through the QA tools to identify the potential outliers at the individual level within the population. Second, we plotted the cortical surface segmentation to provide qualitative information by combining snapshots of inner and outer slices through ENIGMA algorithms.
Additionally, errors with brain segmentation may arise because of inaccuracies in children's white matter (WM) intensity during intensity normalization. To avoid this, we used control points manually to regulate the WM hypointensities for identified subjects, keeping it within the range of 80–110 (27). Finally, to maximize accuracy, two independent researchers conducted visual inspections of the reanalyzed images to select the final set of images for inclusion.
2.5 Image processing
Preschool-aged children with neurological disorders, history of neurological or psychiatric disorders, or negative results on brain MRI were excluded. Our study focuses on the most relevant regions of interest, specifically within the fronto-limbic neural circuitry. The 11 regions of interest were chosen based on previously identified areas associated with executive function, decision-making, attention, and emotion regulation (16, 41, 42). The region of interest (ROI)s used in this study were the 11 fronto-limbic regions: the subcortical regions of the thalamus, amygdala, and hippocampus; the rostral anterior cingulate cortex (rostral ACC), caudal anterior cingulate cortex (caudal ACC) and posterior cingulate cortex (PCC) through the medial and lateral orbitofrontal cortex (medial OFC and lateral OFC); and the superior temporal gyrus (STG), inferior parietal cortex (IPC), and fusiform. ROI approach was used to extract the fronto-limbic regions according to the Desikan-Killiany Atlas. As a significant correlation was observed between the regional volume measurements and the estimated total intracranial volume (eTIV), all the regional volumes were divided by eTIV, and multiplied by 1,000 to normalize the individual variations in skull size to reduce interindividual variation and minimize subtle distortions in brain imaging. The relative volume was determined as follows:
For cortical thickness, we analyzed the widely used absolute value and obtained the relative cortical thickness for each area of the brain by dividing it by the mean cortical thickness within the same hemisphere.
2.6 Statistical analysis
To evaluate cortical maturation with age between 1 and 5 years, we used a generalized additive model (GAM) adjusting for sex to detect nonlinear patterns between age and brain measures. The GAM is ideal for addressing the internal dependency structure of the data, including regional correlations in volume and thickness, as well as potential non-Gaussian distributions (43, 44). GAM effectively captures nonlinearities and variations, allowing for flexible and precise estimation of nonlinear effects. We have applied the GAM model to investigate the relationship between cortical measurements and age (in months) over a 5-year period. This method is particularly valuable for analyzing the rapid developmental changes in preschool-aged children, where complex nonlinear patterns arise due to both macrostructural and microstructural brain changes. The R package (45) was used to visualize the non-linear trajectory across all ages. Additionally, we evaluated the Bayesian information criterion to identify the most parsimonious model fit. For multiple comparisons, the significant p-value was adjusted using FDR-corrected across eight brain regions for cortical thickness and eleven brain regions for volume, respectively.
An asymmetry index (AI) was calculated to characterize lateralization during cortical maturation, determining the thickness and volume of 11 fronto-limbic brain regions for each individual. The following equation was used:
The AI values of the two measures were analyzed using a sliding window approach with age to identify the specific age intervals of significant asymmetric cortical development. By ordering the participants according to the number of months, the average AI at 12-month intervals was calculated. The Wilcoxon signed-rank test (46) was used to measure the level of left-right lateralization of the groups, with the null hypothesis centered on an asymmetric mean of zero.
3 Results
3.1 Brain tissue volumes
The sample (n = 57) in this study was included 41 male and 16 female. Supplementary Figure S4A shows the eTIV of the five age-groups. The eTIV exhibited an increasing pattern from 1 to 5 years. No significant year-by-year change was observed among 5 groups, aged 1 to 5 years (p = 0.180, p = 1.000, p = 0.213, and p = 0.756, respectively). However, significant difference was observed between the ages 1 and 4 years and between the ages 1 and 5 years (p = 0.023 and p = 0.049, respectively). The relative and absolute values (original volume × 1,000/eTIV) of the five groups in the total gray matter, subcortical gray matter, cerebral cortex, and cerebral WM. They are shown in Supplementary Figure S4B and Table S1, respectively.
3.2 Maturation trajectories of the fronto-limbic volume and thickness
To characterize maturation in the fronto-limbic thickness and volume from 1 to 5 years, GAM models were fit to the data. In relative cortical volume, we found that cortical volume followed diverse trajectories with gradual increases throughout the fronto-limbic regions (Supplementary Figures S5A,B). Additionally, growth curves in relative cortical thickness showed a progressive decreasing pattern compared to cortical volume across age (Supplementary Figure S6). Also, the subcortical volume was found to increase over the preschool-aged range (Supplementary Figure S5C).
The results of GAM models revealed that the effective degree of freedom (edf) values, which indicate model complexity, were significantly correlated with age in some brain regions in cortical thickness, and subcortical volume (Figure 1). We observed that the cortical thickness revealed significantly decreasing pattern in the right rostral ACC (edf = 1.0, F = 6.906, p = 0.032); medial OFC in both the left (edf = 1.839, F = 11.88, p < 0.001) and right (edf = 1.792, F = 6.542, p = 0.016) hemispheres; and an increasing pattern in the right STG (edf = 2.651, F = 4.56, p = 0.032). Subcortical volume, which is significantly pronounced in preschool-age children in the right hippocampus (edf = 1.0, F = 11.65, p = 0.006), and amygdala in both the left (edf = 1.0, F = 10.74, p = 0.022) and right (edf = 1.0, F = 19.04, p = 0.001) hemispheres. The edf results and statistical values of each brain region are shown in Supplementary Tables S2 and S3.
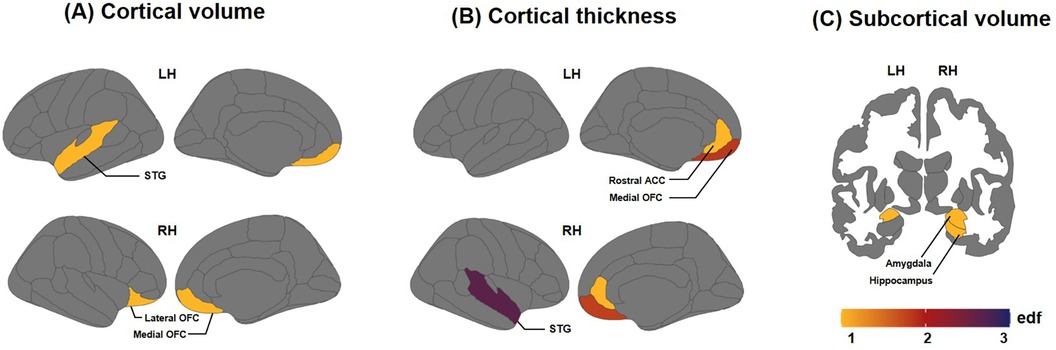
Figure 1. Effective degree of freedom (edf) values of brain regions showing significant correlations between brain measures and age (months). The edf reflects the degrees of curvature of smooths: (A) edf values for cortical volume, (B) edf values for cortical thickness, and (C) edf values for subcortical volume. Edf = 1 indicates a linear relationship; edf > 1 signifies more intricate associations between brain measures and age.
3.3 Asymmetries of the fronto-limbic volume and thickness
Figure 2 provides a schematic analysis of average brain asymmetries across all children. Left-ward asymmetry in cortical volume was observed in the STG, rostral ACC, and fusiform. Conversely, right-ward volume asymmetry was found in the IPC, caudal ACC, PCC, and medial OFC (Figure 2A). In terms of cortical thickness, conspicuous left-ward lateralization was evident in most of the fronto-limbic regions, except for the STG and rostral ACC (Figure 2B). Regarding the volume of subcortical regions, the thalamus and hippocampus showed prominent left-ward asymmetry, while the amygdala revealed right-ward asymmetry (Figure 2C).
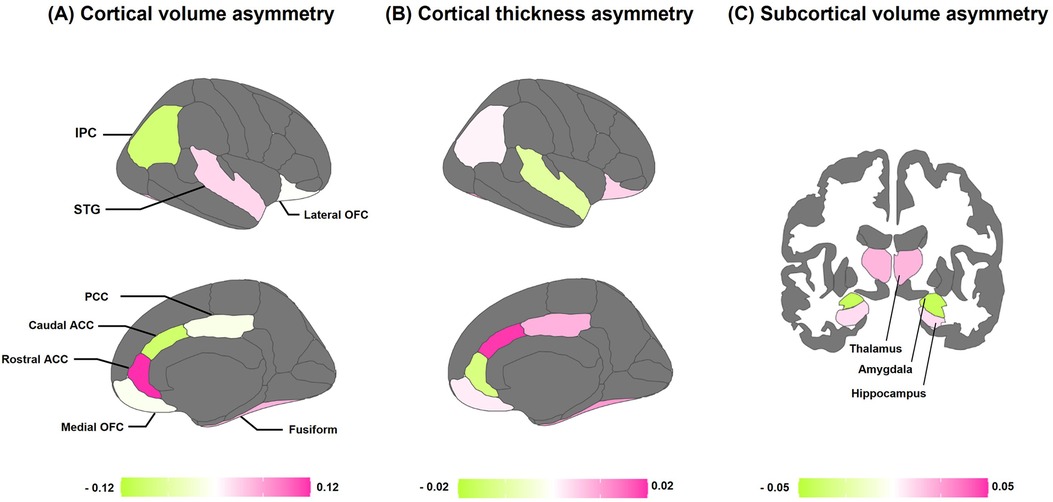
Figure 2. Average asymmetries of the fronto-limbic regions. (A) Population average regional asymmetries of cortical volume. (B) Population average regional asymmetries of cortical thickness. (C) Population average regional asymmetries of subcortical volume. Colors indicate the directions of average interhemispheric differences, with pink indicating left-ward asymmetry (i.e., a greater left-ward than right-ward measure), and green indicating right-ward asymmetry (i.e., a greater right-ward than left-ward measure). ACC, anterior cingulate cortex; PCC, posterior cingulate cortex; OFC, orbitofrontal cortex; STG, superior temporal gyrus; IPC, inferior parietal cortex; fusiform, fusiform gyrus.
3.4 Age-related structural asymmetries of the fronto-limbic volume and thickness
The differences between the left and right hemispheres in age-related asymmetries are shown in Figure 3 and Table 2. Significant left-ward asymmetry of cortical volume was observed in the rostral ACC (p = 0.021), STG (p = 0.038), and fusiform (p = 0.020). In contrast, right-ward volume asymmetry was observed in the caudal ACC (p = 0.011), PCC (p = 0.041), medial OFC (p = 0.023), and IPC (p = 0.021) before the age of 5 years (Figure 3A). In cortical thickness, the PCC (p = 0.039), IPC (p = 0.047), and fusiform (p = 0.016) showed considerable left-ward lateralization before the age of 5 years (Figure 3B). Meanwhile, apparent asymmetry was not noted in the cortical thickness or volume of the lateral portions of the OFC. The volume of the subcortical regions in the thalamus was revealed (p = 0.027) (Figure 3C).
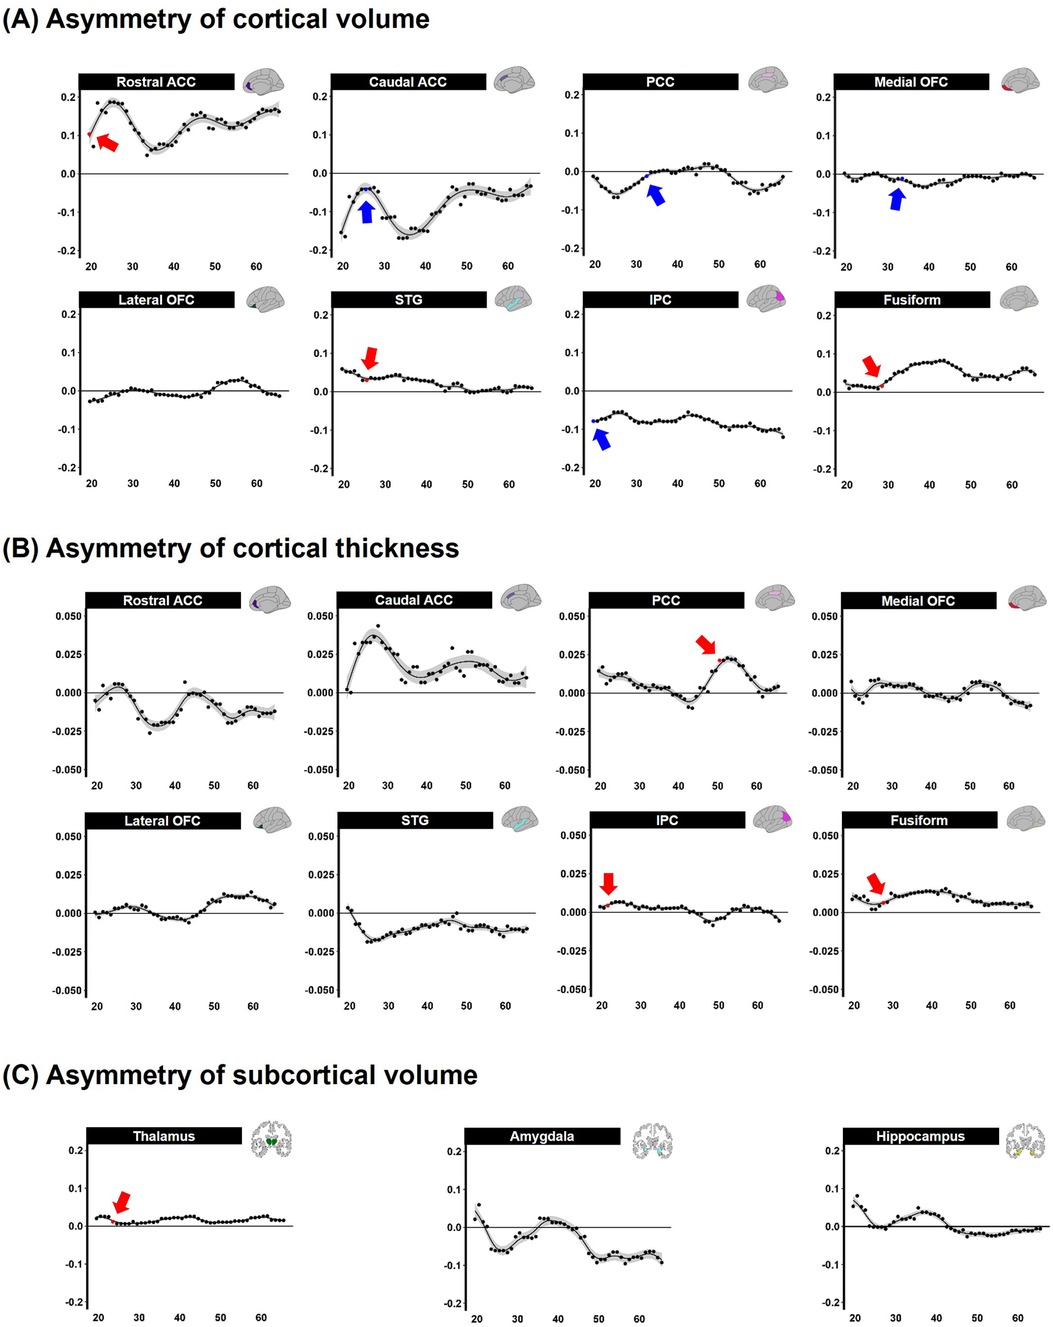
Figure 3. Sliding window analysis of normalized brain asymmetry. (A) Analysis of cortical gray matter volume asymmetry. (B) Analysis of cortical thickness asymmetry. (C) Analysis of subcortical gray matter volume asymmetry. All the points exhibit the asymmetry index calculated for each region within the sliding window analysis; positive score indicates left-ward asymmetry (Red point and arrow represent significant left asymmetry), while negative score indicates right-ward asymmetry (Blue point and arrow represent significant right asymmetry). ACC, anterior cingulate cortex; PCC, posterior cingulate cortex; OFC, orbitofrontal cortex; STG, superior temporal gyrus; IPC, inferior parietal cortex; fusiform, fusiform gyrus; FDR, false discovery rate; LSD, least significant difference.
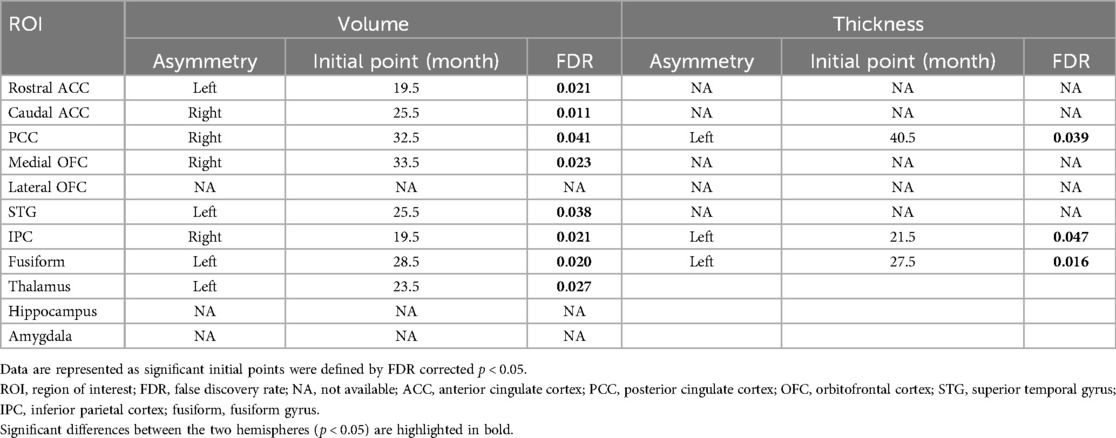
Table 2. Sliding window analysis of the fronto-limbic asymmetry.
4 Discussion
This study revealed the normative trajectory and emergence of structural asymmetry in the fronto-limbic regions of preschool-aged children. Our study showed age-related variations in brain volume and thickness within distinct regions of the fronto-limbic. Cortical thinning of the bilateral medial OFC and right rostral ACC was significantly observed during preschool childhood. Additionally, our findings indicate a significant increase in bilateral amygdala and right hippocampus volume among preschool children, following an upward linear pattern. Regarding brain lateralization, remarkable asymmetry was detected in the volume of thalamus and the most of cortical regions excluding the lateral OFC. These results on typical brain development offer valuable insights for the timing of the fronto-limbic neurodevelopmental trajectory.
Our study demonstrated a progressive annual thinning of most fronto-limbic regions between the ages of 1 and 5. This observation aligns with previous research findings regarding the changes in cortical thickness during early childhood (10, 47). Cortical thinning is linked to intricate processes such as synaptic pruning and intracortical myelination (2, 48). Across early childhood, this phenomenon is considered a normal aspect of brain maturation (49). Of the fronto-limbic regions, our result revealed that cortical thickness of the bilateral medial OFC and right rostral ACC exhibited significant decreases with age. The cortical thickness of medial OFC stands out as the earliest region to reach its peak at the second year of age (12, 50), following a logarithmic decrease until 6 years of age (8). Interestingly, a study comparing developmental changes in children with ASD identified significant alterations in the cortical thickness of the medial OFC compared to healthy and typical children (51). These findings may suggest the importance and potential role of the medial OFC trajectory in delineating early growth in healthy and typical children, and emphasize the medial OFC as an indicator of neurodevelopmental disorders and normal early development. Additionally, STG in cortical thickness has been showed notable positive relationships with age in preschool children. The reason for these trends is unclear, but it could indicate a simultaneous logarithmic increase in cortical maturation and adjacent WM myelination from 1 to 6 years of age (8).
With the gray matter volume, there was significant association between age and the relative volume of the bilateral amygdala until 5 years of age, with steep positive association with age. A previous study involving 1–6-year-old children showed evidence of a significantly accelerating trend in amygdala volume at 4–5 years (12). Furthermore, another study focusing on individuals aged 8–30 demonstrated a consistent linear increase in amygdala volume with age (52). Considering that the most rapid and dramatic changes in subcortical volume occur during childhood (4), this study suggests that the observed increase in volume, reflecting amygdala maturation, may mark a pivotal point in functional significance from a typical preschool-age-related morphometric pattern.
Other than increased volume and thinned thickness, structural lateralization is a multifaceted phenomenon that facilitates effective information processing (25). The early stages of brain lateralization are closely tied to the subsequent maturation of specific cognitive and socio-emotional functions (25). Although various studies have investigated the asymmetric changes in the cerebral cortex across the lifespan (10, 53, 54), they have not identified the specific time points at which age-related changes in the brain thickness and volume of the fronto-limbic regions. We explored the asymmetry in volume and thickness within the fronto-limbic regions across ages. This study revealed that most fronto-limbic regions display a noticeable emergence of cortical volume asymmetry before the age of 5 years. This observation suggests that establishing lateralization in these regions may constitute a crucial structural and functional development stage. Regarding cortical volume, left-ward prominence was observed in the STG at the age of 2–3 years. During the early fetal development, specifically between 20 and 28 gestational weeks, right-ward volume asymmetry in the STG was evident in the specific posterior regions near the lateral temporal gyrus (55). However, the STG typically exhibits left-ward hemispheric volume asymmetry in both children and adults (54, 56). The results of this study suggest an asymmetric shift in the STG around 2–3 years of age; this may suggest a period of important change in cortical volume lateralization, shifting the right hemisphere to the left hemisphere. Moreover, the significant left-ward lateralization of the rostral ACC corresponds with the results of previous studies examining childhood (10) and adolescence (57), suggesting that structural and functional development can occur early after birth.
The majority of the fronto-limbic regions demonstrate asymmetric development in cortical volume before the age of 5, whereas significant asymmetry in cortical thickness is observed exclusively in the PCC, IPC and fusiform. The PCC is located in the medial portion of the inferior parietal lobe and is connected to the parietal lobe (58), where it receives information from it (59). The significant lateralization of the IPC and PCC is consistent with the functional development of the human brain, in which the sensory-motor systems are located posteriorly and mature before executive functions (5). Interestingly, the cingulate cortex, which is highly cytoarchitectonically and anatomically heterogeneous area (60, 61), exhibited different asymmetries in the same internal structures (62). Previous study found that brain metabolite ratios and types influenced gray matter development in adolescents (63). These are believed to indicate that the manifestation of divergent metabolite patterns influences gray matter development, leading to diverse asymmetries within specific internal structures (ie. caudal, rostral, and posterior). Notably, they revealed that cognitive variations, attributed to differences in both the types and levels of metabolites, became apparent in the PCC (63). On the other hand, the OFC did not show significant asymmetries in both cortical volume and thickness during childhood. These findings suggest that the frontal lobe undergoes a more prolonged maturation process involving both functional and structural reorganizations than the executive functions; moreover, functional specialization of the frontal lobe, marked by the emergence of cortical asymmetry, may signify a significant developmental milestone after preschool-aged children.
For subcortical volume asymmetry, our study demonstrated that the thalamus had significant left-ward asymmetry in preschool-aged children (age: 2 years), which is remarkably consistent in the left hemisphere from birth to adulthood (25, 64). Meanwhile, a study between childhood and adolescents with ASD identified atypical right-ward asymmetry in the thalamus as an important region underlying the anatomical basis of social deficits (65). These inconsistent findings may be related to alterations in the subcortical-cortical relays, potentially leading to changes in functional connectivity and thereby impacting social interactions (24). Although the generalizability of thalamic asymmetry has not been fully explored, this study highlights the importance of early stages in the structural and functional development of the thalamus in brain lateralization for developmental milestones.
In conclusion, we quantitatively analyzed trajectories of the cortical thickness, cortical volume and subcortical volume. Furthermore, we identified the emergence point of brain lateralization in the fronto-limbic regions during preschool-aged children. These findings suggest that the fronto-limbic structures of the preschool-aged period may be potentially associated with the cognitive and socio-emotional development in subsequent stage. Given that the fronto-limbic regions are closely associated with various neurodevelopmental disorders, identifying its trajectories and asymmetries provides critical insights regarding clinical development for preschool-aged children.
5 Limitation
This study has several limitations that should be addressed in future research. First, this study had a small sample size and analyzed a cross-sectional scan along with non-uniform sample sizes across different age groups, which may restrict the interpretation of the results. Second, a potential concern for our study is the use of FreeSurfer standard templates in preschool-aged children, which may result in inaccuracies in segmentation and parcellation. We should interpret our FreeSurfer analysis results in preschool-aged children with caution and consider using pediatric-specific tools or templates in future studies. Third, cognitive development is more effectively explained by systematic changes among various core regions than by the maturation of individual core structures. Hence, further study would be needed for a network-based approach, elucidating the maturational changes in structural connectivity by exploring the maturation of different core regions. Finally, analyzing cortical volume, thickness and subcortical volume as indicators of brain structure may not be sufficiently comprehensive in capturing the complexity of maturation that occurs in early childhood. Therefore, neuroimaging studies including various aspects of the brain metrics such as surface area, curvature and gyrification would be more valuable to achieve a comprehensive understanding the mechanisms of brain development.
Data availability statement
The original contributions presented in the study are included in the article/Supplementary Material, further inquiries can be directed to the corresponding authors.
Ethics statement
The studies involving humans were approved by The Institutional Review Board of Hanyang University Hospital. The studies were conducted in accordance with the local legislation and institutional requirements. Written informed consent for participation in this study was provided by the participants’ legal guardians/next of kin.
Author contributions
GL: Writing – original draft, Conceptualization, Investigation, Visualization, Methodology, Validation. Y-AY: Writing – review & editing, Conceptualization, Investigation, Validation. YJ: Writing – original draft, Formal Analysis, Methodology, Software. HK: Writing – original draft, Data curation, Formal Analysis. JL: Writing – original draft, Data curation, Visualization. YL: Writing – review & editing, Validation. MJ: Writing – original draft, Conceptualization, Project administration, Resources, Funding acquisition. HL: Writing – original draft, Conceptualization, Project administration, Resources, Supervision.
Funding
The author(s) declare that no financial support was received for the research, authorship, and/or publication of this article.
Acknowledgments
This work was supported by National Research Foundation of Korea grants funded by the Korean Government MSIT (NRF-2023R1A2C2006038 and M3E5D9080787) and the KBRI Basic Research Program through the Korea Brain Institute funded by the Ministry of Science and ICT (24-BR-05-01).
Conflict of interest
The authors declare that the research was conducted in the absence of any commercial or financial relationships that could be construed as a potential conflict of interest.
Publisher's note
All claims expressed in this article are solely those of the authors and do not necessarily represent those of their affiliated organizations, or those of the publisher, the editors and the reviewers. Any product that may be evaluated in this article, or claim that may be made by its manufacturer, is not guaranteed or endorsed by the publisher.
Supplementary material
The Supplementary Material for this article can be found online at: https://www.frontiersin.org/articles/10.3389/fped.2024.1362409/full#supplementary-material
References
1. Giedd JN, Blumenthal J, Jeffries NO, Castellanos FX, Liu H, Zijdenbos A, et al. Brain development during childhood and adolescence: a longitudinal MRI study. Nat Neurosci. (1999) 2(10):861–3. doi: 10.1038/13158
2. Sowell ER, Thompson PM, Leonard CM, Welcome SE, Kan E, Toga AW. Longitudinal mapping of cortical thickness and brain growth in normal children. J Neurosci. (2004) 24(38):8223–31. doi: 10.1523/JNEUROSCI.1798-04.2004
3. Thatcher RW, Walker RA, Giudice S. Human cerebral hemispheres develop at different rates and ages. Science. (1987) 236(4805):1110–3. doi: 10.1126/science.3576224
4. Bethlehem RAI, Seidlitz J, White SR, Vogel JW, Anderson KM, Adamson C, et al. Brain charts for the human lifespan. Nature. (2022) 604(7906):525–33. doi: 10.1038/s41586-022-04554-y
5. Gogtay N, Giedd JN, Lusk L, Hayashi KM, Greenstein D, Vaituzis AC, et al. Dynamic mapping of human cortical development during childhood through early adulthood. Proc Natl Acad Sci U S A. (2004) 101(21):8174–9. doi: 10.1073/pnas.0402680101
6. Cecil KM, Brubaker CJ, Adler CM, Dietrich KN, Altaye M, Egelhoff JC, et al. Decreased brain volume in adults with childhood lead exposure. PLoS Med. (2008) 5(5):e112. doi: 10.1371/journal.pmed.0050112
7. Pienaar R, Fischl B, Caviness V, Makris N, Grant PE. A methodology for analyzing curvature in the developing brain from preterm to adult. Int J Imaging Syst Technol. (2008) 18(1):42–68. doi: 10.1002/ima.20138
8. Croteau-Chonka EC, Dean DC 3rd, Remer J, Dirks H, O'Muircheartaigh J, Deoni SCL. Examining the relationships between cortical maturation and white matter myelination throughout early childhood. Neuroimage. (2016) 125:413–21. doi: 10.1016/j.neuroimage.2015.10.038
9. Gilmore JH, Knickmeyer RC, Gao W. Imaging structural and functional brain development in early childhood. Nat Rev Neurosci. (2018) 19(3):123–37. doi: 10.1038/nrn.2018.1
10. Remer J, Croteau-Chonka E, Dean DC 3rd, D'Arpino S, Dirks H, Whiley D, et al. Quantifying cortical development in typically developing toddlers and young children, 1–6 years of age. Neuroimage. (2017) 153:246–61. doi: 10.1016/j.neuroimage.2017.04.010
11. Postema MC, Hoogman M, Ambrosino S, Asherson P, Banaschewski T, Bandeira CE, et al. Analysis of structural brain asymmetries in attention-deficit/hyperactivity disorder in 39 datasets. J Child Psychol Psychiatry. (2021) 62(10):1202–19. doi: 10.1111/jcpp.13396
12. Wang F, Lian C, Wu Z, Zhang H, Li T, Meng Y, et al. Developmental topography of cortical thickness during infancy. Proc Natl Acad Sci U S A. (2019) 116(32):15855–60. doi: 10.1073/pnas.1821523116
13. Zhang H, Li J, Su X, Hu Y, Liu T, Ni S, et al. Growth charts of brain morphometry for preschool children. Neuroimage. (2022) 255:119178. doi: 10.1016/j.neuroimage.2022.119178
14. Mutlu AK, Schneider M, Debbané M, Badoud D, Eliez S, Schaer M. Sex differences in thickness, and folding developments throughout the cortex. Neuroimage. (2013) 82:200–7. doi: 10.1016/j.neuroimage.2013.05.076
15. Richards JE, Xie W. Brains for all the ages: structural neurodevelopment in infants and children from a life-span perspective. Adv Child Dev Behav. (2015) 48:1–52. doi: 10.1016/bs.acdb.2014.11.001
16. Lee JY, Choi YH, Cha JH, Lee JY, Lee YJ, Kim BH, et al. Altered asymmetries of the structural networks comprising the fronto-limbic brain circuitry of preterm infants. Sci Rep. (2021) 11(1):1318. doi: 10.1038/s41598-020-79446-0
17. Capilla A, Romero D, Maestú F, Campo P, Fernández S, González-Marqués J, et al. Emergence and brain development of executive functions. Actas Esp Psiquiatr. (2004) 32(6):377.15529228
18. Braun K. The prefrontal-limbic system: development, neuroanatomy, function, and implications for socioemotional development. Clin Perinatol. (2011) 38(4):685–702. doi: 10.1016/j.clp.2011.08.013
19. Shaw P, Malek M, Watson B, Greenstein D, De Rossi P, Sharp W. Trajectories of cerebral cortical development in childhood and adolescence and adult attention-deficit/hyperactivity disorder. Biol Psychiatry. (2013) 74(8):599–606. doi: 10.1016/j.biopsych.2013.04.007
20. Hazlett HC, Poe MD, Lightbody AA, Styner M, MacFall JR, Reiss AL, et al. Trajectories of early brain volume development in fragile X syndrome and autism. J Am Acad Child Adolesc Psychiatry. (2012) 51(9):921–33. doi: 10.1016/j.jaac.2012.07.003
21. Sheline YI. 3D MRI studies of neuroanatomic changes in unipolar major depression: the role of stress and medical comorbidity. Biol Psychiatry. (2000) 48(8):791–800. doi: 10.1016/S0006-3223(00)00994-X
22. Johnson MH. Interactive specialization: a domain-general framework for human functional brain development?. Dev Cogn Neurosci. (2011) 1:7–21. doi: 10.1016/j.dcn.2010.07.003
23. Courchesne E, Pierce K, Schumann CM, Redcay E, Buckwalter JA, Kennedy DP, et al. Mapping early brain development in autism. Neuron. (2007) 56(2):399–413. doi: 10.1016/j.neuron.2007.10.016
24. Schuetze M, Park MT, Cho IY, MacMaster FP, Chakravarty MM, Bray SL. Morphological alterations in the thalamus, Striatum, and Pallidum in autism Spectrum disorder. Neuropsychopharmacology. (2016) 41(11):2627–37. doi: 10.1038/npp.2016.64
25. Kong XZ, Postema MC, Guadalupe T, de Kovel C, Boedhoe PSW, Hoogman M, et al. Mapping brain asymmetry in health and disease through the ENIGMA consortium. Hum Brain Mapp. (2022) 43(1):167–81. doi: 10.1002/hbm.25033
26. Guadalupe T, Mathias SR, vanErp TGM, Whelan CD, Zwiers MP, Abe Y, et al. Human subcortical brain asymmetries in 15,847 people worldwide reveal effects of age and sex. Brain Imaging Behav. (2017) 11(5):1497–514. doi: 10.1007/s11682-016-9629-z
27. Rentería ME. Cerebral asymmetry: a quantitative, multifactorial, and plastic brain phenotype. Twin Res Hum Genet. (2012) 15(3):401–13. doi: 10.1017/thg.2012.13
28. Fu L, Wang Y, Fang H, Xiao X, Xiao T, Li Y, et al. Longitudinal study of brain asymmetries in autism and developmental delays aged 2–5 years. Neuroscience. (2020) 432:137–49. doi: 10.1016/j.neuroscience.2020.02.028
29. Zhou Q, Zhong M, Yao S, Jin X, Liu Y, Tan C, et al. Hemispheric asymmetry of the frontolimbic cortex in young adults with borderline personality disorder. Acta Psychiatr Scand. (2017) 136(6):637–47. doi: 10.1111/acps.12823
30. Postema MC, Van Rooij D, Anagnostou E, Arango C, Auzias G, Behrmann M, et al. Altered structural brain asymmetry in autism spectrum disorder in a study of 54 datasets. Nat Commun. (2019) 10(1):4958. doi: 10.1038/s41467-019-13005-8
31. Shaw P, Lalonde F, Lepage C, Rabin C, Eckstrand K, Sharp W, et al. Development of cortical asymmetry in typically developing children and its disruption in attention-deficit/hyperactivity disorder. Arch Gen Psychiatry. (2009) 66(8):888–96. doi: 10.1001/archgenpsychiatry.2009.103
32. Okada N, Fukunaga M, Yamashita F, Koshiyama D, Yamamori H, Ohi K, et al. Abnormal asymmetries in subcortical brain volume in schizophrenia. Mol Psychiatry. (2016) 21(10):1460–6. doi: 10.1038/mp.2015.209
33. Rapoport JL, Giedd JN, Gogtay N. Neurodevelopmental model of schizophrenia: update 2012. Mol Psychiatry. (2012) 17(12):1228–38. doi: 10.1038/mp.2012.23
34. Herbert MR, Ziegler DA, Deutsch CK, O'Brien LM, Kennedy DN, Filipek PA, et al. Brain asymmetries in autism and developmental language disorder: a nested whole-brain analysis. Brain. (2004) 128(1):213–26. doi: 10.1093/brain/awh330
35. Zhou D, Lebel C, Evans A, Beaulieu C. Cortical thickness asymmetry from childhood to older adulthood. Neuroimage. (2013) 83:66–74. doi: 10.1016/j.neuroimage.2013.06.073
36. Kong XZ, Mathias SR, Guadalupe T, Glahn DC, Franke B, Crivello F, et al. Mapping cortical brain asymmetry in 17,141 healthy individuals worldwide via the ENIGMA consortium. Proc Natl Acad Sci U S A. (2018) 115(22):E5154–e63. doi: 10.1073/pnas.1718418115
37. Avants BB, Tustison N, Song G. Advanced normalization tools (ANTS). Insight J. (2009) 2(365):1–35. doi: 10.54294/uvnhin
38. Blumenthal JD, Zijdenbos A, Molloy E, Giedd JN. Motion artifact in magnetic resonance imaging: implications for automated analysis. Neuroimage. (2002) 16(1):89–92. doi: 10.1006/nimg.2002.1076
39. Shaw P, Eckstrand K, Sharp W, Blumenthal J, Lerch JP, Greenstein D, et al. Attention-deficit/hyperactivity disorder is characterized by a delay in cortical maturation. Proc Natl Acad Sci USA. (2007) 104(49):19649–54. doi: 10.1073/pnas.0707741104
40. Tisdall MD, Reuter M, Qureshi A, Buckner RL, Fischl B, van der Kouwe AJW. Prospective motion correction with volumetric navigators (vNavs) reduces the bias and variance in brain morphometry induced by subject motion. Neuroimage. (2016) 127:11–22. doi: 10.1016/j.neuroimage.2015.11.054
41. Rolls ET. Limbic systems for emotion and for memory, but no single limbic system. Cortex. (2015) 62:119–57. doi: 10.1016/j.cortex.2013.12.005
42. Taber KH, Wen C, Khan A, Hurley RA. The limbic thalamus. J Neuropsychiatry Clin Neurosci. (2004) 16(2):127–32. doi: 10.1176/jnp.16.2.127
43. Gennatas ED, Avants BB, Wolf DH, Satterthwaite TD, Ruparel K, Ciric R, et al. Age-related effects and sex differences in gray matter density, volume, mass, and cortical thickness from childhood to young adulthood. J Neurosci. (2017) 37(20):5065–73. doi: 10.1523/JNEUROSCI.3550-16.2017
44. Baum GL, Ciric R, Roalf DR, Betzel RF, Moore TM, Shinohara RT, et al. Modular segregation of structural brain networks supports the development of executive function in youth. Curr Biol. (2017) 27(11):1561–72. e8. doi: 10.1016/j.cub.2017.04.051
45. Wood SN. Generalized Additive Models: An Introduction With R. New York, NY: Chapman & Hall/CRC Texts in Statistical Science (2017). doi: 10.1201/9781315370279
46. Maritz JS. Models and the use of signed rank tests. Stat Med. (1985) 4(2):145–53. doi: 10.1002/sim.4780040205
47. Fjell AM, Westlye LT, Amlien I, Espeseth T, Reinvang I, Raz N, et al. High consistency of regional cortical thinning in aging across multiple samples. Cereb Cortex. (2009) 19(9):2001–12. doi: 10.1093/cercor/bhn232
48. Huttenlocher PR. Synaptic density in human frontal cortex—developmental changes and effects of aging. Brain Res. (1979) 163(2):195–205. doi: 10.1016/0006-8993(79)90349-4
49. Schnack HG, Nieuwenhuis M, van Haren NE, Abramovic L, Scheewe TW, Brouwer RM, et al. Can structural MRI aid in clinical classification? A machine learning study in two independent samples of patients with schizophrenia, bipolar disorder and healthy subjects. Neuroimage. (2014) 84:299–306. doi: 10.1016/j.neuroimage.2013.08.053
50. Li G, Lin W, Gilmore JH, Shen D. Spatial patterns, longitudinal development, and hemispheric asymmetries of cortical thickness in infants from birth to 2 years of age. J Neurosci. (2015) 35(24):9150–62. doi: 10.1523/JNEUROSCI.4107-14.2015
51. Jiao Y, Chen R, Ke X, Chu K, Lu Z, Herskovits EH. Predictive models of autism spectrum disorder based on brain regional cortical thickness. Neuroimage. (2010) 50(2):589–99. doi: 10.1016/j.neuroimage.2009.12.047
52. Ostby Y, Tamnes CK, Fjell AM, Westlye LT, Due-Tønnessen P, Walhovd KB. Heterogeneity in subcortical brain development: a structural magnetic resonance imaging study of brain maturation from 8 to 30 years. J Neurosci. (2009) 29(38):11772–82. doi: 10.1523/JNEUROSCI.1242-09.2009
53. Gilmore JH, Shi F, Woolson SL, Knickmeyer RC, Short SJ, Lin W, et al. Longitudinal development of cortical and subcortical gray matter from birth to 2 years. Cereb Cortex. (2012) 22(11):2478–85. doi: 10.1093/cercor/bhr327
54. Goldberg E, Roediger D, Kucukboyaci NE, Carlson C, Devinsky O, Kuzniecky R, et al. Hemispheric asymmetries of cortical volume in the human brain. Cortex. (2013) 49(1):200–10. doi: 10.1016/j.cortex.2011.11.002
55. Rajagopalan V, Scott J, Habas PA, Kim K, Corbett-Detig J, Rousseau F, et al. Local tissue growth patterns underlying normal fetal human brain gyrification quantified in utero. J Neurosci. (2011) 31(8):2878–87. doi: 10.1523/JNEUROSCI.5458-10.2011
56. Lyttelton OC, Karama S, Ad-Dab'bagh Y, Zatorre RJ, Carbonell F, Worsley K, et al. Positional and surface area asymmetry of the human cerebral cortex. Neuroimage. (2009) 46(4):895–903. doi: 10.1016/j.neuroimage.2009.03.063
57. Chen S, Guan L, Tang J, He F, Zheng Y. Asymmetry in cortical and subcortical structures of the brain in children and adolescents with attention-deficit/hyperactivity disorder. Neuropsychiatr Dis Treat. (2021) 17:493–502. doi: 10.2147/NDT.S292444
58. Leung MK, Lau WK. Resting-state abnormalities of posterior cingulate in autism spectrum disorder. Prog Mol Biol Transl Sci. (2020) 173:139–59. doi: 10.1016/bs.pmbts.2020.04.010
59. Rolls ET. The cingulate cortex and limbic systems for emotion, action, and memory. Brain Struct Funct. (2019) 224(9):3001–18. doi: 10.1007/s00429-019-01945-2
60. Simms ML, Kemper TL, Timbie CM, Bauman ML, Blatt GJ. The anterior cingulate cortex in autism: heterogeneity of qualitative and quantitative cytoarchitectonic features suggests possible subgroups. Acta Neuropathol. (2009) 118:673–84. doi: 10.1007/s00401-009-0568-2
61. Jin F, Zheng P, Liu H, Guo H, Sun Z. Functional and anatomical connectivity-based parcellation of human cingulate cortex. Brain Behav. (2018) 8(8):e01070. doi: 10.1002/brb3.1070
62. Huster RJ, Westerhausen R, Kreuder F, Schweiger E, Wittling W. Morphologic asymmetry of the human anterior cingulate cortex. Neuroimage. (2007) 34(3):888–95. doi: 10.1016/j.neuroimage.2006.10.023
63. Cheong JL, Thompson DK, Spittle AJ, Potter CR, Walsh JM, Burnett AC, et al. Brain volumes at term-equivalent age are associated with 2-year neurodevelopment in moderate and late preterm children. J Pediatr. (2016) 174:91–7. e1. doi: 10.1016/j.jpeds.2016.04.002
64. Levman J, MacDonald P, Lim AR, Forgeron C, Takahashi E. A pediatric structural MRI analysis of healthy brain development from newborns to young adults. Hum Brain Mapp. (2017) 38(12):5931–42. doi: 10.1002/hbm.23799
Keywords: brain development, fronto-limbic, preschool-aged children, volume, thickness, asymmetry, structural MRI
Citation: Lee GY, Youn Y-A, Jang YH, Kim H, Lee JY, Lee YJ, Jung M and Lee HJ (2024) Structural development and brain asymmetry in the fronto-limbic regions in preschool-aged children. Front. Pediatr. 12:1362409. doi: 10.3389/fped.2024.1362409
Received: 5 January 2024; Accepted: 4 September 2024;
Published: 1 October 2024.
Edited by:
Igor Nestrasil, University of Minnesota Health Twin Cities, United StatesReviewed by:
Thalia Harmony, National Autonomous University of Mexico, MexicoGiovanni Mento, University of Padua, Italy
Yidian Gao, University of Birmingham, United Kingdom
Copyright: © 2024 Lee, Youn, Jang, Kim, Lee, Lee, Jung and Lee. This is an open-access article distributed under the terms of the Creative Commons Attribution License (CC BY). The use, distribution or reproduction in other forums is permitted, provided the original author(s) and the copyright owner(s) are credited and that the original publication in this journal is cited, in accordance with accepted academic practice. No use, distribution or reproduction is permitted which does not comply with these terms.
*Correspondence: Minyoung Jung, bWlueW91bmdAa2JyaS5yZS5rcg==; Hyun Ju Lee, Ymxlc3NsZWU3N0BoYW5tYWlsLm5ldA==
†These authors contributed equally to this work and share first authorship
‡These authors contributed equally to this work and share the corresponding authorship