 Tina Jumani1*
 Priya Mishra2
 Tonya Robinson3Jeffrey S. Shenberger4,5Jonathan M. Davis6Benjamin Sweigart7
 Rodica M. Turcu8
- 1Department of Pediatrics, St. Elizabeth’s Medical Center, Brighton, MA, United States
- 2Department of Pediatrics, Thomas Jefferson University Hospital, Philadelphia, PA, United States
- 3Department of Pediatrics, Norton Children’s Hospital, Louisville, KY, United States
- 4Department of Pediatrics, Connecticut Children’s, Hartford, CT, United States
- 5Department of Pediatrics, Wake Forest Medical Center, Winston-Salem, NC, United States
- 6Department of Pediatrics, Tufts Medical Center, Boston, MA, United States
- 7Tufts Clinical and Translational Science Institute, Tufts Medical Center, Boston, MA, United States
- 8Department of Pediatrics, Massachusetts General Hospital, Boston, MA, United States
Objective: To examine the effects of opioids during therapeutic hypothermia (TH) on short-term outcomes in neonates with neonatal encephalopathy (NE).
Methods: Multicenter retrospective study of neonates with moderate/severe NE from Jan. 2013–Feb 2021. Opioid exposure was classified as positive (>0.1 mg/kg) or negative (no exposure or ≤0.1 mg/kg) based on cumulative morphine milligram equivalents (MME). Negative binomial regression models were used to evaluate clinical outcomes.
Results: One hundred and twenty neonates were included. Adjusted analyses indicated that opioid exposure was associated with an increase in (1) length of hospitalization, (2) hypotension/use of vasopressors, and (3) need for and longer duration of mechanical ventilation. Many findings persisted even after adjusting for site and the presence of confirmed seizures (a marker of disease severity).
Discussion: Opioid use during TH was associated with adverse effects on short-term outcomes. Caution should be exercised when using opioids during TH until longer-term neurodevelopmental outcome studies can be conducted in larger cohorts.
1 Introduction
Therapeutic hypothermia (TH) is the recommended treatment for neonates with signs and symptoms of neonatal encephalopathy (NE) occurring after a significant perinatal event, presumed to be caused by hypoxic ischemia. The clinical presentation of NE includes depressed level of consciousness, decreased spontaneous movement, low muscle tone, poor sucking reflex, and seizures. This commonly occurs in the context of a perinatal sentinel event (e.g., cord prolapse, placental abruption causing hypoxic-ischemic encephalopathy) and can be associated with end-organ involvement and long-term neurodevelopmental sequela. NE is traditionally categorized as mild, moderate, and severe using modified Sarnat scoring and other assessment tools, with TH considered standard treatment for moderate and severe NE (1, 2). Published data demonstrate the benefits of initiating TH in neonates prior to 6 h of life and continuing for 72 h (2–4).
In many centers around the country, agitation, discomfort, and pain during TH are routinely treated with opioids such as morphine and fentanyl (continuous infusion and/or intermittent bolus administration) (1). Morphine has anti-nociceptive properties and reduces the release of glutamate and the sensitivity of glutamate receptors. Glutamate is an excitatory neurotransmitter and is responsible for triggering apoptosis during secondary energy failure characteristic of neonatal NE. This is contrary to what would be expected since morphine inhibits neighboring gamma-aminobutyric acid (GABA) inhibitory neurons, which leads to excitation of ventral tegmental area dopamine (VTA-DA) neurons (5). Secondary energy failure typically occurs approximately 6–15 h after the injury and is characterized by cytotoxic edema, excitotoxicity, and eventually complete failure of mitochondria. Glutamate release activates glutamate and N-methyl-D-aspartate (NMDA) receptors which results in an influx of sodium, chloride and calcium which results in apoptosis and necrosis (6). Inhibition of glutamate release and reduction of glutamate receptor sensitivity is thought to result in neuroprotection (7). Angeles et al. (7) found that neonates who were given morphine during TH had less evidence of hypoxic-ischemic injury on magnetic resonance imaging compared to those who did not receive opioids.
Repeated neonatal pain may be associated with adverse neurodevelopmental outcomes. Williams and Lascelles (8) suggested that long-term consequences of untreated neonatal pain are associated with adverse sensorimotor/cognitive development and subsequent future responses to pain. Walker (9) also reviewed the long-term effects of neonatal pain on neurodevelopment and suggested that there are distinct differences when morphine is administered as a sedative in the absence of pain compared to when used as an analgesic for true pain. Gunderson et al. (10) reported a prospectively collected cohort of 282 neonates with NE treated with TH and exposed to opioids and found no adverse effects on neurodevelopmental outcomes at 18–24 months of age.
Natarajan et al. (11) demonstrated that sedation during TH does not impact neurologic outcomes but suggested that further studies should be studied in neonates exposed to TH. Liow et al. (12) performed a secondary analysis of a large multinational prospective observational study examining the association between morphine infusion during TH on brain injury and neurodevelopmental outcomes. They concluded that morphine does not offer any neuroprotective benefits and may be associated with a prolonged hospital stay (12). Additionally, Frymoyer et al. (13) conducted a pharmacokinetic study in 20 neonates with NE receiving morphine during TH and found clearance to be significantly slower compared to term controls. Similarly, another study found that serum morphine concentrations during the 24–72 h after birth were higher in neonates who underwent TH compared to their normothermic controls despite similar morphine infusion rates and doses (14). The potential adverse effects of opioids (e.g., hypotension, respiratory depression) are especially concerning given that clearance is decreased during TH (13, 14).
The goal of the present study was to determine whether opioid use during TH for moderate and severe NE affects short-term clinical outcomes including length of hospitalization, duration and mode of respiratory support, and need for vasopressor medications for blood pressure support. Our hypothesis was that morphine or fentanyl administration during TH for NE does impact these short-term clinical outcomes. Current research is lacking data regarding these specific short-term clinical outcomes. The goal of our study was to provide further evidence for the potential risks of routine opioid use during TH.
2 Methods
2.1 Study participants
This is a multicenter retrospective study of neonates receiving TH for moderate or severe NE at Tufts Medical Center (TMC) in Boston MA, Norton Children's Hospital (NCH) in Louisville KY, and Brenner Children's Hospital at Wake Forest (WF) in Winston Salem NC after IRB approval. At all three centers, the severity of NE was determined using Sarnat scoring and neonates with mild NE were excluded even if they received TH (15). Opioid use for sedation during TH is not routine at one center but is standard of care at the other two centers (morphine continuous infusion or (fentanyl continuous infusion). Fentanyl is 100 times more potent than morphine; a dose of only 100 mg (0.1 mg) can produce equivalent analgesia to approximately 10 mg of morphine (16).
2.2 Study design
Charts were examined from neonates undergoing TH for moderate or severe NE from January 2013–February 2021. Demographic information related to the prenatal, intrapartum, and postpartum care was collected including pregnancy complications, delivery information, need for neonatal resuscitation, and data regarding the diagnosis of NE and eligibility for TH. Laboratory and imaging data (e.g., liver and kidney function tests, hematologic assessments, coagulation studies, and ultrasound and MRI findings) were used as surrogate assessments for severity of illness. De-identified data from each center were entered into a REDCap database. Due to the retrospective nature of this study, not all data were available for all patients in the study. During the study period, there were no major changes in the clinical approach to neonates receiving TH.
2.3 EEG monitoring
The TH protocols at all three centers includes EEG monitoring for accurate identification and treatment of neonatal seizures. The timing for initiation of EEG varied based on the local resources with many neonates from all three centers empirically treated for seizure activity prior to the initiation of continuous video EEG monitoring. In some cases, clinical signs of suspected seizures were not confirmed by video EEG and the use of empiric treatment (that was ultimately stopped) prevented us from using antiepileptic treatment as a marker for seizure activity. Thus, data were evaluated based on EEG proven seizures in neonates who were subsequently treated with antiepileptic medications.
2.4 Primary outcome measures in relation to opioid use
The primary outcomes examined in this study were: (1) length of hospitalization, (2) duration and type of respiratory support, and (3) use of vasopressor medications for blood pressure support. Secondary outcomes included time to full oral feeds, duration of parenteral nutrition, and total time a central line was in place. The major focus of this study was exposure to opioids (e.g., morphine, fentanyl) which was classified as positive or negative based on cumulative morphine milligram equivalents (MME). Positive opioid exposure was defined as >0.1 mg/kg cumulative MME and negative as no opioid doses or a very low total of ≤0.1 mg/kg during TH.
2.5 Statistical analyses
The clinical and laboratory characteristics of the two opioid exposure groups were analyzed using Wilcoxon rank sum tests for continuous variables and chi-square tests for categorical variables. The clinical and laboratory characteristics of each center were analyzed using Kruskal-Wallis tests for continuous variables and chi-square tests for categorical variables. We used negative binomial regression models to evaluate the association between opioid exposure and length of hospitalization, length of vasopressor use, duration of noninvasive ventilation, time to come off parenteral nutrition, total time a central line was in place, and time to full oral feeds. Linear regression was used to evaluate the association between opioid exposure and log-transformed duration of invasive ventilation. We used logistic regression to evaluate the association between opioid exposure and vasopressor use. All models were adjusted for center and for EEG confirmed seizures (as a marker of disease severity). A two-sided 0.05 level of significance was used. All analyses were conducted using SAS Enterprise Guide software, Version 8.3 Update 3 (SAS Institute Inc., Cary, NC).
3 Results
3.1 Demographic and perinatal characteristics
We included 120 neonates (males and females) in the study: 52 at Center 1, 39 at Center 2, and 29 at Center 3. Table 1A, B show the maternal and neonatal demographic and perinatal characteristics for neonates in the study, by center and by cumulative MME category or opiate exposure (positive or negative). There were no statistically significant differences between the sites with respect to sex, gestational age, birth weight, and mode of delivery. Most neonates receiving TH at all three centers were outborn (17).
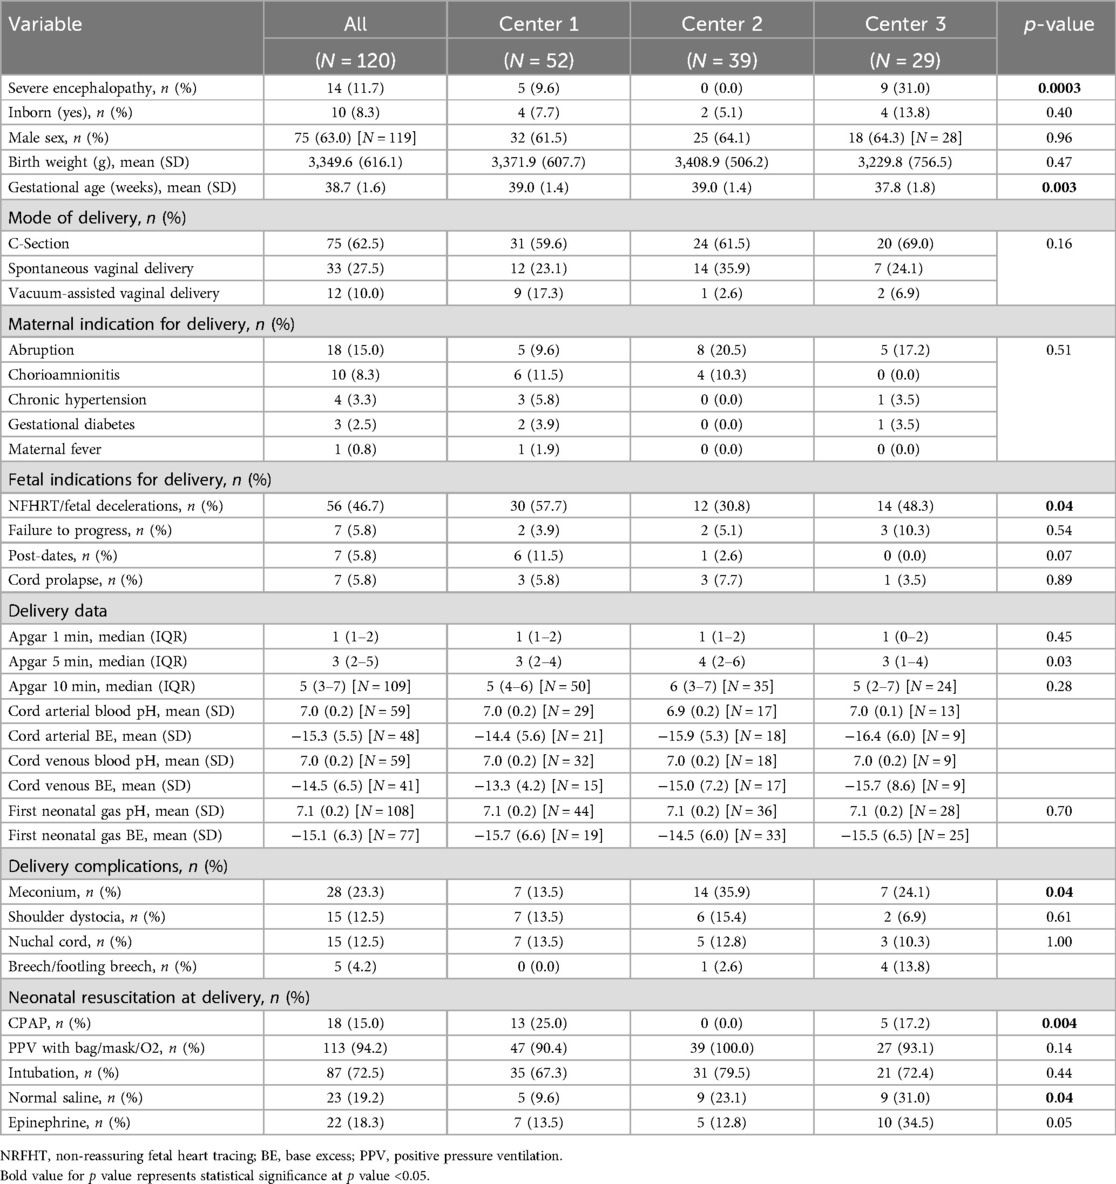
Table 1A. Maternal and neonatal demographic and perinatal characteristics analyzed by center.
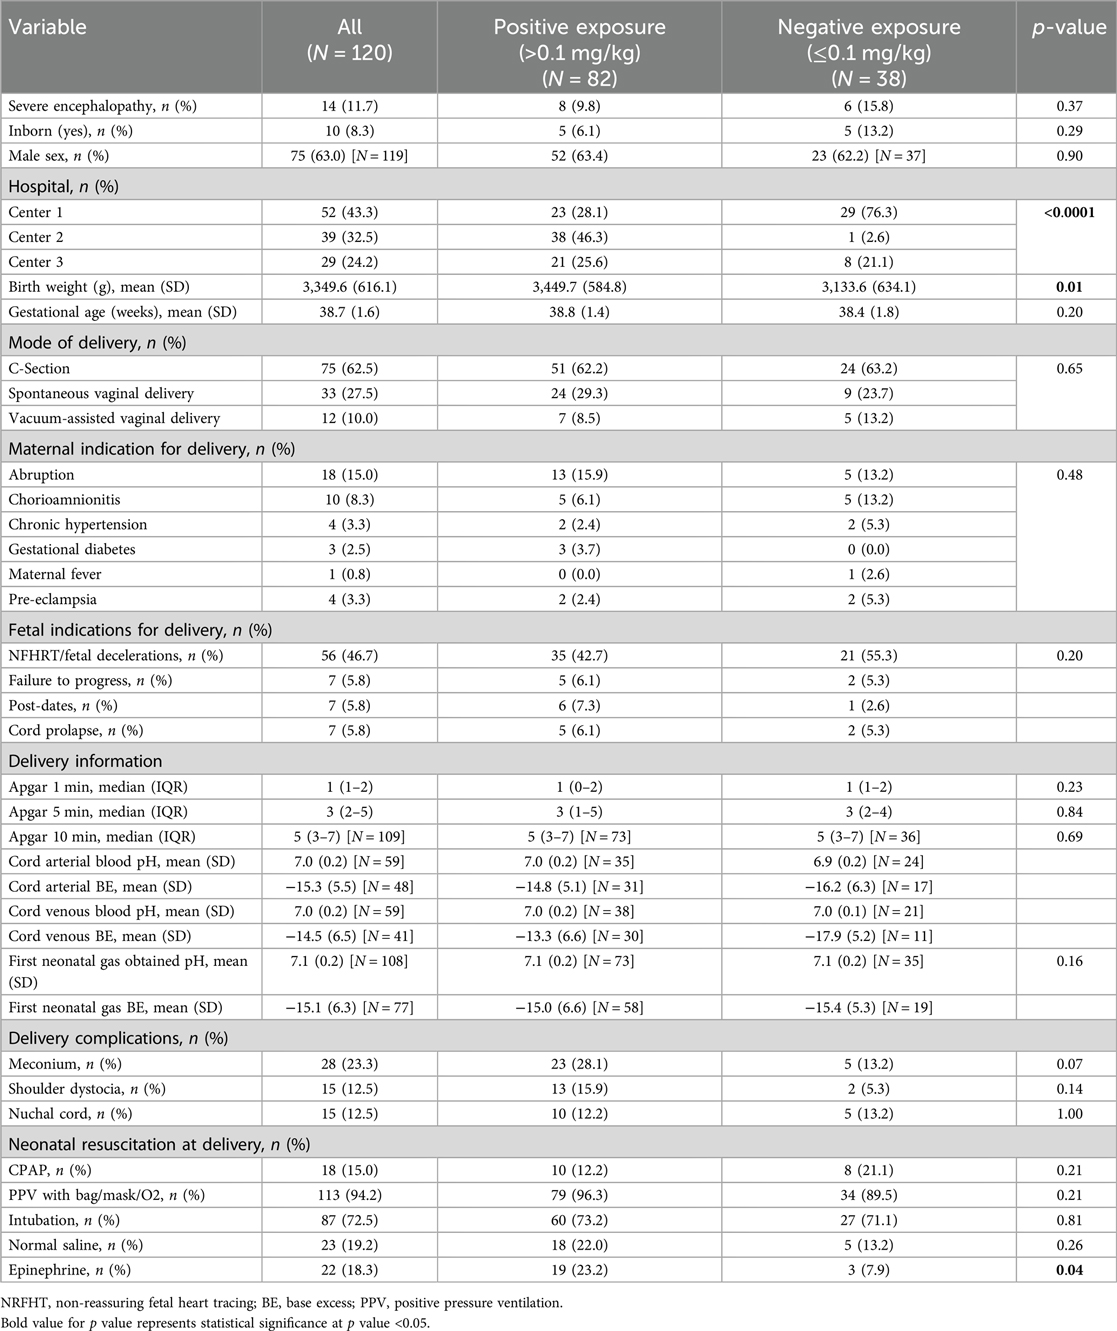
Table 1B. Maternal and neonatal demographics and perinatal characteristics analyzed by cumulative MME and opioid exposure categories.
3.2 Clinical findings
Severity of NE varied among the centers, with 31% classified as severe at one center (Table 1A). At all three centers, placental abruption was the most common maternal indication for delivery and non-reassuring fetal heart tracing was the most common fetal indication with overlap between all three institutions. Significant differences were noted in the documentation of non-reassuring fetal heart rate tracings. The use of resuscitative measures, delivery complications, and laboratory data were comparable among centers, including the degree of acidosis on the cord and/or first postnatal blood gas (Table 1A). The severity of acidosis was similar between sites during cooling and rewarming periods (first 6 days of the hospital stay).
3.3 Primary outcomes
The unadjusted analyses of the primary outcomes are shown in Table 2A, B. Table 2A compares the exposure and the outcomes across centers and Table 2B compares the exposure and outcomes between exposure categories. The cumulative opioid dosing analysis demonstrated that 68% of all neonates in the study were exposed to >0.1 mg/kg MME. Analysis revealed numerous inter-center differences including percent of opioid-exposed neonates, cumulative opioid-equivalent dose, vasopressor use (not the duration of use), duration of mechanical ventilation, central line use, time to full oral feedings, and length of hospital stay. Table 3A, B contain additional clinical and laboratory data analyzed by center as well as by cumulative opioid exposure with no statistically significant differences between the two opioid exposure groups. Tables 4–7 show the analysis of the primary outcomes by center, after adjusting for opioid exposure and EEG confirmed seizure activity.
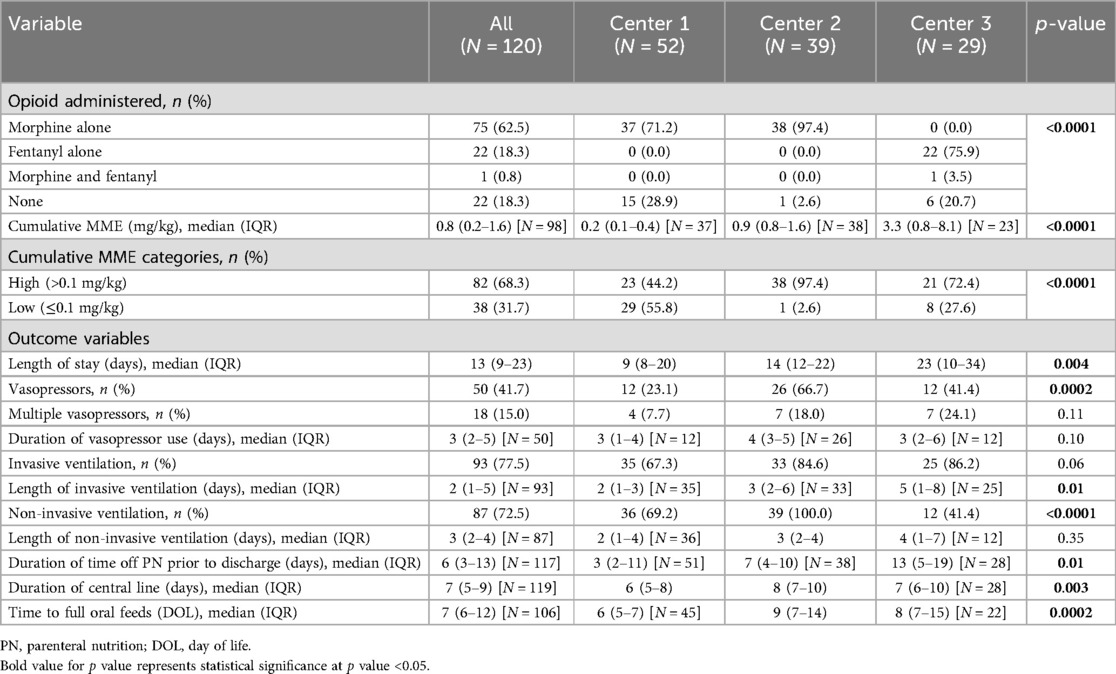
Table 2A. Primary and secondary outcomes analyzed by center.
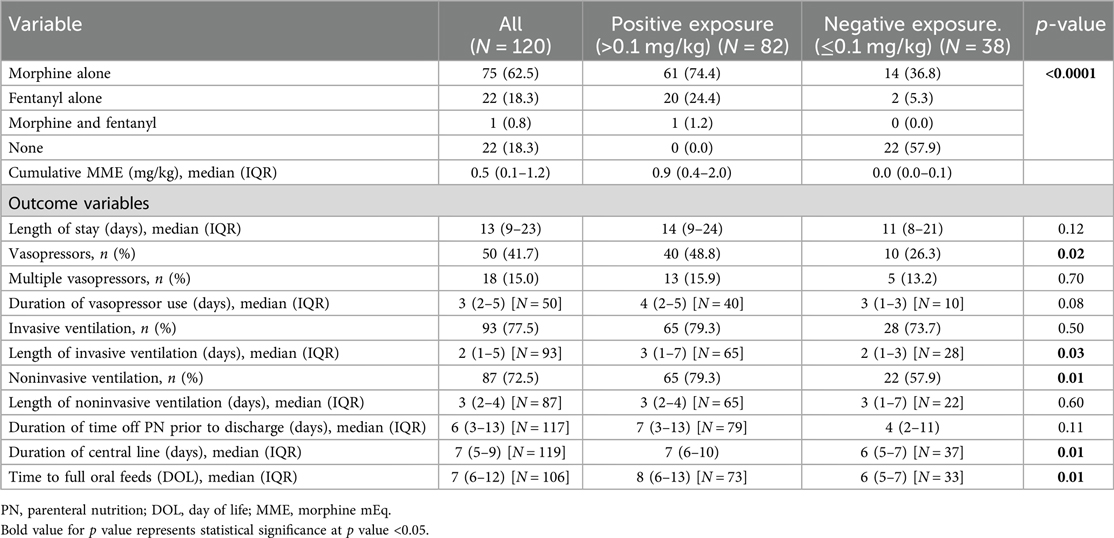
Table 2B. Primary and secondary outcomes analyzed by cumulative MME and opioid exposure categories.

Table 3A. Clinical and laboratory findings analyzed by center.
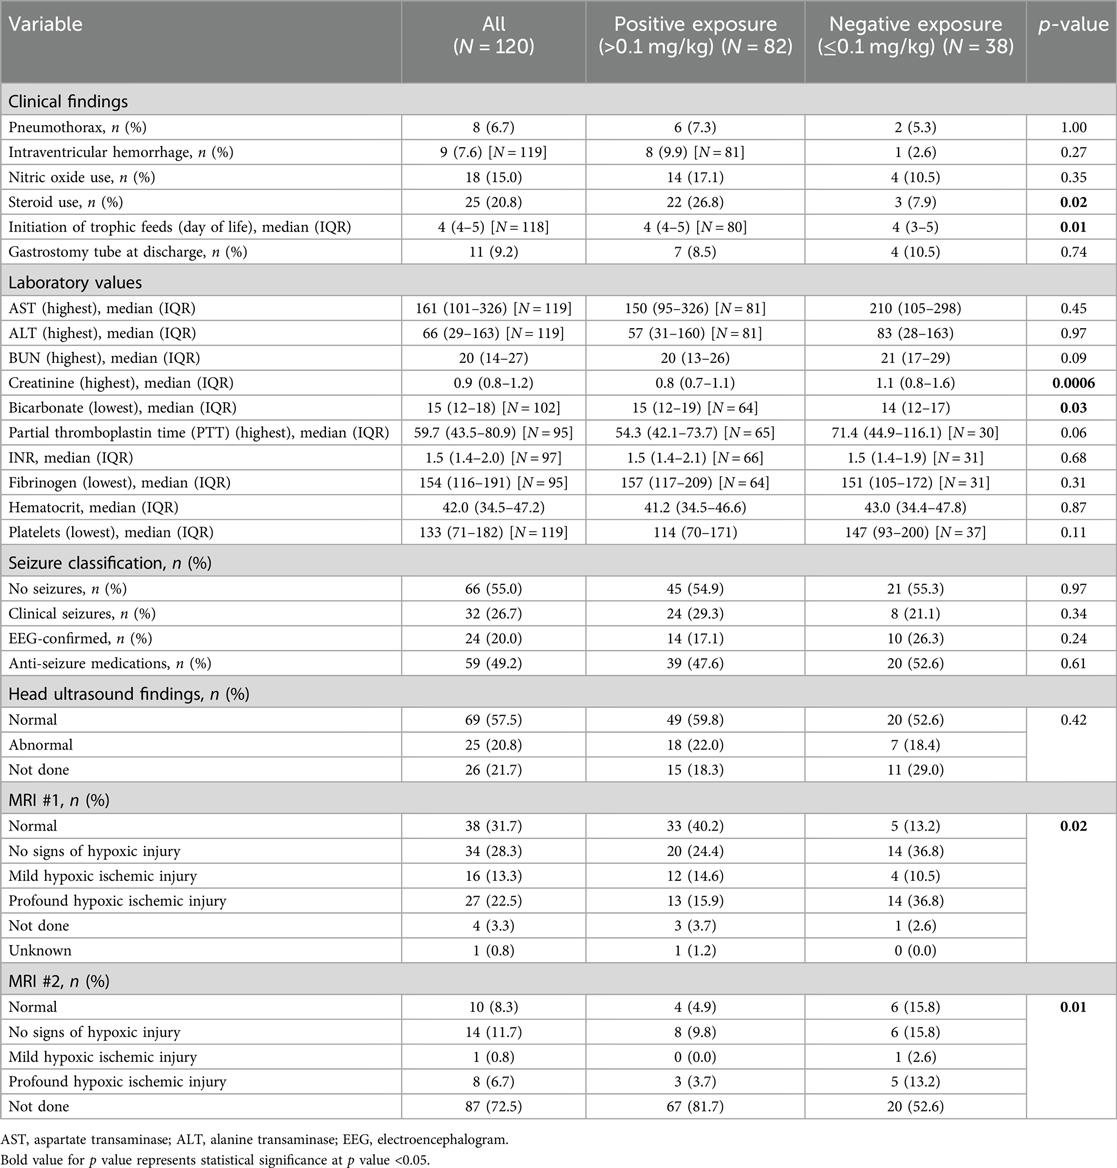
Table 3B. Clinical and laboratory findings analyzed by cumulative MME and opioid exposure categories.

Table 4. Inter-center comparison of length of stay analyzed by opioid exposure categories (N = 120).
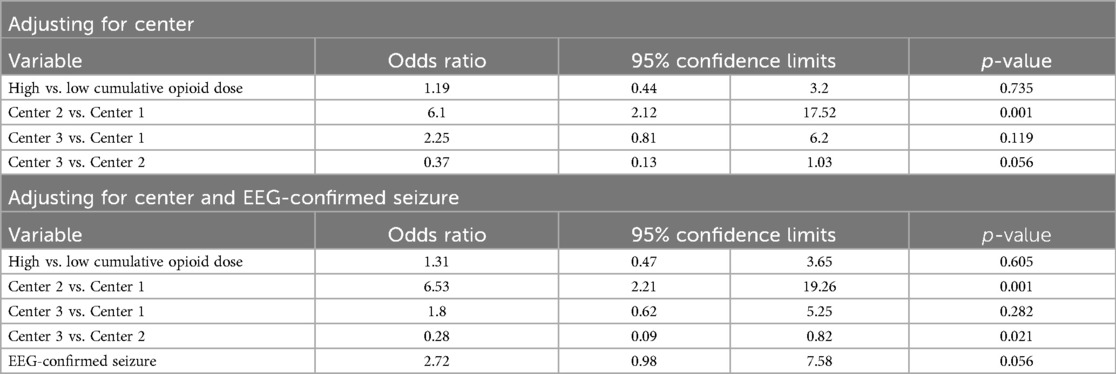
Table 5. Inter-center comparison of vasopressor use analyzed by opioid exposure categories (N = 120).
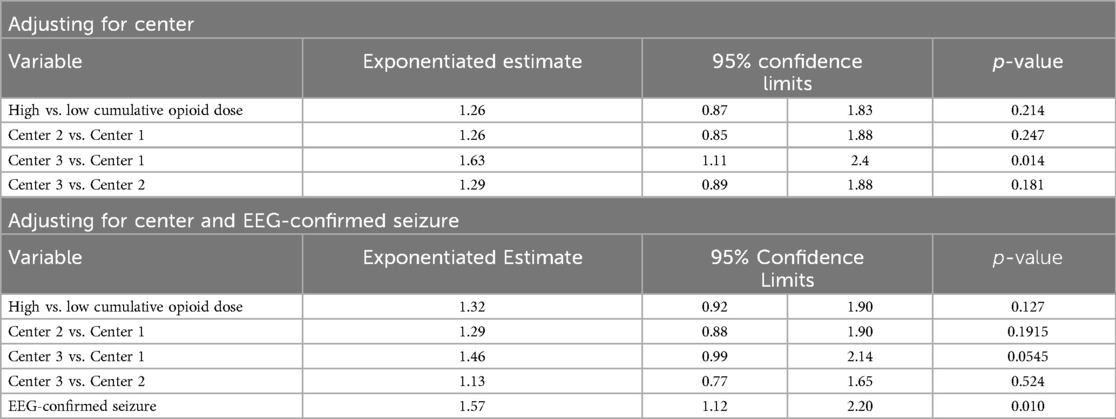
Table 6. Inter-center comparison of duration of invasive ventilation analyzed by opioid exposure categories (N = 93).
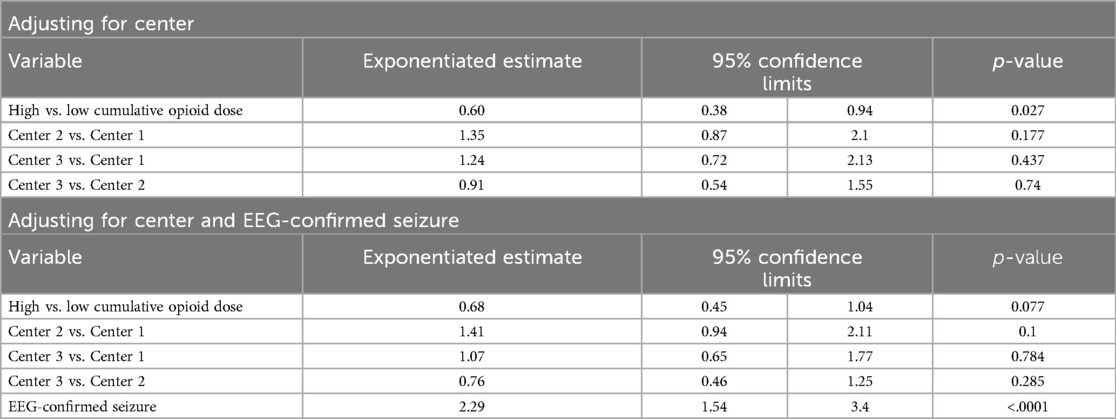
Table 7. Inter-center comparison of length of noninvasive ventilation analyzed by opioid exposure categories (N = 87).
3.4 EEG confirmed seizures
When evaluating exposure to anti-epileptic medications, 35.9% (14 out of 39) of neonates in the positive opioid exposure group had EEG confirmed seizures compared to 50% (10 out of 20) in the negative exposure group. By center, out of the subjects who received anti-epileptic medications, EEG confirmed seizures occurred in 22.2% (4 out of 18) at Center 1, 45% (9 out of 20) at Center 2, and 52.4% (11 out of 21) at Center 3.
3.5 Inter-center differences
Inter-center differences persisted after adjusting for center, EEG confirmed seizures, and opioid exposure. Neonates at the center using routine fentanyl had 1.49 times longer length of stay relative to the center with limited opioid use (ratio of means: 1.49, 95% CI: 1.15–1.92; p = 0.0025). Neonates with EEG-confirmed seizures had an average length of stay 1.72 times longer as those without seizures (95% CI: 1.35–2.20; p < .0001) and were 2.72 times more likely to receive vasopressors (95% CI: 0.98–7.58; p = 0.056). Neonates at the center using routine morphine had 6.53 times the odds of vasopressor use compared to the center with limited opioid use (95% CI: 2.21–19.26; p = 0.001). Neonates at the center using fentanyl had 0.28 times the odds of vasopressor use compared to the center using morphine (95% CI: 0.09–0.82; p = 0.021).
3.6 EEG-confirmed seizures and primary outcomes
Neonates with EEG-confirmed seizures had an average length of invasive ventilation 1.57 times longer (95% CI: 1.12–2.20; p = 0.01) and non-invasive ventilation 2.29 times longer than those without seizures (95% CI: 1.54–3.40; p < .0001).
4 Discussion
The benefits and risks of opioid use during TH remain controversial. While some pre-clinical models suggest that morphine may enhance the neuroprotective effects of TH by reducing oxidative stress, other animal studies have suggested that morphine induces neuronal apoptosis which could be harmful (4, 18, 19). The aim of this study was to examine short-term outcomes in neonates requiring TH and exposed to no or minimal doses of opioids compared to those receiving higher MME at three academic medical centers. The results suggest that higher cumulative doses of MME during TH for NE (often via continuous infusions) are associated with a greater need and longer duration of mechanical ventilatory support, vasopressors to support blood pressure, and a longer hospital stay. This is likely due to the direct effects of opioids on respiratory control centers of the brain and on vasomotor tone of blood vessels; effects that may be accentuated when combined with TH (which may delay opioid clearance). The TH protocols at the three centers are similar except for the approach to sedation. Intermittent morphine doses (0.05–0.1 mg/kg) are used only as needed at Center 1, routine administration of morphine by continuous infusion occurs at Center 2, and routine administration of fentanyl by continuous infusion occurs at Center 3. Our analysis demonstrated that the cumulative MME dose was significantly different among the three sites which was somewhat unexpected since the general perception is that continuous infusion decreases the cumulative MME amount required for pain control and comfort.
Our analysis also demonstrated that the cumulative MME dose was significantly different among the three sites with the centers using continuous infusions having the highest cumulative MME dose exposure. This was somewhat unexpected since the general perception is that continuous infusion decreases the cumulative MME amount required for control of pain and discomfort. The substantial difference in the cumulative MME dose at one center compared to the other two centers is related to the preferential use of fentanyl, with significantly higher analgesic potency (100 times) compared to morphine.
Although patient demographics at the three centers were similar, some differences were identified. Most neonates receiving TH at all three centers were outborn which is consistent with current evidence (17). There was a higher number of mothers with substance use disorder in the Center 2 cohort and anxiety and depression at Center 1 (20, 21). The data also showed minor differences in practice patterns among sites with respect to modes of ventilation, fluid resuscitation, laboratory data, and initiation of feeds (Table 3A). Neonates with EEG confirmed seizures and subsequent exposure to antiepileptic medications in addition to opioids required a longer hospitalization, a greater need for vasopressors, and greater need and duration of both invasive and non-invasive ventilation. Duration of vasopressor use though was not found to be statistically significant.
This is a pragmatic study, which enabled the comparison of effect of opioids on short-term outcomes at three centers with similar TH management, despite some differences in clinical practice (e.g., opioid administration). The difference in pressor use could be partially related to variations in the approach to blood pressure measurement at the three institutions. Variations in the use of intra-arterial lines for blood pressure monitoring may influence vasopressor use and contribute to the duration of central line use (22). Higher use of vasopressors may also result in slower advancement of feeds and may partially explain why the delay in initiation trophic feeds. Likewise, differences in ventilation may also be due to the individual center practice or provider preferences regarding the timing of extubation and use of non-invasive ventilation.
The main limitations of our study include the relatively small sample size, retrospective data collection, and clinical practice variations between the three institutions despite very similar TH protocols. In addition, we did not analyze standardized pain scores (due to their subjective nature) among sites, which could potentially have influenced opioid use. Since the concomitant use of anti-seizure medication may be a confounding variable influencing our primary and secondary outcomes, EEG confirmed seizures was used to adjust analyses. The criteria for EEG confirmed seizures was chosen over exposure to antiepileptic medication criteria because many neonates treated empirically with antiepileptic medications did not have EEG proven seizure activity and the medications were stopped (Table 3A, B). At all three centers, only a small percentage of neonates that received anti-epileptics also had EEG confirmed seizures. Another limitation was the lack of an objective tool to more accurately compare the severity of NE and any pain/discomfort associated with TH. Information used as a surrogate biomarker included APGAR scores, blood gases, the presence of multi-organ involvement, and Sarnat scoring. Data collected in this study showed that neonates with a diagnosis of severe NE did not consistently have evidence of multi-organ involvement or the most severe MRI findings.
Although the use of MRI as a biomarker of underlying brain injury is still being debated, MRI findings do correlate with future neurodevelopmental outcomes associated with NE (23). The discrepancy between unfavorable short-term outcomes and MRI results as a long-term prognostic tool emphasizes the need for long-term outcome data to definitively determine benefit or harm of opioid use in the management of neonatal NE during TH. For this study, each center's MRIs were interpreted by their own pediatric neuroradiologist. We were not able to have a single blinded radiologist interpret the results for all the MRIs and this prevented us from formulating statistical conclusions regarding the MRI findings.
The cumulative impact of opioids on long-term neurodevelopmental outcomes after TH could not be analyzed given the limited amounts of follow-up data available from the three centers. Long-term outcomes are critical to establish safety of these medication practices. The optimal therapeutic approach to neonatal pain management using opioids is still unresolved and a standardized approach is lacking. Newer sedatives such as dexmedetomidine are emerging as alternative options and their use in neonates is becoming much more widespread without sufficient compelling data on safety and dosing, especially during TH when the metabolism of many drugs change (24).
This study is one of the few involving real-world data, an important approach considering the paucity of data on the safety and efficacy of opioid use in neonates (especially those with underlying brain injury). While the current results raise concerns regarding the use of opioids in neonates undergoing TH, the findings indicate the complexity of a pragmatic approach to study opioid therapy in TH. A larger multicenter trial with standardized approach to opioid therapy and a detailed pharmacokinetic analyses and comprehensive neurodevelopmental follow-up will ultimately be needed to further investigate the short- and long-term safety and efficacy of opioids during TH.
Data availability statement
The datasets presented in this article are not readily available because N/A. Requests to access the datasets should be directed todGluYWoyMDVAZ21haWwuY29t.
Ethics statement
The studies involving humans were approved by Tufts Health Sciences Institutional Review Board (IRB), # 13467. The studies were conducted in accordance with the local legislation and institutional requirements. Written informed consent for participation was not required from the participants or the participants’ legal guardians/next of kin in accordance with the national legislation and institutional requirements.
Author contributions
TJ: Conceptualization, Investigation, Methodology, Project administration, Resources, Writing – original draft, Writing – review & editing, Data curation, Validation. PM: Data curation, Writing – original draft. TR: Writing – review & editing, Conceptualization, Writing – original draft. JS: Conceptualization, Writing – original draft, Writing – review & editing, Methodology, Project administration, Resources. JD: Conceptualization, Methodology, Project administration, Resources, Writing – original draft, Writing – review & editing, Investigation, Validation. BS: Methodology, Validation, Writing – review & editing, Formal Analysis. RT: Conceptualization, Data curation, Investigation, Methodology, Project administration, Supervision, Validation, Writing – original draft, Writing – review & editing.
Funding
The author(s) declare that no financial support was received for the research, authorship, and/or publication of this article.
Conflict of interest
The authors declare that the research was conducted in the absence of any commercial or financial relationships that could be construed as a potential conflict of interest.
Publisher's note
All claims expressed in this article are solely those of the authors and do not necessarily represent those of their affiliated organizations, or those of the publisher, the editors and the reviewers. Any product that may be evaluated in this article, or claim that may be made by its manufacturer, is not guaranteed or endorsed by the publisher.
References
1. Jacobs SE, Berg M, Hunt R, Tarnow-Mordi WO, Inder TE, Davis PG. Cooling for newborns with hypoxic ischemic encephalopathy. Cochrane Database Syst Rev. (2013) 1:CD003311. doi: 10.1002/14651858.CD003311.pub3
2. Markati T, Montaldo P, Shankaran S, Thayyil S. Pre-emptive opioid sedation during therapeutic hypothermia for neonatal encephalopathy: a national survey. Neonatal Society 2018 Autumn Meeting; London (2018).
3. Cheong JL, Coleman L, Hunt RW, Lee KJ, Doyle LW, Inder TE, et al. Prognostic utility of magnetic resonance imaging in neonatal hypoxic-ischemic encephalopathy: sub-study of a randomized trial. Arch Pediatr Adolesc Med. (2012) 166:634–40. doi: 10.1001/archpediatrics.2012.284
4. Committee On Fetus And Newborn. Hypothermia and neonatal encephalopathy. Pediatrics. (2014) 133:1146–50. doi: 10.1542/peds.2014-0899
5. Chen M, Zhao Y, Yang H, Luan W, Song J, Cui D, et al. Morphine disinhibits glutamatergic input to VTA dopamine neurons and promotes dopamine neuron excitation. Elife. (2015) 4:9275. doi: 10.7554/eLife.09275
6. Chakkarapani AA, Aly H, Benders M, Cotten CM, El-Dib M, Gressens P, et al. Therapies for neonatal encephalopathy: targeting the latent, secondary and tertiary phases of evolving brain injury. Sem Fetal Neonatal Med. (2021) 26(5):1–14. doi: 10.1016/j.siny.2021.101256
7. Angeles DM, Wycliffe N, Michelson D, Holshouser BA, Deming DD, Pearce WJ, et al. Use of opioids in asphyxiated term neonates: effects on neuroimaging and clinical outcome. Pediatr Res. (2005) 57:873–8. doi: 10.1203/01.PDR.0000157676.45088.8C
8. Williams MD, Lascelles BDX. Early neonatal pain-a review of clinical and experimental implications on painful conditions later in life. Front Pediatr. (2020) 8:30. doi: 10.3389/fped.2020.00030
9. Walker SM. Long-term effects of neonatal pain. Semin Fetal Neonatal Med. (2019) 24:101005. doi: 10.1016/j.siny.2019.04.005
10. Gundersen JK, Chakkarapani E, Jary S, Menassa DA, Scull-Brown E, Frymoyer A, et al. Morphine and fentanyl exposure during therapeutic hypothermia does not impair neurodevelopment. EClinicalMedicine. (2021) 36:100892. doi: 10.1016/j.eclinm.2021.100892
11. Natarajan G, Shankaran S, Laptook AR, McDonald SA, Pappas A, Hintz SR, et al. Association between sedation-analgesia and neurodevelopment outcomes in neonatal hypoxic-ischemic encephalopathy. J Perinatol. (2018) 38:1060–7. doi: 10.1038/s41372-018-0126-7
12. Liow N, Montaldo P, Lally PJ, Teiserskas J, Bassett P, Oliveira V, et al. Preemptive morphine during therapeutic hypothermia after neonatal encephalopathy: a secondary analysis. Ther Hypothermia Temp Manag. (2020) 10:45–52. doi: 10.1089/ther.2018.0052
13. Frymoyer A, Bonifacio SL, Drover DR, Su F, Wustoff CJ, Van Meurs KP. Decreased morphine clearance in neonates with hypoxic ischemic encephalopathy receiving hypothermia. J Clin Pharmacol. (2017) 57:64–76. doi: 10.1002/jcph.775
14. Róka A, Melinda KT, Vásárhelyi B, Machay T, Azzopardi D, Szabó M. Elevated morphine concentrations in neonates treated with morphine and prolonged hypothermia for hypoxic ischemic encephalopathy. Pediatrics. (2008) 121:e844–9. doi: 10.1542/peds.2007-1987
15. Sarnat H, Sarnat M. Neonatal encaphalopathy following fetal distress. Arch Neurol. (1976) 33:695–705. doi: 10.1001/archneur.1976.00500100030012
16. Ramos-Matos CF, Bistas KG, Lopez-Ojeda W. Fentanyl. In: StatPearls. Treasure Island, FL: StatPearls Publishing (2023). Available online at: https://www.ncbi.nlm.nih.gov/books/NBK459275/
17. Fairchild K, Sokora D, Scott J, Zanelli S. Therapeutic hypothermia on neonatal transport: 4-year experience in a single NICU. J Perinatol. (2010) 30:324–9. doi: 10.1038/jp.2009.168
18. Shankaran S, Laptook AR, Ehrenkranz RA, Tyson JE, McDonald SA, Donovan EF, et al. Whole-body hypothermia for neonates with hypoxic-ischemic encephalopathy. N Engl J Med. (2005) 353:1574–84. doi: 10.1056/NEJMcps050929
19. Thoresen M, Satas S, Løberg EM, Whitelaw A, Acolet D, Lindgren C, et al. Twenty-four hours of mild hypothermia in unsedated newborn pigs starting after a severe global hypoxic-ischemic insult is not neuroprotective. Pediatr Res. (2001) 50:405–41. doi: 10.1203/00006450-200109000-00017
20. Substance Abuse and Mental Health Services Administration. Available online at: https://www.samhsa.gov (Published August 2019; accessed June 28, 2021).
21. Mental Health Alliance Data 2018. National Survey on Drug Use and Health. Available online at: https://www.samhsa.gov/data/report/2018-nsduh-detailed-tables (Published August 20, 2019; accessed June 28, 2021).
22. Joffe R, Duff J, Garcia Guerra G, Pugh J, Joffe AR. The accuracy of blood pressure measured by arterial line and non-invasive cuff in critically ill children. Crit Care. (2016) 20:177. doi: 10.1186/s13054-016-1354-x
23. Bhagat I, Agarwal P, Sarkar A, Dechert R, Altinok D, Chouthai N. Does severity of brain injury on magnetic resonance imaging predict short-term outcome in neonates who received therapeutic hypothermia? Am J Perinatol. (2023) 40:666–71. doi: 10.1055/s-0041-1730431
Keywords: neonatal encephalopathy, hypothermia, opioids, outcome, neurodevelopmental
Citation: Jumani T, Mishra P, Robinson T, Shenberger JS, Davis JM, Sweigart B and Turcu RM (2024) Short-term effects of opioids during therapeutic hypothermia for neonatal encephalopathy. Front. Pediatr. 12:1405731. doi: 10.3389/fped.2024.1405731
Received: 23 March 2024; Accepted: 28 October 2024;
Published: 13 November 2024.
Edited by:
Fernando Cabañas, Quironsalud Madrid University Hospital, SpainReviewed by:
Eric S. Peeples, University of Nebraska Medical Center, United StatesTammy Strickland, Trinity College Dublin, Ireland
Copyright: © 2024 Jumani, Mishra, Robinson, Shenberger, Davis, Sweigart and Turcu. This is an open-access article distributed under the terms of the Creative Commons Attribution License (CC BY). The use, distribution or reproduction in other forums is permitted, provided the original author(s) and the copyright owner(s) are credited and that the original publication in this journal is cited, in accordance with accepted academic practice. No use, distribution or reproduction is permitted which does not comply with these terms.
*Correspondence: Tina Jumani, dGluYS5qdW1hbmlAYm1jLm9yZw==