 Amanda Tragueta Ferreira-Vasques1
 Eduardo Pimentel da Rocha1
 Elizabeth Green2
 Dionísia Aparecida Cusin Lamônica1*
- 1Laboratory for the Investigation of Neurodevelopmental Alterations, Department of Speech-Language Pathology and Audiology, Bauru School of Dentistry of the University of São Paulo, Bauru, Brazil
- 2Association for Research in Infant and Child Development and Nelson Mandela University, Port Elizabeth, South Africa
Introduction: Child development must be carefully evaluated, requiring assessment instruments to assess different areas of development. Griffiths Scales of Child Development 3rd Edition (Griffiths III) is used to assess different areas of development in children. This study normalized Griffiths III for the Brazilian population from 0 to 72 months.
Methods: 445 typically developing children from 0 to 72 months, divided into eight groups (from 0 to 6 months; 7 to 12 months; 13 to 18 months; 19 to 24 months; 25 to 36 months; 37 to 48 months; 49 to 60 months; 61 to 72 months) participated. Their tutors answered the anamnesis protocol. Denver II Developmental Screening Test and Griffiths III were applied. Statistical analysis was performed using the Mann–Whitney Test and Spearman's rank correlation coefficient. Normalization followed the criteria of the original scale.
Results: There was a direct and statistically significant correlation between maternal schooling and socioeconomic status; a direct correlation in the performance between the subscales. The normalization table of Griffiths III with the developmental age of children from 0 to 72 months was elaborated through linear progression, calculated using a specific formula.
Discussion: The data collected for the Brazilian population from 0 to 72 months were normalized, following the guidelines and norms of the original Griffiths III.
1 Introduction
Child development is complex and dynamic and influenced by numerous factors, intrinsic and extrinsic. Monitoring child development and performing early and assertive diagnosis, promoting adequate stimulation and guidance regarding the area or areas that are altered, is crucial for a good prognosis.
Focus, dedication, and continuity in studies related to normative child development are necessary. The use of assessment and diagnostic instruments, combined with the subjective clinical assessment of experienced and active professionals, enables one to carefully verify and understand the different areas of child development in a particular and individual way.
The Brazilian scenario in this regard is discouraging, considering the reduced number of standardized and normalized instruments (1–4). As an instrument for assessing and diagnosing child development, the Griffiths Scales of Child Development 3rd Edition (Griffiths III) (5) is cited, which was cross-culturally adapted to the Brazilian reality in its entirety (6).
In the international scenario, Griffiths III is widely used to monitor the typical development of children aged from 0 to 72 months, as well as to evaluate and diagnose changes in one or more areas of child development in children with suspect or diagnosed syndromes or with risk factors for changes in development (4, 7–25).
A subsequent step in the process of translation and cross-cultural adaptation of assessment instruments is the verification of psychometric properties, among which we highlight, in this study, the normalization. With normalization, it is possible to compare the performance of a child with others, considering the chronological age (26, 27). Thus, the diagnosis becomes more effective and assertive when the normalization occurs in the child's country of origin, considering the different cultures between countries.
Considering these aspects and the possibility of using Griffiths III for formal and instrumental assessment of the development of the Brazilian child population, with specific standards, this study aimed to normalize the Griffiths III for the Brazilian population aged from 0 to 72 months.
2 Method
The study was approved by the Committee for Ethics in Research, respecting resolution 196/96, which deals with research ethics (CAAE:84323718.3.0000.5417).
The Association for Research in Infant and Child Development (ARICD), which owns the copyright of the Griffiths Scales, authorized the study by signing a contract between the researcher, the association, and Hogrefe, the publisher of the Griffiths Scales.
2.1 Participants
A representative percentage of children from the Brazilian population, recruited from different cities in the State of São Paulo, participated in the study. The percentage was outlined after a statistical study considering sample calculation carried out with data from a pilot study, which had 417 participants.
The sample size calculation considered the highest standard deviation between the Griffiths III subscales (A - Foundations of Learning, B - Language and Communication, C - Eye and Hand Coordination, D – Personal, Social Emotional, E - Gross Motor) and overall performance, respecting a 95% confidence interval, using the GPower 3.1.9.2 program.
Participants were typically developing (TD) children of both sexes, aged between 0 and 72 months, representing the Brazilian population in terms of sex distribution and socioeconomic classification. These data were based on information from the Brazilian Institute of Geography and Statistics (28).
As inclusion criteria, the child needed to present typical development; be chronologically aged between 0 and 72 months; not have moderate to severe sensorineural hearing loss; not have visual impairments that would prevent the performance of the proposed procedures; show a normal result on the Denver-II Developmental Screening Test (29); and have the Free and Informed Consent Form signed by their legal guardians.
Participants were divided into eight groups to perform the sample calculation:
• Group 1 - G1: TD children aged between 0 and 6 months;
• Group 2 - G2: TD children aged between 7 and 12 months;
• Group 3 - G3: TD children aged between 13 and 18 months;
• Group 4 - G4: TD children aged between 19 and 24 months.
• Group 5 - G5: TD children aged between 25 and 36 months;
• Group 6 - G6: TD children aged between 37 and 48 months;
• Group 7 - G7: TD children aged between 49 and 60 months;
• Group 8 - G8: TD children aged between 61 and 72 months.
Considering that child development is influenced by several factors and associated with the fact that this study aims to normalize the instrument for evaluating child development, care and attention to three specific aspects, collected in the anamnesis, were necessary to contribute to the analysis of the results: sex; maternal schooling and socioeconomic status.
As for sex, the sample participants were divided into two groups: female and male.
As for the mother's level of education, an ordinal classification was performed according to the following criteria: Illiteracy (1); Incomplete Elementary School (2); Completed Elementary School (3); Incomplete High School (4); Completed High School (5); Incomplete Higher Education (6); Completed higher education (7); Postgraduate (8).
Regarding socioeconomic status, the following classification was applied, considering the number of minimum wages that the family receives monthly: Classification 1: 0–2 minimum wages; Classification 2: 2–5 minimum wages; Classification 3: above 5 minimum wages.
2.2 Procedures
After the signing of the Acquiescence Form by those responsible for the institutions where the data collection was carried out, contact was established with the tutors responsible for the children in the target age group of the study. The tutors who signed the Free and Informed Consent Form were invited to answer the anamnesis protocol, containing information on conditions of pregnancy, childbirth, neuropsychomotor development data, language, speech, hearing, and perception of the participant.
The Denver-II Developmental Screening Test (DDST-II) (29) was applied as an inclusion criterion in the sample, classifying the participants as typically developing children. Children who had a “Normal” result on the DDST-II were evaluated with Griffiths III (5).
The translated and adapted version of Griffiths III for the Brazilian population (6) was applied to participants aged from 0 to 72 months.
2.3 Data analysis
For the presentation of the data obtained during the structured interview with the tutors of the children, descriptive statistics were used with absolute and relative frequency values considering a significance level of 5% (30): Mann–Whitney Test and Spearman's rank correlation coefficient.
Normalization followed the criteria of the original Scale, through linear progression from one age group to the next (every two months), using smoothed mean and standard deviation values.
3 Results
Initially, 557 participants were evaluated, of which 112 presented a “Risk” result in the DDST-II, being excluded from the sample, considering the inclusion criteria. The sample consisted of 445 children, aged between 0 and 72 months, who presented a “Normal” result in the DDST-II, met the inclusion criteria, and participated in the normalization of the Griffiths III, in the Brazilian reality.
Sample calculations were performed based on the pilot study (417 participants), using the highest standard deviation value observed in group performance. The results were as follows:
G1 – 47 participants presented a higher standard deviation on subscale A with a sample calculation of 52 participants for the final sample;
G2 – 65 participants presented a higher standard deviation on subscale D with a sample calculation of 70 participants for the final sample;
G3 - 52 participants presented a higher standard deviation on subscale E with a sample calculation of 56 participants for the final sample;
G4 - 33 participants presented a higher standard deviation on subscale D with a sample calculation of 38 participants for the final sample;
G5 - 70 participants presented a higher standard deviation on subscale D with a sample calculation of 70 participants for the final sample;
G6 - 80 participants presented a higher standard deviation on subscale A with a sample calculation of 81 participants for the final sample;
G7 - 49 participants presented a higher standard deviation on subscale A with a sample calculation of 50 participants for the final sample;
G8 - 21 participants presented a higher standard deviation on subscale C with a sample calculation of 28 participants for the final sample
The sample distributed in the eight groups was analyzed in terms of sex, female and male (Table 2), and the following results were obtained: G1 - 46,2% (n = 24) were female and 53,8% (n = 28) were male; G2 – 48,6% (n = 34) were female and 51,4% (n = 36) were male; G3 - 48,2% (n = 27) were female and were 51,8%.(n = 29) male; G4 – 47,4% (n = 18) were female and 52,6% (n = 20) were male. G5 - 54,3% (n = 38) were female and 45,7% (n = 32) were male. G6 - 45,7% (n = 37) were female and 54,3% (n = 44) were male. G7 - 42% (n = 21) were female and 58% (n = 29) were male. G8 – 57,1% (n = 16) were female and 42,9% (n = 12) were male.
Table 1 presents the data on the mother's level of education, considering absolute frequency.
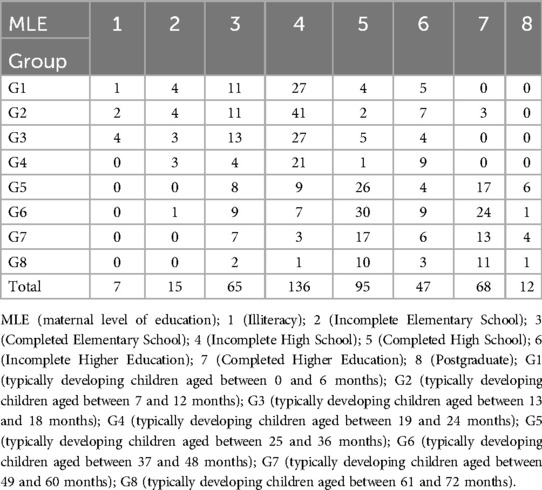
Table 1. Distribution of the sample in terms of the maternal level of education.
Regarding the socioeconomic status of the sample, it was distributed considering the socioeconomic reality of the Brazilian population. The socioeconomic status was characterized according to the number of minimum wages that the family receives monthly. Below, the data are presented considering each group of the sample:
G1 - 37 participants had a family income from 0 to 2 minimum wages per month, 13 from 2 to 5, and 2 more than 5 minimum wages;
G2 - 49 participants had a family income from 0 to 2 minimum wages per month, 17 from 2 to 5, and 4 more than 5 minimum wages;
G3 - 40 participants had a family income from 0 to 2 minimum wages per month, 13 from 2 to 5, and 3 more than 5 minimum wages;
G4 - 23 participants had a family income from 0 to 2 minimum wages per month, 10 from 2 to 5, and 5 more than 5 minimum wages;
G5 - 19 participants had a family income from 0 to 2 minimum wages per month, 32 from 2 to 5, and 19 more than 5 minimum wages;
G6 - 27 participants had a family income from 0 to 2 minimum wages per month, 39 from 2 to 5, and 15 more than 5 minimum wages;
G7 - 17 participants had a family income from 0 to 2 minimum wages per month, 23 from 2 to 5, and 10 more than 5 minimum wages;
G8 - 5 participants had a family income from 0 to 2 minimum wages per month, 19 from 2 to 5, and 4 more than 5 minimum wages.
Table 2 describes the median values (50%) as well as the first quartile (25%) and third quartile (75%) of the participant's performance in the 5 subscales, after the application of the Mann–Whitney test, for comparison between sexes, considering the p-value statistically significant when lower than 0.05.
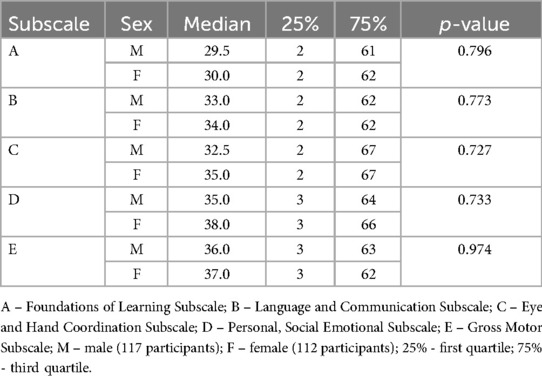
Table 2. Comparison of boys’ and girls’ performance on the 5 Griffiths III subscales.
Table 3 describes the correlation values and the p-value, considered statistically significant when it was lower than 0.05, divided by group and in the total sample, for comparison between maternal education and socioeconomic status.
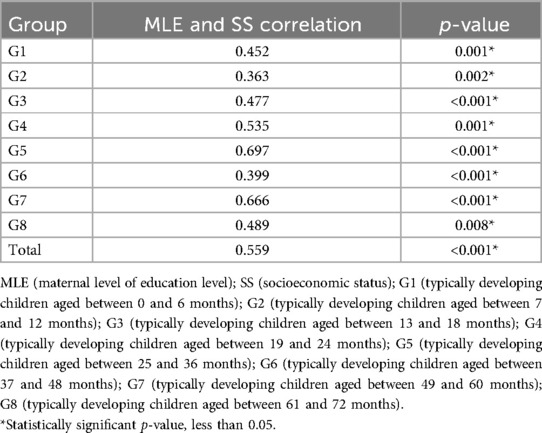
Table 3. Correlation between maternal level of education and socioeconomic status of the total sample as well as of each group individually.
Table 4 shows the correlation between socioeconomic status and performance on the 5 subscales of Griffiths III for the eight groups. The correlation type and statistical significance were analyzed, considering a p-value lower than 0.05.
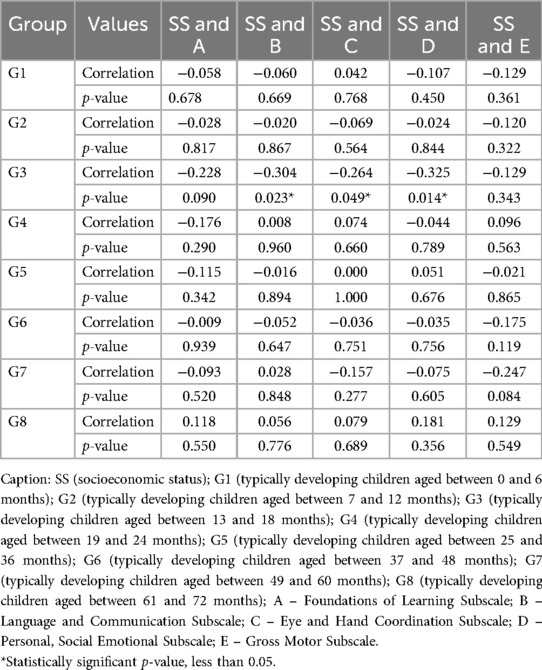
Table 4. Correlation between socioeconomic status and performance on the 5 subscales of the Griffiths III, for each group individually.
Table 5 shows the correlation between the participant's performance in the 5 subscales of Griffiths III for the eight groups. The correlation type and statistical significance were analyzed, considering the p-value less than 0.05.
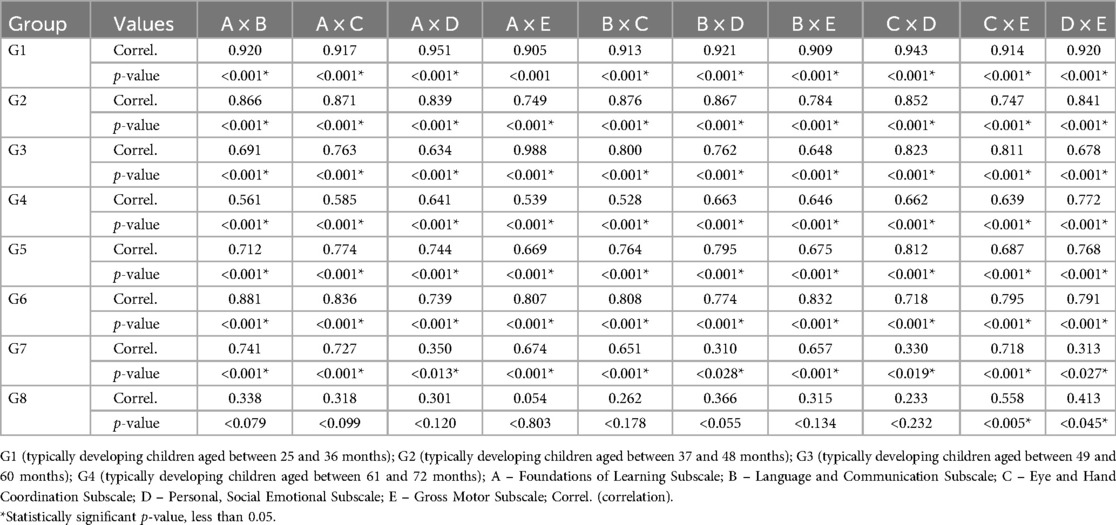
Table 5. Correlation between the performance in the 5 subscales of Griffiths III, of the total sample, and for each group individually.
Table 6 shows the result of the normalization of Griffiths III with the presentation of the equivalences between the Gross Results of the Subscales, the General results, and the Age of Development in the age group from 0 to 72 months.
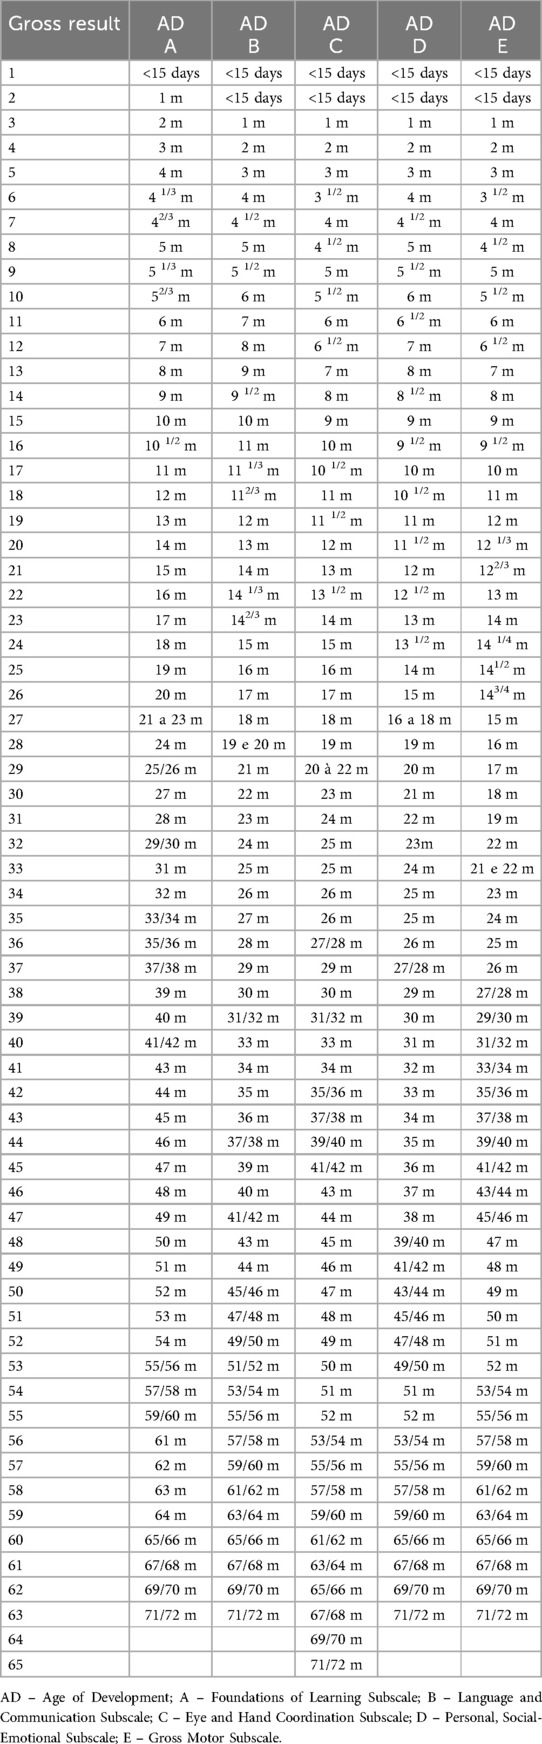
Table 6. Equivalence between gross results in Griffiths III and Age of development.
4 Discussion
Studies aiming to normalize an assessment instrument require a robust methodology that accounts for variables potentially affecting the instrument's application results. Thus, before the application, the instrument is adapted or prepared in a manner consistent with the culture of the population to which it will be applied (2, 31, 32).
Griffiths III was translated and cross-culturally adapted into the Brazilian Portuguese language (6), following a rigorous and careful process, based on the methodology proposed by Beaton (31).
Many countries use the Griffiths scales, such as Germany, South Africa, East Africa, Australia, Belgium, Cambodia, China, Philippines, France, Spain, Greece, Netherlands, Italy, Macedonia, Malaysia, Portugal, Sweden, Switzerland, Russia, and Thailand.
The establishment of the number of participants in the sample respected the sample calculation based on the highest standard deviation verified, based on the performance of the participants in each subscale, and also on the general performance. This calculation was performed for each of the eight groups into which the sample was divided, considering the age groups. The confidence interval respected in the sample calculation was 95%.
Sampling is a highly developed and sophisticated field of statistics that studies the research planning technique. It enables inferences about a universe from the study of part of its components. As sampling seeks the inference from a strictly statistical point of view, the procedure will only be valid if the sample is representative of the population. The sample calculation aims to reduce the costs and time of the estimation process, maintaining a safe minimum precision (33).
Regarding sex, maternal level of education (Table 1), and socioeconomic status, the distributions of the participants were presented. These factors were selected and included in the data analysis, considering the analyses performed in the Griffiths III Manual (5). Studies with GDMS also considered these variables (4, 9, 34–37).
DDST-II is a screening test widely used to screen children aged from 0 to 72 months, with “Normal” or “Risk” results. Due to its wide application and use by our research group, and also for its recognition in the scientific, clinical, and research community, this was the instrument chosen to select the sample (38–40).
Two hundred and fifteen girls and two hundred and thirty boys were evaluated. There was no statistically significant difference in performance between girls and boys (Table 2), analyzing the performance in each Griffiths III subscale individually. There are studies in the literature that corroborate this finding (5, 9, 34).
When analyzing the correlation between the maternal level of education and socioeconomic status (Table 3), there was a direct and statistically significant correlation in the eight individual groups and, therefore, in the total sample. According to the IBGE's Synthesis of Social Indicators (2010), the two correlated variables are directly proportional, which shows the possibility of considering only one of them in further analyses. Thus, socioeconomic status was chosen to analyze its correlation with participants' performance in the Griffiths III subscales.
Table 4 shows the correlation between SS and the performance of the participants in the five subscales of Griffiths III (A, B, C, D, and E), for each group individually (G1, G2, G3, G4, G5, G6, G7 and G8). A statistically significant correlation was observed between SS and the performance in the subscales B, C, and D, only for G3 (from 13 to 18 months). The correlations were weak, some being direct and others inverse. It is noteworthy that only in group 5 (from 25 to 36 months), for SS and Eye and Hand Coordination, there was no correlation. Group 8 (from 61 to 72 months) was the only group that showed a direct correlation between SS and all subscales (A, B, C, D, and E). Groups 2, 3, and 6 (from 7 to 12; 13 to 24; and 37 to 48 months) showed an indirect correlation between SS and all subscales. There was heterogeneity regarding the correlation of SS and performance on the subscales, according to the age group of the participants.
The result of the statistical analysis regarding the correlation between SS and the performance of the participants is different when compared to some studies in the literature (7, 41).
Considering the aim of the study of normalizing an assessment instrument, the sample was not distributed homogeneously in the three levels of socioeconomic classification analyzed (1, 2, and 3), which differs from studies found in the literature that distributed the sample evenly among socioeconomic levels, enabling the analysis of the interference of this factor in the participants' performance.
The correlation between the performance of the participants in the five subscales, among themselves, for the eight age groups, was analyzed (Table 5). A direct correlation was found between all subscales, in the eight groups, as well as in the total sample. In groups 1; 2; 3; 5 and 6 (from 0 to 6; 7 to 12; 13 to 18; 25 to 36; and 37 to 48 months) individually, all correlations were strong, direct, and statistically significant.
There was a direct and statistically significant correlation between all subscales of group 4 (from 19 to 24 months), although this correlation varies between 0.528 and 0.663, in performance comparisons between subscales, not indicating as strong a correlation as in the other analyses.
In group 7 (from 49 to 60 months), strong correlations were observed between subscales A (Foundations of Learning), B (Language and Communication), C (Eye and Hand Coordination), and E (Gross Motor). When subscale D (Personal, Social Emotional) was analyzed with the other four subscales, the correlations were weak, despite being direct and statistically significant.
Correlations in group 8 (from 61 to 72 months) were weak and significant only for subscale C (Eye and Hand Coordination) and (Gross Motor) and for subscale D (Personal, Social-Emotional) and E (Gross Motor). Group 8 showed the lowest standard deviation in the statistical calculation. Thus, it was the one with the lowest number of participants in the sample. This fact may have influenced the result of the correlation, in addition to emphasizing the need for a thorough analysis of which activities/skills were expected in this age group, since it is configured in the last age group of Griffiths III.
The literature describes the influence of the performance of a development area on other areas (34, 42–44). The importance of early diagnosis to assess alteration in one or more areas of child development so that it is possible to provide essential stimulation to the child, preventing negative interference in other areas that are not altered, is unanimous (3, 20, 22, 37, 45–47).
Statistical analysis for data normalization (Table 6) was applied, in which the Child's Age of Development was provided as a result, through the linear progression of an age group for the next (every two months), using smoothed mean and standard deviation values, calculated from a specific formula used in the original Scale (3). The raw data from the normalization process, as well as the child's developmental age (Table 6) will be made available to the statistician responsible for the statistical analysis of the original scale, who will process the data to prepare the other results for the development of the scale in the Brazilian Portuguese version.
In the final normalization of the Griffiths III reference tables, reference values of the Scaled Index, Development Quotient with 95% Confidence Interval, Stanine, and Percentile will be generated, all associated and interconnected.
This process will occur concurrently with the period of translation of the Griffiths III Manuals into Brazilian Portuguese and other bureaucratic procedures so that in a not-distant future the instrument for the application of the Griffiths III can be made available for use in Brazil.
5 Conclusion
The normalization of the data collected for the Brazilian population aged from 0 to 72 months was performed, following the guidelines and norms of the Griffiths III. Soon, Brazilian health professionals who work with children will have the opportunity to assess child development using this scale, diagnosing global changes in child development or specific areas. The application of the scale and the analysis of the results, appropriately, combined with clinical evaluation by an experienced professional, will provide assertive early diagnoses and essential stimulation, prioritizing the period of greatest brain plasticity in the child.
Data availability statement
The raw data supporting the conclusions of this article will be made available by the authors, without undue reservation.
Ethics statement
The studies involving humans were approved by Bauru School of Dentistry Research Ethics Committee. The studies were conducted in accordance with the local legislation and institutional requirements. Written informed consent for participation in this study was provided by the participants' legal guardians/next of kin.
Author contributions
AF-V: Conceptualization, Data curation, Formal Analysis, Funding acquisition, Investigation, Methodology, Project administration, Resources, Software, Supervision, Validation, Visualization, Writing – original draft, Writing – review & editing. ER: Data curation, Formal Analysis, Investigation, Methodology, Writing – original draft, Writing – review & editing. EG: Data curation, Formal Analysis, Investigation, Methodology, Validation, Writing – original draft, Writing – review & editing. DL: Conceptualization, Data curation, Formal Analysis, Funding acquisition, Investigation, Methodology, Project administration, Resources, Software, Supervision, Validation, Visualization, Writing – original draft, Writing – review & editing.
Funding
The author(s) declare financial support was received for the research, authorship, and/or publication of this article. We would like to thank the São Paulo Research Foundation (FAPESP) (grant: 2019/11088-2) for funding this study.
Conflict of interest
The authors declare that the research was conducted in the absence of any commercial or financial relationships that could be construed as a potential conflict of interest.
Publisher's note
All claims expressed in this article are solely those of the authors and do not necessarily represent those of their affiliated organizations, or those of the publisher, the editors and the reviewers. Any product that may be evaluated in this article, or claim that may be made by its manufacturer, is not guaranteed or endorsed by the publisher.
References
1. Rocha SR, Dornelas LF, Magalhães LC. Assessment tools utilized for the evaluation of preterm neonates in Brazil: literature review. Braz J Occup Ther. (2013) 21(1):109–17. doi: 10.4322/cto.2013.015
2. Pellegrino LA. Tradução e adaptação transcultural do “Caregiver Priorities and Child Health Index of Life with Disabilities Questionnaire” (CPCHILD©) para a língua portuguesa no Brasil (master dissertation). The Medical School (FMB) of the São Paulo State University, Brazil (2013).
3. Ferreira-Vasques AT. Escala de Desenvolvimento Mental de Griffiths para crianças de 0 a 2 anos – adaptação para a população brasileira (tese doutorado). Faculdade de Odontologia de Bauru da Universidade de São Paulo, Bauru (2017).
4. Ferreira-Vasques AT, Lamônica DAC. Instrumentalized evaluation for diagnosis of developmental disorders in childhood: a bew Brazilian reality. CoDAS. (2018) 30(6):e20180056. doi: 10.1590/2317-1782/20182018056
5. Stroud L, Foxcroft C, Green E, Bloomfield S, Cronje J, Hurter K, et al. Manual Griffiths III – Part I: Overview, Development and Psychometric Properties. Griffiths Scales of Child Development. Oxford: Hogrefe (2017).
6. Ferreira-Vasques AT, Santos CF, Lamônica DAC. Transcultural adaptation process of the Griffiths-III mental development scale. Child Care Health Dev. (2019) 45(3):403–8. doi: 10.1111/cch.12664
7. Reyes A, Pacifico R, Benitez B, Villanueva-Uy E, Lam H, Ostrea EM Jr. Use of the Griffiths mental development scales in an agro-industrial province in the Philippines. Child Care Health Dev. (2010) 36(3):354–60. doi: 10.1111/j.1365-2214.2010.01080.x
8. Morris J, Perkins D, Sarkozy V, Moline A, Zwi K, Williams K. Performance of the Australian developmental screening test in a clinical setting. J Paediatr Child Health. (2012) 48:1004–9. doi: 10.1111/j.1440-1754.2012.02588.x
9. Giovannetti AM, Raggi A, Leonardi M, Mosca F, Gangi S, Sabbadini S, et al. Usefulness of ICF-CY to define functioning and disability in very low birth weigth children: a retrospective study. Early Hum Dev. (2013) 89:825–31. doi: 10.1016/j.earlhumdev.2013.07.014
10. Morag I, Bart O, Raz R, Shayevitz S, Simchen MJ, Strauss T, et al. Developmental characteristics of late preterm infants at six and twelve months: a prospective study. Infant Behav Dev. (2013) 36(3):451–6. doi: 10.1016/j.infbeh.2013.03.010
11. van Buuren LM, van der Aa NE, Dekker HC, Vermeulen RJ, van Nieuwenhuizen O, van Schooneveld MM, et al. Cognitive outcome in childhood after unilateral perinatal brain injury. Dev Med Child Neurol. (2013) 55:934–40. doi: 10.1111/dmcn.12187
12. Peroni E, Vigone MC, Mora S, Bassi LA, Pozzi C, Passoni A, et al. Congenital hypothyroidism treatment in infants: a comparative study between liquid and tablet formulations of levothyroxine. Horm Res Paediatr. (2014) 81(1):50–4. doi: 10.1159/000356047
13. Fontana C, Picciolini O, Fumagalli M, Mosca F, Bernardelli G, Leonardi M, et al. A longitudinal ICF-CY-based evaluation of functioning and disability of children born with very low birth weight. Int J Rehabil Res. (2016) 39(4):296–301. doi: 10.1097/MRR.0000000000000183
14. Birajdar S, Rao S, McMichael J. Neurodevelopmental outcomes of neonates undergoing surgery under general anesthesia for malrotation of intestines. Early Hum Dev. (2017) 109:32–6. doi: 10.1016/j.earlhumdev.2017.04.003
15. Gunkel J, de Vries LS, Jongmans M, Koopman-Esseboom C, van Haastert IC, Eijsermans , et al. Outcome of preterm infants with postnatal cytomegalovirus infection. Pediatrics. (2018) 141(2):e20170635. doi: 10.1542/peds.2017-0635
16. Li HH, Feng JY, Wang B, Zhang Y, Wang CX, Jia FY. Comparison of the children neuropsychological and behavior scale and the Griffiths mental development scales when assessing the development of children with autism. Psychol Res Behav Manag. (2019) 12:973–81. doi: 10.2147/PRBM.S225904
17. Laughton B, Naidoo S, Dobbels EFMT, Boivin MJ, van Rensburg AJ, Glashoff RH, et al. Neurodevelopment at 11 months after starting antiretroviral therapy within 3 weeks of life. South Afr J HIV Med. (2019) 20(1):1008. doi: 10.4102/sajhivmed.v20i1.1008
18. Lugli L, Pugliese M, Plessi C, Berardi A, Guidotti I, Ancora G, et al. Neuroprem: the neuro-developmental outcome of very pow birth weight infants in Italian region. Ital J Pediatr. (2020) 46(1):26. doi: 10.1186/s13052-020-0787-7
19. O'Connor A, Seeber C, Harris E, Hamilton D, Sachmann M, Fisher C. Developmental outcomes following prenatal exposure to methamphetamine: a western Australian perspective. J Paediatr Child Health. (2020) 56(3):372–8. doi: 10.1111/jpc.14618
20. Ricci D, Martinelli D, Ferrantini G, Lucibello S, Gambardella M, Olivieri G, et al. Early neurodevelopmental characterization in children with cobalamin C/defect. J Inherit Metab Dis. (2020) 43(2):367–74. doi: 10.1002/jimd.12171
21. Hepp ZS, Haas VM, Latal B, Meuli M, Möhrlen U, Schauer SM, et al. Early childhood neurodevelpmental outcome after open prenatal spina bífida aperta repair. Dev Med Child Neurol. (2021) 63(11):1302–7. doi: 10.1111/dmcn.14993
22. Lukens AM, Winfield NR, Xanthidis CA, Arichi T. Predictive validity of the lacey assessment of preterm infants for motor outcome at 2 years corrected age. Early Hum Dev. (2021) 155:105334. doi: 10.1016/j.earlhumdev.2021.105334
23. Wang H, Du Y, Mao Z, Che Y, Li H, Ding L, et al. Use of the Griffiths mental development scale-Chinese in the assessment of children with autism spectrum disorder and global developmental delay/intellectual disability. Medicine (Baltimore). (2021) 100(13):e25407. doi: 10.1097/MD.0000000000025407
24. Amaral J, Peixoto S, Faria D, Resende C, Taborda A. Survival and neurodevelopmental outcomes of premature infants with severe peri-intraventricular hemorrhage at 24 months of age. Acta Médica Portuguesa. (2022) 35(1):42–50. doi: 10.20344/amp.12295
25. Romeo DM, Ricci M, Mirra F, Venezia I, Mallardi M, Pede E, et al. Longitudinal cognitive assessment in low-risk very preterm infants. Medicina (Kaunas). (2022) 58(1):133. doi: 10.3390/medicina58010133
26. Ottati F, Noronha APP. Psychometric parameters of professional interest instruments. Estud Pesqui Psicol. (2003) 3(2):37–50.
27. Schardosim JM, Ruschel LM, Pinheiro da Motta GdeC, Chollopetz da Cunha ML. Cross-cultural adaptation and clinical validation of the neonatal skin condition score to Brazilian Portuguese. Rev Lat Am Enfermagem. (2014) 22(5):834–41. doi: 10.1590/0104-1169.3456.2487
28. Brazilian Institute of Geography and Statistics. Síntese de Indicadores Sociais – Uma análise das condições de vida da população brasileira (2010). Available online at: https://biblioteca.ibge.gov.br/index.php/biblioteca-catalogo?view=detalhes&id=245700 (accessed March 02 2023).
29. Frankenburg WK, Dodds J, Archer P, Bresnick B, Maschka P, Edelman N, et al. Denver II Training Manual. Denver: Denver Developmental Materials (1992).
31. Beaton DE, Bombardier C, Guillemin F, Ferraz MB. Guidelines for the process of cross-cultural adaptation of self-report measures. Spine. (2000) 25(3):186–91. doi: 10.1097/00007632-200012150-00014
32. Bento-Gaz ACP, Béfi-Lopes DM. Adaptation of clinical evaluation of language functions – 4th edition to Brazilian Portuguese. CoDAS. (2014) 26(2):131–7. doi: 10.1590/2317-1782/2014488IN
33. Torres TZG, Magnanini MMF, Luiz RR. Amostragem. In: Medronho RA, editor. Epidemiologia. São Paulo: Editora Atheneu (2009). p. 403–14.
34. Muluk NB, Bayoğlu B, Anlar B. Language development and affecting factors in 3- to 6-year-old children. Eur Arch Oto-Rhino-Laryngol. (2014) 271:871–8. doi: 10.1007/s00405-013-2567-0
35. Li HH, Wang CX, Feng JY, Wang B, Li CL, Jia FY. A developmental profile of children with autism spectrum disorder in China using the Griffiths mental development scales. Front Psychol. (2020) 11:570923. doi: 10.3389/fpsyg.2020.570923
36. Guzzardi MA, Granziera F, Sanguinetti E, Ditaranto F, Muratori F, Iozzo P. Exclusive breastfeeding predicts higher hearing-language development in girls of preschool age. Nutrients. (2020) 12(8):2320. doi: 10.3390/nu12082320
37. Sansavini A, Favilla ME, Guasti MT, Marini A, Millepiedi S, Di Martino MV, et al. Developmental language disorder: early predictors, age for the diagnosis, and diagnostic tools. A scoping review. Brain Sci. (2021) 11(5):654. doi: 10.3390/brainsci11050654
38. Ribeiro CD, Pachelli MR, Amaral NC, Lamônica DA. Development skills of children born premature with low and very low birth weight. CoDAS. (2017) 29:1–6. doi: 10.1590/2317-1782/20162016058
39. Lamônica DAC, Becaro CK, Borba AC, Maximino LP, Costa ARAD, Ribeiro CDC. Communicative performance and vocabulary domain in preschool preterm infants. J Appl Oral Sci. (2018) 26:e20170186. doi: 10.1590/1678-7757-2017-0186
40. Lamônica DAC, Anastácio-Pessan FDL, Ferraz PMDP, Ribeiro CDC. Performance in motor, communicative and cognitive skills of girls with congenital hypothyroidism treated from the neonatal period. CoDAS. (2020) 32(1):e20190017. doi: 10.1590/2317-1782/20192019017
41. Chang SM, Grantham-McGregor SM, Powell CA, Vera-Hernandez M, Lopez Boo F, Baker-Henningham H, et al. A parenting intervation delivered at routine primary health visits improved child cognitive development and parenting knowledge. West Indian Med J Suppl. (2015):1–75. doi: 10.1542/peds.2015-0119
42. Ferreira AT. Receptive and expressive vocabulary of children with Down syndrome (master dissertation). Bauru School of Dentistry of the University of São Paulo, Brazil (2010).
43. Nip IS, Green JR, Marx DB. The co-emergence of cognition, language, and speech motor control in early development: a longitudinal correlation study. J Commun Disord. (2011) 44(2):149–60. doi: 10.1016/j.jcomdis.2010.08.002
44. Swingler MM, Perry NB, Calkins SD. Neural plasticity and the development of attention: instrinsec and extrinsic influences. Dev Psychopathol. (2015) 27(2):443–57. doi: 10.1017/S0954579415000085
45. Potterton J, Hilburn N, Strehlau R. Developmental status of preschool children receiving cART: a descriptive cohort study. Child Care Health Dev. (2016) 42(3):410–4. doi: 10.1111/cch.12321
46. Fazzi E, Micheletti S, Calza S, Merabet L, Rossi A, Galli J, et al. Early visual intervention study group. Early visual training and environmental adaptation for infants with visual impairment. Dev Med Child Neurol. (2021) 63(10):1180–93. doi: 10.1111/dmcn.14865
47. Pino MC, Donne IL, Vagnetti R, Tiberti S, Valenti M, Mazza M. Using the Griffiths mental development scales to evaluate a developmental profile of children with autism Spectrum disorder and their symptomatologic severity. Child Psychiatr Hum Dev. (2024) 55(1):117–26. doi: 10.1007/s10578-022-01390-z
Keywords: child development, child, cross-cultural comparison, neurosciences, protocols
Citation: Ferreira-Vasques AT, da Rocha EP, Green E and Lamônica DAC (2025) Griffiths Scales of Child Development 3rd Edition: normalization for the Brazilian population. Front. Pediatr. 13:1481442. doi: 10.3389/fped.2025.1481442
Received: 15 August 2024; Accepted: 22 January 2025;
Published: 10 February 2025.
Edited by:
Eric J. Moody, University of Wyoming, United StatesReviewed by:
Ilaria Farella, University of Bari Aldo Moro, ItalyAneta Demerdzieva, Goce Delcev University, North Macedonia
Copyright: © 2025 Ferreira-Vasques, da Rocha, Green and Lamônica. This is an open-access article distributed under the terms of the Creative Commons Attribution License (CC BY). The use, distribution or reproduction in other forums is permitted, provided the original author(s) and the copyright owner(s) are credited and that the original publication in this journal is cited, in accordance with accepted academic practice. No use, distribution or reproduction is permitted which does not comply with these terms.
*Correspondence: Dionísia Aparecida Cusin Lamônica, ZGlvbmVsYW1AdW9sLmNvbS5icg==