 Celeste G. Dixon
 Eduardo A. Trujillo Rivera
 Anita K. Patel
 Murray M. Pollack
- Department of Pediatrics, Division of Critical Care Medicine, Children's National Hospital, George Washington University School of Medicine and Health Sciences, Washington, DC, United States
Introduction: Renal dysfunction is common in critically ill children and increases morbidity and mortality risk. Diagnosis and management of renal dysfunction relies on creatinine, a delayed marker of renal injury. We aimed to develop and validate a machine learning model using routinely collected clinical data to predict 24-hour creatinine change in critically ill children before change is observed clinically.
Methods: Retrospective cohort study of 39,932 pediatric intensive care unit encounters in a national multicenter database from 2007 to 2022. A neural network was trained to predict <50% or ≥50% creatinine change in the next 24 h. Admission demographics, routinely measured vital signs, laboratory tests, and medication use variables were used as predictors for the model. Data set was randomly split at the encounter level into model development (80%) and test (20%) sets. Performance and clinical relevance was assessed in the test set by accuracy of prediction classification and confusion matrix metrics.
Results: The cohort had a male predominance (53.8%), median age of 8.0 years (IQR 1.9−14.6), 21.0% incidence of acute kidney injury, and 2.3% mortality. The overall accuracy of the model for predicting change of <50% or ≥50% was 68.1% (95% CI 67.6%−68.7%). The accuracy of classification improved substantially with higher creatinine values from 29.9% (CI 28.9%−31.0%) in pairs with an admission creatinine <0.3 mg/dl to 90.0–96.3% in pairs with an admission creatinine of ≥0.6 mg/dl. The model had a negative predictive value of 97.2% and a positive predictive value of 7.1%. The number needed to evaluate to detect one true change ≥50% was 14.
Discussion: 24-hour creatinine change consistent with acute kidney injury can be predicted using routine clinical data in a machine learning model, indicating risk of significant renal dysfunction before it is measured clinically. Positive predictive performance is limited by clinical reliance on creatinine.
Introduction
Approximately one quarter of children admitted to a pediatric intensive care unit (PICU) will develop acute kidney injury (AKI) during the course of their illness (1). Renal dysfunction can cause fluid overload, electrolyte derangements, altered drug metabolism, and uremia. It is associated with higher risk of mortality and morbidity, prolonged PICU and hospitalization stays, and longer duration of mechanical ventilation (1–4). Children diagnosed with AKI are at higher risk for chronic kidney disease (CKD), hypertension, and cardiovascular disease (5–7). Current diagnosis and management of AKI relies on creatinine as the primary indicator of renal function, yet creatinine is a delayed marker of renal injury (8). It can take 24 h or more from an initial insult for creatinine to significantly rise depending on the extent of renal injury, metabolic rate, degree of fluid overload, and underlying pathology such as shock, infection, or toxin exposure (9–12). Measurement is also limited by the accuracy of creatinine laboratory tests, which depending on the assay used may have as much as 20% error at normal adult creatinine values and up to 50% error at lower values (13–16). This is particularly noteworthy in infants who may have a baseline creatinine of 0.3–0.4 mg/dl; Kidney Disease Improving Global Outcomes (KDIGO) Stage 1 AKI (a 50% increase in serum creatinine) may be within the laboratory margin of error for this population (8, 17). Several novel biomarkers of renal injury have been described, but their use has so far been limited by low specificity for AKI, variable performance in different etiologies of AKI, and limited adoption in clinical practice (18).
Accurate prediction of renal dysfunction could benefit at-risk patients. Earlier recognition of risk of renal dysfunction prior to creatinine change could prompt treatment strategies to reduce the risk of ongoing renal injury and to prevent adverse clinical consequences by limiting nephrotoxic medication exposure, avoiding electrolyte derangements, and adjusting fluid management. It could also reduce time to initiation of renal replacement therapy (RRT), which has been associated with improved outcomes (19). However, the same factors that make renal dysfunction challenging to diagnose in real time also contribute to the difficulty predicting its development and clinical course. Previous pediatric efforts to predict renal dysfunction using traditional statistical methods have been limited by relatively small sample size, reliance on expert consensus for selection of variables, prediction only at time of admission, and variable performance of the prediction models (20–22). There is growing interest in using big data with machine learning techniques to predict risk of renal dysfunction in critically ill children (23–25). We aimed to develop and validate a clinically relevant machine learning model using routinely collected clinical data from a large, multi-center database to predict 24-hour creatinine change in critically ill children during their acute illness. Primary outcome was creatinine change of ≥50%, consistent with KDIGO Stage 1 AKI (8).
Methods
This study was approved by the Children's National Hospital Institutional Review Board with requirement for informed consent waived. Transparent reporting of a multivariable prediction model for individual prognosis or diagnosis (TRIPOD) guidelines were followed (26).
Database
Data were collected from Real-World Data™ (RWD) (Oracle Corporation, Austin, TX), a national, de-identified database of US hospital admissions. Hospitals do not have to use Cerner EHR to contribute data to RWD. Available data includes demographic information, admission information (location, hospital unit), clinical variables (vital signs, respiratory support, and diagnostic codes), laboratory values, medications administration records, and hospital outcome. All data are time- and date-stamped.
All pediatric encounters (age >1 month to ≤18 years) with an inpatient intensive care unit (ICU) designation were extracted from 2007 to 2022. If repeated ICU admissions occurred within one hospital admission, up to 4 ICU admissions were included (Appendix Table 1). Primary inclusion criteria were a creatinine measured within 24 h of ICU admission (admission creatinine), and at least 2 creatinine values measured within 24 ± 6 h of each other during the ICU admission. Encounters were excluded if ICU length of stay was <6 h, if there were associated diagnostic codes for CKD, congenital renal anomalies, dialysis dependence, or renal transplant, less than 2 records of vital signs, or if there were absent urine output (UOP), weight, or temperature records (Figure 1). Diagnostic codes for CKD, renal anomalies, dialysis dependence, and renal transplant are shown in Appendix Table 6. Other database details are given in Appendices A–E.
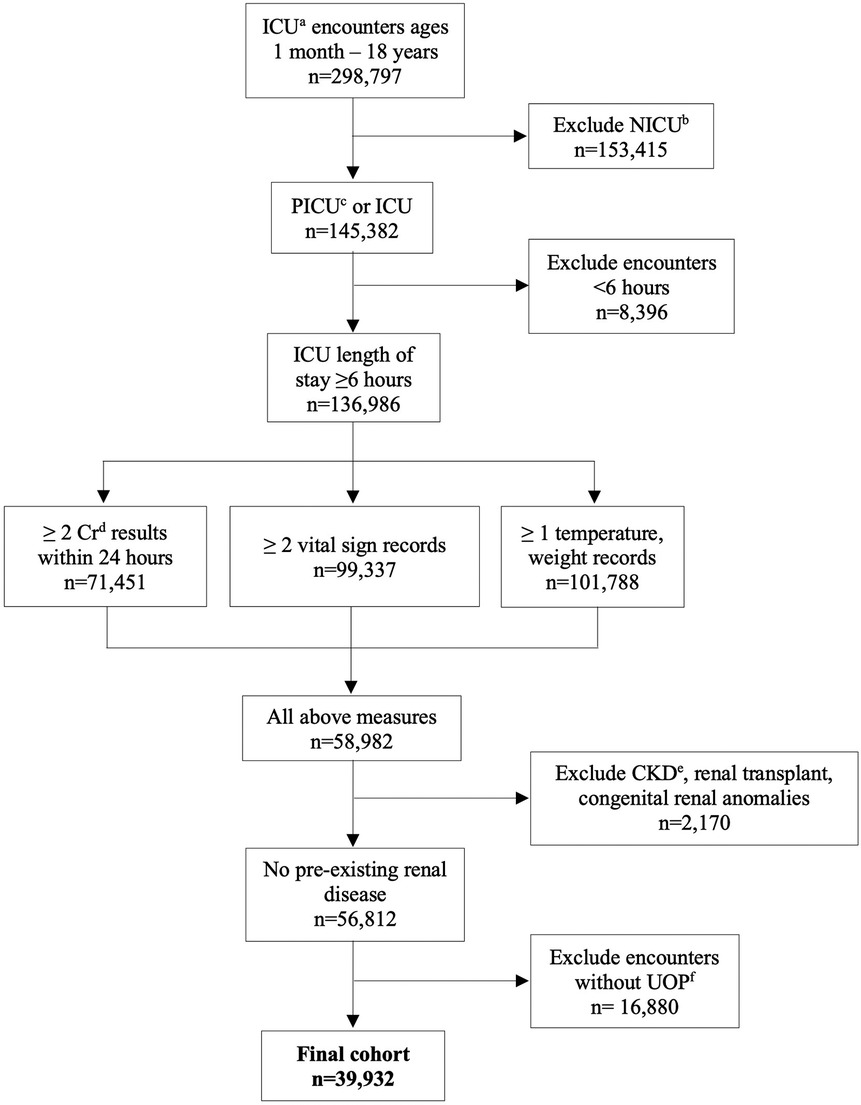
Figure 1. CONSORT diagram of encounter selection. aintensive care unit; bneonatal intensive care unit; cpediatric intensive care unit; dcreatinine; echronic kidney disease; furine output.
Variables
Demographic and descriptive variables included age, sex, date and time of admission, length of stay, diagnostic codes, and hospital discharge outcome. Clinical event variables included vital signs, respiratory support (fraction inhaled oxygen, positive end-expiratory pressure, peak inspiratory pressure, tidal volume), and urine output. Urine output was expressed as ml/kg/hr computed over 12-hour periods. Laboratory variables included time, date, and result of 43 routinely measured chemistries, blood gases, and hematologic variables (Appendix Table 2). Drug levels were included for gentamicin and vancomycin. Medications included fluids, vasoactives, diuretics, and nephrotoxic medications and were included based on known associations with renal function (27–29). Medications were included as binary variables (received, not received). Missing data was imputed with physiologic normal data until a measurement was recorded (Appendix Tables 3, 4). Variables recorded in less than 500 encounters were excluded. International Classification of Diseases (ICD) −9 and −10 codes were categorized into the following: cardiovascular disease, infection, malignancy, neurologic disease, respiratory disease, trauma/ingestion, other, and not specified, based on respective ICD classifications (30, 31). AKI was defined by KDIGO criteria (8). Detailed descriptions of all variables are given in Appendices B–E.
Outcome
The primary outcome was a binary prediction of <50% or ≥50% increase in creatinine in the subsequent 24 ± 6 h. The classification threshold of ≥50% was selected to focus on creatinine change meeting AKI criteria (8). This outcome was evaluated for all creatinine pairs occurring in days 1–5 of ICU admission in order to capture changes in renal function in the acute illness phase.
Model development and performance
Inclusion criteria for data points were that creatinine values had to occur in pairs, with the second value measured 24 ± 6 h after the first. The admission creatinine could serve as the first creatinine of a pair. The second creatinine of a pair could also serve as the first creatinine value for a subsequent pair. All model variables that occurred in the 48 h preceding the first creatinine of a pair were included. These 48 h were divided into 4 12-hour time periods. If there was no recorded value for a variable, the last known result was imputed. The maximum, minimum, average, range, and number of measurements for each variable in each 12-hour period were included. The maximum and minimum value of each variable from the entire admission period preceding the first creatinine of the pair were also included, regardless of when they occurred. If two variables were highly correlated (Pearson correlation value ≥0.9 or ≤−0.9), the most reliable, earliest occurring, directly measured variable was kept and the other removed (see Appendix F).
The data set (141,658 creatinine pairs) was divided randomly into 64% training set, 16% validation set and 20% test set. Random selection was done at the patient level. The training set was used for model development while the validation set was used to avoid overfitting or underfitting during model training. The test sample was used to evaluate model performance. The final model was the result of sequential experimentation using fully connected neural networks. The data were weighted such that positive outcome pairs (≥ 50% increase in creatinine) were weighted 23.6 × the negative outcome pairs. Model parameters used for experimentation were number of hidden layers, number of nodes per hidden layer, smoothing parameter values for L1 and L2 regularizations on the nodes values at each layer, proportion of node dropout per hidden layer, and variable sample weight during training. The validation set mean absolute error was the target for minimization at each training epoch. The mean absolute error and median absolute errors curves for both the training and validation set were used to monitor for overfitting and underfitting. Each model could be trained for 500 epochs, but training was stopped if no reduction on the mean absolute error was observed. The final model had eight hidden layers, with nodes between 114 and 484 per layer. Dropout rates for each layer ranged from 0.01 to 0.19, and L1/L2 smoothing parameters ranged from 0.0001 to 0.002.
Model performance was assessed with accuracy for both the total test sample and compared across groups by admission creatinine, first creatinine of the pair, and age. Performance was further evaluated with confusion matrix metrics and the clinical relevance was assessed with the number needed to evaluate (NNE ± 1/Positive predictive value), the number of cases that need to be screened to identify one at risk case. Accuracy was also compared between predictions made in hours 0–47 and hours 48–120 of PICU admission. The absolute creatinine change was also assessed for all test set creatinine pairs.
Feature importance was evaluated using a Local Interpretable Model-Agnostic Explanation (LIME) approach, which treats each prediction locally as a linear model and assigns covariate importance (32). A random sample of 1000 creatinine pairs where change was ≥50% and 1000 creatinine pairs where change was <50% were used for this analysis. For each case, the 15 most important variables were determined using LIME. The frequency with which each variable appeared in the top 15 variables for the sample cases determined the overall importance.
All model development and analysis was done using R, version 4.3.1 (https://www.r-project.org).
Results
There were 39,932 encounters in the cohort from 59 unique hospitals (Figure 1), with a male predominance (53.8%), and median age of 8.0 years (IQR 1.9–14.6). Descriptive data are shown in Table 1. Median length of stay was 7.9 days (IQR 4.1–16.3). Overall mortality was 2.3%. There was an associated diagnosis for 88.0% of encounters. The most common categories of diagnoses were respiratory disease (38.0%), cardiovascular disease (24.0%), and infection (23.9%) (Table 1). Incidence of AKI of any stage was 21.0% (8,393 encounters) (Table 1). There were 141,658 paired creatinine measures meeting criteria for model training and testing, of which 5,753 (4.1%) had ≥50% change in creatinine during the 24-hour period. These 5,753 pairs represented 3,637 unique encounters (Table 1). These encounters had a lower median age (4.6 years, IQR 1.0–12.1), higher mortality (6.57%), and longer length of stay (14.2 days, IQR 7.2–28.0).
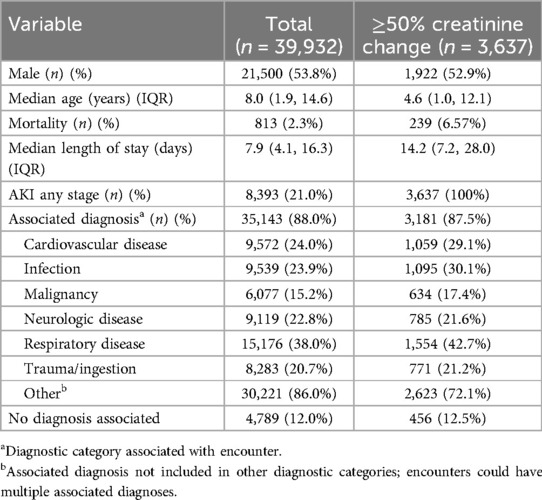
Table 1. Cohort description.
The accuracy of the neural network model is shown in Table 2. Since inclusion of diagnostic code did not improve performance, the final model did not include diagnostic information. The overall accuracy of the model for predicting change of <50% or ≥50% was 68.1% (95% CI 67.6%−68.7%). In the subset of creatinine pairs where the measured change was <50%, the accuracy was 68.7% (CI 68.1% - 69.2%) and for pairs where the measured change was ≥50%, the accuracy was 55.1% (CI 52.2%−57.9%). The accuracy of classification improved substantially with higher creatinine values, from 29.9% (CI 28.9%–31.0%) accuracy in pairs with an admission creatinine <0.3 mg/dl to an accuracy of 90.0%–96.3% in pairs with an admission creatinine of 0.6–≥1.2 mg/dl. Categorized by the first creatinine value of the pair, the accuracy increased from 56.0% (CI 54.9%−57.2%) for creatinine values <0.3 mg/dl to 86.0%–88.9% for those with creatinine 0.6–≥1.2 mg/dl. The accuracy in age groups increased from 51.4% (CI 49.1%–53.7%) in those 1–2 months of age to 85.9% (CI 84.2%–85.6%) for those ≥12 years. Accuracy was higher for predictions made after the first 48 h (73.2%, CI 72.3%−74.0%) than for predictions made in hours 0–47 (65.1%, CI 64.4%−65.8%) of PICU admission.
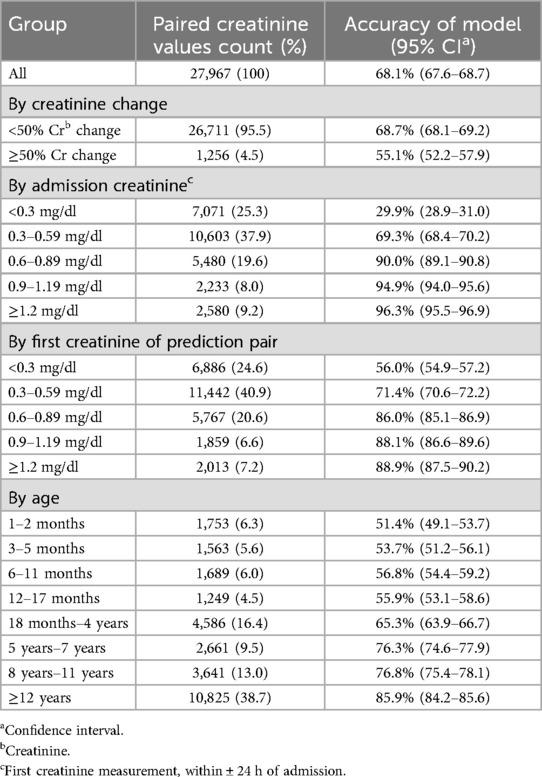
Table 2. Model performance in the test set.
Table 3 shows expanded performance metrics based on admission creatinine. Specificity overall was 68.7% (CI 68.1%–69.2%), with increasing specificity at higher admission creatinine values (92.1%–98.3% when creatinine ≥0.6 mg/dl). Negative predictive value (NPV) was high for all creatinine values (96.5%–98.1%), while positive predictive value (PPV) was low (5.4%–9.3%). The NNE was 14 overall, and ranged from 11 to 19 depending on admission creatinine.
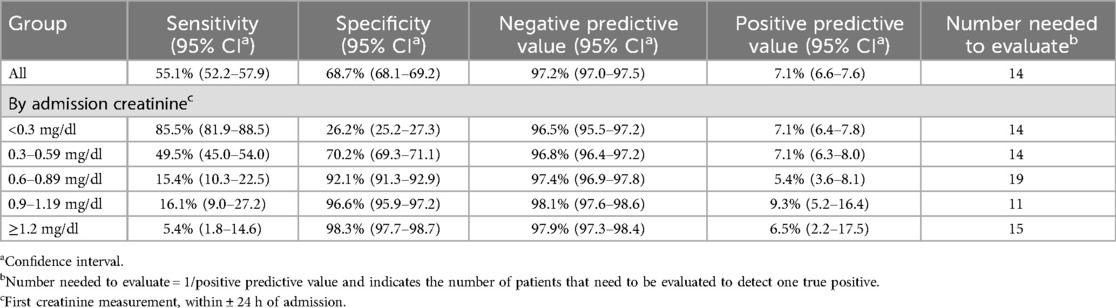
Table 3. Expanded model performance.
There were seven predictor variables that were among the most important for over 99% of all creatinine pairs (Figure 2). These were present creatinine value (first creatinine value of the pair), maximum creatinine value 0–12 h before prediction, admission creatinine value, crystalloid fluid administration, dopamine administration, vasopressin administration, and age. Several other variables were important for over 50% of predictions, including blood glucose level, creatinine 12–24 h before prediction, furosemide administration, and milrinone administration.
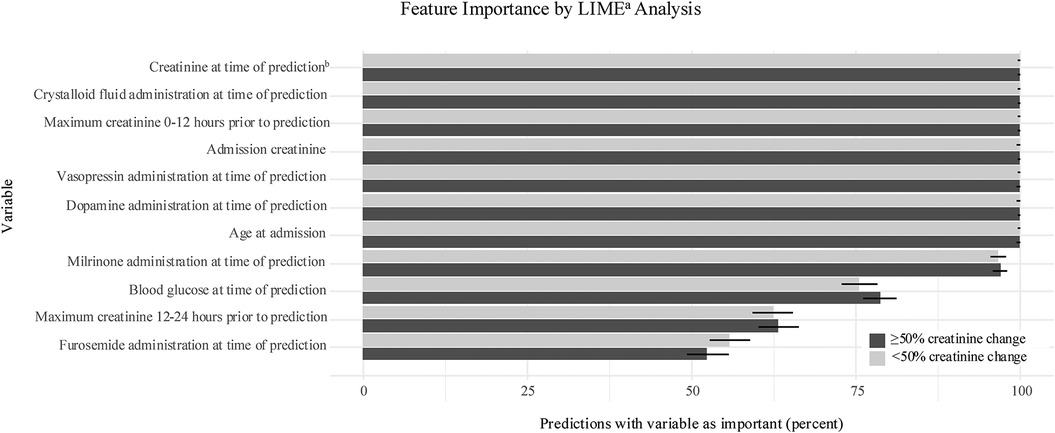
Figure 2. Feature importance. Variables with highest frequency in 15 most important variables for sample predictions. Importance expressed as percent with 95% confidence interval represented by error bar. aLocal Interpretable model-agnostic explanation; bfirst creatinine of prediction pair.
The absolute creatinine change by admission creatinine and the initial creatinine in the creatinine pairs is shown in Table 4. For all groups, the median change for those < 50% creatinine change was no change or a creatinine decrease while there was a substantial absolute change for the creatinine values in all ≥50% creatinine change groups, ranging from 0.16 mg/dl in the lowest admission creatinine group to 0.90 mg/dl in the highest group.
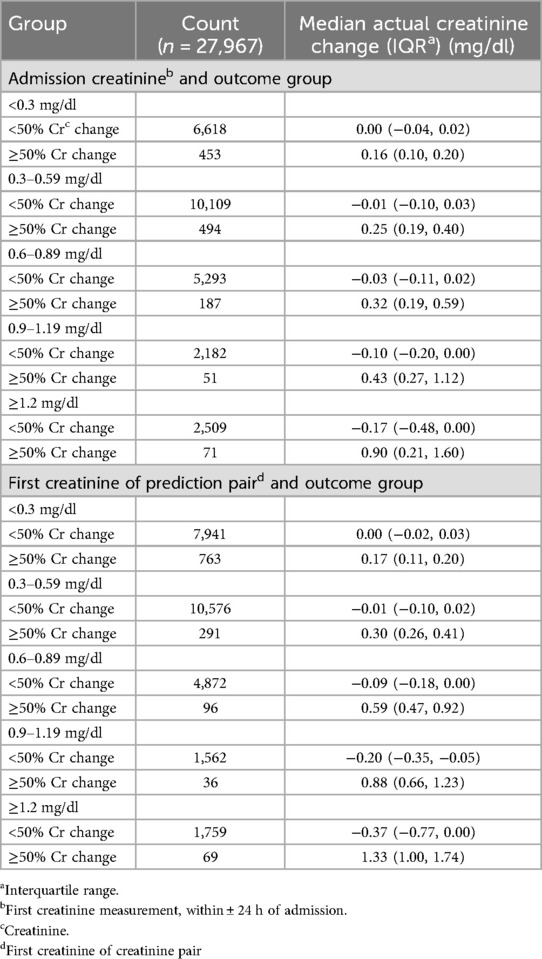
Table 4. Creatinine change in outcome groups by admission creatinine or first creatinine in the test set.
Discussion
Our results demonstrate that 24-hour creatinine change in critically ill children can be predicted with routine clinical data using a machine learning model. In patients with admission creatinine values of 0.6 mg/dl or higher, this model accurately classified a ≥50% change in creatinine in 90% of cases. The clinical suspicion of renal dysfunction in this sample was, presumably, relatively high since all patients had at least two creatinine values measured. Yet even in this population, only 4.1% of creatinine pairs in the data set had a creatinine change ≥50% in a 24-hour period. This likely contributed to the high NPV and low PPV. Low prevalence of the primary outcome may result in models that can accurately predict negative cases but have low PPV. However, the NNE indicates this model could still be clinically useful. The NNE averaging 14 patients and the high NPV could improve clinical care by identifying most of the low risk patients and isolating a relatively high risk population with a manageable NNE to be screened to detect one true positive. Given the potential clinical impact of renal dysfunction, this model would still be effective in identifying a high risk, but uncommon outcome.
Attempts to predict AKI in critically ill children have been limited by small sample size, restricted variable inclusion, and single time point prediction. The Renal Angina Index (RAI) relies on 5 variables to predict AKI 72 h after admission (20). In validation, only 30% of patients who developed AKI had a positive RAI score (21). The Pediatric Early AKI Risk Score uses 7 variables to predict the same outcome, with good negative predictive performance but lower positive prediction (22). Both studies had less than 10,000 patients. In contrast to these traditional approaches a recent machine learning model was developed in 16,863 patients, which predicted 41% of AKI episodes occurring in the first 48 h of admission with a true positive to false positive of 1:1 (29). Our model had larger sample size, more complete variable inclusion, and better predictive performance with predictions at any point in the first five days of ICU admission. The use of a neural network and outcome of creatinine change also distinguish our model from most other pediatric machine learning applications (33).
Renal dysfunction is challenging to predict due to the complex physiology of renal failure and the limitations of current mechanisms for its evaluation. Renal function is a dynamic process that is impacted by perfusion, oxygenation, systemic inflammation, fluid balance, and nephrotoxin exposure. These parameters may change rapidly in critically ill patients, leading to significant changes in renal function over time. Creatinine is also a delayed marker of renal injury, is confounded by fluid overload, and can have a variable baseline in patients with low muscle mass or chronic illness (9, 34, 35). However, clinical practice still relies on serum creatinine, for monitoring renal function. Several biomarkers of renal injury show promise as better indicators of renal function, but have limited availability and lack consensus on their use in the diagnosis or staging of AKI (36). None were measured with sufficient frequency to be included in our model. Ideally, model performance could be improved in the future by incorporating biomarkers of renal injury. A biomarker that can be measured with more precision and reflect more immediate changes in renal function than creatinine would result in an improved model.
Creatinine assays are particularly unreliable in pediatric patients, which adds to the challenge of an accurate prediction model in infants and young children. Assays may have up to 50% error in samples with creatinine <0.4 mg/dl, and there remains significant inter-assay variability (15, 16). In children with a baseline creatinine of 0.4 mg/dl, a 50% change in creatinine is an absolute change of only 0.2 mg/dl, which makes the detection of true AKI vs. artifact difficult for infants and young children (37). This may account for lower performance metrics, especially the low specificity in the subset of our cohort with low creatinine values. Given the inaccuracy of measured creatinine <0.4 mg/dl, a model that relies on creatinine measurement may be inaccurate at these values. It is possible that the observed difference in model performance is due to the limits of creatinine assays. Indeed, renal dysfunction models developed in adult populations have better performance than pediatric models, which may be a result of higher baseline creatinine values with more reliable laboratory measurements (38–40).
Our model was specifically designed as a dynamic prediction model with multiple variables to account for the complex, rapidly changing physiology during acute illness. This model has the potential to be clinically useful if integrated into the EHR so that predictor variables could be directly used to alert providers to predicted 24-hour creatinine change. The model performs well to predict patients with <50% creatinine change, which may be clinically useful. Identifying patients with low risk of developing renal dysfunction may impact decision making for nephrotoxic therapies such as empiric vancomycin or escalation of diuretics. Additionally, the model can identify cases with risk of ≥50% creatinine change with a NNE of 14. Predicting a rise in creatinine in this context, before it is measured clinically, could give clinicians a window of opportunity in which to mitigate renal damage, adjust fluid and electrolyte management, and reconsider the use of nephrotoxic medications. While working within the limitations of creatinine as a delayed indicator of renal function, it could still be possible to make proactive changes in management to protect the kidneys. The feature importance analysis revealed several medication exposures that were significant in the prediction model, which may indicate opportunities changes in management. It is also notable that performance of our model was not improved with the addition of diagnosis, implying that renal dysfunction can be predicted based on routine clinical measures, independent of the mechanisms of disease. EHR model integration would be an important future direction for this study to evaluate real-time clinical utility.
Our model has several limitations. First, it was developed and tested in a retrospective cohort which spanned a 15-year time period, in which there likely was variation in clinical practice and reliability of measured creatinine. Presumably, there was significant variability in the laboratory measurement techniques by institution and over time, especially influencing the model in the lower creatinine ranges. This extended time period may also explain why dopamine exposure had strong feature importance, as it was used frequently in the past but its use has declined more recently. Second, there are limitations common to the use of large, retrospective database studies. We were restricted to previously collected data, which may bias the study toward sicker patients who are more likely to have creatinine measured. Third, as required for many machine learning models, imputation was required for missing data. Fourth, there are additional limitations inherent to a neural network, including limited interpretability of variable importance. Lastly this model was optimized for predictive performance but has not been implemented clinically. As this model was created on a multicenter database, recalibration at individual sites may optimize its performance (41). The low prevalence of the positive outcome in this model also contributes to its lower performance predicting positive cases. The incorporation of alternate markers of renal dysfunction should be investigated in the future.
In summary, our study shows that short-term creatinine change can be predicted in critically ill children using routinely collected clinical data before a measured rise in creatinine is observed. If the creatinine value either at admission or any time in days 1–5 of PICU admission is ≥0.6 mg/dl, creatinine change in the next 24 h can be accurately predicted. The low prevalence of positive cases in this cohort limits model performance. If this model were applied clinically, 14 patients would need to be screened to detect one positive case. Despite the complexity of creatinine dynamics, the ability to predict creatinine change may allow for clinical interventions that minimize ongoing renal damage, avoid worsening of renal function, and mitigate clinical consequences.
Data availability statement
The original contributions presented in the study are included in the article/Supplementary Material, further inquiries can be directed to the corresponding author/s.
Ethics statement
The studies involving humans were approved by Children's National Hospital Institutional Review Board. The studies were conducted in accordance with the local legislation and institutional requirements. Written informed consent for participation was not required from the participants or the participants' legal guardians/next of kin in accordance with the national legislation and institutional requirements.
Author contributions
CD: Conceptualization, Data curation, Formal analysis, Methodology, Visualization, Writing – original draft, Writing – review & editing. ET: Data curation, Formal analysis, Methodology, Validation, Visualization, Writing – review & editing. AP: Methodology, Supervision, Writing – review & editing. MP: Conceptualization, Formal analysis, Methodology, Supervision, Writing – review & editing.
Funding
The author(s) declare that no financial support was received for the research and/or publication of this article. AKP receives funding from Eunice Kennedy Shriver National Institute of Child Health and Human Development (HD105978–01), but this study was not supported by the grant. No other financial support was used for this study.
Conflict of interest
The authors declare that the research was conducted in the absence of any commercial or financial relationships that could be construed as a potential conflict of interest.
Generative AI statement
The author(s) declare that no Generative AI was used in the creation of this manuscript.
Publisher's note
All claims expressed in this article are solely those of the authors and do not necessarily represent those of their affiliated organizations, or those of the publisher, the editors and the reviewers. Any product that may be evaluated in this article, or claim that may be made by its manufacturer, is not guaranteed or endorsed by the publisher.
References
1. Kaddourah A, Basu RK, Bagshaw SM, et al. Epidemiology of acute kidney injury in critically ill children and young adults. N Engl J Med. (2017) 376:11–20. doi: 10.1056/NEJMoa1611391
2. Alobaidi R, Anton N, Burkholder S, et al. Association between acute kidney injury duration and outcomes in critically ill children*. Pediatr Crit Care Med. (2021) 22:642–650. doi: 10.1097/PCC.0000000000002679
3. Alkandari O, Eddington KA, Hyder A, et al. Acute kidney injury is an independent risk factor for pediatric intensive care unit mortality, longer length of stay and prolonged mechanical ventilation in critically ill children: a two-center retrospective cohort study. Crit Care. (2011) 15:R146. doi: 10.1186/cc10269
4. Moffett BS, Arikan AA. Trajectory of AKI in hospitalized pediatric patients—impact of duration and repeat events. Nephrol Dial Transplant. (2021) 37(8):gfab219. doi: 10.1093/ndt/gfab219
5. Hessey E, Perreault S, Dorais M, et al. Acute kidney injury in critically ill children and subsequent chronic kidney disease. Can J Kidney Health Dis. (2019) 6:205435811988018. doi: 10.1177/2054358119880188
6. Mammen C, Al Abbas A, Skippen P, et al. Long-term risk of CKD in children surviving episodes of acute kidney injury in the intensive care unit: a prospective cohort study. Am J Kidney Dis. (2011) 59:523–530. doi: 10.1053/j.ajkd.2011.10.048
7. Menon S, Kirkendall ES, Nguyen H, et al. Acute kidney injury associated with high nephrotoxic medication exposure leads to chronic kidney disease after 6 months. J Pediatr. (2014) 165:522–527. doi: 10.1016/j.jpeds.2014.04.058
8. Kidney Disease Improving Global Outcomes. KDIGO clinical practice guideline for acute kidney injury. Kidney Int Suppl. (2012) 2:19–36. doi: 10.1038/kisup.2012.7
9. Waikar SS, Bonventre JV. Creatinine kinetics and the definition of acute kidney injury. J Am Soc Nephrol. (2009) 20:672–679. doi: 10.1681/ASN.2008070669
10. Macedo E, Bouchard J, Soroko SH, et al. Fluid accumulation, recognition and staging of acute kidney injury in critically-ill patients. Crit Care. (2010) 14(3):7. doi: 10.1186/cc9004
11. Dixon CG, Thadani S, Fitzgerald JC, et al. Fluid overload precedes and masks cryptic kidney injury in pediatric acute respiratory distress syndrome. Crit Care Med. (2023) 51:765–774. doi: 10.1097/CCM.0000000000005836
12. Macedo E, Lima C. Comprehensive assessment of kidney health in acute kidney injury: can it be achieved? Nephron. (2019) 143:188–192. doi: 10.1159/000502381
13. Srivastava T, Alon US, Althahabi R, et al. Impact of standardization of creatinine methodology on the assessment of glomerular filtration rate in children. Pediatr Res. (2009) 65:113–116. doi: 10.1203/PDR.0b013e318189a6e8
14. Schwartz GJ, Kwong T, Erway B, et al. Validation of creatinine assays utilizing HPLC and IDMS traceable standards in sera of children. Pediatr Nephrol. (2009) 24:113–119. doi: 10.1007/s00467-008-0957-0
15. Hoste L, Deiteren K, Pottel H, et al. Routine serum creatinine measurements: how well do we perform? BMC Nephrol. (2015) 16:21. doi: 10.1186/s12882-015-0012-x
16. Lao K, Sykes E, Van Wijk XMR, et al. Large inter-assay difference of serum creatinine in pediatric population: a threat to accurate staging of chronic kidney disease. Pediatr Nephrol. (2022) 37:677–681. doi: 10.1007/s00467-021-05335-x
17. Fitzgerald JC, Basu RK, Fuhrman DY, et al. Renal dysfunction criteria in critically ill children: the PODIUM consensus conference. Pediatrics. (2022) 149:S66–S73. doi: 10.1542/peds.2021-052888J
18. Bufkin KB, Karim ZA, Silva J. Review of the limitations of current biomarkers in acute kidney injury clinical practices. SAGE Open Med. (2024) 12:20503121241228446. doi: 10.1177/20503121241228446
19. Gist KM, Menon S, Anton-Martin P, et al. Time to continuous renal replacement therapy initiation and 90-day major adverse kidney events in children and young adults. JAMA Netw Open. (2024) 7:e2349871. doi: 10.1001/jamanetworkopen.2023.49871
20. Basu RK, Zappitelli M, Brunner L, et al. Derivation and validation of the renal angina index to improve the prediction of acute kidney injury in critically ill children. Kidney Int. (2014) 85:659–667. doi: 10.1038/ki.2013.349
21. Basu RK, Kaddourah A, Goldstein SL, et al. Assessment of a renal angina index for prediction of severe acute kidney injury in critically ill children: a multicentre, multinational, prospective observational study. Lancet Child Adolesc Health. (2018) 2:112–120. doi: 10.1016/S2352-4642(17)30181-5
22. Sanchez-Pinto LN, Khemani RG. Development of a prediction model of early acute kidney injury in critically ill children using electronic health record data. Pediatr Crit Care Med. (2016) 17:508–515. doi: 10.1097/PCC.0000000000000750
23. Bajaj T, Koyner JL. Artificial intelligence in acute kidney injury prediction. Adv Chronic Kidney Dis. (2022) 29:450–460. doi: 10.1053/j.ackd.2022.07.009
24. Raina R, Nada A, Shah R, et al. Artificial intelligence in early detection and prediction of pediatric/neonatal acute kidney injury: current status and future directions. Pediatr Nephrol. (2023) 39(8):2309–24. doi: 10.1007/s00467-023-06191-7
25. Sutherland SM. Big data and pediatric acute kidney injury: the promise of electronic health record systems. Front Pediatr. (2020) 7:536. doi: 10.3389/fped.2019.00536
26. Collins GS, Reitsma JB, Altman DG, et al. Transparent reporting of a multivariable prediction model for individual prognosis or diagnosis (TRIPOD): the TRIPOD statement. BMC Med. (2015) 13:1. doi: 10.1186/s12916-014-0241-z
27. Goswami E, Ogden RK, Bennett WE, et al. Evidence-based development of a nephrotoxic medication list to screen for acute kidney injury risk in hospitalized children. Am J Health Syst Pharm. (2019) 76:1869–1874. doi: 10.1093/ajhp/zxz203
28. Akcan-Arikan A, Gebhard DJ, Arnold MA, et al. Fluid overload and kidney injury score: a multidimensional real-time assessment of renal disease burden in the critically ill patient*. Pediatr Crit Care Med. (2017) 18:524–530. doi: 10.1097/PCC.0000000000001123
29. Dong J, Feng T, Thapa-Chhetry B, et al. Machine learning model for early prediction of acute kidney injury (AKI) in pediatric critical care. Crit Care. (2021) 25:288. doi: 10.1186/s13054-021-03724-0
30. World Health Organization. International Classification of Diseases: Ninth Revision, Basic Tabulation List with Alphabetic Index. Geneva: World Health Organization (1978).
31. World Health Organization. ICD−10: International Statistical Classification of Diseases and Related Health Problems: Tenth Revision. 2nd ed. Geneva: World Health Organization (2004).
32. Hvitfeldt E, Pedersen T, Benesty M. lime: Local Interpretable Model-Agnostic Explanations. (2022) Available at: https://lime.data-imaginist.com, https://github.com/thomasp85/lime (Accessed December 03, 2024).36377699
33. Heneghan JA, Walker SB, Fawcett A, et al. The pediatric data science and analytics subgroup of the pediatric acute lung injury and sepsis investigators network: use of supervised machine learning applications in pediatric critical care medicine research. Pediatr Crit Care Med. (2024) 25:364–374. doi: 10.1097/PCC.0000000000003425
34. Liu KD, Thompson BT, Ancukiewicz M, et al. Acute kidney injury in patients with acute lung injury: impact of fluid accumulation on classification of acute kidney injury and associated outcomes*. Crit Care Med. (2011) 39:2665–2671. doi: 10.1097/CCM.0b013e318228234b
35. Baxmann A, Ahmed M, Marques N, et al. Influence of muscle mass and physical activity on serum and urinary creatinine and serum cystatin C. Clin J Am Soc Nephrol. (2008) 3:348–354. doi: 10.2215/CJN.02870707
36. Wen Y, Parikh CR. Current concepts and advances in biomarkers of acute kidney injury. Crit Rev Clin Lab Sci. (2021) 58:354–368. doi: 10.1080/10408363.2021.1879000
37. Joffe M, Hsu C, Feldman HI, et al. Variability of creatinine measurements in clinical laboratories: results from the CRIC study. Am J Nephrol. (2010) 31(5):426–34. doi: 10.1159/000296250
38. Zimmerman LP, Reyfman PA, Smith ADR, et al. Early prediction of acute kidney injury following ICU admission using a multivariate panel of physiological measurements. BMC Med Inform Decis Mak. (2019) 19:16. doi: 10.1186/s12911-019-0733-z
39. Parreco J, Soe-Lin H, Parks J, et al. Comparing machine learning algorithms for predicting acute kidney injury. Am Surg. (2019) 85:725–729. doi: 10.1177/000313481908500731
40. Chiofolo C, Chbat N, Ghosh E, et al. Automated continuous acute kidney injury prediction and surveillance: a random forest model. Mayo Clin Proc. (2019) 94:783–792. doi: 10.1016/j.mayocp.2019.02.009
41. Patel AK, Trujillo-Rivera E, Chamberlain JM, et al. External evaluation of the dynamic criticality index: a machine learning model to predict future need for ICU care in hospitalized pediatric patients. PLoS One. (2024) 19:e0288233. doi: 10.1371/journal.pone.0288233
42. Andropoulos DB. Appendix B: pediatric normal laboratory values. In: Gregory GA, Andropoulos DB, editors. Gregory’s Pediatric Anesthesia. Hoboken, NJ: Wiley (2012). p. 1300–1314.
43. Klarmann D, Hintereder G, Thomas L. Pediatric reference ranges: reference intervals and orienting ranges for clinical chemistry and laboratory medicine in fetuses, newborn, and adolescents. In: Thomas L, editor. Clinical Laboratory Diagnostics. Frankfurt: Lothar Thomas (2023).
44. Hodiamont CJ, Van Den Broek AK, De Vroom SL, et al. Clinical pharmacokinetics of gentamicin in various patient populations and consequences for optimal dosing for gram-negative infections: an updated review. Clin Pharmacokinet. (2022) 61:1075–1094. doi: 10.1007/s40262-022-01143-0
45. Assicot M, Bohuon C, Gendrel D, et al. High serum procalcitonin concentrations in patients with sepsis and infection. Lancet. (1993) 341:515–518. doi: 10.1016/0140-6736(93)90277-N
46. Rybak MJ, Le J, Lodise TP, et al. Executive summary: therapeutic monitoring of vancomycin for serious methicillin-resistant staphylococcus aureus infections: a revised consensus guideline and review of the American society of health-system pharmacists, the Infectious Diseases Society of America, the pediatric infectious disease society, and the society of infectious disease pharmacists. Pharmacotherapy. (2020) 40:363–367. doi: 10.1002/phar.2376
47. Bronicki RA, Spenceley NC. Hemodynamic monitoring. In: Morrison W, Nelson McMillan KL, Shaffner DH, editors. Rogers’ Handbook of Pediatric Intensive Care. Philadelphia: Wolters Kluwer (2017). p. 304–10.
48. Powell FL, Heldt GP, Haddad GG. Respiratory physiology. In: Morrison W, Nelson McMillan KL, Shaffner DH, editors. Rogers’ Handbook of Pediatric Intensive Care. Philadelphia: Wolters Kluwer (2017). p. 118–26.
49. Kollisch-Singule M, Ramcharran H, Satalin J, et al. Mechanical ventilation in pediatric and neonatal patients. Front Physiol. (2022) 12:805620 doi: 10.3389/fphys.2021.805620
Appendix
Appendix A: Overview, data cleaning, and data definitions
Data cleaning: Cleaning of extracted data included removing duplicate or null values, standardizing units of measurement, and removing invalid entries (e.g., negative values, data extremes inconsistent with life). Data cleaning specific to each data type is outlined in sections below.
Data definitions
Pediatric patients: >1 month to ≤18 years at time of admission.
Inpatient: Inpatients were defined as those with Real World Data (RWD) encounter classification of “Inpatient”.
Intensive care unit (ICU): All encounters were included within the “Inpatient” classification with a RWD location classification of “intensive care unit” (ICU) or “pediatric intensive care unit” (PICU). “Neonatal intensive care unit” (NICU) encounters were excluded. Encounters with <6 h ICU length of stay were excluded. Up to 4 repeat ICU admission for any given encounter were included, with each ICU admission treated as a distinct event.
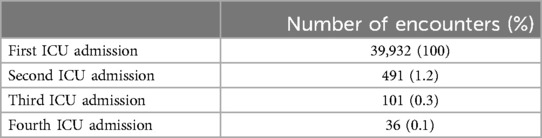
Appendix Table 1. Repeat ICU admissions.
Appendix B: Laboratory variables
Tests included were collected from whole blood or serum, at any site (venous, arterial, or capillary). For each included laboratory test, all recorded units and distribution of results were examined. Units were standardized to the most commonly used unit (ex: mg/dl to g/dl).
The distribution of each laboratory test was analyzed individually, with both descriptive statistics and graphical display. Lower and upper limits were based on clinically relevant ranges and physiology (see below). Values outside of these limits were excluded. Tests with units that did not fit the clinical distribution were also excluded. Any laboratory test that was present in less than 500 encounters was excluded and is not shown. The table below shows the laboratory variables included, the measurement units evaluated and standardized units, and upper and lower limits for range testing.
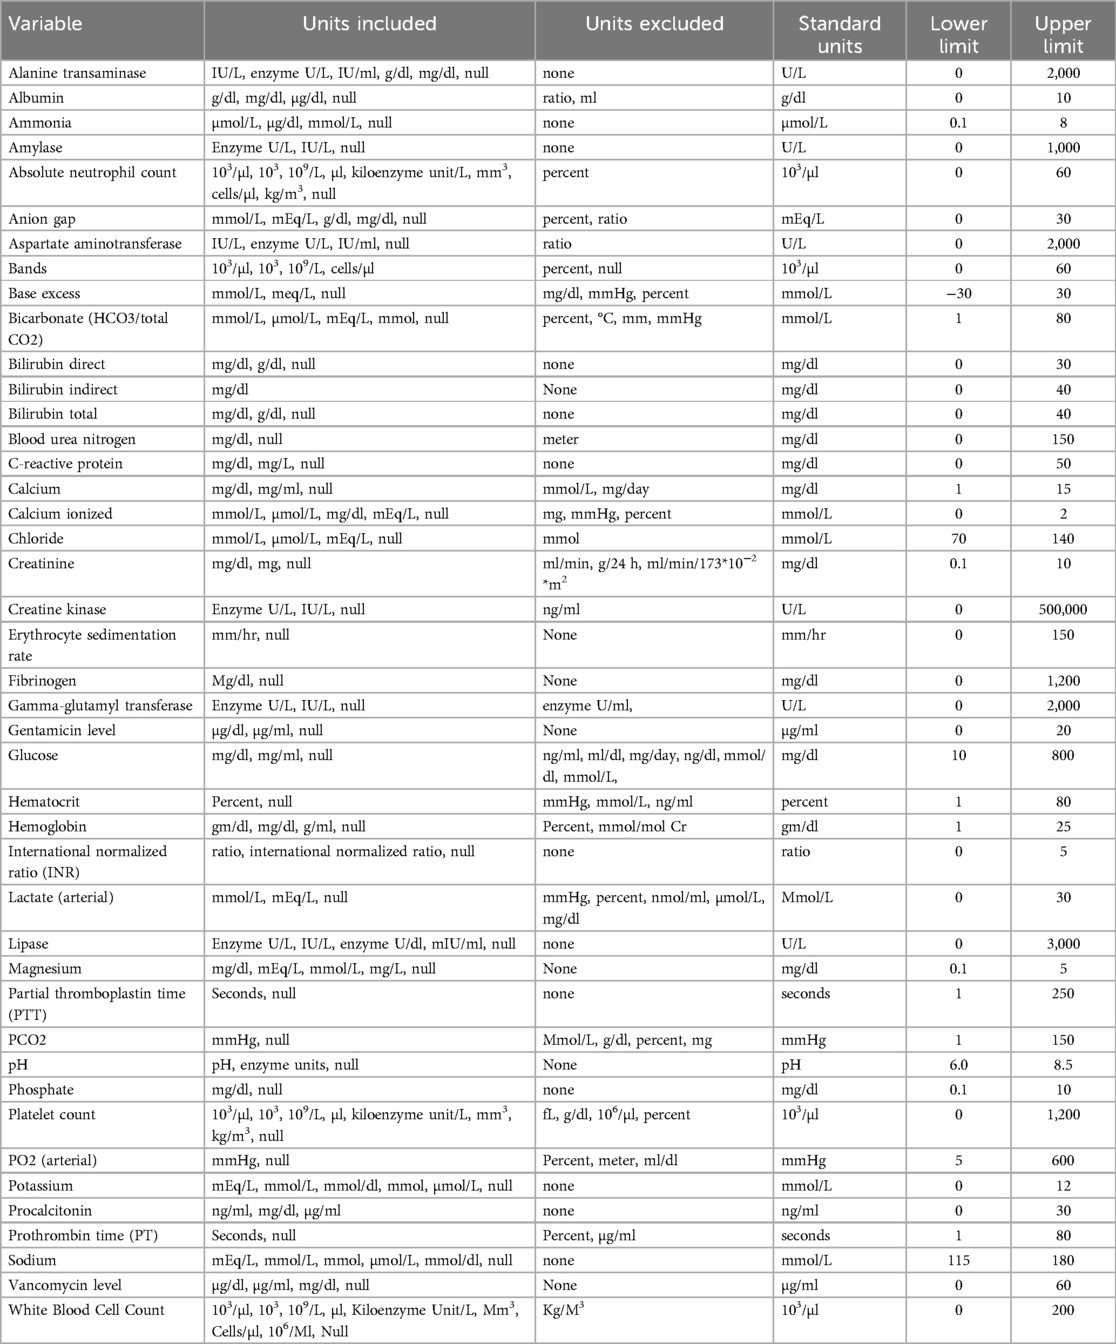
Appendix Table 2. Standardized laboratory variables.
Imputed laboratory values
Imputed values were used for variables without a recorded measurement. These were maintained until replaced by a recorded value. When possible, values were imputed based on numerical computation. For variables with insufficient data to use this method, imputed values were selected assuming normal physiology and reference values as follows:.
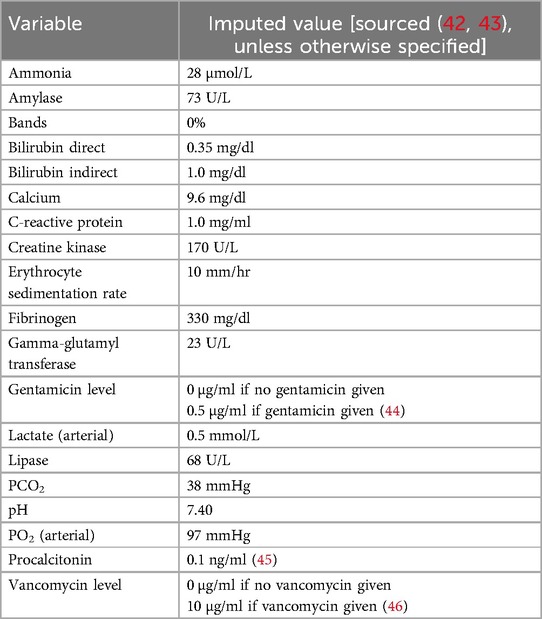
Appendix Table 3. Imputed laboratory values.
Appendix C: Vital signs, clinical variables, and measurements
Clinical variables and measurements were assessed as follows: all vital signs, clinical values, and measurements in this cohort was collected. All recorded units and distribution of results were examined. Units were standardized to the most commonly used. Units were converted to the standard. Data that could not be converted were excluded.
The distribution of each variable was analyzed individually, with both descriptive statistics and graphical display. Lower and upper limits were set based on clinical medicine. Values outside of these limits were excluded. Tests with units that did not fit the clinical distribution were also excluded. Any clinical variable that was recorded in less than 500 encounters was excluded.
Urine output data was standardized as follows: All measurements with recorded units of ml were included. Amount of urine recorded in a 12-hour period was summed (from 7 AM to 7 PM, and 7 PM to 7 AM). 12-hour urine output was divided by patient weight and hours to obtain urine output in ml/kg/hr for that time period.
Tidal volume for mechanically ventilated patients was also divided by patient weight to obtain tidal volume in ml/kg.
Imputed clinical values
As with laboratory values, imputed values were entered for variables without a recorded measurement. These were maintained until replaced by a recorded value. For variables with insufficient data to use this method, imputed values were selected assuming normal physiology values as follows:
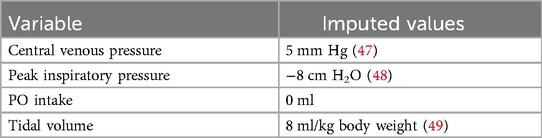
Appendix Table 4. Imputed clinical values.
Appendix D: Medication variables
All records of crystalloid or colloid volume expanders were evaluated, including those with supplemental electrolytes as listed below (Appendix Table 5). Both bolus and maintenance fluid volumes were counted. Vasoactive medications in both bolus doses and continuous infusions were included. Nephrotoxic medications were selected based on clinical evidence (27–29).
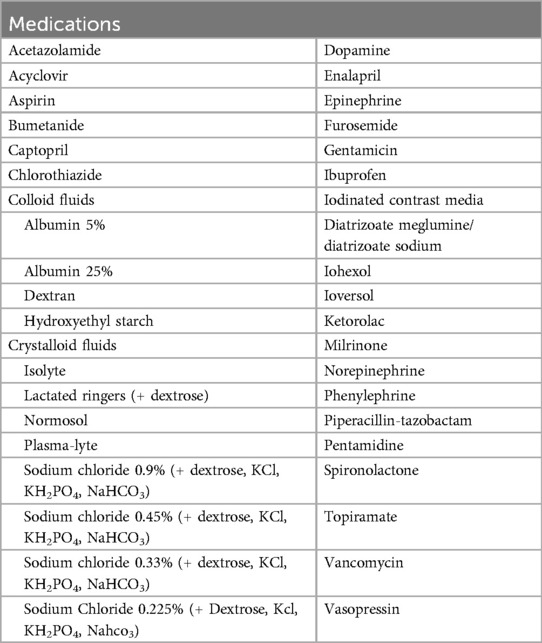
Appendix Table 5. Medications.
Appendix E: Diagnosis codes
Diagnostic and procedural codes from the International Classification of Diseases (ICD) −9 and −10 (30, 31) were available for 88% of patients. All diagnostic and procedural codes were first screened for indication of chronic kidney disease, congenital renal abnormalities, renal transplant status, and chronic dialysis dependence (Appendix Table 6). Encounters with these associated codes were excluded from the model.
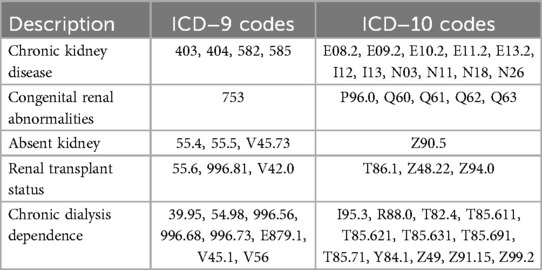
Appendix Table 6. Excluded diagnostic codes.
The diagnoses associated with each encounter were categorized into seven groups: cardiovascular disease, infection, malignancy, neurologic disease, respiratory disease, trauma/ingestion, or other. Diagnostic categories were not mutually exclusive (multiple diagnoses could be associated with a single encounter). If a diagnosis was not associated with a given encounter, it was coded as “no diagnosis associated”.
Appendix F: Model development
Model structure
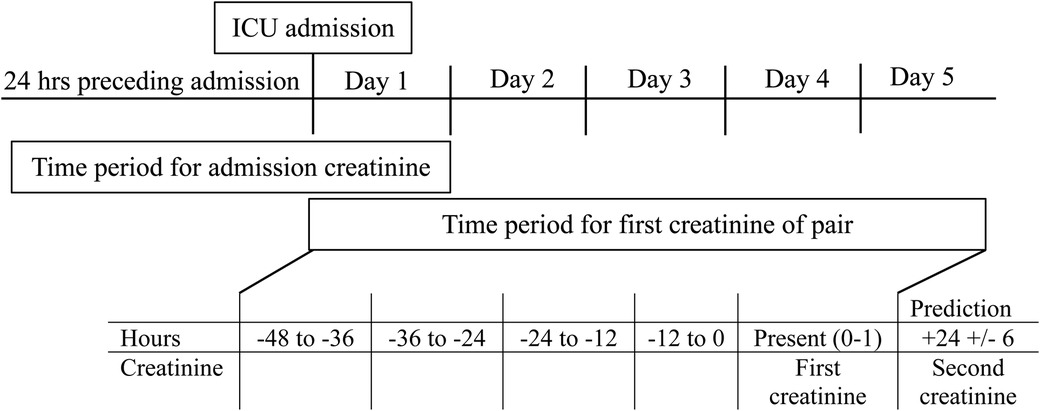
Every encounter was required to have an admission creatinine measured within the 24 h preceding admission through day 1 of ICU admission. Subsequent creatinine values utilized in the modeling had to occur in pairs separated by 24 ± 6 h. The first creatinine value of a pair defined hour 0–1 of that modeling period, and could occur at any point in days 1–5 of ICU admission. A second creatinine had to be measured within 24 ± 6 h of the first in order to be used for model training or validation. The 48 h preceding the first creatinine of the pair were then divided into 4 12-hour time periods. The number of modeling periods for any given encounter was therefore dependent on the number of creatinine pairs that fit the above criteria.
Appendix Figure 1: Model structure
For each 12-hour period preceding the first creatinine of the pair, the following metrics were applied to all variables prior to inclusion in the model:
(1) For all vital signs (heart rate, respiratory rate, blood pressure, temperature, oxygen saturation, and GCS), the minimum value, maximum value, average, and count (number of records) were included.
(2) For all other clinical measurements (weight, respiratory support variables), the minimum value, maximum value, and count were included.
(3) For intake and output measurements (UOP) which had been standardized to units of ml/kg/hr over 12 h, a single value was included.
(4) For laboratory values, the minimum value, maximum value, and count were included.
(5) Each medication was included as a binary variable (received/did not receive).
For all variables, the maximum value and minimum value at any point in admission prior to the first creatinine of the pair were also included.
Treatment of highly correlated variables
For all variable pairs with Pearson correlation value ≥0.9 or ≤−0.9, the following rules were applied to select one variable of the pair for inclusion in the model:
(1) If the same variable was correlated across two time periods (regardless of parameter), the variable from the earliest time period was kept.
(2) If the same variable was correlated within the same time period, the maximum value was kept.
(3) If the count parameter of different variables were correlated in the same time period, the following hierarchy was applied: measurements > events > labs > medications
a. If both variables were labs, drug levels were kept over other labs
b. If both variables were labs but one was a directly measured value and the other was a calculated value, the directly measured lab was kept
(4) If the minimum or maximum parameter of different variables were correlated within the same time period, the following hierarchy was applied: labs > measurements > events > medications
a. If both variables were labs, drug levels were kept over other labs
b. If both variables were labs but one was a directly measured value and the other was a calculated value, the directly measured lab was kept
Keywords: acute kidney injury, creatinine, pediatric intensive care unit, machine learning, neural network model
Citation: Dixon CG, Trujillo Rivera EA, Patel AK and Pollack MM (2025) Development of a neural network model for early detection of creatinine change in critically Ill children. Front. Pediatr. 13:1549836. doi: 10.3389/fped.2025.1549836
Received: 22 December 2024; Accepted: 14 March 2025;
Published: 4 April 2025.
Edited by:
Adnan Bhutta, Riley Hospital for Children, United StatesReviewed by:
Grace M. Arteaga, Mayo Clinic, United StatesColin Rogerson, Indiana University Bloomington, United States
Copyright: © 2025 Dixon, Trujillo Rivera, Patel and Pollack. This is an open-access article distributed under the terms of the Creative Commons Attribution License (CC BY). The use, distribution or reproduction in other forums is permitted, provided the original author(s) and the copyright owner(s) are credited and that the original publication in this journal is cited, in accordance with accepted academic practice. No use, distribution or reproduction is permitted which does not comply with these terms.
*Correspondence: Celeste G. Dixon, ZGl4b25jNUBjaG9wLmVkdQ==