 Mingxuan Jia1
 Yong Wang
- 1Middlebury College, Middlebury, VT, United States
- 2Stanford University, Stanford, CA, United States
- 3Shanghai Literature Institute of Traditional Chinese Medicine, Shanghai, China
- 4Yangpu Hospital of Traditional Chinese Medicine, Shanghai, China
- 5ChengZheng Wisdom (Shanghai) Health Sciences and Technology Co., Ltd., Shanghai, China
Introduction: Pneumonia is globally recognized as a significant disease burden, particularly among pediatric patients in intensive care units (ICU), where its etiology is complex and prognosis often poor.
Methods: Data were extracted from a pediatric-specific intensive care (PIC) database, selecting 795 pediatric pneumonia patients in ICUs (2010–2018). After applying rigorous inclusion/exclusion criteria, 543 cases formed the study cohort. We analyzed patient baseline information and 70 laboratory indicators to identify 25 prognosis-associated biomarkers. For prognostic model construction, we used stepwise regression to filter 28 variables, then Spearman and Pearson correlation analyses to identify an intersection of 14 key indicators from the top 20 features. Twelve machine learning algorithms underwent parameter tuning and combination, forming 113 model combinations for survival outcome prediction.
Results: The “Stepglm [both] + GBM” combination achieved the highest average accuracy (79.4%) in both training and testing sets. Twelve prognostic variables were identified: WBC Count, Glucose, Neutrophils Count, Cystatin C, Temperature (body), Sodium (Whole Blood), Cholesterol (Total), Absolute Lymphocyte Count, Urea, Lactate, and Bilirubin (Total).
Discussion: These 12 variables provide a dependable basis and novel insights for prognostic evaluation, supporting clinical diagnosis, treatment, and early intervention.
1 Introduction
Pneumonia is a severe lung infection caused by bacteria, viruses, or other microorganisms that predominantly affect the alveoli. Among these, bacterial and viral pneumonia are the most common forms (1). Besides infectious agents, it may also be triggered by various physical and chemical factors, immune damage, allergies, and medications. The mortality rate for pneumonia patients ranges from 15.5% to 38.2% (2). A systematic analysis of data from the Global Disease Burden Database between 1990 and 2021 indicates that an estimated 344 million cases of lower respiratory infections (LRIs), primarily due to pneumonia or bronchitis, were recorded. This number has a 95% uncertainty range of 325–364 million cases. Notably, 502,000 of these fatalities (with a range of 406,000–611,000) were children under five years old, and 254,000 deaths (ranging from 197,000 to 320,000) occurred in countries with a low Socio-Demographic Index (3). Due to the complex etiological factors and diagnostic processes of pediatric pneumonia, relying solely on a single indicator cannot accurately predict outcomes, necessitating the introduction of new approaches and methods to address existing challenges.
There is substantial evidence suggesting that artificial intelligence (AI) has shown clinical utility across various realms of medical practice (4). In laboratory diagnostics, AI has been effectively utilized in tasks such as malaria diagnosis and antimicrobial resistance profiling (5, 6). Similarly, in clinical imaging analysis, AI has aided in diagnosing pulmonary tuberculosis (7, 8). Furthermore, clinical decision support tools incorporating AI have demonstrated their value in predicting sepsis, assisting with antimicrobial prescribing, and other related tasks (9, 10). Additionally, AI has played a crucial role in managing public health outbreaks, particularly in the context of the COVID-19 pandemic (11). With the burgeoning volume and complexity of biomedical data, machine learning (ML) techniques have emerged as sophisticated and popular instruments for developing predictive models of fundamental biomedical processes (12). In the realm of disease prediction using clinical data, supervised ML algorithms, such as support vector machines, naïve Bayes, and random forests, predominate (13). In biomedical applications, feedforward neural networks, convolutional neural networks, and recurrent neural networks are primarily employed (12). In clinical big data research, suitable ML algorithms can specifically address a multitude of issues from diagnosis and prognosis to treatment recommendations (14). ML holds the potential to become a reliable tool for clinical decision support. While its widespread adoption in clinical practice is apparent, efforts to validate clinically adapted ML algorithms are ongoing. By enhancing quality standards, transparency, and interpretability of ML models, acceptance thresholds can be further lowered.
In this study, addressing the challenges of prognostic assessment for pediatric pneumonia in intensive care units, we extracted, cleansed, and analyzed data from a pediatric-specific intensive care database. Among 113 machine learning algorithm combinations evaluated, the “Stepglm [both] + GBM” combination achieved the highest average accuracy of 79.4% in both training and testing sets. Overall, by integrating statistical methods with machine learning algorithms, we successfully identified twelve key indicator variables that are closely linked to the prognosis of pediatric pneumonia patients in intensive care, and established a predictive model with high accuracy. This research not only offers new insights for clinical diagnosis and treatment but also provides a reliable foundation for early warning, intervention, and improving patient survival rates.
2 Data and methods
2.1 Data sources and preprocessing
The Paediatric Intensive Care (PIC) database (http://pic.nbscn.org) is an extensive, bilingual, single-centre repository dedicated to paediatric cases, containing data on children admitted to critical care units at a major children's hospital in China (15). This de-identified database encompasses a range of information, including vital sign measurements, medication details, laboratory results, fluid balance records, diagnostic codes, hospital stay durations, survival statistics, and additional data (16). The PIC database comprises 13,499 unique hospital admissions involving 12,881 distinct paediatric patients (ages 0–18 years) who were admitted to the critical care unit between 2010 and 2018 (16). After undergoing the Collaborative Institutional Training Initiative (CITI) training and receiving the completion report from the collaborating institution, we submitted a request to the administrators and obtained authorization to use this database.
2.2 Inclusion and exclusion criteria
Under the purview of this study, we identified 795 individuals diagnosed with pneumonia using the ICD-10 code “J69.101”. The exclusion criteria were delineated as follows: initially, for patients with multiple admissions, only data from the first hospitalization were retained. Subsequently, entries lacking a unique identifier (SUBJECT_ID), an indicator of mortality (HOSPITAL_EXPIRE_FLAG), and “LABEVENTS” data were excluded from the data set. To ensure data integrity, we also eliminated incomplete “LABEVENTS” test records and those with missing values exceeding 20 percent. Missing values were filled in and predicted using the method of interpolation of mean, median and regression.
2.3 Baseline statistics
For laboratory test results, the database explicitly distinguishes between ranges of indicators (low, Z-core, high), and imputation for such missing values needs to be stratified according to these ranges. First, normality tests were conducted for each variable; continuous variables that follow a normal distribution are described using the mean ± standard deviation (17). For continuous data that do not follow a normal distribution, the median and interquartile range represent central and dispersion tendencies (18). Qualitative categorical data were described by the frequency and probability of each category (19). Differences between groups for normally distributed continuous variables were analyzed using independent sample t-tests to compare means (20). When the overall distribution of two sample groups differs, the rank-sum test is used to compare medians across multiple independent samples (21). Chi-square tests were used to analyze group differences in categorical data (22). All statistical analyses and inter-group difference tests were performed using R language scripts, with necessary R packages including “Hmisc”, “car”, “mice”, “openxlsx”, “dplyr”, “tidyverse”, “stats”, and “reshape2”.
2.4 Regression analyses
Linear regression is a widely used technique in clinical medical statistics for addressing various research questions and objectives (23). Multiple linear regression is more aligned with clinical practice, modeling the relationship between multiple independent predictors and a single outcome variable, with results dependent on the diagnostic and therapeutic research of multiple factors (24, 25). The intrinsic logic of logistic regression is to convert binary results into continuous results, i.e., the log odds or logit of the event (26). For the aforementioned analyses, R language's base package, which includes basic statistical functions, as well as packages like “caret” and “e1071”, provide advanced model training and evaluation capabilities.
2.5 Variable screening
In this study's stepwise regression method, the “readr” function was first used to read the data and check for missing rows. To enhance algorithm efficiency, both forward and backward stepwise regression were used iteratively. Finally, the Akaike Information Criterion (AIC), a standard for assessing the goodness of fit of statistical models, was compared; the model with the lowest AIC value was considered the optimal one.
After the initial screening, the correlation of variables with patient survival outcomes was analyzed. The Pearson correlation coefficient is suitable for linear relationships between two variables that are both continuous and normally distributed (27). The Spearman correlation coefficient uses ranks for analysis, making it applicable to a wider range of distributions compared to Pearson's coefficient (28). Due to the complexity of clinical data, we combined the results from both methods to obtain the variables for modeling.
To observe the impact of selected features on decision outcomes and their interactions, the RF algorithm was used to assess feature importance, indicating each feature's contribution to the random forest. Higher importance reflects greater influence on the forest composition and decision outcomes (29). Gray relational analysis, a multi-factor statistical method, was used to measure the degree of association between factors based on their development trends, referred to as “gray relational degree” (30). Visualization of the analysis results was accomplished using the “ggplot2” package.
2.6 Machine learning model construction
We selected the following twelve common ML algorithms to form a total of 113 combinations: Lasso, Stepglm, Generalized glmBoost, SVM, Ridge, Enet, Partial Least Squares Regression with Generalized Linear Model (plsRglm), RF, GBM, Linear Discriminant Analysis (LDA), XGBoost, and Naive Bayes. Most of these algorithms have been widely used in clinical predictive models, but there are three methods with relatively limited applications. PLS-R-GLM can handle both complete and incomplete datasets and is an extension of partial least squares regression for general linear models (31). LDA, a classic supervised learning algorithm, is mainly used for dimensionality reduction and classification tasks. It generalizes Fisher's linear discriminant method, aiming to identify a linear combination of features that separates two classes (32). Naive Bayes, a very simple classification method for features assumed to be independent, calculates the probability of each class given the instance to be classified and assigns it to the class with the highest probability (33).
The final modeling dataset was split into training and test sets in a 7:3 ratio, utilizing 17 R packages for data import, predictive model construction, evaluation, and result visualization, namely “openxlsx”, “seqinr”, “plyr”, “randomForestSRC”, “glmnet”, “plsRglm”, “gbm”, “caret”, “mboost”, “e1071”, “BART”, “MASS”, “snowfall”, “xgboost”, “ComplexHeatmap”, “RColorBrewer”, and “pROC”. During the actual computation process, several details need careful attention. For instance, pre-training aggregates the variable selection process for each method to reduce computation load. Setting a seed in modeling ensures reproducibility of results. After calculating the Area Under the Curve (AUC) for the training and test sets, we will compute the mean AUC for each algorithm across all cohorts and rank the algorithms by their mean AUC in descending order to determine the best-performing model.
3 Results
3.1 Baseline statistics results
The study process is illustrated in Figure 1, with a total sample size of 543, comprising 38 cases in the experimental group (deceased) and 505 cases in the control group (surviving). According to baseline statistics (Table 1), exhibited a wide age range and extended mean survival days, with no significant difference between the groups (P = 0.259), revealing the diversity in pneumonia progression. In both the experimental and control groups, the gender distribution of patients was similar, showing no significant difference (P = 0.836), thereby excluding gender as a factor in disease progression. Though ICU length of stay, temperature (body), heart rate, and respiratory rate fluctuated between the groups, there were no significant differences. However, the white blood cell (WBC) count showed a significant difference between the experimental and control groups (P = 0.021), potentially indicating an influential marker for disease progression and mortality in patients. Significant differences were also found in biochemical markers such as Standard Base Excess, Bicarbonate, and Alanine Aminotransferase (ALT) (P-values are 0.156, 0.087, and 0.002, respectively), possibly reflecting special changes in liver or acid-base balance function in some patients and associating with disease severity. Cholesterol and partial pressure of carbon dioxide (pCO2) levels, which reflect specific metabolic and physiological processes, also showed significant differences (P = 0.014 and 0.044). Compared to the control group, experimental group patients had higher levels of urea and Uric Acid (Urine) (P-values are 0.008 and 0.007), suggesting potential kidney damage or uric acid excretion issues due to pneumonia. A higher proportion of low glucose levels was observed in the experimental group (P = 0.001), necessitating clinical attention to hypoglycemia. Elevated lactate levels in the experimental group (P = 0.045) may indicate tissue hypoxia or abnormal glucose metabolism. Lactate Dehydrogenase was significantly higher in both groups, especially in the experimental group (P = 0.03), suggesting potential myocardial injury. Actual Base Excess reflects the body's acid-base balance. Hemoglobin (Hb) was significantly higher in the control group (P = 0.033), indicating better oxygen transport capacity in surviving patients. Notably, higher proportions of elevated Aspartate Aminotransferase, Bilirubin (Direct and Total) in the experimental group suggest potential liver dysfunction linked to poor prognosis. Significant differences in Lipase levels between the experimental and control groups (P < 0.001) may relate to pancreatic function.
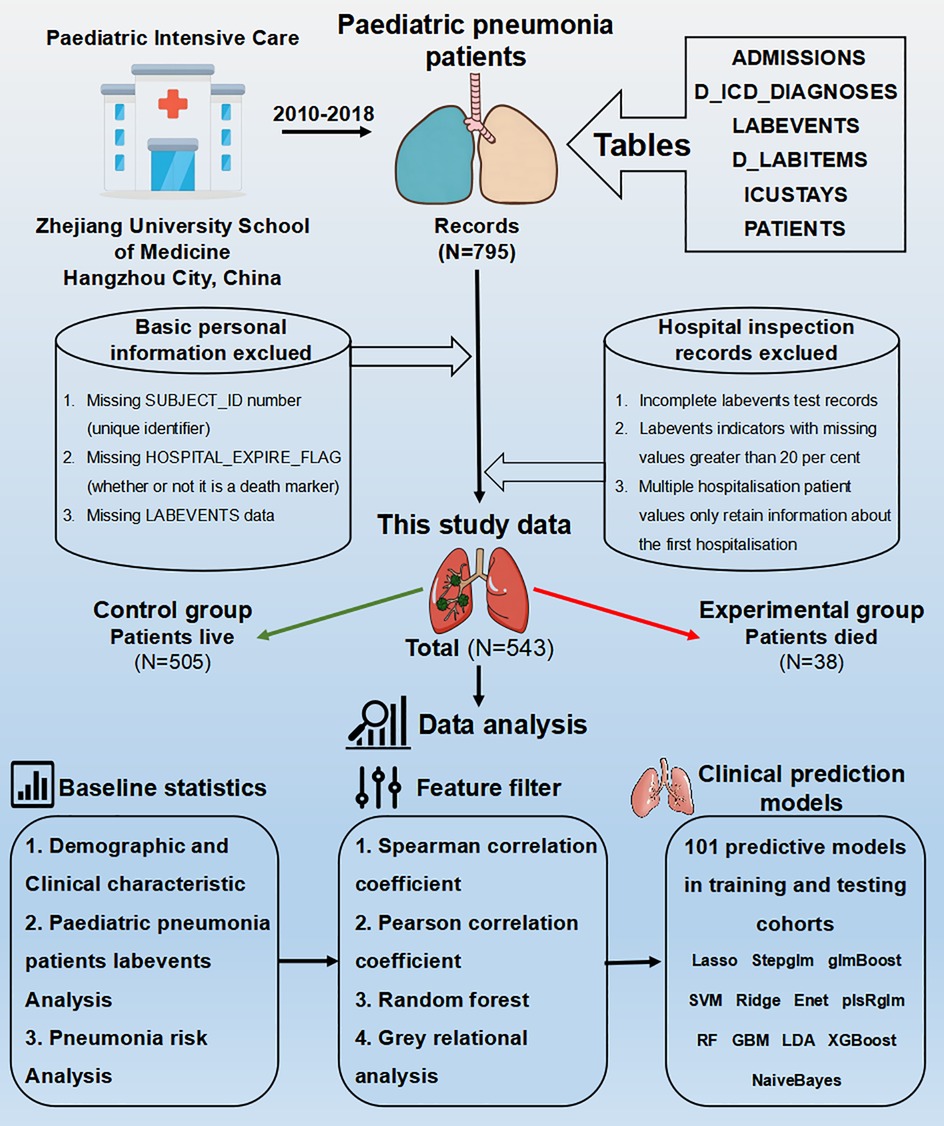
Figure 1. Flow diagram of this study.
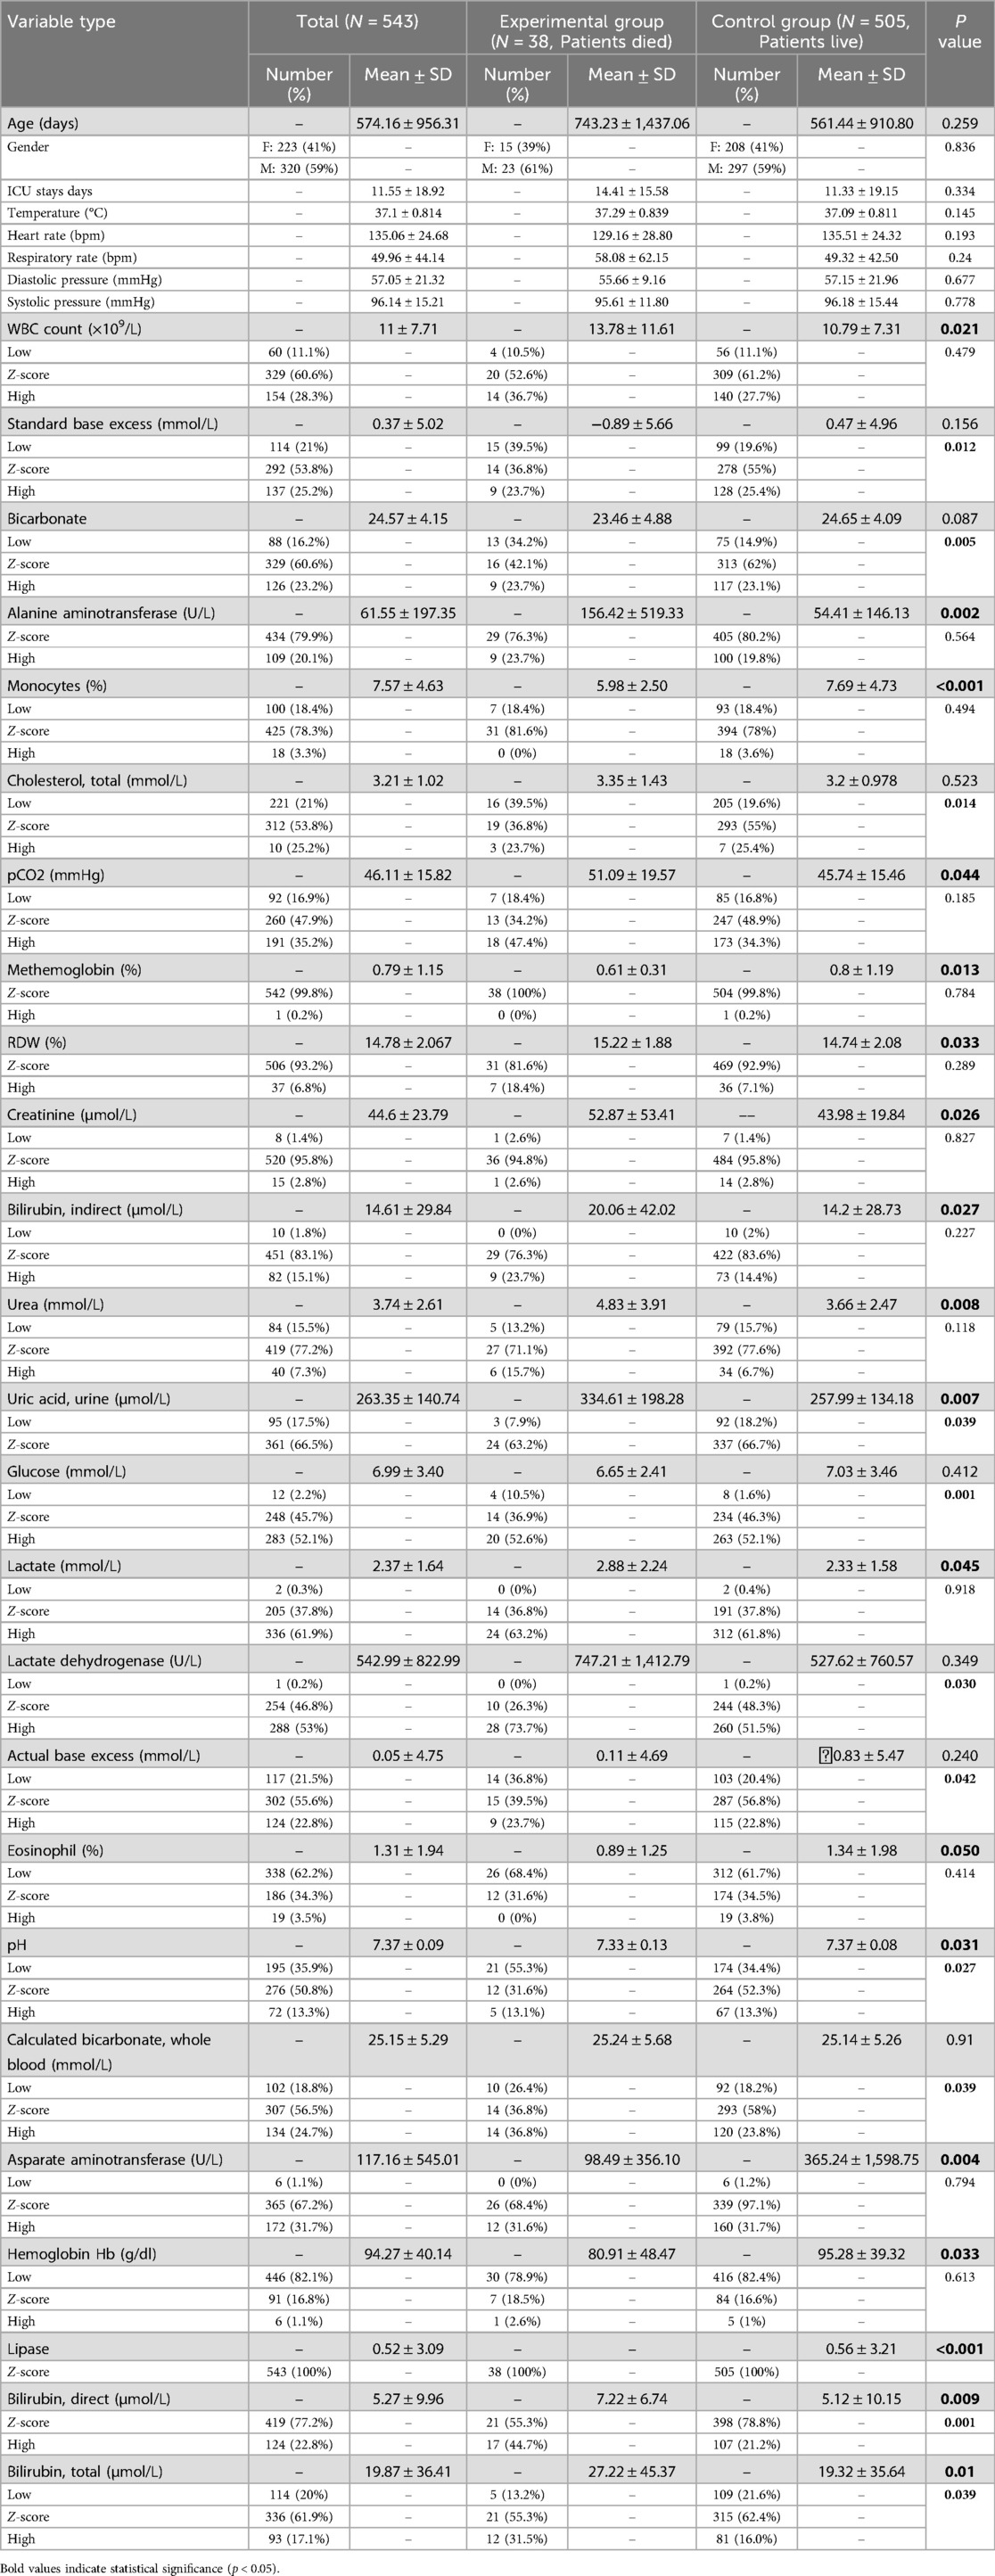
Table 1. Demographic and clinical characteristic of paediatric pneumonia patients.
3.2 Linear regression model
The linear regression analysis investigated the impact of various biomarkers and clinical parameters on the survival of pediatric pneumonia patients in the pediatric intensive care unit (PPICU). The results, as shown in Table 2, reveal that the regression coefficient for WBC count is 0.003, with a t-value of 2.317 and a P-value of 0.021, indicating a significant association between high white blood cell counts and the survival chances of patients, underscoring its importance in clinical monitoring. Similarly, the regression coefficient for ALT is 0.000, with a t-value of 3.097 and a P-value of 0.002, suggesting that elevated ALT levels may reflect liver damage or disease severity, highlighting the necessity for physicians to monitor liver function. The monocyte percentage regression coefficient is −0.005, with a t-value of −2.204 and a P-value of 0.028, demonstrating its association with reduced survival rates, further supporting the role of inflammatory response in patient outcomes. The mean pCO2 regression coefficient is 0.001, with a t-value of 2.019 and a P-value of 0.044, indicating that higher pCO2 levels might reflect respiratory insufficiency, warranting close attention. The regression coefficients for creatinine and urea are 0.001 (P = 0.026) and 0.011 (P = 0.008), respectively, pointing to a correlation between renal function parameters and survival status, emphasizing the necessity of monitoring renal function in patients. Additionally, the lactate regression coefficient is 0.13 (P = 0.045), indicating elevated levels often signify tissue hypoxia or severe infection, necessitating attention to the metabolic status of patients. Intriguingly, the pH value regression coefficient is −0.402 (P = 0.001), showing a significant impact on the survival prognosis of patients, suggesting that acid-base imbalance could lead to severe consequences.
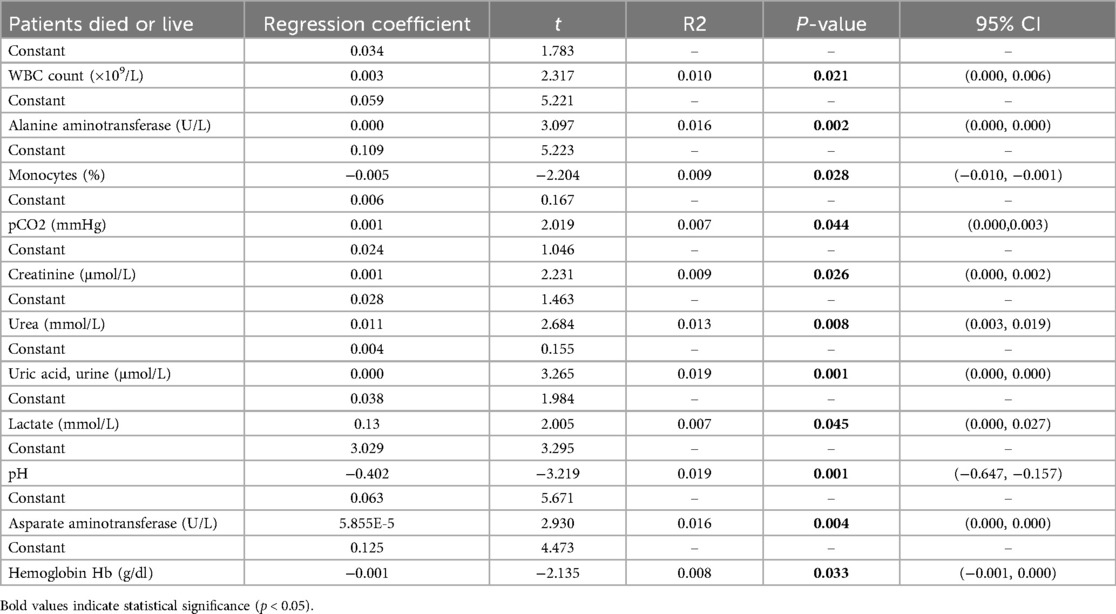
Table 2. General linear regression analysis results.
3.3 Logistic regression model
Regarding the binary logistic regression analysis of the first categorical variable as the reference class, the results (Table 3) indicate that actual base excess and standard base excess have significant predictive effects on whether patients survive or succumb. Specifically, the low and high levels of these variables both exhibit statistical differences with P-values less than 0.05. This further highlights the importance of these testing indicators at certain excessive levels, increasing the mortality risk of patients, making them crucial variables for focus and intervention in patient clinical treatment. Furthermore, elevated levels of cholesterol, total and uric acid, urine also significantly affect the prediction of patient outcomes (P-values of 0.021 and 0.026, respectively). High cholesterol and uric acid levels might indicate a higher disease severity in patients, potentially correlating with the patient's prognosis. Additionally, lactate dehydrogenase shows significant relevance in predicting patient outcomes. This could be because changes in lactate dehydrogenase levels reflect the progression of the disease or organ function status in patients. Given its high statistical significance, this variable might warrant further study. Finally, elevated levels of direct bilirubin and total bilirubin are found to have a significant correlation with patient outcomes. This suggests that bilirubin levels could be crucial indicators in assessing pediatric pneumonia patients' critical care process. Higher bilirubin levels might indicate liver function impairment or the presence of other complications.
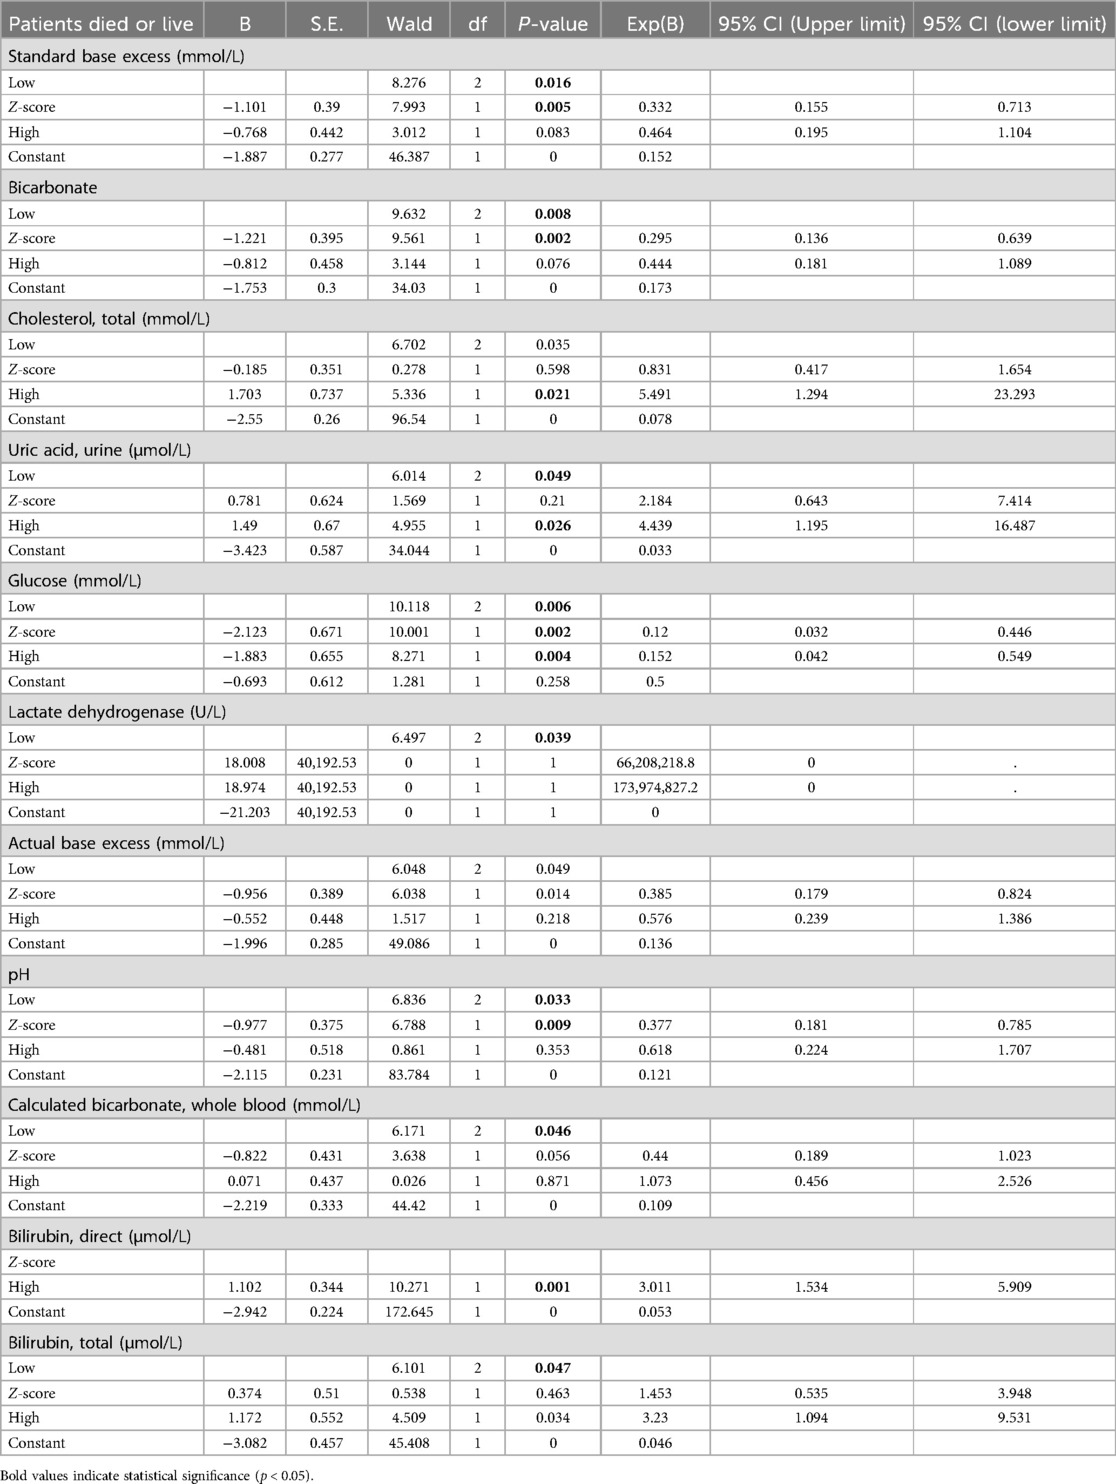
Table 3. Logistic regression results (reference category to first).
Using the last categorical variable as a reference category, the results of the logistic regression analysis (Table 4) indicated that certain levels of specific biomarkers, such as elevated Cholesterol, Total, elevated Glucose, and elevated Bilirubin, Direct, were significantly associated with adverse clinical outcomes in patients (P-value less than 0.05). Particularly, high levels of Total Cholesterol and Glucose demonstrated substantial statistical significance in the associated regression model. Specifically, elevated levels of these biomarkers play a significant role in predicting adverse clinical outcomes in patients. These findings suggest that in clinical practice, pediatric pneumonia patients with these elevated biomarkers require closer monitoring and potentially more aggressive therapeutic interventions.
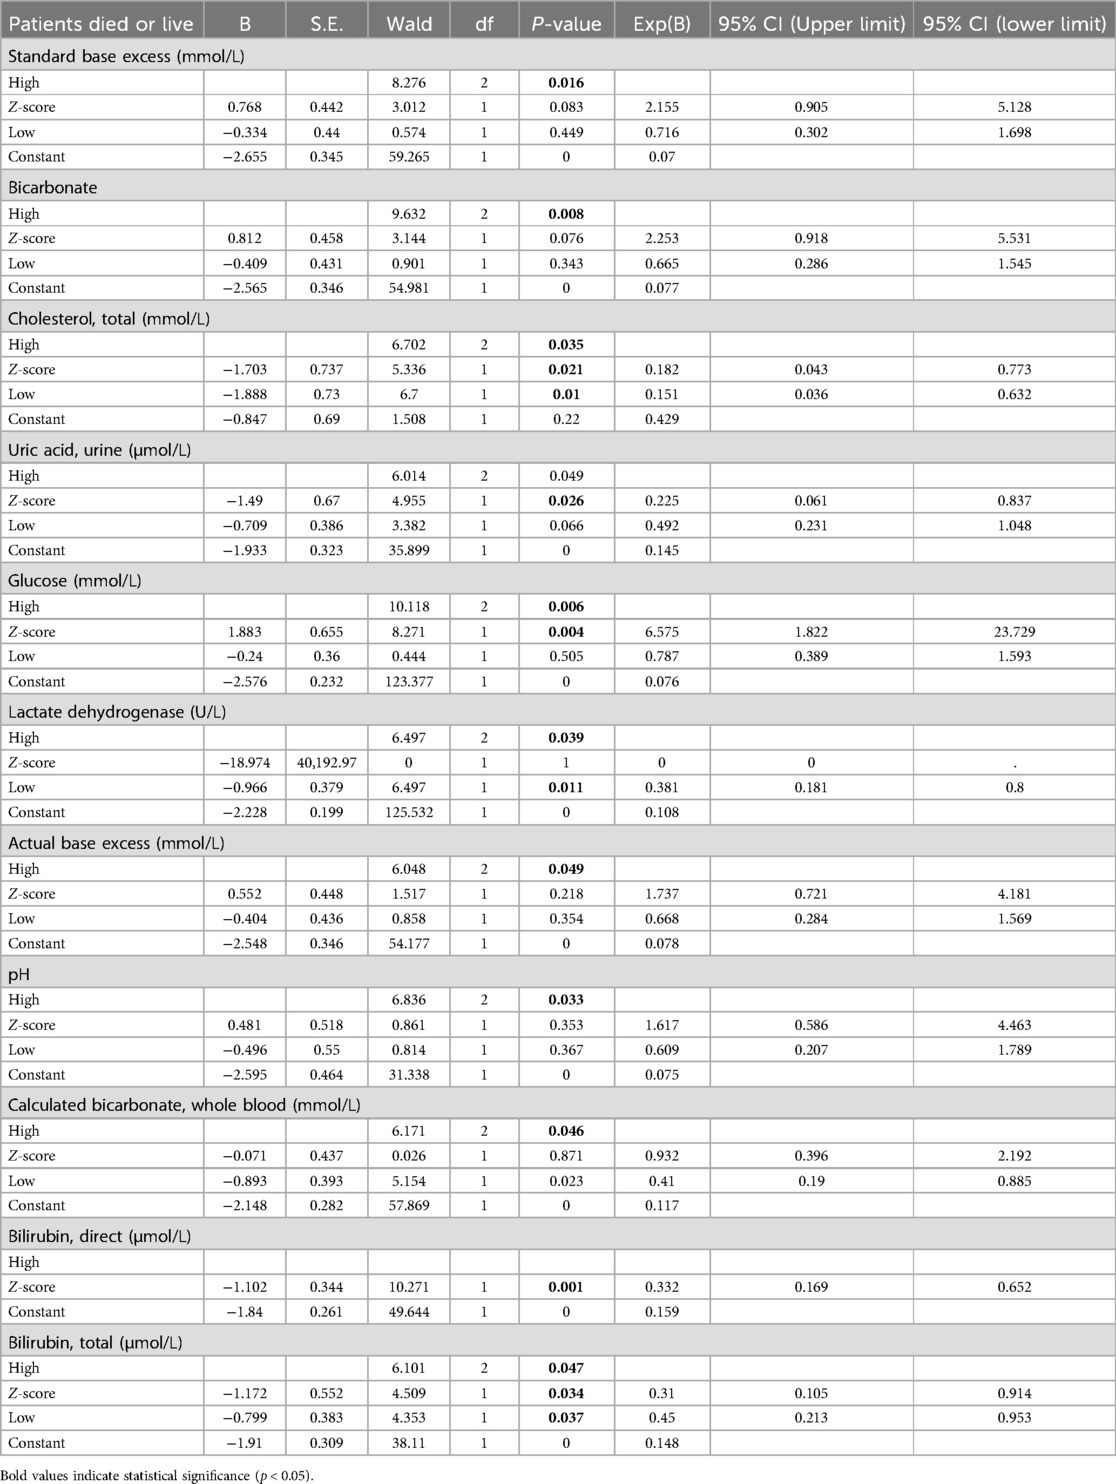
Table 4. Logistic regression results (reference category to last).
3.4 Prognostic variable screening
Following linear and logistic regressions on the data set, we envisioned employing ML algorithms to construct a clinical prediction model. Initially, for the mortality or survival outcomes of pediatric pneumonia patients in the PPICU, we performed stepwise regression to select a series of clinical variables. From 78 initial variables, 28 were selected for subsequent studies, with the AIC value at 228.84 and deviance at 170.84 (Table 5). In the Spearman correlation analysis's top 20 (Figure 2A), Bilirubin, Total, Urea, and Neutrophils were the three most positively correlated factors, while Albumin, Amylase, and Sodium, Whole Blood. The pH showed the strongest negative correlations in the Pearson correlation analysis (Figure 2B). Taking the intersection of the top 20 variables from both analyses (Figure 3A), we obtained 14 variables [Bilirubin, Urea, Neutrophils, Temperature (body), Neutrophils Count, WBC Count, Cystatin C, Lactate, Chloride, Cholesterol, Absolute Lymphocyte Count, Glucose, Sodium, and Albumin] to construct the ML algorithm model.
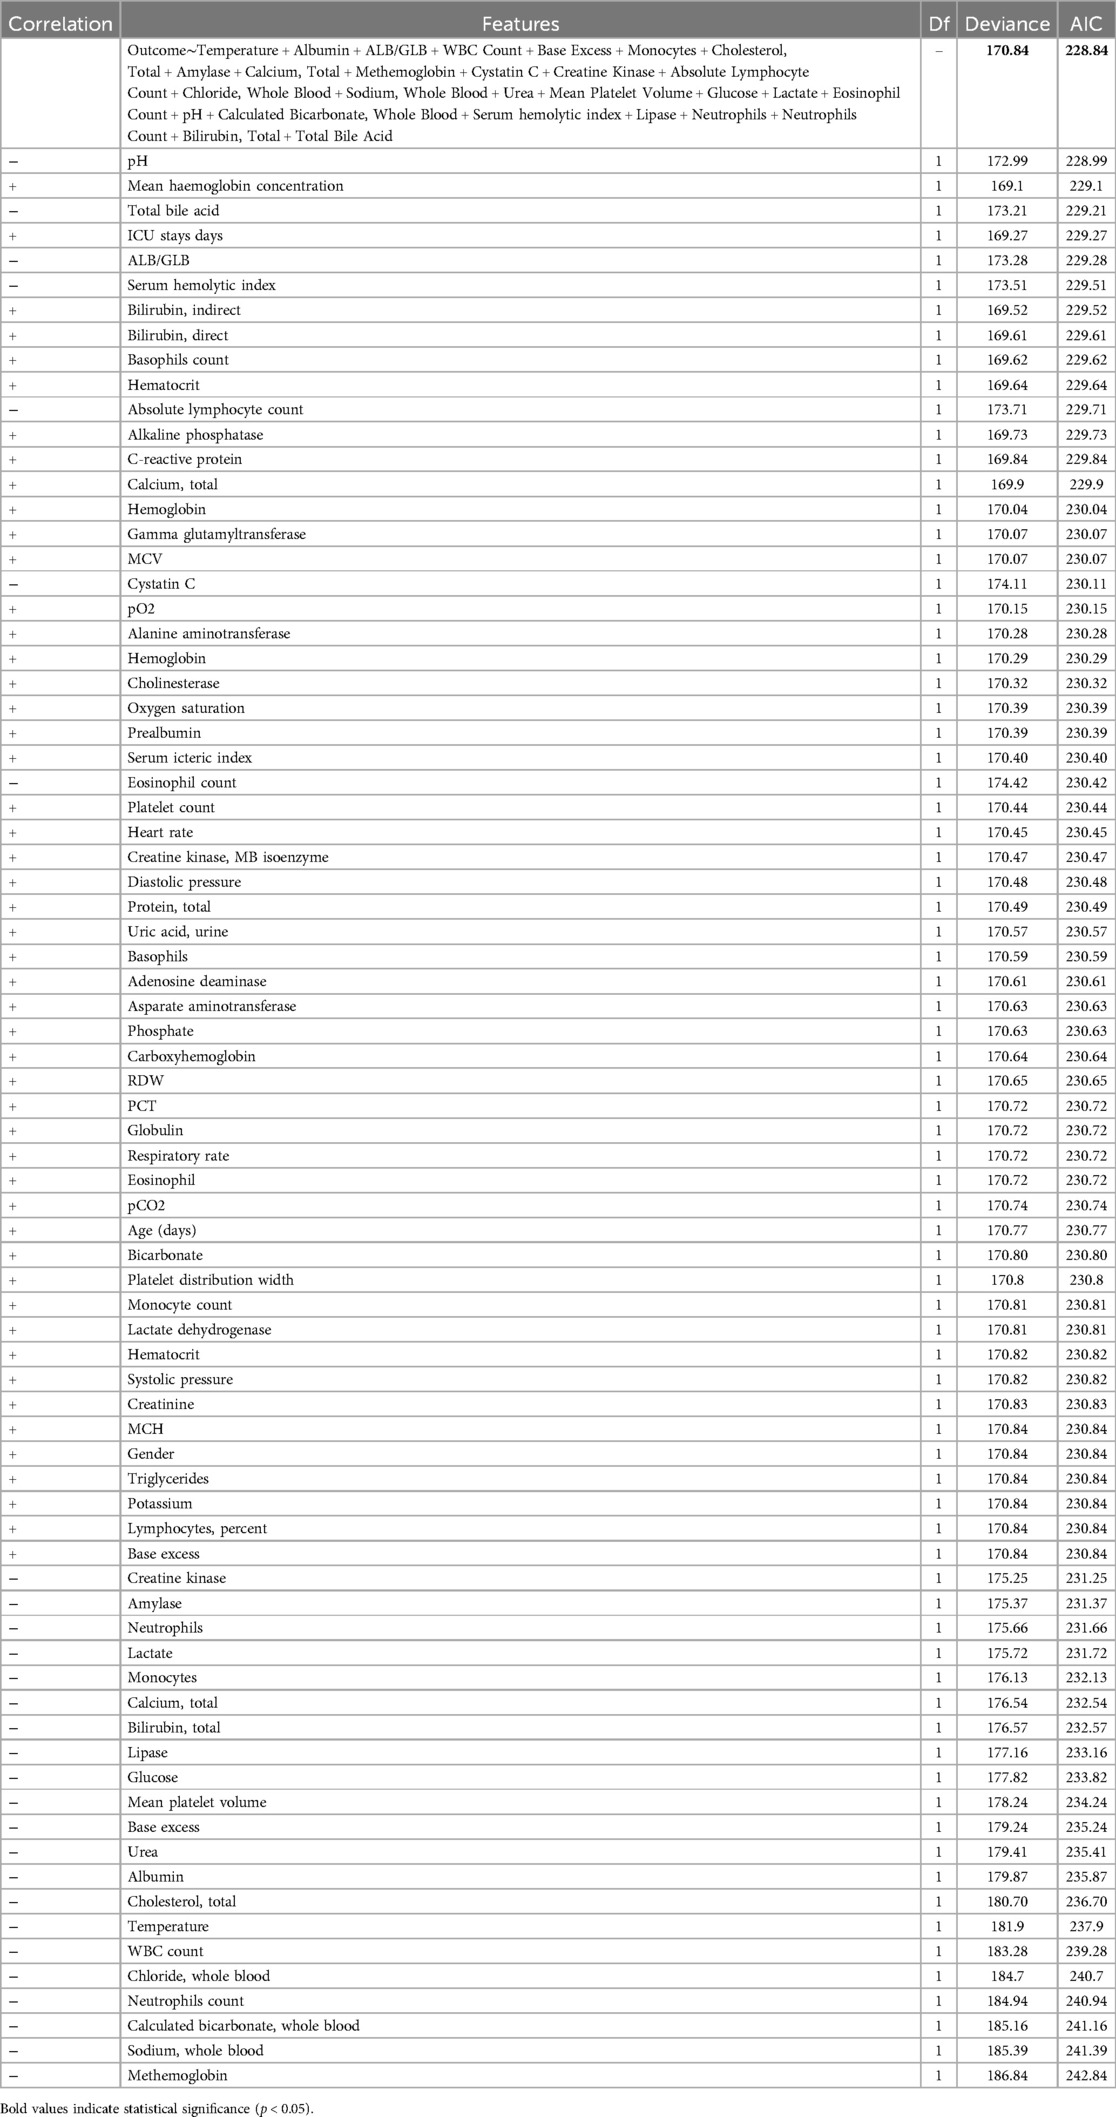
Table 5. Screening variable results by stepwise regression.
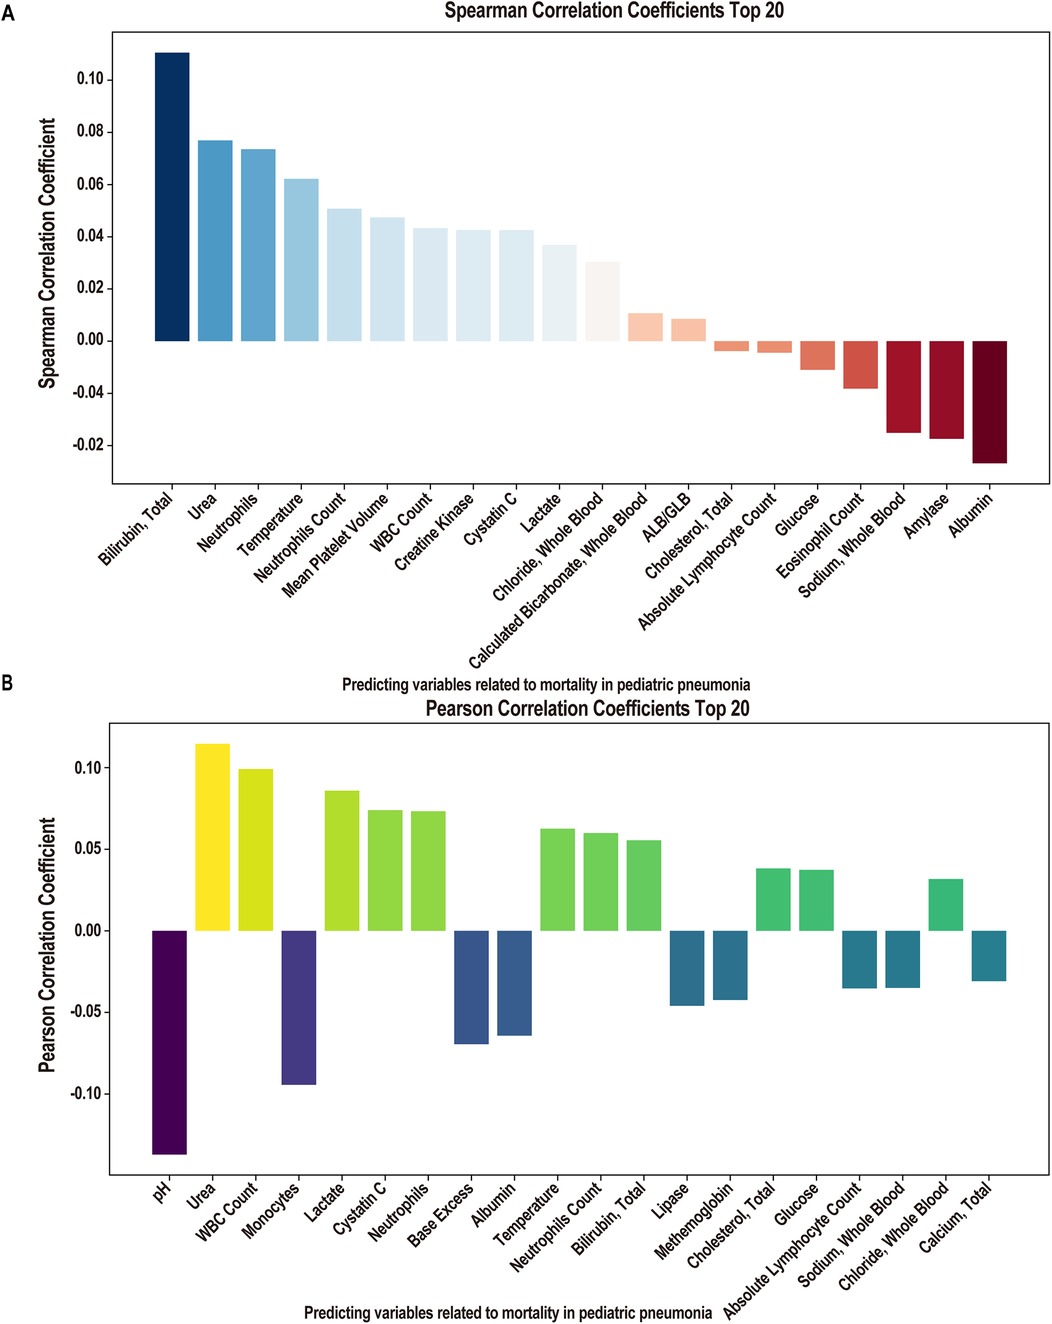
Figure 2. Correlation analysis of clinical factors. (A) Spearman correlation coefficient of importance clinical factors (Top 20 features). (B) Pearson correlation coefficient of importance clinical factors (Top 20 features).

Figure 3. Screening of elements for modelling. (A) The Venn plot of spearman and Pearson correlation coefficient Top 20 lements of choice (14 features). (B) Fourteen features importance in fandom forest. (C) Grey relational analysis of importance clinical factors (14 features).
Using the RF algorithm to analyze the contribution ratios of 14 variables to the survival outcomes of patients (Figure 3B), Cholesterol, Total, Lactate, and Glucose were the three with the highest contributions. Specifically, Cholesterol levels may be closely related to the patient's nutritional status and inflammatory response. High cholesterol levels may indicate metabolic disorders, affecting the overall health assessment of patients. Lactate is an indicator of metabolic acidosis, commonly seen in hypoxia or circulatory failure, and elevated lactate levels are typically associated with poorer survival outcomes. Lastly, abnormal Glucose levels (especially hyperglycemia) are often associated with stress and infection and may reflect the patient's energy metabolism status. From the grey correlation degree analysis results, these 14 variables all exhibited strong correlations, with association coefficients ranging from 0.7 to 0.9 (Figure 3C).
3.5 113 machine learning algorithms to construct prognostic models
Twelve machine learning algorithms formed 113 combinations, with the data randomly split into a 7:3 ratio between the training (27 in the experiment group, 353 in the control group) and testing groups (11 in the experiment group, 151 in the control group). Figure 4 showcases the AUC values for 48 machine learning algorithms across the training, testing, and average groups. We observed significant differences in predictive performance among various models, not only demonstrating the tremendous potential of machine learning in clinical applications but also highlighting its limitations under certain circumstances. The “Stepglm[both] + GBM” model achieved an average AUC of 0.890 in the training set, indicating high accuracy in identifying mortality outcomes. This result suggests that the model can effectively integrate and analyze multiple clinical features, thus providing strong support for clinical practice. However, the model's AUC dropped to 0.794 during validation with the testing set. This phenomenon suggests that despite the model's excellent training performance, it harbors a risk of over-fitting when confronted with unknown data. This finding emphasizes the crucial importance of optimizing a model's generalization ability in machine learning applications to ensure its stability in real clinical settings. In comparison, the “Lasso + GBM” and “glmBoost + GBM” models also performed admirably, with AUCs of 0.896 and 0.779, and 0.900 and 0.767 in the training and testing sets, respectively. These results indicate that the models can achieve considerable efficiency in information extraction, especially when integrating significant biomarkers, to recognize and predict key clinical indicators. This allows clinicians to quantitatively assess patient risk and adjust corresponding treatment strategies based on these indicators. Particularly in the management of patients, timely warning and intervention can have a profound impact on survival rates. Additionally, in evaluating model performance, we found that some models, such as “RF + LDA” and “Ridge”, demonstrated relatively mediocre overall performance, with training set AUCs between 0.689 and 0.705, and testing set performances failing to exceed 0.704. This result suggests the need to pay attention to the gap between the training and testing sets, as well as the stability and applicability of the model during the selection process. The instability of a model may stem from various factors, including inadequacies in feature selection and sample size limitations.
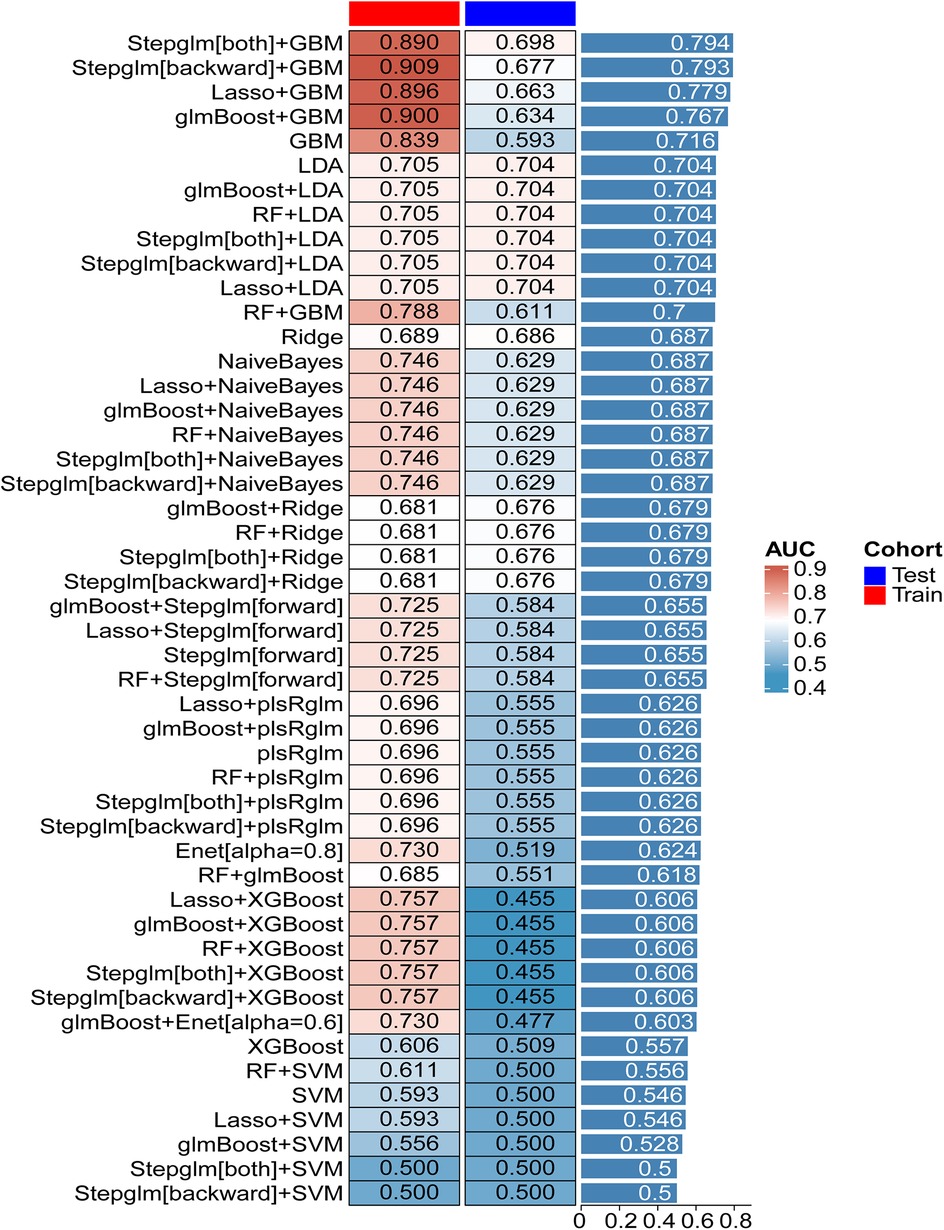
Figure 4. The performance of 101 predictive models in training and testing cohorts.
We extracted the final selected variables for each machine learning model (Table 6). From the feature variable analysis, the indicators we adopted, such as white blood cell count, blood glucose, Temperature (body), lactate, and cholesterol, are critical physiological parameters directly related to the severity of the patient's condition. An elevated white blood cell count typically indicates severe infection, while high lactate levels suggest potential tissue hypoxia or shock. Changes in these physiological indicators can provide clinicians with important clues about the patient's physiological state. Furthermore, fluctuations in glucose and cholesterol levels may also reflect the patient's metabolic status, thereby having a significant impact on clinical management. Therefore, the construction of the model relies not only on the merits of the algorithms but also on a deep understanding and effective utilization of clinical data.
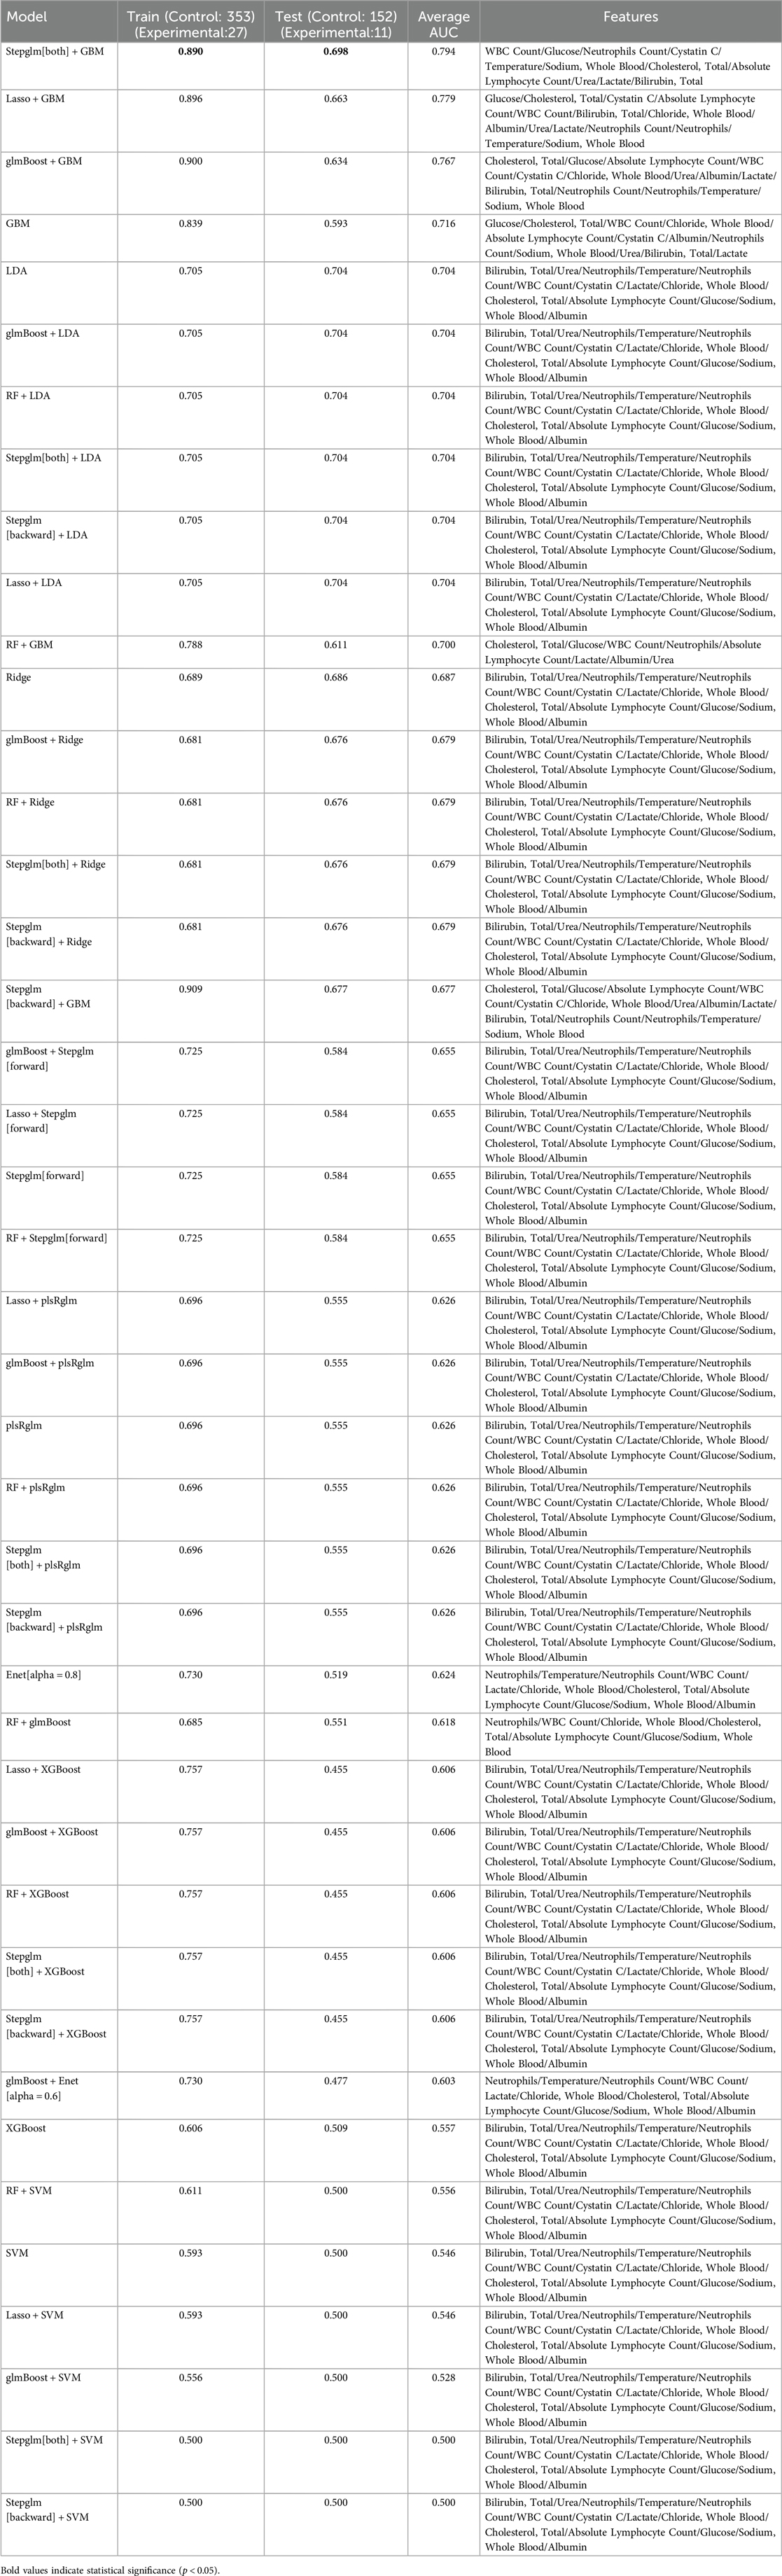
Table 6. The performance of 113 predictive models in training and testing cohorts.
4 Discussion
The objective of developing clinical predictive models is to facilitate risk stratification of outcomes for patients, thereby assisting clinicians and healthcare professionals in obtaining a comprehensive understanding of the patients' conditions. This, in turn, aids in making informed clinical decisions that can enhance the prognosis and quality of care for patients (34). In this study, we found that the combination of stepglm [both] and GBM produced the highest mean AUC curve, reflecting its superior performance in clinical prediction models. The stepglm [both] approach, which integrates both forward and backward selection processes, systematically identifies significant predictors while mitigating the effects of multicollinearity. This attribute is crucial in clinical contexts, where datasets often contain highly correlated variables. By narrowing down the predictor set to those with the most explanatory power, stepglm [both] creates a more parsimonious model, reducing noise and improving interpretability.
In contrast, algorithms such as Lasso and Ridge, while effective in regularization, may not fully leverage interactions among predictors due to their linear nature. This limitation can hinder their performance in capturing the complex relationships inherent in clinical data. GBM excels in modeling these complexities through its ensemble learning framework, which constructs multiple decision trees sequentially. Each tree learns from the errors of its predecessor, allowing the model to capture intricate patterns and interactions that linear models might overlook. Other methods, such as Naive Bayes and LDA, often rely on strong independence assumptions among predictors or require specific distributional assumptions that can be unrealistic in clinical settings. Consequently, these algorithms may struggle to generalize well, particularly with diverse patient populations or multifaceted clinical scenarios. Furthermore, while tree-based methods like Random Forest also provide flexibility and robustness, they can sometimes suffer from over-fitting, especially in high-dimensional spaces. GBM, with its advanced techniques for controlling over-fitting, demonstrates superior adaptability and accuracy in this regard. In conclusion, The synergy of stepglm [both] with GBM results in a robust model that not only selects pertinent features but also intelligently combines them to optimize predictive power. This highlights the necessity of employing advanced, integrated approaches in developing predictive models, particularly in the context of sophisticated clinical datasets. Future research should continue to explore such hybrid models to further enhance prediction accuracy and support clinical decision-making.
This study identified a set of 12 variables, including WBC Count, Glucose, Neutrophils Count, Cystatin C, Temperature (body), Sodium (Whole Blood), Cholesterol (Total), Absolute Lymphocyte Count, Urea, Lactate, and Bilirubin (Total). However, we recently noticed a study indicating that white blood cell (WBC) count, neutrophil count (NEU), eosinophil count (EO), and hemoglobin (HGB) levels are significantly associated with an increased risk of pediatric pneumonia (35). By carefully comparing our results with this study, we found that WBC and NEU are commonly shared variables, which exhibit significant prognostic value in our study. Additionally, Lu's article focuses on the association between prenatal and perinatal exposure to industrial air pollutants and childhood pneumonia, exploring potential mechanisms through blood biomarkers (35).Our prognostic model supports diagnosis, treatment, and early intervention, covering a broader range of indicators such as inflammatory markers (WBC, neutrophils), metabolic indicators (blood glucose, total cholesterol, urea), and organ function indicators (cystatin C, lactic acid). Lu's work through environmental epidemiology has revealed the long-term health effects of SO₂ exposure, emphasizing the importance of preventive medicine (35). Our research, on the other hand, has identified multi-dimensional prognostic variables from clinical data to support precision medicine. Certainly, in future studies, we aim to incorporate environmental exposure data such as SO₂ concentration into our prognostic models, enabling comprehensive assessments of both individual biological states and external environmental risks, achieving a holistic evaluation of the “individual-environment” interaction.
Furthermore, researchers have found that the WBC count, being an easily obtainable biomarker, can aid in identifying CAP patients who are more likely to benefit from adjunctive dexamethasone therapy (36). When used in conjunction with blood heparin-binding protein and the neutrophil-to-lymphocyte ratio, it can improve diagnostic specificity for critically ill patients (84.13%) (37). Our study is consistent with this evidence, although cohort analyses indicate that the WBC count may not be helpful in predicting non-severe and severe diseases in pediatric patients (38). We believe this discrepancy might be due to population differences across countries or the WBC count being a non-independent prognostic factor. Findings indicate that PFKFB3 is a molecular switch that regulates the use of glucose vs. fructose in glycolysis, thereby enhancing our understanding of lung endothelial cell metabolism during respiratory failure (39). Reducing neutrophil count has been shown to mitigate lung injury in murine models of pneumococcal pneumonia (40) and is significantly negatively correlated with respiratory failure in COVID-19 patients (41). Reviewing cohort analyses confirms that plasma Cystatin C levels decrease in CAP patients following antibiotic treatment (42). Additionally, serum Cystatin C within 24 h of admission appears to be a marker for predicting acute kidney injury in CAP patients (43). An observational study found that patients with elevated temperatures within the first 48 h of ICU admission had higher survival rates (44). Retrospective analysis revealed that hyponatremia not only increases morbidity in CAP patients but is also an independent predictor of prolonged hospitalization (45).
Cholesterol has been identified as a risk factor for CAP in young South Korean soldiers, with the case group's levels lower than those of the control group (46). Inhibiting cholesterol ester transfer protein has even been shown to reduce mortality in murine models of pneumococcal-induced sepsis (47). Studies indicate that the absolute lymphocyte count at the time of pneumonia diagnosis can serve as a prognostic factor for postoperative pneumonia patients (48). The absolute lymphocyte count at admission can even distinguish between SARS and CAP cases (49). A single-center retrospective cohort study found that a higher Urea-to-Albumin Ratio at the onset of ICU admission is independently associated with increased in-hospital mortality in patients with severe pneumonia (50). The criteria encompassing Confusion, Urea, Respiratory Rate, and Shock Index or Adjusted Shock Index predict mortality in community-acquired pneumonia (51). It has been reported that patients who die, are hospitalized, or admitted to the ICU due to pneumonia exhibit higher lactate levels (52). Initial blood lactate was an independent outcome predictor in COVID-19 ICU patients (53). A significant decrease in Bilirubin, Total levels was observed among survivors of severe pneumonia (54), while an increase was significantly more prominent in the mortality group of COVID patients compared to the survivors (55). Children with severe pneumonia displayed elevated levels of Bilirubin, Total, and uric acid (56).
Reviewing these findings reveals that the 12 variables mentioned are associated with the severity and prognosis of pneumonia, although there have been no reports of these variables collectively serving as prognostic factors. The relevance of these predictors in clinical practice reflects the physiological state and disease severity of patients. The construction of predictive models demonstrates the potential of machine learning technology in clinical applications. This outcome not only underscores the importance of comprehensive biochemical markers in prognosis assessment but also provides a robust foundation for clinical decision-making. In practice, early identification and intervention based on these markers enable clinicians to formulate more effective personalized treatment plans, thereby improving patient outcomes. Moreover, the study's results offer valuable insights for similar applications in the management of other diseases, further propelling the advancement of precision medicine. Consequently, this finding holds significant clinical implications and opens new avenues for research in the field of pediatric critical care.
5 Conclusions
In this study, we employed a variety of statistical methods to identify laboratory test parameters associated with the prognosis of pediatric pneumonia patients, identifying 25 test indicators closely related to ICU mortality. Linear regression analysis revealed a linear correlation between 11 variables and outcomes, while logistic regression elucidated the influence of 11 indicators. A stepwise regression algorithm preliminarily selected 28 variables from the original 78 for subsequent analysis, and the intersection of the Top 20 correlated features from Spearman and Pearson algorithms yielded 14 model construction factors. We obtained various variable interaction coefficients through Random Forest (RF) and Grey Relational Analysis. Among 113 machine learning algorithm combinations, “Stepglm [both] + GBM” exhibited the highest prognostic accuracy, with 89% accuracy in the training set, an AUC of 0.698 in the test set, and an average AUC of 0.794.
In this study, we aimed to identify laboratory test parameters that are associated with the prognosis of pediatric pneumonia patients. While our findings are promising, their translation into clinical practice requires further exploration and collaboration with clinicians. To facilitate the application of our research findings in clinical decision-making, we plan to develop clinical decision support tools in collaboration with clinicians. Naturally, our research has several limitations. Due to data scarcity, we could only distinguish between the training and test sets within the cohort, lacking external cohort validation. The impact of data scarcity and the relatively small sample size (only 543 cases after data preprocessing) on the research conclusions cannot be overstated. Given the current trend in medical big data, our sample size is insufficient for a comprehensive assessment of the disease status. To quantify the possible deviation range and its potential impact on variable screening and model accuracy, further studies with larger sample sizes are warranted. To address these limitations and construct a mature clinical prediction model, continuous expansion of the sample size and optimization of algorithm parameters are necessary. In the future, based on this study, we plan to design prospective cohort studies to establish our own database. Additionally, we aim to conduct in-depth research on the specific impact mechanisms of these test indicators on pediatric pneumonia survival rates. By understanding the underlying mechanisms, we can enhance the prognosis and survival rates of patients.
Moreover, we recognize the need for interdisciplinary collaboration. Integrating our research findings into web applications or programs can facilitate clinicians and scholars in predicting disease trends, enabling early preventive measures and interventions. Collaborations with clinicians in further developing our research into clinical decision support tools or processes would be beneficial for the practical application of our findings. In summary, while our study provides valuable insights, its translation into clinical practice requires further collaborations and validations, particularly with regard to sample size expansion and interdisciplinary collaborations.
Data availability statement
The original contributions presented in the study are included in the article/Supplementary Material, further inquiries can be directed to the corresponding author.
Ethics statement
The studies involving humans were approved by the Institutional Review Board/Ethics Committee at the Children's Hospital, Zhejiang University School of Medicine (protocol number 2019_IRB_052). The studies were conducted in accordance with the local legislation and institutional requirements. Written informed consent for participation was not required from the participants or the participants' legal guardians/next of kin in accordance with the national legislation and institutional requirements.
Author contributions
MJ: Formal analysis, Writing – original draft. XH: Data curation, Writing – original draft. LJ: Methodology, Writing – original draft. JL: Visualization, Writing – original draft. JL: Supervision, Validation, Writing – original draft. YW: Funding acquisition, Writing – review & editing.
Funding
The author(s) declare that financial support was received for the research and/or publication of this article. This work was supported by Analysis and Time-Geographical Study of Traditional Chinese Medicine Prescriptions for Respiratory Epidemics during the Han, Song-Jin, Yuan, Ming, and Qing Dynasties (Project No. 202140324). And Research on the Experience of Diagnosis and Treatment in Shanghai-Style Traditional Chinese Medicine Schools Driven by Ontology and Visualization (Project No. 202340255). These funding bodies played role in the design of the study, the collection, analysis, and interpretation of the data.
Acknowledgments
We are absolutely grateful for the publicly available a pediatric-specific intensive care (PIC) database.
Conflict of interest
The authors declare that the research was conducted in the absence of any commercial or financial relationships that could be construed as a potential conflict of interest.
Generative AI statement
The author(s) declare that no Generative AI was used in the creation of this manuscript.
Publisher's note
All claims expressed in this article are solely those of the authors and do not necessarily represent those of their affiliated organizations, or those of the publisher, the editors and the reviewers. Any product that may be evaluated in this article, or claim that may be made by its manufacturer, is not guaranteed or endorsed by the publisher.
References
1. Ruuskanen O, Lahti E, Jennings LC, Murdoch DR. Viral pneumonia. Lancet. (2011) 377(9773):1264–75. doi: 10.1016/S0140-6736(10)61459-6
2. Hespanhol V, Bárbara C. Pneumonia mortality, comorbidities matter? Pulmonology. (2020) 26(3):123–9. doi: 10.1016/j.pulmoe.2019.10.003
3. GBD 2021 Lower Respiratory Infections and Antimicrobial Resistance Collaborators. Global, regional, and national incidence and mortality burden of non-COVID-19 lower respiratory infections and aetiologies, 1990–2021: a systematic analysis from the global burden of disease study 2021. Lancet Infect Dis. (2024) 24(9):974–1002. doi: 10.1016/S1473-3099(24)00176-2
4. Theodosiou AA, Read RC. Artificial intelligence, machine learning and deep learning: potential resources for the infection clinician. J Infect. (2023) 87(4):287–94. doi: 10.1016/j.jinf.2023.07.006
5. Liu R, Liu T, Dan T, Yang S, Li Y, Luo B, et al. AIDMAN: an AI-based object detection system for malaria diagnosis from smartphone thin-blood-smear images. Patterns (N Y). (2023) 4(9):100806. doi: 10.1016/j.patter.2023.100806
6. Maturana CR, de Oliveira AD, Nadal S, Serrat FZ, Sulleiro E, Ruiz E, et al. iMAGING: a novel automated system for malaria diagnosis by using artificial intelligence tools and a universal low-cost robotized microscope. Front Microbiol. (2023) 14:1240936. doi: 10.3389/fmicb.2023.1240936
7. Zhang F, Zhang F, Li L, Pang Y. Clinical utilization of artificial intelligence in predicting therapeutic efficacy in pulmonary tuberculosis. J Infect Public Health. (2024) 17(4):632–41. doi: 10.1016/j.jiph.2024.02.012
8. Nijiati M, Ma J, Hu C, Tuersun A, Abulizi A, Kelimu A, et al. Artificial intelligence assisting the early detection of active pulmonary Tuberculosis from chest x-rays: a population-based study. Front Mol Biosci. (2022) 9:874475. doi: 10.3389/fmolb.2022.874475
9. Sun B, Lei M, Wang L, Wang X, Li X, Mao Z, et al. Prediction of sepsis among patients with major trauma using artificial intelligence: a multicenter validated cohort study. Int J Surg. (2024) 111(1):467–80. doi: 10.1097/JS9.0000000000001866
10. Rawson TM, Hernandez B, Moore LSP, Herrero P, Charani E, Ming D, et al. A real-world evaluation of a case-based reasoning algorithm to support antimicrobial prescribing decisions in acute care. Clin Infect Dis. (2021) 72(12):2103–11. doi: 10.1093/cid/ciaa383
11. Zhou Y, Wang F, Tang J, Nussinov R, Cheng F. Artificial intelligence in COVID-19 drug repurposing. Lancet Digit Health. (2020) 2(12):e667–76. doi: 10.1016/S2589-7500(20)30192-8
12. Binson VA, Thomas S, Subramoniam M, Arun J, Naveen S, Madhu S. A review of machine learning algorithms for biomedical applications. Ann Biomed Eng. (2024) 52(5):1159–83. doi: 10.1007/s10439-024-03459-3
13. Uddin S, Khan A, Hossain ME, Moni MA. Comparing different supervised machine learning algorithms for disease prediction. BMC Med Inform Decis Mak. (2019) 19(1):281. doi: 10.1186/s12911-019-1004-8
14. Nwanosike EM, Conway BR, Merchant HA, Hasan SS. Potential applications and performance of machine learning techniques and algorithms in clinical practice: a systematic review. Int J Med Inform. (2022) 159:104679. doi: 10.1016/j.ijmedinf.2021.104679
15. Fernstrom JD. Tryptophan, serotonin and carbohydrate appetite: will the real carbohydrate craver please stand up!. J Nutr. (1988) 118(11):1417–9. doi: 10.1093/jn/118.11.1417
16. Zeng X, Yu G, Lu Y, Tan L, Wu X, Shi S, et al. PIC, a paediatric-specific intensive care database. Sci Data. (2020) 7(1):14. doi: 10.1038/s41597-020-0355-4
17. Xing Y-F, Li X. Normality test is needed in data description: a neglectful but vital problem. Kidney Int. (2013) 83(5):970–1. doi: 10.1038/ki.2013.30
18. Ialongo C. Confidence interval of percentiles in skewed distribution: the importance of the actual coverage probability in practical quality applications for laboratory medicine. Biochem Med (Zagreb). (2019) 29(3):030101. doi: 10.11613/BM.2019.030101
19. Januszyk M, Gurtner GC. Statistics in medicine. Plast Reconstr Surg. (2011) 127(1):437–44. doi: 10.1097/PRS.0b013e3181f95dd2
20. Kim H-Y. Statistical notes for clinical researchers: the independent samples t-test. Restor Dent Endod. (2019) 44(3):e26. doi: 10.5395/rde.2019.44.e26
21. Guo J, Wu G. Rank sum test or paired t-test? Plast Reconstr Surg. (2011) 128(4):369e. doi: 10.1097/PRS.0b013e3182268833
22. Schober P, Vetter TR. Chi-square tests in medical research. Anesth Analg. (2019) 129(5):1193. doi: 10.1213/ane.0000000000004410
23. Schober P, Vetter TR. Linear regression in medical research. Anesth Analg. (2021) 132(1):108–9. doi: 10.1213/ANE.0000000000005206
24. Marill KA. Advanced statistics: linear regression, part II: multiple linear regression. Acad Emerg Med. (2004) 11(1):94–102. doi: 10.1197/j.aem.2003.09.006
25. Krzywinski M, Altman N. Multiple linear regression. Nat Methods. (2015) 12(12):1103–4. doi: 10.1038/nmeth.3665
26. Zabor EC, Reddy CA, Tendulkar RD, Patil S. Logistic regression in clinical studies. Int J Radiat Oncol Biol Phys. (2022) 112(2):271–7. doi: 10.1016/j.ijrobp.2021.08.007
27. Bishara AJ, Hittner JB. Testing the significance of a correlation with nonnormal data: comparison of Pearson, spearman, transformation, and resampling approaches. Psychol Methods. (2012) 17(3):399–417. doi: 10.1037/a0028087
28. Sedgwick P. Spearman’s rank correlation coefficient. Br Med J. (2014) 349:g7327. doi: 10.1136/bmj.g7327
29. Johnson A, Cooper GF, Visweswaran S. A novel personalized random forest algorithm for clinical outcome prediction. Stud Health Technol Inform. (2022) 290:248–52. doi: 10.3233/shti220072
30. Roberti de Siqueira F, Robson Schwartz W, Pedrini H. Multi-scale gray level co-occurrence matrices for texture description. Neurocomputing. (2013) 120:336–45. doi: 10.1016/j.neucom.2012.09.042
31. Schultheiss C, Bühlmann P, Yuan M. Higher-order least squares: assessing partial goodness of fit of linear causal models. J Am Stat Assoc. (2024) 119(546):1019–31. doi: 10.1080/01621459.2022.2157728
32. Li C-N, Shao Y-H, Chen W-J, Wang Z, Deng N-Y. Generalized two-dimensional linear discriminant analysis with regularization. Neural Netw. (2021) 142:73–91. doi: 10.1016/j.neunet.2021.04.030
33. Lakoumentas J, Drakos J, Karakantza M, Sakellaropoulos G, Megalooikonomou V, Nikiforidis G. Optimizations of the naïve-Bayes classifier for the prognosis of B-chronic lymphocytic leukemia incorporating flow cytometry data. Comput Methods Programs Biomed. (2012) 108(1):158–67. doi: 10.1016/j.cmpb.2012.02.009
34. Shipe ME, Deppen SA, Farjah F, Grogan EL. Developing prediction models for clinical use using logistic regression: an overview. J Thorac Dis. (2019) 11(Suppl 4):S574–84. doi: 10.21037/jtd.2019.01.25
35. Lu C, Peng W, Kuang J, Wu M, Wu H, Murithi RG, et al. Preconceptional and prenatal exposure to air pollution increases incidence of childhood pneumonia: a hypothesis of the (pre-)fetal origin of childhood pneumonia. Ecotoxicol Environ Saf. (2021) 210:111860. doi: 10.1016/j.ecoenv.2020.111860
36. Wittermans E, van de Garde EM, Voorn GP, Aldenkamp AF, Janssen R, Grutters JC, et al. Neutrophil count, lymphocyte count and neutrophil-to-lymphocyte ratio in relation to response to adjunctive dexamethasone treatment in community-acquired pneumonia. Eur J Intern Med. (2022) 96:102–8. doi: 10.1016/j.ejim.2021.10.030
37. Meng Y, Zhang L, Huang M, Sun G. Blood heparin-binding protein and neutrophil-to-lymphocyte ratio as indicators of the severity and prognosis of community-acquired pneumonia. Respir Med. (2023) 208:107144. doi: 10.1016/j.rmed.2023.107144
38. Florin TA, Ambroggio L, Brokamp C, Zhang Y, Rattan M, Crotty E, et al. Biomarkers and disease severity in children with community-acquired pneumonia. Pediatrics. (2020) 146(3):e2020011452. doi: 10.1542/peds.2020-011452
39. Lee JY, Stevens RP, Pastukh VV, Pastukh VM, Kozhukhar N, Alexeyev MF, et al. PFKFB3 Inhibits fructose metabolism in pulmonary microvascular endothelial cells. Am J Respir Cell Mol Biol. (2023) 69(3):340–54. doi: 10.1165/rcmb.2022-0443OC
40. Feng J, Dai W, Zhang C, Chen H, Chen Z, Chen Y, et al. Shen-ling-bai-zhu-san ameliorates inflammation and lung injury by increasing the gut microbiota in the murine model of Streptococcus pneumonia-induced pneumonia. BMC Complement Med Ther. (2020) 20(1):159. doi: 10.1186/s12906-020-02958-9
41. Poggiali E, Zaino D, Immovilli P, Rovero L, Losi G, Dacrema A, et al. Lactate dehydrogenase and C-reactive protein as predictors of respiratory failure in COVID-19 patients. Clin Chim Acta. (2020) 509:135–8. doi: 10.1016/j.cca.2020.06.012
42. Lee Y-T, Chen S-C, Shyu L-Y, Lee M-C, Wu T-C, Tsao S-M, et al. Significant elevation of plasma cathepsin B and cystatin C in patients with community-acquired pneumonia. Clin Chim Acta. (2012) 413(5–6):630–5. doi: 10.1016/j.cca.2011.12.010
43. Hsu F-C, Palmer ND, Chen S-H, Ng MCY, Goodarzi MO, Rotter JI, et al. Methods for estimating insulin resistance from untargeted metabolomics data. Metabolomics. (2023) 19(8):72. doi: 10.1007/s11306-023-02035-5
44. Guzelj D, Grubelnik A, Greif N, Povalej Bržan P, Fluher J, Kalamar Ž, et al. The effect of body temperature changes on the course of treatment in patients with pneumonia and sepsis: results of an observational study. Interact J Med Res. (2024) 13:e52590. doi: 10.2196/52590
45. Ravioli S, Gygli R, Funk G-C, Exadaktylos A, Lindner G. Prevalence and impact on outcome of sodium and potassium disorders in patients with community-acquired pneumonia: a retrospective analysis. Eur J Intern Med. (2021) 85:63–7. doi: 10.1016/j.ejim.2020.12.003
46. Kang DR, Kim YK, Park MS, Kim YS, Ko DH, Kim C. Low levels of serum cholesterol and albumin and the risk of community-acquired pneumonia in young soldiers. Int J Tuberc Lung Dis. (2008) 12(1):26–32.18173873
47. Deng H, Liang WY, Chen LQ, Yuen TH, Sahin B, Vasilescu DM, et al. CETP inhibition enhances monocyte activation and bacterial clearance and reduces streptococcus pneumonia-associated mortality in mice. JCI Insight. (2024) 9(8):e173205. doi: 10.1172/jci.insight.173205
48. Murakami Y, Shindo Y, Sano M, Okumura J, Kobayashi H, Sakakibara T, et al. Effects of lymphocyte and neutrophil counts and their time courses on mortality in patients with postoperative pneumonia. Sci Rep. (2022) 12(1):14564. doi: 10.1038/s41598-022-18794-5
49. Muller MP, Tomlinson G, Marrie TJ, Tang P, McGeer A, Low DE, et al. Can routine laboratory tests discriminate between severe acute respiratory syndrome and other causes of community-acquired pneumonia? Clin Infect Dis. (2005) 40(8):1079–86. doi: 10.1086/428577
50. Tian Y, Li Y, Jiang Z, Chen J. Urea-to-albumin ratio and in-hospital mortality in severe pneumonia patients. Can J Infect Dis Med Microbiol. (2021) 2021:5105870. doi: 10.1155/2021/5105870
51. Myint PK, Musonda P, Sankaran P, Subramanian DN, Ruffell H, Smith AC, et al. Confusion, urea, respiratory rate and shock Index or adjusted shock index (CURSI or CURASI) criteria predict mortality in community-acquired pneumonia. Eur J Intern Med. (2010) 21(5):429–33. doi: 10.1016/j.ejim.2010.07.005
52. Chen Y-X, Li C-S. Lactate on emergency department arrival as a predictor of mortality and site-of-care in pneumonia patients: a cohort study. Thorax. (2015) 70(5):404–10. doi: 10.1136/thoraxjnl-2014-206461
53. Puvaneswary M, Afzal M. Angiographic appearances of islet cell tumours of the pancreas. Australas Radiol. (1985) 29(2):142–6. doi: 10.1111/j.1440-1673.1985.tb01679.x
54. Lei J, Wang L, Li Q, Gao L, Zhang J, Tan Y. Identification of RAGE and OSM as new prognosis biomarkers of severe pneumonia. Can Respir J. (2022) 2022:3854191. doi: 10.1155/2022/3854191
55. Zhang L, Hou J, Ma F-Z, Li J, Xue S, Xu Z-G. The common risk factors for progression and mortality in COVID-19 patients: a meta-analysis. Arch Virol. (2021) 166(8):2071–87. doi: 10.1007/s00705-021-05012-2
Keywords: pneumonia, intensive care unit, machine learning algorithms, paediatrics, predictive models
Citation: Jia M, Hu X, Ji L, Lin J, Liu J and Wang Y (2025) Predictive for patients with pneumonia in pediatric intensive care unit. Front. Pediatr. 13:1583573. doi: 10.3389/fped.2025.1583573
Received: 26 February 2025; Accepted: 2 May 2025;
Published: 6 June 2025.
Edited by:
Christian Bohringer, UC Davis Medical Center, United StatesReviewed by:
Chan Lu, Central South University, ChinaMohammad Bagher Rahmati, Hormozgan University of Medical Sciences, Iran
Copyright: © 2025 Jia, Hu, Ji, Lin, Liu and Wang. This is an open-access article distributed under the terms of the Creative Commons Attribution License (CC BY). The use, distribution or reproduction in other forums is permitted, provided the original author(s) and the copyright owner(s) are credited and that the original publication in this journal is cited, in accordance with accepted academic practice. No use, distribution or reproduction is permitted which does not comply with these terms.
*Correspondence: Yong Wang, MzQ1MDIwMjQwQHFxLmNvbQ==