 Ying Wang
 Wanqin Song1
 Xianming Xu
 Wenjun Liu
 Chengjun Liu
 Feng Xu
 Jing Li
- 1Department of Critical Care Medicine, Children’s Hospital of Chongqing Medical University, National Clinical Research Center for Child Health and Disorders, Ministry of Education Key Laboratory of Child Development and Disorders, Chongqing, China
- 2Department of Emergency, Children’s Hospital of Chongqing Medical University, Chongqing, China
- 3Big Data Center for Children’s Medical Care, Children’s Hospital of Chongqing Medical University, Chongqing, China
Objective: Metabolic heterogeneity in sepsis is a critical determinant of prognosis. This study applied group-based trajectory modeling (GBTM) to identify blood glucose trajectory phenotypes in pediatric sepsis and elucidate their associations with clinical outcomes.
Methods: A retrospective cohort study was conducted, enrolling 1,178 pediatric patients diagnosed with sepsis who were admitted to the pediatric intensive care unit of the Children's Hospital of Chongqing Medical University between 2014 and 2022. Dynamic blood glucose data were collected within 72 h of ICU admission, and GBTM was employed to classify trajectory phenotypes. Multivariate logistic regression was used to identify independent predictors of in-hospital mortality. A subgroup analysis focused specifically on patients with septic shock.
Results: The analysis identified four distinct blood glucose trajectory phenotypes: Group 1 (7.3%): Slow-recovery hypoglycemia, predominantly among infants with severe liver injury, coagulopathy, and hyperlactatemia (in-hospital mortality: 13.79%). Group 2 (59.9%): Normoglycemia with minimal organ dysfunction (reference group; mortality: 5.10%). Group 3 (27.7%): Persistent mild hyperglycemia, characterized by elevated inflammatory markers and mild organ injury (mortality: 8.26%). Group 4 (4.9%): Persistent severe hyperglycemia associated with renal impairment and lactate accumulation (mortality: 17.24%). Multivariate analysis revealed Group 4 as an independent risk factor for mortality (aOR = 3.13, 95% CI 1.38–7.07). In the septic shock subgroup, the mortality risks for Group 1 and Group 4 increased by 5.2-fold and 8.28-fold, respectively (both P < 0.05).
Conclusion: GBTM effectively stratifies pediatric sepsis into distinct blood glucose trajectory phenotypes. Persistent severe hyperglycemia (Group 4) independently predicts in-hospital mortality, while slow-recovery hypoglycemia (Group 1) indicates a poor prognosis in septic shock. Phenotype-guided interventions are recommended: early insulin therapy (target blood glucose <10 mmol/L) for Group 4 and prophylactic glucose infusion (target >3.8 mmol/L) for Group 1.
1 Introduction
Sepsis, a dysregulated host response to infection causing life-threatening organ dysfunction, is fundamentally driven by maladaptive immunity (1). Diagnosed in children using the Phoenix Sepsis Score (≥2 with suspected/confirmed infection) (2, 3), it affects 25 million pediatric patients annually with 22.9% mortality (4). Despite standardized care bundles, 30%–40% of patients respond poorly to therapies (e.g., fluids, antibiotics, vasopressors), and targeted drug trials consistently fail (5, 6). This reflects sepsis' heterogeneity—a syndrome comprising distinct pathophysiological subtypes (7–9).
This heterogeneity involves intertwined mechanisms: dynamic pro-/anti-inflammatory immune shifts, endothelial glycocalyx damage causing microcirculatory failure, and coagulopathy (10, 11). Crucially, metabolic reprogramming is a central driver, where glucose dysregulation strongly correlates with organ injury and death (12–14). While hypoglycemia and glucose variability predict adverse outcomes (15, 16), hyperglycemia's role remains contentious (17). Current pediatric guidelines strongly advise against insulin-driven tight glucose control (≤7.8 mmol/L) but lack evidence-based thresholds (18)—a gap likely arising from studies ignoring metabolic heterogeneity in unstratified cohorts.
Conventional research relies heavily on cross-sectional glucose metrics (e.g., admission or extreme values) (15, 16, 19), failing to capture dynamic temporal adaptations that may define pathophysiological subtypes. Longitudinal trajectory modeling addresses this need. Group-based trajectory modeling (GBTM) clusters biomarker evolution into distinct phenotypes using polynomial functions (20–25). Pioneering work by Bhavani et al. applied GBTM to febrile trajectories, revealing prognostic subtypes and heterogeneous host responses (25, 26)—providing a methodological blueprint for metabolic phenotyping.
We therefore propose a precision medicine strategy: “metabolic phenotyping-guided intervention”. Using GBTM, we identify pathophysiologically meaningful blood glucose trajectory phenotypes, quantifying their slope, curvature, and amplitude. This study addresses: (1) Existence: Do characteristic blood glucose trajectory phenotypes exist in pediatric sepsis? (2) Clinical relevance: Do phenotypes correlate with unique organ injury patterns and outcomes? (3) Translation: Can phenotypes inform individualized glucose management?
2 Materials and methods
2.1 Study design
This retrospective cohort study included patients admitted to the Pediatric Intensive Care Unit (PICU) at Children's Hospital of Chongqing Medical University (January 1, 2014 – December 31, 2022). As a major regional referral center in Southwest China, the hospital serves a catchment population of approximately 30 million children, which contributed to the diversity of the study sample. The study was approved by the hospital's Scientific Research and Ethics Committee [No.: 2024 Lun Shen (Yan) 334] with waived informed consent due to its retrospective design.
2.2 Participants
The inclusion criteria comprised patients with discharge diagnoses of sepsis, bacteremia, or septic shock, aged over 28 days and under 18 years, with a PICU length of stay exceeding 72 h. Exclusion criteria were established for patients with diabetes mellitus or malignancy. To construct trajectory models, participants with fewer than three blood glucose tests within 72 h of PICU admission were excluded, ultimately incorporating 1,178 participants into the analysis (Figure 1).
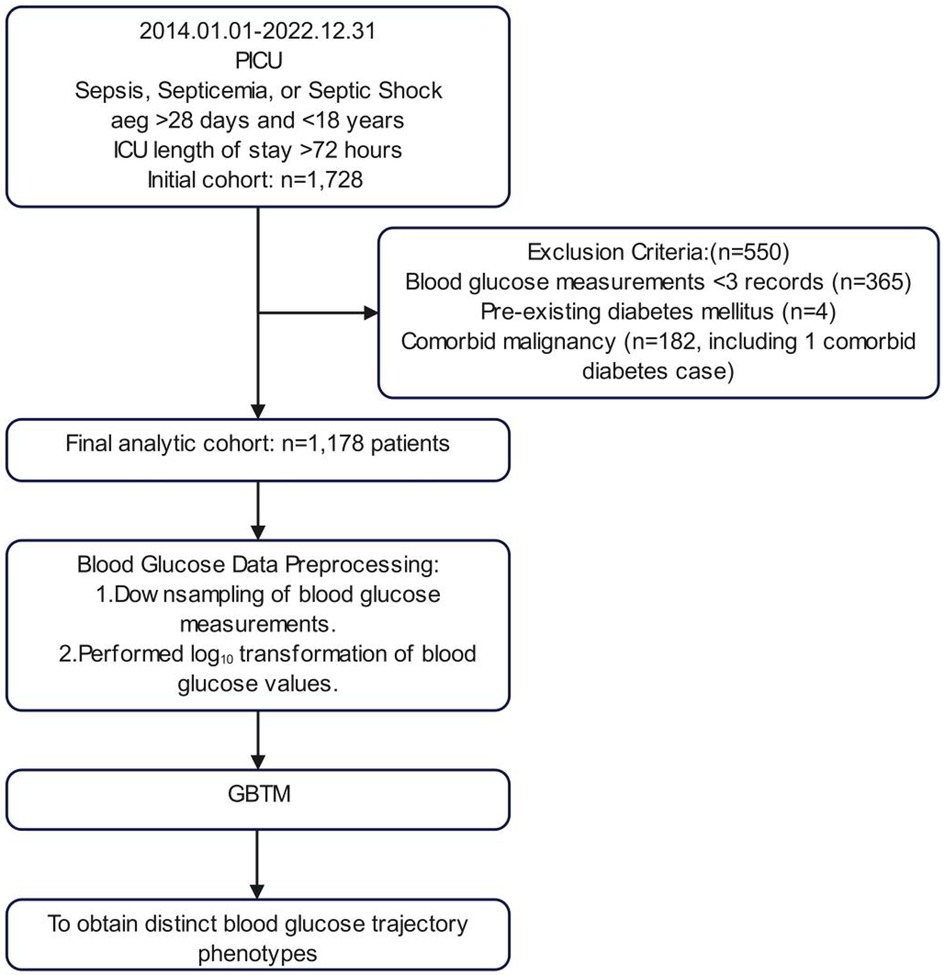
Figure 1. Flowchart of case selection and modeling process.
2.3 Data collection
Longitudinal blood glucose measurements (mmol/L) were obtained via arterial blood gas analysis within 72 h of PICU admission. Approximately 75% of the blood gas analyses were conducted using the ABL 90 series analyzer (Radiometer ABL 90 flex; Radiometer, Copenhagen, Denmark), while the remaining analyses were performed using the GEM Premier 3000 analyzer (Instrumentation Laboratory, Bedford, MA) and the Nova Stat Profile® Prime CCS Analyzer (Nova Biomedical, MA, United States). All devices had comparable reference ranges and underwent daily internal/external quality controls. Baseline characteristics included age, sex, traumatic brain injury, and infection site (pulmonary/abdominal/urinary/blood stream/intracranial/skin-mucosal). Laboratory parameters encompassed white blood cell count (WBC), absolute lymphocyte count (ALC), absolute neutrophil count (ANC), lymphocyte percentage, neutrophil percentage, C-reactive protein (CRP), procalcitonin (PCT), fibrinogen (FIB), alanine aminotransferase (ALT), aspartate aminotransferase (AST), total bilirubin (TB), albumin (ALB), lactate dehydrogenase (LDH), platelet count (PLT), international normalized ratio (INR), D-dimer, blood urea nitrogen (BUN), serum creatinine (sCr), and blood lactate (Lac). For parameters measured multiple times within 72 h, the most clinically significant extreme values were recorded, including minimum platelet count, maximum lactate, peak and minimum WBC, and extreme fibrinogen levels. The primary endpoint was in-hospital mortality; secondary endpoints included mechanical ventilation, renal replacement therapy, and septic shock. In this study, the management of dysglycemia in pediatric patients strictly adhered to our institution's standardized clinical pathway (27). Specifically, when a child's blood glucose level consistently exceeded 10 mmol/L, the standard procedure involved immediate discontinuation of all sugar-containing infusions, followed by a 2-hour close observation period. If blood glucose showed a progressive upward trend during this period, an individualized insulin regimen was initiated, accompanied by an increase in blood glucose monitoring frequency to at least once per hour. For patients with hypoglycemia (blood glucose < 2.8 mmol/L), the clinical team promptly administered intravenous glucose infusion as an emergency intervention until blood glucose levels stabilized within the normal range. No missing data existed for baseline characteristics or endpoints. Laboratory parameters (max missing rate: 3.3% for PCT) underwent median imputation.
2.4 Statistical analysis
GBTM, a finite mixture model using polynomial time functions, clustered longitudinal blood glucose data (20, 21). To optimize model performance, we implemented several preprocessing steps: (1) For patients with more than 10 glucose measurements within 72 h, we extracted maximum and minimum values at 6-hour intervals, yielding between 3 and 25 data points per patient. (2) Given the significant right skewness of the glucose values, we applied a log10 transformation prior to modeling (Figure 1). To balance model fit and parsimony, we determined trajectory groups by integrating statistical metrics with clinical interpretability. The criteria for model selection included an average posterior probability (AvePP) greater than 70%, closer alignment between posterior probability (Pj) and estimated group probability (πj), lower Bayesian Information Criterion (BIC) values indicating a better fit, higher relative entropy (Ek) values, statistically significant polynomial functions for each trajectory group (P < 0.05), and clinically interpretable trajectory shapes. Continuous non-normal variables (Shapiro–Wilk) reported as median [IQR]; compared via Mann–Whitney U (2-group) or Kruskal–Wallis H (≥3 groups). Categorical variables reported as n (%); compared via χ2 or Fisher's exact test (expected counts <5). Bonferroni correction applied for significant multi-group comparisons. Multivariate logistic regression (stepwise) identified independent predictors. Discriminative power assessed by ROC-AUC (95% CI).
Trajectory modeling was performed using the SAS software package (version 9.4) with the PROC TRAJ application, while all other statistical analyses were carried out using R software (version 4.3.0). Two-tailed tests were employed throughout the study, with a significance level set at α = 0.05; P values less than 0.05 were considered statistically significant.
3 Results
3.1 Blood glucose trajectory phenotypes
We initially fitted linear, quadratic, and cubic polynomial functions to identify 1–5 trajectory groups. The optimal model revealed four distinct trajectory phenotypes, determined through a comprehensive evaluation of the BIC, the Ek and clinical interpretability (Supplementary Figure S1 and Tables S1–S4): Group 1 (Slow-Recovery Hypoglycemia): Characterized by initial hypoglycemia (median 3.8 mmol/L) with gradual normalization, observed in 87 cases (7.3%). Group 2 (Normoglycemia): Exhibited stable glucose levels (median 5.7 mmol/L) throughout the 72 h of PICU admission, representing the largest subgroup with 706 cases (59.9%). Group 3 (Persistent Mild Hyperglycemia): Demonstrated sustained mild hyperglycemia (median 7.0 mmol/L) in 327 cases (27.7%). Group 4 (Persistent Severe Hyperglycemia): Displayed prolonged severe hyperglycemia (median 10.1 mmol/L) in 58 cases (4.9%) (Figure 2). This GBTM analysis stratified pediatric sepsis patients into four distinct blood glucose trajectory phenotypes.
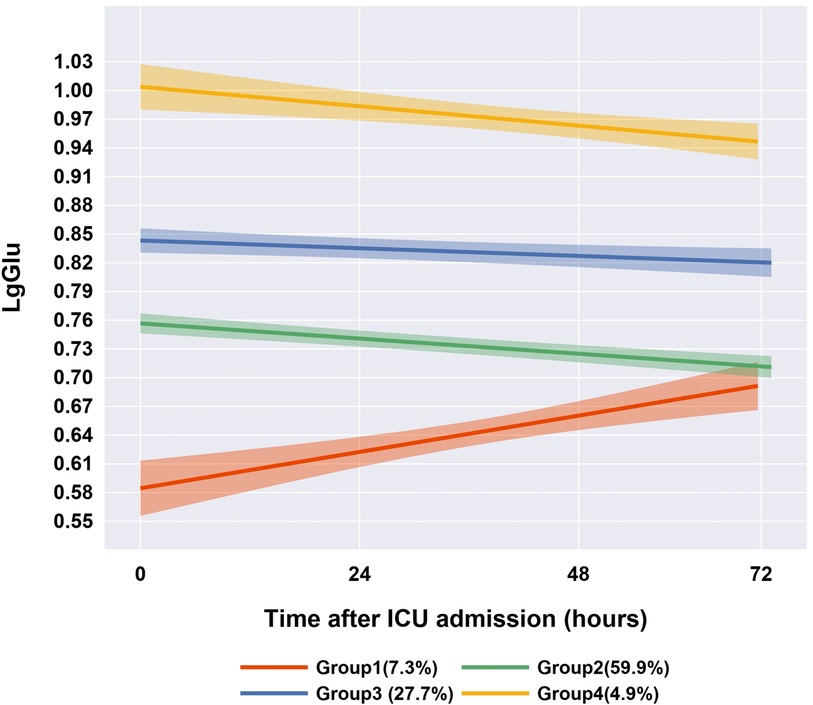
Figure 2. Four-group blood glucose trajectories of the best-fitting group trajectory model (n = 1,178).
3.2 Intergroup differences in clinical characteristics
Age distribution differed significantly (P < 0.001): Group 1 had highest infant proportion (68.97%) vs. Group 2 (reference); Groups 3–4 were predominantly >1 year. Group 3 showed highest traumatic brain injury rate (2.75%, P < 0.05). No sex/infection site differences (Table 1).
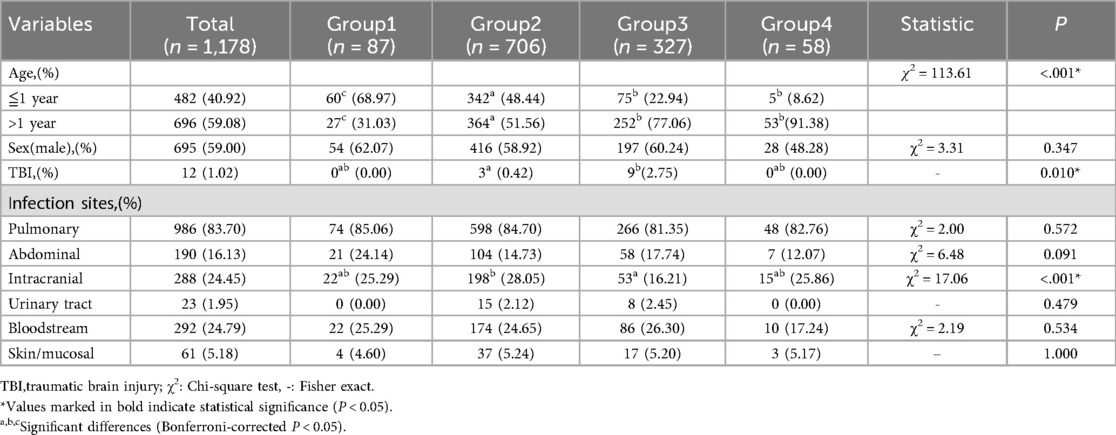
Table 1. Comparison of baseline characteristics among the four phenotypes.
Laboratory parameters revealed marked differences in systemic inflammation, hepatic and renal function, coagulation profiles, and lactate metabolism (Table 2). Group 2, characterized by normoglycemia, exhibited the most favorable physiological status, displaying moderate inflammation, minimal organ injury, normal coagulation, and the lowest lactate levels. In contrast, Group 1 demonstrated a distinct pathological pattern, characterized by attenuated inflammatory responses coupled with severe hepatic dysfunction and coagulopathy, presenting the lowest fibrinogen levels and platelet counts among all groups (P < 0.001). Group 3 was marked by systemic hyperinflammation, with significantly elevated inflammatory markers. Conversely, Group 4 mirrored the inflammatory profile of Group 3 but exhibited more pronounced renal impairment. Blood lactate levels followed a gradient: Group 2 < Group 3 < Group 1/Group 4 (P < 0.001). Visual representations of the laboratory parameters are illustrated in Supplementary Figure S2.
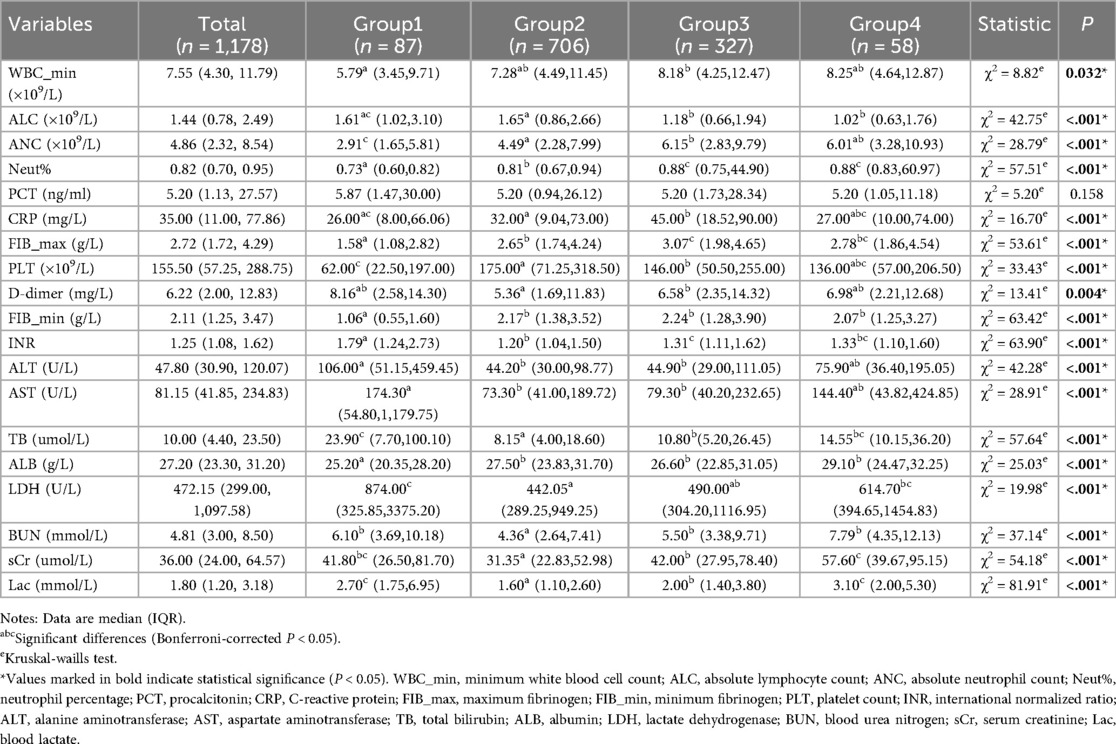
Table 2. Comparison of laboratory parameters among the four phenotypes.
Among 1,178 patients, 85 experienced in-hospital mortality, resulting in an overall mortality rate of 7.22%. Mortality elevated in Group 1 (13.79%) and Group 4 (17.24%) vs. Group 2 (5.10%, P < 0.001). Mechanical ventilation/renal replacement differed (P < 0.05); septic shock incidence was comparable (Table 3).
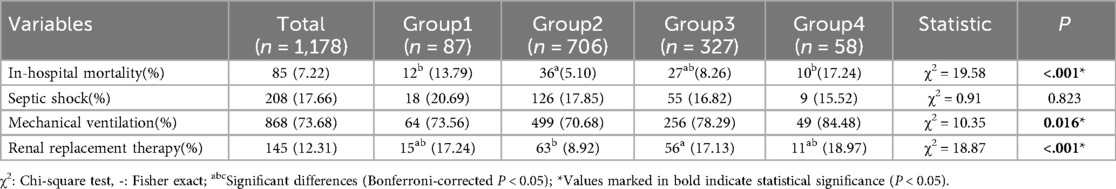
Table 3. Comparison of outcomes and treatment conditions among the four phenotypes.
3.3 Risk factors for in-hospital mortality in sepsis
Univariate logistic regression was conducted to evaluate the associations between candidate variables and in-hospital mortality. The variables analyzed included: (1) Demographics: age and sex; (2) Clinical features: blood glucose trajectory phenotypes, septic shock, mechanical ventilation, and renal replacement therapy; (3) Laboratory parameters: complete blood count, coagulation profile, hepatic and renal function, and lactate levels. Using Group 2 (normoglycemia) as the reference, both Group 1 (odds ratio [OR] 2.98, 95% confidence interval [CI] 1.49–5.97; P = 0.002) and Group 4 (OR 3.88, 95% CI 1.81–8.29; P < 0.001) demonstrated significantly elevated mortality risks (Supplementary Table S5). Additional significant predictors included septic shock, renal replacement therapy, decreased PLT, Hb, and FIB, prolonged INR, and increased levels of D-dimer, AST, TB, BUN, and Lac.
In the multivariate logistic regression analysis, variables with a p-value less than 0.05 from the univariate analysis were included in the multivariate logistic regression model, employing bidirectional stepwise regression for variable selection. The final model identified five independent predictors: blood glucose trajectory phenotypes, septic shock, renal replacement therapy,TB, and Lac (Table 4). After adjusting for confounding factors, blood glucose trajectory phenotypes remained significantly associated with in-hospital mortality. Compared to Group 2, Group 4 exhibited a 3.13-fold increase in mortality risk [adjusted odds ratio (aOR) 3.13, 95% CI 1.38–7.07; P = 0.006]. The multivariate model showed good fit (Hosmer-Lemeshow P = 0.589), no collinearity [variance inflation factors (VIF) < 10; Supplementary Table S6], and moderate discrimination (AUC 0.78, 95% CI 0.72–0.84; Supplementary Figure S3).
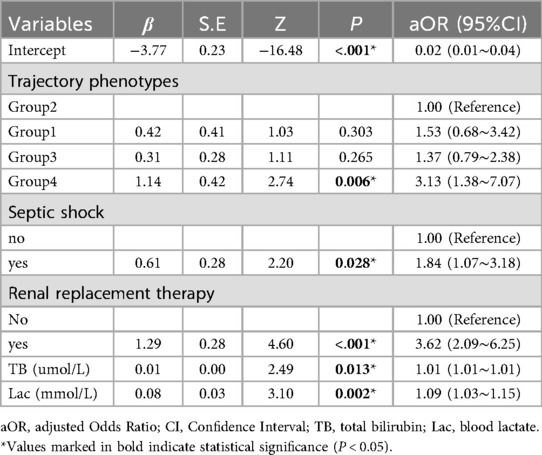
Table 4. Multivariate logistic regression analysis of risk factors for in-hospital mortality in sepsis patients.
3.4 Subgroup analysis
Among 208 septic shock patients (from 1,178 sepsis cases), multivariate analysis identified four independent mortality predictors: blood glucose trajectory phenotypes (using Group 2 as the reference: Group 1: aOR 5.20, 95% CI 1.27–21.28; P = 0.022; Group 4: aOR 8.28, 95% CI 1.47–46.55; P = 0.016), renal replacement therapy, elevated BUN and Lac. The model demonstrated high clinical predictive value, with an AUC of 0.87 (95% CI 0.80–0.93) (Supplementary Table S7 and Figure S4).
3.5 Robust analysis
To evaluate the stability of blood glucose trajectory phenotypes in patients with comorbidities, we conducted a subgroup analysis of 185 sepsis patients with diabetes or malignancy using GBTM. The expanded cohort consisted of 1,363 patients. Key findings include: (1) retention of the four primary glucose trajectory phenotypes; (2) consistent glucose trends vs. original cohort (n = 1,178; Figure 3). This validates phenotype robustness across comorbidities.
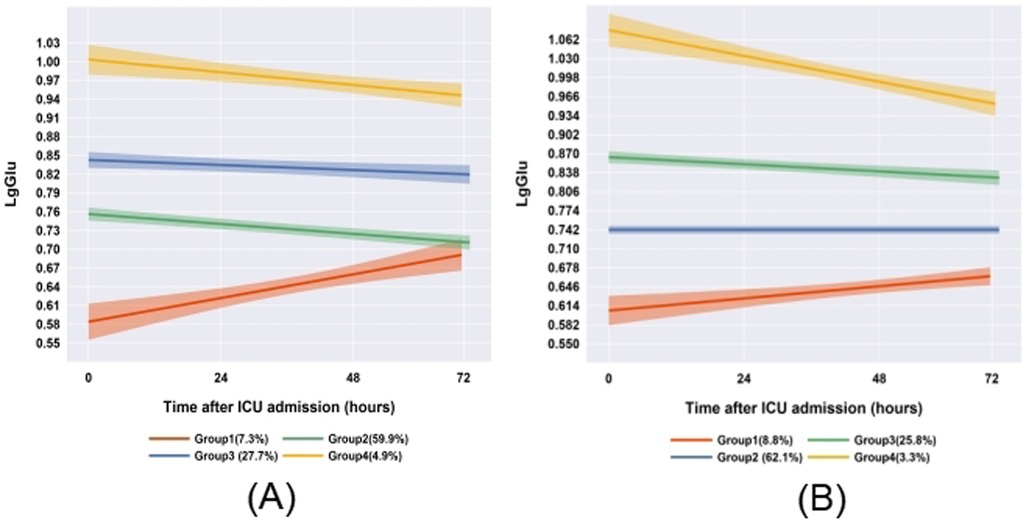
Figure 3. Comparison of glucose trajectories between comorbidity subgroups and the overall cohort (A: original cohort; B: patients with diabetes/cancer).
4 Discussion
Using GBTM, we analyzed longitudinal blood glucose data from 1,178 pediatric sepsis patients during their first 72 h in PICU. We identified four distinct blood glucose trajectory phenotypes: Group 1 (slow-recovery hypoglycemia), Group 2 (normoglycemia), Group 3 (persistent mild hyperglycemia), and Group 4 (persistent severe hyperglycemia). These phenotypes demonstrated significant associations with clinical outcomes. Multivariate regression analysis revealed that Group 4 was an independent risk factor for in-hospital mortality within the overall sepsis cohort (aOR 3.13, 95% CI 1.38–7.07). Notably, in the septic shock subgroup, both Group 1 (aOR 5.20, 95% CI 1.27–21.28) and Group 4 (aOR 8.28, 95% CI 1.47–46.55) exhibited the highest mortality risks. Furthermore, blood glucose trajectories correlated with specific patterns of organ dysfunction: Group 1 was characterized by severe hepatic injury combined with coagulopathy, while Group 4 showed prominent renal impairment. Both Groups 1 and 4 had significantly higher lactate levels compared to Groups 2 and 3 (P < 0.001).
4.1 Association between blood glucose and prognosis in pediatric sepsis
In pediatric sepsis, early stress hyperglycemia (SHG) may initially support immune cell metabolism via inflammatory/endocrine pathways (13, 17, 28, 29). However, sustained hyperglycemia predicts adverse outcomes (30). Meta-analyses confirm nonlinear mortality risk: U-shaped (diabetic) and J-shaped (non-diabetic) curves, where persistent hyperglycemia beyond optimal thresholds increases mortality (31). Our trajectory analysis validates this, identifying persistent severe hyperglycemia (Group 4; median 10.1 mmol/L) as an independent predictor of in-hospital mortality. Notably, hypoglycemia risk was context-dependent: Slow-recovery hypoglycemia (Group 1) showed nonsignificant mortality risk overall (P > 0.05), potentially due to exclusion of early fatal hypoglycemia cases (ICU stay <72 h exclusion). However, in septic shock, Group 1 had critically elevated mortality (aOR=5.20), underscoring its threat in high-risk subgroups.
4.2 Blood glucose and organ dysfunction
Group 1 (slow-recovery hypoglycemia) exhibited significantly elevated biomarkers of hepatic injury, potentially linked to the“hepatogenic energy crisis”hypothesis (32). Persistent hypoglycemia may deplete glycogen and impair mitochondrial function, reducing lactate clearance. A vicious cycle ensues: (1) Liver injury suppresses the mRNA expression of phosphoenolpyruvate carboxykinase (PEPCK), limiting gluconeogenesis (33); (2) Decreased hepatic insulin-degrading enzyme (IDE) activity prolongs the half-life of insulin in peripheral circulation (34), worsening dysregulation. Associated coagulopathy (prolonged INR, hypofibrinogenemia and thrombocytopenia) reflects impaired synthetic function (35).
In Group 4 (persistent severe hyperglycemia), serum creatinine levels were significantly elevated compared to other phenotypes, indicating that sepsis-associated hyperglycemia may induce acute kidney injury (AKI) through metabolic toxicity. Hyperglycemia upregulates the expression of sodium-glucose cotransporter 2 (SGLT2) in renal tubules, causing glucose overload and mitochondrial stress—consistent with tubular vacuolization/fibrosis. SGLT2 inhibitors (e.g., dapagliflozin) mitigate this in sepsis-AKI models (36).
In our study, all abnormal phenotypes showed elevated lactate, indicating disrupted energy homeostasis. Sepsis impairs the tricarboxylic acid cycle (TAC), shunting pyruvate to lactate. Hyperglycemia suppresses TCA enzymes (e.g., α-ketoglutarate dehydrogenase) (37), while lactate accumulation inhibits gluconeogenesis (38, 39), creating a glucose-lactate vicious cycle.
Our study suggests a potential phenotype-specific interaction between glucose dysregulation and immune dysfunction in sepsis. Hyperglycemic phenotypes (Groups 3 and 4) exhibited enhanced activation of myeloid cells alongside significantly reduced absolute lymphocyte counts, a pattern consistent with CD8+ T cell exhaustion during the immune paralysis phase of sepsis. However, the causal relationship between glucose fluctuations and these immune alterations necessitates validation through expanded immunophenotyping, which should include interleukin-6 (IL-6) levels, monocyte human leukocyte antigen DR (mHLA-DR) expression, regulatory T cell ratio (Treg%), Th1/Th2 cytokine balance, and pathogen-specific antibody titers (40).
4.3 Clinical implications of blood glucose trajectories
Optimizing glycemic control in pediatric sepsis remains challenging. Moderate stress hyperglycemia may support immunity, but sustained levels ≥10 mmol/L increase multiorgan dysfunction and mortality (13, 41, 42). Tight control mitigates metabolic harm but risks iatrogenic hypoglycemia (41). Our trajectory analysis identifies two high-risk phenotypes: Group 4 (persistent severe hyperglycemia; median 10.1 mmol/L): highest mortality overall; Group 1 (slow-recovery hypoglycemia; nadir 3.8 mmol/L): critically elevated mortality in septic shock (Supplementary Table S4). Aligning with international guidelines (18, 27, 43–45), we propose a dual-threshold framework: Upper: 10.0 mmol/L (triggering insulin therapy) and Lower: 3.8 mmol/L (activating glucose infusion protocols).
4.4 Innovations and limitations
This study advances pediatric sepsis research by using GBTM to link glucose trajectories (vs. isolated measurements) with outcomes. Our key innovations include: (1) the identification of both absolute glucose abnormalities (e.g., hypoglycemia in Group 1, hyperglycemia in Groups 3 and 4) and dynamic patterns (e.g., sustained hyperglycemic plateaus in Group 4); (2) the mitigation of static measurement biases inherent to traditional approaches. However, several limitations warrant attention: (1) As all participants were recruited from a single tertiary pediatric center, our findings may reflect region-specific clinical practices. Generalizability to other settings warrants validation; (2) the lack of model validation means that the GBTM-derived phenotypes require internal and external validation using datasets such as the Medical Information Mart for Intensive Care (MIMIC) database; (3) regarding outcome scope, the inclusion of 28-day mortality and functional recovery metrics would enhance the phenotypic prognostic interpretation.
5 Conclusion
This study successfully identified four characteristic blood glucose trajectory phenotypes in children with sepsis using GBTM: Group 1 as the slow recovery from hypoglycemia type, Group 2 as the normoglycemic type, Group 3 as the persistent mild hyperglycemia type, and Group 4 as the persistent severe hyperglycemia type. It ultimately revealed the association between blood glucose trajectories and organ dysfunction, as well as clinical prognosis in children with sepsis, thereby providing a new theoretical basis and practical framework for precise blood glucose management. Future multi-center studies are essential to confirm the generalizability of these phenotypes.
Data availability statement
The datasets presented in this study can be found in online repositories. The names of the repository/repositories and accession number(s) can be found in the article/Supplementary Material.
Ethics statement
The studies involving humans were approved by the Scientific Research and Ethics Committee of Children's Hospital of Chongqing Medical University. The studies were conducted in accordance with the local legislation and institutional requirements. Written informed consent for participation in this study was provided by the participants' legal guardians/next of kin.
Author contributions
YW: Data curation, Formal analysis, Investigation, Methodology, Writing – original draft. WS: Data curation, Formal analysis, Investigation, Visualization, Writing – original draft. SL: Data curation, Methodology, Project administration, Software, Writing – review & editing. XX: Data curation, Methodology, Project administration, Software, Writing – review & editing. WL: Investigation, Methodology, Software, Writing – review & editing. CL: Conceptualization, Investigation, Project administration, Writing – review & editing. FX: Conceptualization, Writing – review & editing. JL: Conceptualization, Investigation, Supervision, Writing – review & editing.
Funding
The author(s) declare that financial support was received for the research and/or publication of this article. This work was supported by the Program for Youth Innovation in Future Medicine of Chongqing Medical University (W0124), the cohort study on the establishment of a diagnostic model for sepsis in children utilizing the big data platform of the electronic medical record system at the Children's Medical Center (2021MSXM025), and the Chongqing Science and Technology Bureau and Health Commission Joint Medical Project (2025MSXM100).
Acknowledgments
The authors express their sincere gratitude to all the children who participated in this study. We particularly acknowledge the invaluable data support provided by the Children's Hospital of Chongqing Medical University. Additionally, we extend our appreciation to the Big Data Center of the Children's Hospital of Chongqing Medical University and the Statistical Help Help Platform for their expert statistical consulting services.
Conflict of interest
The authors declare that this research was conducted without any commercial or financial relationships that could be perceived as potential conflicts of interest.
Generative AI statement
The author(s) declare that no Generative AI was used in the creation of this manuscript.
Any alternative text (alt text) provided alongside figures in this article has been generated by Frontiers with the support of artificial intelligence and reasonable efforts have been made to ensure accuracy, including review by the authors wherever possible. If you identify any issues, please contact us.
Publisher's note
All claims expressed in this article are solely those of the authors and do not necessarily represent those of their affiliated organizations, or those of the publisher, the editors and the reviewers. Any product that may be evaluated in this article, or claim that may be made by its manufacturer, is not guaranteed or endorsed by the publisher.
Supplementary material
The Supplementary Material for this article can be found online at: https://www.frontiersin.org/articles/10.3389/fped.2025.1663890/full#supplementary-material
References
1. Singer M, Deutschman CS, Seymour CW, Shankar-Hari M, Annane D, Bauer M, et al. The third international consensus definitions for sepsis and septic shock (sepsis-3). JAMA. (2016) 315:801–10. doi: 10.1001/jama.2016.0287
2. Schlapbach LJ, Watson RS, Sorce LR, Argent AC, Menon K, Hall MW, et al. International consensus criteria for pediatric sepsis and septic shock. JAMA. (2024) 331:665–74. doi: 10.1001/jama.2024.0179
3. Sanchez-Pinto LN, Bennett TD, DeWitt PE, Russell S, Rebull MN, Martin B, et al. Development and validation of the phoenix criteria for pediatric sepsis and septic shock. JAMA. (2024) 331:675–86. doi: 10.1001/jama.2024.0196
4. Weiss SL, Fitzgerald JC, Pappachan J, Wheeler D, Jaramillo-Bustamante JC, Salloo A, et al. Global epidemiology of pediatric severe sepsis: the sepsis prevalence, outcomes, and therapies study. Am J Respir Crit Care Med. (2015) 191:1147–57. doi: 10.1164/rccm.201412-2323OC
5. Reddy K, Sinha P, O'Kane CM, Gordon AC, Calfee CS, McAuley DF. Subphenotypes in critical care: translation into clinical practice. Lancet Respir Med. (2020) 8:631–43. doi: 10.1016/s2213-2600(20)30124-7
6. Weiss SL, Fitzgerald JC. Pediatric sepsis diagnosis, management, and sub-phenotypes. Pediatrics. (2024) 153:1. doi: 10.1542/peds.2023-062967
7. Scicluna BP, van Vught LA, Zwinderman AH, Wiewel MA, Davenport EE, Burnham KL, et al. Classification of patients with sepsis according to blood genomic endotype: a prospective cohort study. Lancet Respir Med. (2017) 5:816–26. doi: 10.1016/s2213-2600(17)30294-1
8. Seymour CW, Kennedy JN, Wang S, Chang CH, Elliott CF, Xu Z, et al. Derivation, validation, and potential treatment implications of novel clinical phenotypes for sepsis. Jama. (2019) 321:2003–17. doi: 10.1001/jama.2019.5791
9. Zhang Z, Zhang G, Goyal H, Mo L, Hong Y. Identification of subclasses of sepsis that showed different clinical outcomes and responses to amount of fluid resuscitation: a latent profile analysis. Crit Care. (2018) 22:347. doi: 10.1186/s13054-018-2279-3
10. De Backer D, Deutschman CS, Hellman J, Myatra SN, Ostermann M, Prescott HC, et al. Surviving sepsis campaign research priorities 2023. Crit Care Med. (2024) 52:268–96. doi: 10.1097/ccm.0000000000006135
11. Meyer NJ, Prescott HC. Sepsis and septic shock. N Engl J Med. (2024) 391:2133–46. doi: 10.1056/NEJMra2403213
12. Marik PE, Raghavan M. Stress-hyperglycemia, insulin and immunomodulation in sepsis. Intensive Care Med. (2004) 30:748–56. doi: 10.1007/s00134-004-2167-y
13. Plummer MP, Deane AM. Dysglycemia and glucose control during sepsis. Clin Chest Med. (2016) 37:309–19. doi: 10.1016/j.ccm.2016.01.010
14. Srinivasan V, Lee JH, Menon K, Zimmerman JJ, Bembea MM, Agus MSD. Endocrine dysfunction criteria in critically ill children: the podium consensus conference. Pediatrics. (2022) 149:S84–s90. doi: 10.1542/peds.2021-052888M
15. Ssekitoleko R, Jacob ST, Banura P, Pinkerton R, Meya DB, Reynolds SJ, et al. Hypoglycemia at admission is associated with inhospital mortality in Ugandan patients with severe sepsis. Crit Care Med. (2011) 39:2271–6. doi: 10.1097/CCM.0b013e3182227bd2
16. Chao WC, Tseng CH, Wu CL, Shih SJ, Yi CY, Chan MC. Higher glycemic variability within the first day of icu admission is associated with increased 30-day mortality in icu patients with sepsis. Ann Intensive Care. (2020) 10:17. doi: 10.1186/s13613-020-0635-3
17. van Niekerk G, Davis T, Engelbrecht AM. Hyperglycaemia in critically ill patients: the immune system’s sweet tooth. Crit Care. (2017) 21:202. doi: 10.1186/s13054-017-1775-1
18. Weiss SL, Peters MJ, Alhazzani W, Agus MSD, Flori HR, Inwald DP, et al. Surviving sepsis campaign international guidelines for the management of septic shock and sepsis-associated organ dysfunction in children. Intensive Care Med. (2020) 46:10–67. doi: 10.1007/s00134-019-05878-6
19. Preechasuk L, Suwansaksri N, Ipichart N, Vannasaeng S, Permpikul C, Sriwijitkamol A. Hyperglycemia and glycemic variability are associated with the severity of sepsis in nondiabetic subjects. J Crit Care. (2017) 38:319–23. doi: 10.1016/j.jcrc.2016.12.005
20. Nagin DS, Jones BL, Elmer J. Recent advances in group-based trajectory modeling for clinical research. Annu Rev Clin Psychol. (2024) 20:285–305. doi: 10.1146/annurev-clinpsy-081122-012416
21. Nagin DS, Odgers CL. Group-based trajectory modeling in clinical research. Annu Rev Clin Psychol. (2010) 6:109–38. doi: 10.1146/annurev.clinpsy.121208.131413
22. Wang X, Lin S, Zhong M, Song J. The procalcitonin trajectory as an effective tool for identifying sepsis patients at high risk of mortality. Crit Care. (2024) 28:312. doi: 10.1186/s13054-024-05100-0
23. Tie X, Zhao Y, Sun T, Zhou R, Li J, Su J, et al. Associations between serum albumin level trajectories and clinical outcomes in sepsis patients in icu: insights from longitudinal group trajectory modeling. Front Nutr. (2024) 11:1433544. doi: 10.3389/fnut.2024.1433544
24. Wang MP, Jiang L, Zhu B, Du B, Li W, He Y, et al. Association of fluid balance trajectories with clinical outcomes in patients with septic shock: a prospective multicenter cohort study. Mil Med Res. (2021) 8:40. doi: 10.1186/s40779-021-00328-1
25. Bhavani SV, Carey KA, Gilbert ER, Afshar M, Verhoef PA, Churpek MM. Identifying novel sepsis subphenotypes using temperature trajectories. Am J Respir Crit Care Med. (2019) 200:327–35. doi: 10.1164/rccm.201806-1197OC
26. Bhavani SV, Wolfe KS, Hrusch CL, Greenberg JA, Krishack PA, Lin J, et al. Temperature trajectory subphenotypes correlate with immune responses in patients with sepsis. Crit Care Med. (2020) 48:1645–53. doi: 10.1097/ccm.0000000000004610
27. Honarmand K, Sirimaturos M, Hirshberg EL, Bircher NG, Agus MSD, Carpenter DL, et al. Society of critical care medicine guidelines on glycemic control for critically ill children and adults 2024. Crit Care Med. (2024) 52:e161–e81. doi: 10.1097/ccm.0000000000006174
28. Jeschke MG, Kraft R, Emdad F, Kulp GA, Williams FN, Herndon DN. Glucose control in severely thermally injured pediatric patients: what glucose range should be the target? Ann Surg. (2010) 252:521–7. discussion 7-8. doi: 10.1097/SLA.0b013e3181f2774c
29. Rivas AM, Nugent K. Hyperglycemia, insulin, and insulin resistance in sepsis. Am J Med Sci. (2021) 361:297–302. doi: 10.1016/j.amjms.2020.11.007
30. Kyle UG, Coss Bu JA, Kennedy CE, Jefferson LS. Organ dysfunction is associated with hyperglycemia in critically ill children. Intensive Care Med. (2010) 36:312–20. doi: 10.1007/s00134-009-1703-1
31. Wang W, Chen W, Liu Y, Li L, Li S, Tan J, et al. Blood glucose levels and mortality in patients with sepsis: dose-response analysis of observational studies. J Intensive Care Med. (2021) 36:182–90. doi: 10.1177/0885066619889322
32. Torres LK, Pickkers P, van der Poll T. Sepsis-induced immunosuppression. Annu Rev Physiol. (2022) 84:157–81. doi: 10.1146/annurev-physiol-061121-040214
33. de Souza Galia WB, Biazi GR, Frasson-Uemura IG, Miksza DR, Zaia C, Zaia DAM, et al. Gluconeogenesis is reduced from alanine, lactate and pyruvate, but maintained from glycerol, in liver perfusion of rats with early and late sepsis. Cell Biochem Funct. (2021) 39:754–62. doi: 10.1002/cbf.3637
34. Sasaki S, Masaki N, Yashiro H, Kudo M, Kimura K, Takebe K. Degradation of insulin in perfused liver and skeletal muscle and insulin secretion in perfused pancreas of liver injury rat. Horm Metab Res. (1981) 13:561–4. doi: 10.1055/s-2007-1019335
35. Tripodi A, Mannucci PM. The coagulopathy of chronic liver disease. N Engl J Med. (2011) 365:147–56. doi: 10.1056/NEJMra1011170
36. Eleftheriadis T, Pissas G, Tsogka K, Nikolaou E, Liakopoulos V, Stefanidis I. A unifying model of glucotoxicity in human renal proximal tubular epithelial cells and the effect of the sglt2 inhibitor dapagliflozin. Int Urol Nephrol. (2020) 52:1179–89. doi: 10.1007/s11255-020-02481-3
37. Freire Jorge P, Wieringa N, de Felice E, van der Horst ICC, Oude Lansink A, Nijsten MW. The association of early combined lactate and glucose levels with subsequent renal and liver dysfunction and hospital mortality in critically ill patients. Crit Care. (2017) 21:218. doi: 10.1186/s13054-017-1785-z
38. Yang K, Fan M, Wang X, Xu J, Wang Y, Tu F, et al. Lactate promotes macrophage hmgb1 lactylation, acetylation, and exosomal release in polymicrobial sepsis. Cell Death Differ. (2022) 29:133–46. doi: 10.1038/s41418-021-00841-9
39. Ingels C, Vanhorebeek I, Van den Berghe G. Glucose homeostasis, nutrition and infections during critical illness. Clin Microbiol Infect. (2018) 24:10–5. doi: 10.1016/j.cmi.2016.12.033
40. Pei F, Yao RQ, Ren C, Bahrami S, Billiar TR, Chaudry IH, et al. Expert consensus on the monitoring and treatment of sepsis-induced immunosuppression. Mil Med Res. (2022) 9:74. doi: 10.1186/s40779-022-00430-y
41. Agus MS, Wypij D, Hirshberg EL, Srinivasan V, Faustino EV, Luckett PM, et al. Tight glycemic control in critically ill children. N Engl J Med. (2017) 376:729–41. doi: 10.1056/NEJMoa1612348
42. Chen L, Li T, Fang F, Zhang Y, Faramand A. Tight glycemic control in critically ill pediatric patients: a systematic review and meta-analysis. Crit Care. (2018) 22:57. doi: 10.1186/s13054-018-1976-2
43. Hon KL, Leung KKY, Oberender F, Leung AK. Paediatrics: how to manage septic shock. Drugs Context. (2021) 10:1–5. doi: 10.7573/dic.2021-1-5
44. El-Sherbini SA, Marzouk H, El-Sayed R, Hosam-ElDin S. Etiology of hyperglycemia in critically ill children and the impact of organ dysfunction. Rev Bras Ter Intensiva. (2018) 30:286–93. doi: 10.5935/0103-507x.20180051
Keywords: sepsis, pediatric, group-based trajectory modeling, longitudinal bloodglucose, phenotype
Citation: Wang Y, Song W, Li S, Xu X, Liu W, Liu C, Xu F and Li J (2025) Identification of novel phenotypes in pediatric sepsis based on blood glucose trajectories. Front. Pediatr. 13:1663890. doi: 10.3389/fped.2025.1663890
Received: 11 July 2025; Accepted: 22 October 2025;
Published: 7 November 2025.
Edited by:
Ryan J. Stark, Vanderbilt University Medical Center, United StatesReviewed by:
Wanhong Yin, Sichuan University, ChinaYongfu Song, The Affiliated Hospital to Changchun University of Chinese Medicine, China
Copyright: © 2025 Wang, Song, Li, Xu, Liu, Liu, Xu and Li. This is an open-access article distributed under the terms of the Creative Commons Attribution License (CC BY). The use, distribution or reproduction in other forums is permitted, provided the original author(s) and the copyright owner(s) are credited and that the original publication in this journal is cited, in accordance with accepted academic practice. No use, distribution or reproduction is permitted which does not comply with these terms.
*Correspondence: Jing Li, bGlqaW5nd2FuZ3lpQDEyNi5jb20=