 Yueying Chen1
 Jun Shen
- 1Division of Gastroenterology and Hepatology, Key Laboratory of Gastroenterology and Hepatology, Ministry of Health, Inflammatory Bowel Disease Research Center, Renji Hospital, School of Medicine, Shanghai Jiao Tong University, Shanghai Institute of Digestive Disease, Shanghai, China
- 2Department of Radiology, Renji Hospital, School of Medicine, Shanghai Jiao Tong University, Shanghai, China
Background: The primary non-response (PNR) rate of infliximab (IFX) varies from 20 to 46% for the treatment of Crohn’s disease (CD). Detected PNR reduces the improper use of specific treatments. To date, there is hardly any knowledge regarding early markers of PNR. The aim of this study was to evaluate the role of Interleukin-6 (IL-6) as an early predictor of PNR of IFX for the treatment of CD.
Methods: We enrolled 322 bio-naïve patients diagnosed with CD from January 2016 to May 2020. Primary response was determined at week 14. Multivariable logistic regression was used to construct prediction models. Area under the curve (AUC), calibration and decision curve analyses (DCA) were assessed in the validation cohort. GEO data were analyzed to identify potential mechanisms of IL-6 in IFX therapy for CD.
Results: PNR occurred in 31.06% (100 of 322) patients who were assessable at week 14. IL-6 levels significantly decreased after IFX therapy (p < 0.001). The validation model containing IL-6 presented enhanced discrimination with an AUC of 0.908 and high calibration. Decision curve analysis (DCA) indicated that the model added extra predictive value. GEO data confirmed the IL-6 levels were increased in the PNR group and IL-6-related differentially expressed genes (DEGs) were enriched in the inflammatory response.
Conclusions: We concluded that IL-6 may be used as a predictive factor to assess the risk of PNR to IFX therapy.
Introduction
Crohn’s disease (CD) is a chronic inflammatory disease with a relapsing history. The incidence and prevalence of CD have both increased worldwide and this disease has gradually become a more severe socioeconomic burden (Ng et al., 2013). Recently, the treatment of CD entered a new era. Anti-tumor necrosis factor (anti-TNF) therapy has been the first-line therapy for treating CD according to ECCO guidelines (Torres et al., 2020). Infliximab (IFX) is the most widely used anti-TNF agent that promotes mucosal healing and changes the natural history of the disease (Singh et al., 2018). However, there are still 20–46% of CD patients that show primary non-response (PNR) to IFX (Roda et al., 2016; Yokoyama et al., 2016). Leapfrogging IFX in PNR patients to other medications such as anti-IL-12/23 monoclonal antibodies or anti-leucocyte adhesion molecules avoid ineffective processes of IFX and saves medical resources. Therefore, developing a model to predict PNR to IFX in CD patients will help doctors make better decisions for CD patients.
Previous studies have proposed several factors to predict the efficacy of IFX in CD, including age, BMI, previous surgery history (Billiet et al., 2015), disease behavior (Sprakes et al., 2012), disease duration (Matsuoka et al., 2018), and pro-inflammatory biomarkers (Billiet et al., 2017). Despite evidence, a clinical prediction model is still lacking to assess the possibility of PNR prior to IFX administration based on clinical and biochemical markers. As a chronic inflammatory disease, the regulation of cytokines is associated with the pathogenesis and progression of CD (Chen and Sundrud, 2016). IL-6 is a proinflammatory factor that can exacerbate inflammation by promoting the survival of T cells and the secretion of other cytokines (Hunter and Jones, 2015). IL-6 levels were shown to be elevated in CD patients compared to healthy individuals (Engel et al., 2015). A randomized trial showed that an anti-IL-6 antibody promoted a clinical response and clinical remission in CD patients (Danese et al., 2019). Furthermore, IL-6 served as a predictor of PNR to anti-TNF treatment in CD and patients failing anti-TNF therapy showed increased expression of IL-6 and persistent IL-6 pathway activity (Leal et al., 2015; Soendergaard et al., 2018). A prospective, multicenter study confirmed the predictive roles of IL-6 in patients treated with anti-TNF therapy (Bertani et al., 2020a). Additionally, the single nucleotide polymorphisms of IL-6 may be a promising tool for identifying CD patient response to IFX therapy (Salvador-Martín et al., 2019).
To promote individualized treatment in CD patients, it is crucial to identify predictors to estimate PNR to IFX. Different IL-6 levels present before treatment may contribute to the contrasting response to IFX therapy. Detecting PNR reduces inaccurate treatments while a predictive model determining PNR to IFX in bio-naive CD is lacking. Therefore, we aimed to identify the predictive value of IL-6 in IFX therapy and to construct a model predicting PNR in bio-naive CD patients based on clinical information and IL-6 levels.
Methods
Patients and Samples
A retrospective and single-center study was performed for CD cases in the Division of Gastroenterology and Hepatology, Renji hospital. Patients enrolled in this study from January 2016 to June 2019 and from July 2019 to May 2020 were assigned to the training and the validation cohorts, respectively. CD was diagnosed based on the ECCO consensus (Maaser et al., 2019). Bio-naïve patients were included and induced with 5 mg/kg of IFX (Janssen Pharmaceutical Ltd, United States). Baseline characteristics were collected prior to treatment.
Levels of biochemical indicators, including IL-6, albumin, hemoglobin, platelets, erythrocyte sedimentation rate (ESR) and CRP were obtained from previous blood analysis, and blood samples were collected for each participant before and after IFX therapy. The Westergren method and nephelometry were used to measure CRP and ESR levels. Enzyme Linked Immunosorbent Assay (ELISA) was used to detect IL-6 levels using a DPC IMMULITE 1000 system of Siemens, and the average CV value about 8.33%. The Clinical Laboratory Department (Renji Hospital, School of Medicine, Shanghai Jiao Tong University, China) performed an analysis of each sample in duplicate. This study was approved by the IRB of Shanghai Jiaotong University School of Medicine, Renji Hospital Ethics Committee (KY2020–115).
Outcomes and Definitions
Our study defined the primary outcome as the proportion of response to IFX, which was determined when achieving clinical response or remission at week 14 (after three IFX injections and before the fourth) using an MDT (multi-disciplinary team) of experienced experts combined with endoscopic and radiological examinations (Hanauer et al., 2002; Wong and Cross, 2017). PNR was defined as: 1) failure to achieve clinical response or clinical remission, clinical response and clinical remission have been defined as a decrease in Harvey Bradshaw indices (HBI) ≥ 2, and total HBI ≤ 4, respectively (Sprakes et al., 2012). 2) need for treatment modification (discontinuation, escalation or surgery) (Roda et al., 2016; Bar-Yoseph et al., 2018; Beltrán et al., 2019).
Statistical Analysis
Results for continuous variables were represented as mean (SDs) or median (interquartile ranges [IQRs]). Categorical variables were shown as proportions. Univariate logistic regression was applied to analyze the relationships between different factors and PNR to IFX therapy. A Chi-square test was used to compare categorical variables. The t test or Mann-Whitney U test were used to compare continuous variables.
Multivariable regression models with forward stepwise likelihood ratio algorithms were used to develop models predicting the response to infliximab 5 mg/kg through 14 weeks. Akaike information criterion (AIC) was performed to assessed the goodness of fit of two models. Discrimination of the prediction models was evaluated by receiver operating characteristics (ROC) analysis and presented as area under the curve (AUC). Odds ratios (OR) having 95% confidence intervals (CI) of final predictors were calculated. Calibration curves were used to assess the calibration of nomograms by comparing the predicted and observed probabilities. The clinical effectiveness of the models was assessed using decision curve analysis (DCA). Integrated Discrimination Improvement (IDI) was a reclassification measures showed the difference in discrimination slopes of two models, and was used to assess the improvement of risk differences between cases and non-cases (Pencina et al., 2008; Steyerberg et al., 2010; Kerr et al., 2011). All statistical analyses were performed using SPSS 25.0 and R 3.6.3 with a statistical significance of p < 0.05.
Bioinformatic Analysis
Data Source
A gene expression microarray dataset (GSE111761) of Schmitt’s study from the GEO database was selected (Schmitt et al., 2019). GSE111761 contained three samples from anti-TNF non-responders and three from responders. The patients were diagnosed as CD and defined as responders or non-responders when they had ongoing anti-TNF therapy for over 3 months. The GSE111761 dataset was available on the GPL13497 platform (Agilent-026652 Whole Human Genome Microarray 4 × 44K v2).
Identification of Differentially Expressed Genes (DEGs)
R software (version 3.6.3) and the limma package in Bioconductor were used to detect DEGs in GSE111761 (Ritchie et al., 2015). DEGs were identified using selection criteria of an adjusted p value < 0.05 and |logFC|>1.0.
Enrichment Analysis
Gene Set Enrichment Analysis (GSEA) was performed using the ClusterProfile package in Bioconductor with a statistical significance of p < 0.05 (Yu et al., 2012).
Protein-Protein Interaction (PPI) Network Construction
PPI network reveals the specific and unspecific interactions of proteins, and promotes to identify therapeutic target (Petta et al., 2016; Maurel et al., 2019). STRING (version 11.0), a freely accessible database that collects, scores and integrates data, was used to predict functional relationships between proteins (Szklarczyk et al., 2019). A PPI network of genes with a score > 0.4 in STRING was constructed using Cytoscape software (version 3.7.2) (Smoot et al., 2011). The degree of protein nodes was calculated using the Cytoscape plugin CytoHubba to identify hub genes (Chin et al., 2014). Hub genes were selected with a score ≥ 4.5 based on the EPC algorithm.
Construction of Regulatory Network
The network of genes and their corresponding miRNAs and lncRNAs was constructed using starbase, a publicly available database mainly focusing on miRNA-target interactions (Li et al., 2014). Transcription factors (TFs) were downloaded from TRRUST (http://www.grnpedia.org/trrust/), a public database for predicting TFs of various genes through DNA sequences (Farre et al., 2003). These tools were combined to construct a multi-factor regulation network.
Results
Baseline Characteristics and Univariate Analyses
From a total of 322 active CD patients receiving 5 mg/kg IFX induction therapy, 223 and 99 were assigned to training and validation groups, respectively (Figure 1). Disease behavior was merged into two categories, including nonstricturing and nonpenetrating (B1) into one category, and stricturing and/or penetrating (B2/B3) subtypes into another category. The baseline characteristics are shown in Supplementary Table S1. The incidence of PNR in the training cohort was 30.0% (n = 67), while the incidence in the validation cohort was 33.3% (n = 33). Baseline characteristics of patients were similar between the two cohorts. Univariate regressions showed that BMI (p < 0.001), disease behavior (p < 0.001), CRP levels (p = 0.001), and IL-6 levels before IFX therapy (p = 0.002) were strongly associated with PNR to IFX treatment (Supplementary Table S2).
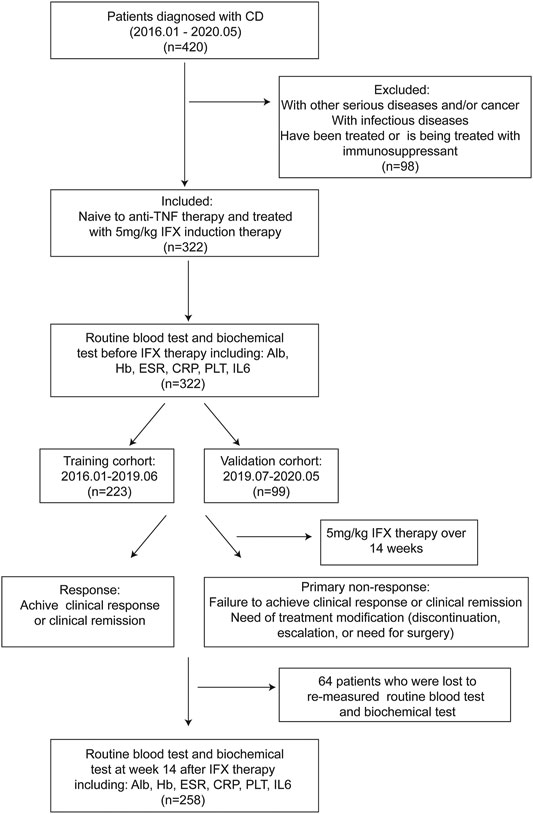
FIGURE 1. Flow diagram of the study design.
IL-6 levels were measured in 258 of the studied 322 patients before initiation and at week 14 before the fourth IFX injection. IL-6 levels were found to significantly decrease after IFX therapy (p < 0.001) and were obviously different between PNR and response groups (p = 0.001) (Supplementary Figure S1).
Development of Prediction Models and Nomogram Construction
Results of multiple logistic regression suggested BMI, disease behavior, CRP levels and IL-6 levels before IFX therapy were determined as predicting factors. To identify the true predictive effects of IL-6, we built a model contained IL-6 and the other one did not. The diagnostic equations of models were: logitP = 1.162–0.217* BMI +1.281 * behavior +0.025 * CRP, and logitP = 0.144–0.212* BMI +1.252 * behavior +0.024 * CRP +0.237* IL-6, respectively. The results of multivariate regression analyses are shown in Table 1. These two models are presented as nomograms, which containing these independent predictors to calculate the risk of PNR based on the total points (Figure 2).
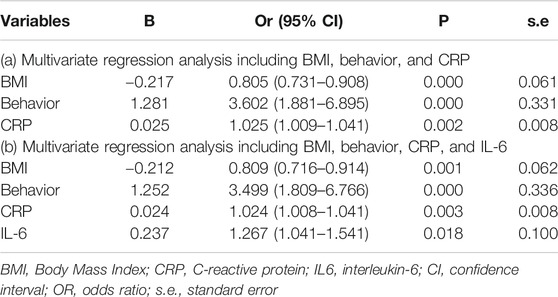
TABLE 1. Multivariate regression analyses of the model 1 and model 2.
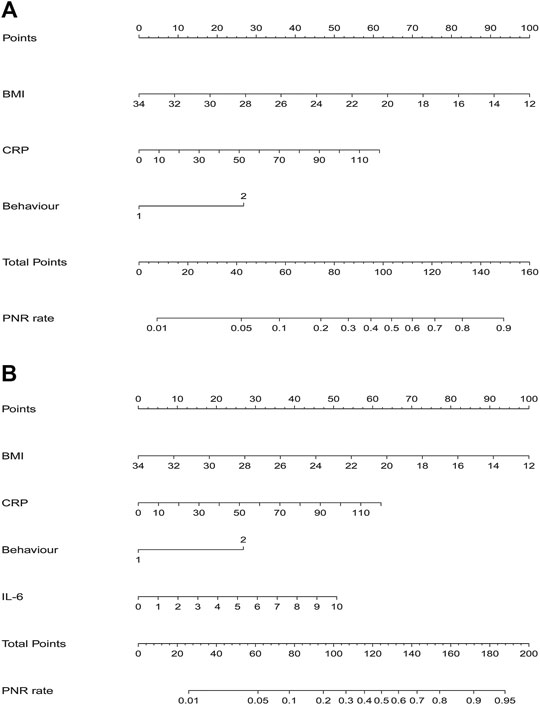
FIGURE 2. Nomograms for model 1 and model 2 were developed in the training cohort (A) Nomogram one for model 1, with BMI, behavior, and CRP. BMI, Body Mass Index; CRP, C-reactive protein (B) Nomogram two for model 2, with BMI, behavior, CRP, and IL6. IL6, interleukin-6.
Validation of Prediction Models
Efficacies of the two models were compared to the validation cohort. AIC was 111.3 and 99.1 of model1 and model2, respectively. ROC analysis indicated and the AUC of BMI, behavior, CRP, and IL-6 were 0.652 (95% CI: 0.540–0.764), 0.674 (95% CI: 0.563–0.785), 0.744 (95% CI: 0.646–0.842), and 0.787 (95% CI: 0.698–0.877) respectively. An AUC of 0.813 (95% CI: 0.729–0.897) in model 1 and 0.908 (95% CI: 0.851–0.966) in model 2 (Figure 3). The p value = 0.005 of DeLong’s test showed that an AUC of model 2 was significantly better than model 1. Calibration plots showed that the average differences (E aver) were 2.5 and 1.8% in model 1 and 2, and no significant differences (P1 = 0.844, P2 = 0.947) between the predicted and the calibrated probabilities. DCA showed that if the risk thresholds were between 12 and 85%, model 2 added more clinical net benefit compared to model 1. To explore additional benefits conferred by IL-6 levels, we compared IDI between models and found this improvement index was improved upon addition of IL-6 (IDI = 19%; 95% CI, 0.10–0.28; p < 0.000).
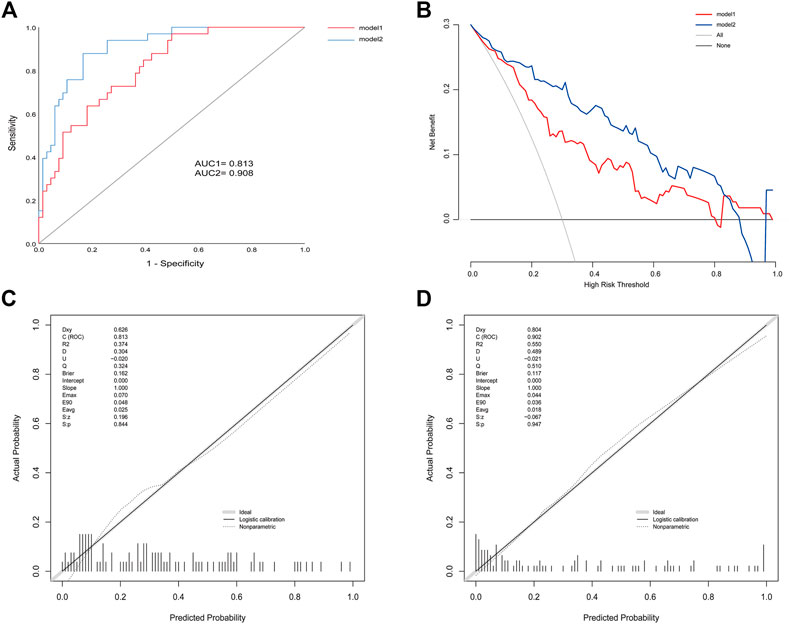
FIGURE 3. (A) ROC for model 1 and model 2 in the validation cohort (B) Calibration plots for model 1 (C) Calibration plots for model 2 (D) DCA for model 1 and model 2 in the validation cohort.
Identification of Pathway and Regulatory Network of IL-6
To identify potential pathways and regulatory network of IL-6 in IFX therapy of CD, the GSE111761 dataset contained lamina propria mononuclear cells from three anti-TNF non-responders and three responders were included to identify DEGs. The samples were obtained from the patients with anti-TNF therapy for over 3 months and the Simple Endoscopic Score for Crohn’s disease (SES-CD) <5. There were 2,228 DEGs including 1,384 upregulated genes and 844 downregulated genes and IL-6 expression levels were significantly elevated in PNR patients (Supplementary Figure S2). Spearman correlation was performed to investigate the connections between IL-6 and other DEGs. Genes with a p < 0.05 were selected for GSEA. Results indicated that IL-6 and relative genes were mainly involved in inflammatory response (Figure 4; Supplementary Table S3). We selected IL-6 related genes with the top 50 highest correlation coefficients to create PPIs, and identified five hub genes, including IL-6, IGF2, C5AR1, IFNLR1 and OSM with score ≥ 4.5 based on the EPC algorithm (Figure 5). We found that the expression of Oncostatin M (OSM) coordinated with IL-6 and also belonged to the inflammatory response in GSEA. To identify potential biological mechanisms between IL-6 and OSM, we found a total of 10 miRNAs, 25 lncRNAs, and 1 TF shared in common with both IL-6 and OSM. Data of these two genes and their miRNAs, lncRNAs and TF were integrated into a regulatory network (Figure 6). It was suggested that IL-6 and OSM may be involved in the inflammatory response through a regulation network based on common lncRNAs, miRNAs and TF.
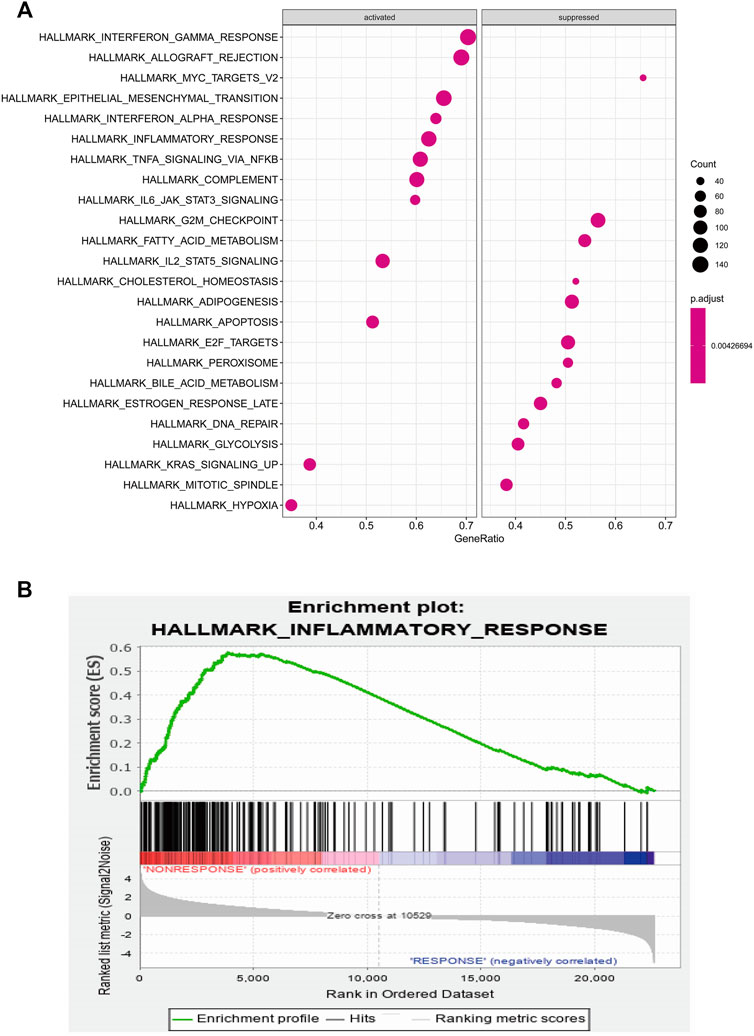
FIGURE 4. (A) GSEA analysis of IL-6 and IL-6 related genes (B) Inflammatory response of GSEA analysis.
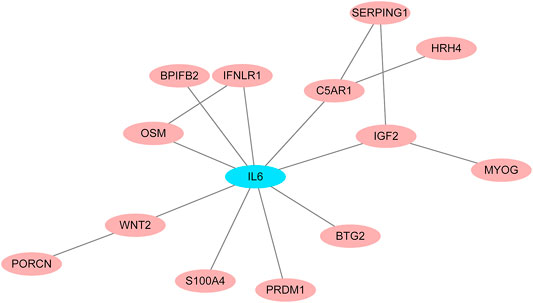
FIGURE 5. PPI networks for IL-6 and IL-6 related genes with the top 50 highest correlation coefficients.
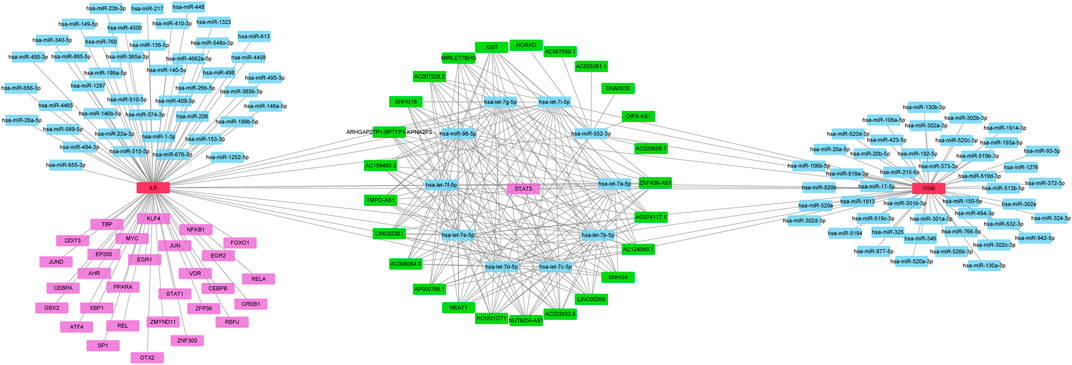
FIGURE 6. Multi-factor regulation network for IL-6 and OSM.
Discussion
Even though anti-TNF agents have shown to be effective in inducing clinical response and mucosal healing, there are still a considerable proportion of patients who do not respond (Ding et al., 2016). Previous studies have identified several predictors of PNR to IFX in CD, such as BMI, fecal calprotectin (Pavlidis et al., 2016), proinflammatory biomarkers (Billiet et al., 2017), and genetic markers (Barber et al., 2016). These studies have also established prediction models based on these factors. IL-6 is a proinflammatory cytokine and expression levels alter after IFX therapy. It is considered a good predictor of IFX response (Suzuki et al., 2015; Salvador-Martín et al., 2019). However, there are few prediction models for PNR to IFX treatment in CD. In this study, we showed that IL-6 levels before IFX therapy predicted the response to IFX treatment and alter after IFX therapy.
This retrospective study included 322 CD patients who were naive to anti-TNF therapy and both their clinical and serological data were collected. Logarithmic transformation was performed for IL-6 levels to decrease the undulation of data. Consistent with previous reports, IL-6 levels were significantly reduced after 14 weeks of IFX therapy. Univariate and multivariate regression analyses found that BMI, disease behavior, CRP and IL-6 levels before IFX therapy independently predicted the response to IFX treatment. To explore the predictive ability of IL-6, we established two prediction models, one containing BMI, disease behavior and CRP levels, and the other including BMI, disease behavior, CRP levels, and IL-6 levels. Results of AIC and ROC in the validation cohort, indicated that the goodness of fit and discrimination of model containing IL-6 was better than the model not including IL-6. And the AUC of the model incorporating IL-6 was higher than that in single factors, including BMI, disease behavior and CRP levels. The calibration curve and DCA curve demonstrated a greater consistency and clinical validity in the model containing IL-6. IDI analysis showed that incorporation of IL-6 with BMI, behavior, and CRP significantly improved the discriminatory accuracy for PNR with IDI of 19% (p < 0.000). Furthermore, the improvement of IDI for discriminating PNR to IFX therapy is consistent with previous studies, such as Leal et al. (Leal et al., 2015), which revealed the predictive effect of IL-6 on risk of PNR to anti-TNF therapy in CD patients. Therefore, we suggested that IL-6 played a central role in assessing the possibility of PNR to IFX therapy.
Furthermore, we analyzed GEO data to verify the predictive power of IL-6. It was found that expression of IL-6 significantly increased in non-responders compared with responders to IFX therapy. GSEA of IL-6 and its relative genes with high correlation coefficients showed that these genes mainly were enriched in the inflammatory response. Through the construction of PPI networks, we found that OSM directly connected to IL-6 and its expression was consistent with IL-6 in the inflammatory response. OSM regulates the production of proinflammatory cytokines such as IL-6 through the JAK-STAT pathway (Hermanns, 2015). Studies demonstrated that OSM induced intestinal inflammation, while mechanisms remained unclear (Thomas, 2017). Furthermore, OSM has been considered a novel biomarker to predict the efficacy of anti-TNF therapy. One study showed that OSM was enriched in CD mucosa and complete mucosal healing was more likely to occur in patients with low OSM expression levels. Notably, the expression of OSM was strongly correlated with PNR to IFX (West et al., 2017). Another clinical study suggested that OSM was an appreciable biomarker in predicting the possibility of mucosal healing compared with fecal calprotectin, which indicated OSM may be a predictive indicator for IFX therapy (Bertani et al., 2020b). To explore the common mechanisms of IL-6 and OSM in IFX treatment, we found that they both shared 10 miRNAs, 25 lncRNAs and 1 TF, which provides potential targets and pathways research diving into deeper mechanistic studies.
Although this study developed a new prediction model based on clinical and serological data, it faced several limitations. First, as a retrospective study, we defined PNR through chart review rather than prospectively collected disease activity indices. To ensure homogeneousness of the study, all CD patients were evaluated by the same physician group over the duration of IFX treatment. Second, IL-6 levels were detected in peripheral blood rather than mucosal tissue. As a result, findings represented the state of the peripheral immune system instead of the inflamed mucosa. Furthermore, external validation is required to confirm the validity of these results in clinical practice.
Conclusion
This study found IL-6 levels altered after IFX therapy and added IL-6 to enhance the predictive value of PNR to IFX therapy in CD bio-naïve patients. A novel prediction model was developed, including IL-6 levels combined with BMI, disease behavior and CRP levels. With this model, clinicians can estimate the risk of PNR to IFX therapy and select the optimal treatment for individual patients. Furthermore, this study also constructed a multi-factor regulation network of IL-6 and its relative gene OSM, providing stronger direction for exploring the predictive and therapeutic targets of IFX treatment in CD. Further investigation is needed to determine the association between IL-6 from either peripheral or inflamed mucosal and anti-TNF treatment responses.
Data Availability Statement
The raw data supporting the conclusions of this article will be made available by the authors, without undue reservation.
Ethics Statement
This study was approved by the IRB of Shanghai Jiaotong University School of Medicine, Renji Hospital Ethics Committee (KY2020-115).
Author Contributions
YC and HL, collected the papers and analyzed data, analyzed the conclusions, drafted the manuscript; QF reviewed the data and conclusions; JS presented the idea of this paper, supported the funding, analyzed the conclusions, drafted and revised the manuscript.
Funding
Supported by grants from National Natural Science Foundation of China (Grant No. 81770545, and 81701746) and MDT Project of Clinical Research Innovation Foundation, Renji Hospital, School of Medicine, Shanghai Jiaotong University (Grant No. PYI-17-003).
Conflict of Interest
The authors declare that the research was conducted in the absence of any commercial or financial relationships that could be construed as a potential conflict of interest.
Supplementary Material
The Supplementary Material for this article can be found online at: https://www.frontiersin.org/articles/10.3389/fphar.2021.654985/full#supplementary-material.
References
Bar-Yoseph, H., Levhar, N., Selinger, L., Manor, U., Yavzori, M., Picard, O., et al. (2018). Early drug and anti-infliximab antibody levels for prediction of primary nonresponse to infliximab therapy. Aliment. Pharmacol. Ther. 47 (2), 212–218. doi:10.1111/apt.14410
Barber, G. E., Yajnik, V., Khalili, H., Giallourakis, C., Garber, J., Xavier, R., et al. (2016). Genetic markers predict primary non-response and durable response to anti-TNF biologic therapies in crohn's disease. Am. J. Gastroenterol. 111 (12), 1816–1822. doi:10.1038/ajg.2016.408
Beltrán, B., Iborra, M., Sáez-González, E., Marqués-Miñana, M. R., Moret, I., Cerrillo, E., et al. (2019). Fecal calprotectin pretreatment and induction infliximab levels for prediction of primary nonresponse to infliximab therapy in crohn's disease. Dig. Dis. 37 (2), 108–115. doi:10.1159/000492626
Bertani, L., Caviglia, G. P., Antonioli, L., Pellicano, R., Fagoonee, S., Astegiano, M., et al. (2020a). Serum interleukin-6 and -8 as predictors of response to vedolizumab in inflammatory bowel diseases. J. Clin. Med. 9 (5). doi:10.3390/jcm9051323
Bertani, L., Fornai, M., Fornili, M., Antonioli, L., Benvenuti, L., Tapete, G., et al. (2020b). Serum oncostatin M at baseline predicts mucosal healing in Crohn's disease patients treated with infliximab. Aliment. Pharmacol. Ther. 52 (2), 284–291. doi:10.1111/apt.15870
Billiet, T., Cleynen, I., Ballet, V., Claes, K., Princen, F., Singh, S., et al. (2017). Evolution of cytokines and inflammatory biomarkers during infliximab induction therapy and the impact of inflammatory burden on primary response in patients with Crohn's disease. Scand. J. Gastroenterol. 52 (10), 1086–1092. doi:10.1080/00365521.2017.1339825
Billiet, T., Papamichael, K., de Bruyn, M., Verstockt, B., Cleynen, I., Princen, F., et al. (2015). A matrix-based model predicts primary response to infliximab in crohn’s disease. Eccojc 9 (12), 1120–1126. doi:10.1093/ecco-jcc/jjv156
Chen, M. L., and Sundrud, M. S. (2016). Cytokine networks and T-cell subsets in inflammatory bowel diseases. Inflamm. Bowel Dis. 22 (5), 1157–1167. doi:10.1097/mib.0000000000000714
Chin, C.-H., Chen, S.-H., Wu, H.-H., Ho, C.-W., Ko, M.-T., and Lin, C.-Y. (2014). cytoHubba: identifying hub objects and sub-networks from complex interactome. BMC Syst. Biol. 8 (Suppl. 4), S11. doi:10.1186/1752-0509-8-s4-s11
Danese, S., Vermeire, S., Hellstern, P., Panaccione, R., Rogler, G., Fraser, G., et al. (2019). Randomised trial and open-label extension study of an anti-interleukin-6 antibody in Crohn's disease (ANDANTE I and II). Gut 68 (1), 40–48. doi:10.1136/gutjnl-2017-314562
Ding, N. S., Hart, A., and De Cruz, P. (2016). Systematic review: predicting and optimising response to anti-TNF therapy in Crohn's disease - algorithm for practical management. Aliment. Pharmacol. Ther. 43 (1), 30–51. doi:10.1111/apt.13445
Engel, T., Ben-Horin, S., and Beer-Gabel, M. (2015). Autonomic dysfunction correlates with clinical and inflammatory activity in patients with crohn's disease. Inflamm. Bowel Dis. 21 (10), 2320–2326. doi:10.1097/MIB.0000000000000508
Farre, D., Roset, R., Huerta, M., Adsuara, J. E., Rosello, L., Alba, M. M., et al. (2003). Identification of patterns in biological sequences at the ALGGEN server: PROMO and MALGEN. Nucleic Acids Res. 31 (13), 3651–3653. doi:10.1093/nar/gkg605
Hanauer, S. B., Feagan, B. G., Lichtenstein, G. R., Mayer, L. F., Schreiber, S., Colombel, J. F., et al. (2002). Maintenance infliximab for Crohn's disease: the ACCENT I randomised trial. The Lancet 359 (9317), 1541–1549. doi:10.1016/s0140-6736(02)08512-4
Hermanns, H. M. (2015). Oncostatin M and interleukin-31: cytokines, receptors, signal transduction and physiology. Cytokine Growth Factor. Rev. 26 (5), 545–558. doi:10.1016/j.cytogfr.2015.07.006
Hunter, C. A., and Jones, S. A. (2015). IL-6 as a keystone cytokine in health and disease. Nat. Immunol. 16 (5), 448–457. doi:10.1038/ni.3153
Kerr, K. F., McClelland, R. L., Brown, E. R., and Lumley, T. (2011). Evaluating the incremental value of new biomarkers with integrated discrimination improvement. Am. J. Epidemiol. 174 (3), 364–374. doi:10.1093/aje/kwr086
Leal, R. F., Planell, N., Kajekar, R., Lozano, J. J., Ordás, I., Dotti, I., et al. (2015). Identification of inflammatory mediators in patients with Crohn's disease unresponsive to anti-TNFα therapy. Gut 64 (2), 233–242. doi:10.1136/gutjnl-2013-306518
Li, J.-H., Liu, S., Zhou, H., Qu, L.-H., and Yang, J.-H. (2014). starBase v2.0: decoding miRNA-ceRNA, miRNA-ncRNA and protein-RNA interaction networks from large-scale CLIP-Seq data. Nucl. Acids Res. 42, D92–D97. doi:10.1093/nar/gkt1248
Maaser, C., Sturm, A., Vavricka, S. R., Kucharzik, T., Fiorino, G., Annese, V., et al. (2019). ECCO-ESGAR Guideline for Diagnostic Assessment in IBD Part 1: initial diagnosis, monitoring of known IBD, detection of complications. J. Crohn's colitis 13 (2), 144–164K. doi:10.1093/ecco-jcc/jjy113
Matsuoka, K., Hamada, S., Shimizu, M., Nanki, K., Mizuno, S., Kiyohara, H., et al. (2018). Factors predicting the therapeutic response to infliximab during maintenance therapy in Japanese patients with Crohn's disease. PloS one 13 (10), e0204632. doi:10.1371/journal.pone.0204632
Maurel, M., Obacz, J., Avril, T., Ding, Y. P., Papadodima, O., Treton, X., et al. (2019). Control of anterior GRadient 2 (AGR2) dimerization links endoplasmic reticulum proteostasis to inflammation. EMBO Mol. Med. 11 (6). doi:10.15252/emmm.201810120
Ng, S. C., Tang, W., Ching, J. Y., Wong, M., Chow, C. M., Hui, A. J., et al. (2013). Incidence and phenotype of inflammatory bowel disease based on results from the Asia-pacific Crohn's and colitis epidemiology study. Gastroenterology 145 (1), 158–165. doi:10.1053/j.gastro.2013.04.007
Pavlidis, P., Gulati, S., Dubois, P., Chung-Faye, G., Sherwood, R., Bjarnason, I., et al. (2016). Early change in faecal calprotectin predicts primary non-response to anti-TNFα therapy in Crohn's disease. Scand. J. Gastroenterol. 51 (12), 1447–1452. doi:10.1080/00365521.2016.1205128
Pencina, M. J., D' Agostino, R. B., D' Agostino, , Vasan, R. S., and Vasan, R. S. (2008). Evaluating the added predictive ability of a new marker: from area under the ROC curve to reclassification and beyond. Statist. Med. 27 (2), 157–172. discussion 207-12. doi:10.1002/sim.2929
Petta, I., Lievens, S., Libert, C., Tavernier, J., and De Bosscher, K. (2016). Modulation of protein-protein interactions for the development of novel therapeutics. Mol. Ther. 24 (4), 707–718. doi:10.1038/mt.2015.214
Ritchie, M. E., Phipson, B., Wu, D., Hu, Y., Law, C. W., Shi, W., et al. (2015). Limma powers differential expression analyses for RNA-sequencing and microarray studies. Nucleic Acids Res. 43 (7), e47. doi:10.1093/nar/gkv007
Roda, G., Jharap, B., Neeraj, N., and Colombel, J.-F. (2016). Loss of response to anti-TNFs: definition, epidemiology, and management. Clin. translational Gastroenterol. 7, e135. doi:10.1038/ctg.2015.63
Salvador-Martín, S., López-Cauce, B., Nuñez, O., Laserna-Mendieta, E. J., García, M. I., Lobato, E., et al. (2019). Genetic predictors of long-term response and trough levels of infliximab in crohn's disease. Pharmacol. Res. 149, 104478. doi:10.1016/j.phrs.2019.104478
Schmitt, H., Billmeier, U., Dieterich, W., Rath, T., Sonnewald, S., Reid, S., et al. (2019). Expansion of IL-23 receptor bearing TNFR2+ T cells is associated with molecular resistance to anti-TNF therapy in Crohn's disease. Gut 68 (5), 814–828. doi:10.1136/gutjnl-2017-315671
Singh, S., Fumery, M., Sandborn, W. J., and Murad, M. H. (2018). Systematic review and network meta-analysis: first- and second-line biologic therapies for moderate-severe Crohn's disease. Aliment. Pharmacol. Ther. 48 (4), 394–409. doi:10.1111/apt.14852
Smoot, M. E., Ono, K., Ruscheinski, J., Wang, P.-L., and Ideker, T. (2011). Cytoscape 2.8: new features for data integration and network visualization. Bioinformatics 27 (3), 431–432. doi:10.1093/bioinformatics/btq675
Soendergaard, C., Seidelin, J. B., Steenholdt, C., and Nielsen, O. H. (2018). Putative biomarkers of vedolizumab resistance and underlying inflammatory pathways involved in IBD. BMJ open Gastroenterol. 5 (1), e000208. doi:10.1136/bmjgast-2018-000208
Sprakes, M. B., Ford, A. C., Warren, L., Greer, D., and Hamlin, J. (2012). Efficacy, tolerability, and predictors of response to infliximab therapy for Crohn's disease: a large single centre experience. J. Crohn's Colitis 6 (2), 143–153. doi:10.1016/j.crohns.2011.07.011
Steyerberg, E. W., Vickers, A. J., Cook, N. R., Gerds, T., Gonen, M., Obuchowski, N., et al. (2010). Assessing the performance of prediction models. Epidemiology (Cambridge, Mass) 21 (1), 128–138. doi:10.1097/ede.0b013e3181c30fb2
Suzuki, Y., Matsui, T., Ito, H., Ashida, T., Nakamura, S., Motoya, S., et al. (2015). Circulating interleukin 6 and albumin, and infliximab levels are good predictors of recovering efficacy after dose escalation infliximab therapy in patients with loss of response to treatment for Crohnʼs disease. Inflamm. Bowel Dis. 21 (9), 2114–2122. doi:10.1097/mib.0000000000000475
Szklarczyk, D., Gable, A. L., Lyon, D., Junge, A., Wyder, S., Huerta-Cepas, J., et al. (2019). STRING v11: protein-protein association networks with increased coverage, supporting functional discovery in genome-wide experimental datasets. Nucleic Acids Res. 47 (D1), D607–D613. doi:10.1093/nar/gky1131
Thomas, H. (2017). Oncostatin M promotes inflammation in IBD. Nat. Rev. Gastroenterol. Hepatol. 14 (5), 261. doi:10.1038/nrgastro.2017.47
Torres, J., Bonovas, S., Doherty, G., Kucharzik, T., Gisbert, J. P., Raine, T., et al. (2020). ECCO guidelines on therapeutics in crohn's disease: medical treatment. J. Crohn's colitis 14 (1), 4–22. doi:10.1093/ecco-jcc/jjz180
West, N. R., Hegazy, A. N., Hegazy, A. N., Owens, B. M. J., Bullers, S. J., Linggi, B., et al. (2017). Oncostatin M drives intestinal inflammation and predicts response to tumor necrosis factor-neutralizing therapy in patients with inflammatory bowel disease. Nat. Med. 23 (5), 579–589. doi:10.1038/nm.4307
Wong, U., and Cross, R. K. (2017). Primary and secondary nonresponse to infliximab: mechanisms and countermeasures. Expert Opin. Drug Metab. Toxicol. 13 (10), 1039–1046. doi:10.1080/17425255.2017.1377180
Yokoyama, K., Yamazaki, K., Katafuchi, M., and Ferchichi, S. (2016). A retrospective claims database study on drug utilization in Japanese patients with crohn's disease treated with adalimumab or infliximab. Adv. Ther. 33 (11), 1947–1963. doi:10.1007/s12325-016-0406-6
Keywords: interleukin-6, primary non-response, crohn’s disease, infliximab, bioinfomatics
Citation: Chen Y, Li H, Feng Q and Shen J (2021) Development and Validation of an Interleukin-6 Nomogram to Predict Primary Non-response to Infliximab in Crohn’s Disease Patients. Front. Pharmacol. 12:654985. doi: 10.3389/fphar.2021.654985
Received: 18 January 2021; Accepted: 16 March 2021;
Published: 14 April 2021.
Edited by:
Ralf Weiskirchen, RWTH Aachen University, GermanyReviewed by:
Chuan Hu, Qingdao University Medical College, ChinaChristoph Roderburg, Charité – Universitätsmedizin Berlin, Germany
Copyright © 2021 Chen, Li, Feng and Shen. This is an open-access article distributed under the terms of the Creative Commons Attribution License (CC BY). The use, distribution or reproduction in other forums is permitted, provided the original author(s) and the copyright owner(s) are credited and that the original publication in this journal is cited, in accordance with accepted academic practice. No use, distribution or reproduction is permitted which does not comply with these terms.
*Correspondence: Jun Shen, c2hlbmp1bl9yZW5qaUAxNjMuY29t