 Shivendra Sangar
 Varun Dutt
 Ramna Thakur
- School of Humanities and Social Sciences, Indian Institute of Technology Mandi, Mandi, India
Background: The economic costs associated with morbidity pose a great financial risk on the population. Household's over-dependence on out-of-pocket (OOP) health expenditure and their inability to cope up with the economic costs associated with illness often push them into poverty. The current paper aims to measure the economic burden and resultant impoverishment associated with OOP health expenditure for a diverse set of ailments in India.
Methods: Cross-sectional data from National Sample Survey Organization (NSSO) 71st Round on “Key Indicators of Social Consumption: Health” has been employed in the study. Indices, namely the payment headcount, payment gap, concentration index, poverty headcount and poverty gap, are defined and computed. The measurement of catastrophic burden of OOP health expenditure is done at 10% threshold level.
Results: Results of the study reveal that collectively non-communicable diseases (NCDs) have higher economic and catastrophic burden, individually infections rather than NCDs such as Cardio Vascular Diseases and cancers have a higher catastrophic burden and resultant impoverishment in India. Ailments such as gastro-intestinal, respiratory, musco-skeletal, obstetrics, and injuries also have a substantial economic burden on population and push them below the poverty line. Results also show that despite the pro-poor concentration of infections, their economic burden is more concentrated among the wealthier consumption groups.
Conclusion: The study concludes that universal health coverage through adequate provision of pooled resources for health care and community-based health insurance is critical to reduce the economic burden and impoverishment related to OOP health expenditure. Measures should also be instituted to insulate people from economic burden on morbidity, especially the NCDs.
Background
The economic costs associated with morbidity pose a great financial risk on population (1). Direct spending on health care discourages people from using health care services and encourages them to postpone their health care needs (2, 3). In the majority of LMICs, limited resources for health care and lack of protection against catastrophic health spending have led to the over-reliance on OOP health expenditure (4).
Household's overly dependence on out-of-pocket (OOP) health expenditure and their inability to cope up with the economic costs of illness often push them into poverty (5, 6). Households faced with this situation face enormous financial liability and are devoid of adequate means for other essential needs such as food and education (7, 8). Further, rural dwelling, low socioeconomic status and outpatient care also contribute to the increasing economic burden of illness (9, 10).
There are few studies which have talked about this issue by taking into consideration either NCDs or infectious diseases without analyzing its impact on impoverishment (6, 11, 12). There is no study which has analyzed the monetary burden and impoverishment impact of different sets of NCDs and infectious diseases separately. Therefore, this study aims at filling this gap in the literature by analyzing the economic burden and resultant impoverishment due to OOP health expenditure for a diverse set of ailments by employing the recent health expenditure survey in India.
Materials and Methods
Data
The current study employed a nationally representative data from National Sample Survey Organization (NSSO), 71st Round (2004) on Key indicators of social consumption: Health (13). The survey comprises 65,932 sample households consisting a population of 0.33 million persons. The survey adopted a stratified multistage sample design, using census villages for the rural areas and urban blocks for the urban areas as the first-stage units (FSUs), and households as the second-stage units. The reference period for inpatient and outpatient care is 365 and 15 days, respectively. For the analysis, the OOP health expenditure for inpatient and outpatient care is converted into monthly figures and added together to get the total OOP health expenditure. In this study, OOP health expenditure is calculated by deducting the amount of reimbursement from total health expenditure. Respective sample weights have been applied in the calculation of the results. For the analysis, we have taken 16 groups of different ailments (13). The analysis is done on Stata 14 (14).
Methods
Measuring the Economic Burden of Morbidity
The economic burden of morbidity has been calculated in terms of headcount and payment gap (15). Headcount (HC) measures the percentage of population incurring OOP health expenditure. It is measured by , where N is the sample size, HC is the headcount and n is number of persons incurring OOP health expenditure. The payment gap is explained as the share of OOP health expenditure in total consumption expenditure is given by , S is the payment gap, H is the OOP health expenditure, TCE is the total consumption expenditure. Measurement of catastrophic burden of OOP health expenditure (headcount and payment gap) is done at 10% threshold level of TCE which has been a standard benchmark in the literature (15, 16). Catastrophic headcount is a fraction of the population whose OOP health expenditure as a proportion of TCE exceed the given threshold. Whereas, catastrophic payment gap measures the average degree by which OOP health expenditure as a proportion of TCE exceeds the threshold level. The concentration index has been used to determine whether the poor incur more OOP health expenditure or the rich (17). Concentration index CE and CO (for headcount and payment gap, respectively) as given by the following formula: CI = (p1L2− p2L1) + (p2L3− p3L2)+…+(pt−1Lt− ptLt−1), Where CI is the concentration index, pt is the cumulative percentage of the population ranked by monthly consumption expenditure in group t, Lt is the corresponding health variable.
Measuring the Impoverishment Impact of Morbidity
Poverty headcount impact measures the fraction of population falling below the poverty line due to OOP health expenditure. The poverty impact in terms of headcount is measured as PIHC = HCPost− HCPre, where PIHC is the poverty headcount impact, ZPre be the pre-payment poverty line. Then PPre = 1 if x < ZPre , PPre is the pre-payment poverty headcount, HCPost and HCPost are the post and pre-payment poverty headcount. Poverty impact in terms of gap measures the average shortfall due to OOP health expenditure from the existing poverty line. It is given as PIG = GPost−GPre, where PIG is the poverty gap impact, gPre is the pre-payment gap, that is equal to x—ZPre if x < ZPre, and zero otherwise, , GPost and GPre are the post and pre-payment poverty gap.
Results
Economic Burden of Morbidity in India
Table 1 reports the economic and catastrophic burden of OOP health expenditure incurred on different ailments. Although, collectively NCDs have higher economic burden, in case of individual ailments a significant proportion of population reported OOP health expenditure in case of infections followed by respiratory, CVDs, musco-skeletal, gastro-intestinal, psychiatric, and injuries. Although in lesser proportions, OOP health expenditure is also reported in other categories of ailments. Similarly, the payment gap as share of OOP health expenditure in TCE is also higher among infections as compared to other ailments. Similar to the economic burden, the catastrophic burden reported at 10% threshold level is relatively higher in case of infections than other ailments. However, collectively NCDs have higher catastrophic impact on the population. In case of infections, the negative value of C.IE and the positive value of C.IO reveal that despite its pro-poor concentration, it is the wealthier consumption groups which spends more on the treatment. However, in case of NCDs, especially CVDs and cancer, the positive values of CIE and CIO reveal a pro-rich concentration of headcount as well as OOP health expenditure.
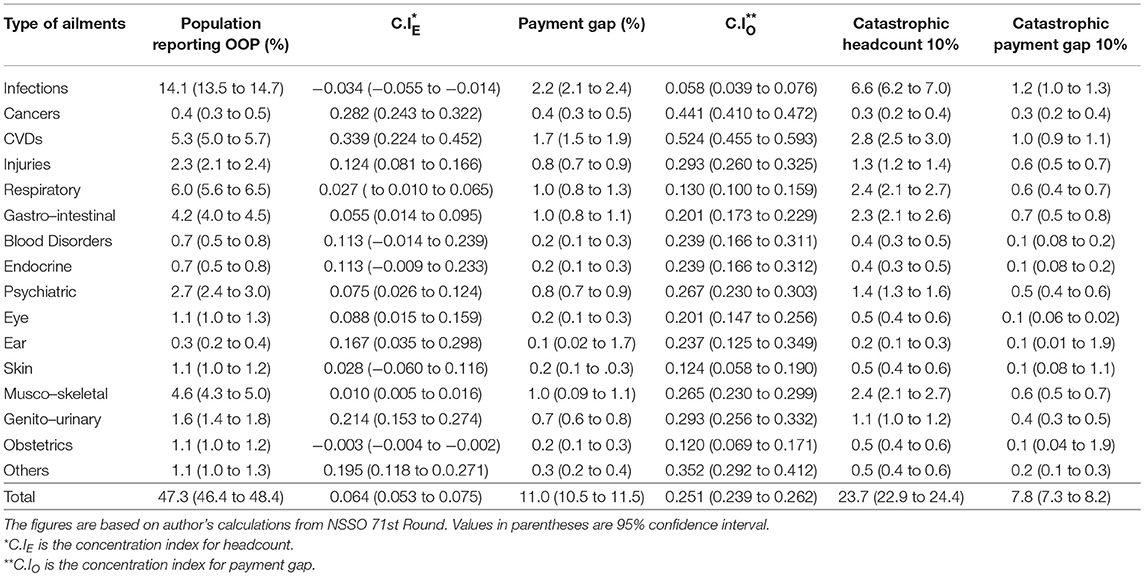
Table 1. Economic burden of morbidity in India.
Poverty Impact of Morbidity in India
Table 2 presents the poverty impact of OOP health expenditure incurred on different ailments in terms of headcount and payment gap. Poverty impact in terms of headcount is highest in case of infections, followed by CVDs and gastro-intestinal, musco-skeletal, respiratory, and injuries. Similarly, the poverty impact in terms of payment gap is also significantly higher in infections. It shows that the average shortfall from the poverty line is higher in case of infections than other ailments. Ailments consisting of gastro, musco-skeletal, respiratory, CVDs, and injuries also have higher poverty gap impact. Some other ailments such as skin, blood disorders, eye and ear also marginally contribute toward impoverishment.
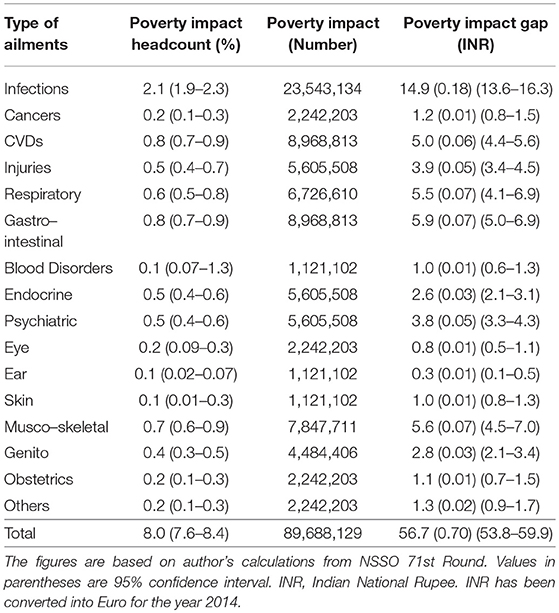
Table 2. Poverty impact of morbidity in India.
Discussion
Overall, the results of the study reveal that NCDs such as CVDs, cancers, etc. have the higher catastrophic burden and resultant impoverishment in India. Although individually CVDs have a significant economic burden and high poverty impact, it is less than infections. Ailments such as gastro-intestinal, respiratory, musco-skeletal, obstetrics and injuries also have a substantial economic burden on population and push them below the poverty line. Infections have higher poverty impact because the population affected with the same is more concentrated around the poverty line. A smaller increase in OOP health expenditure pushes the larger proportion of population below the poverty line.
Although it is true that the burden of NCDs is increasing in India and cumulatively they have higher catastrophic burden but it is the infectious diseases which push more people into the quagmire of poverty (18). Studies from other LMICs reveal that the economic burden and resultant impoverishment due to OOP health expenditure has been relatively high in case of NCDs such as CVDs, cancer, diabetes and stroke (19, 20). Further, many countries in Africa have higher incidence of catastrophic health expenditure due to infectious disease like Malaria and Tuberculosis (21, 22). In LMICs, lack of access to health services, poor quality of care and high user charges contribute to higher OOP health expenditure (12). Further, inadequate public spending on health care and poor implementation of publicly financed health insurance schemes (PFHIs) have further accentuated the problem of health care financing in India (23, 24).
The high catastrophic burden and resultant impoverishment associated with morbidity highlight the need for a better financial protection mechanism in India, particularly for the poor and vulnerable. Universal health coverage (UHC) is regarded as a critical path for improving the health outcomes and providing financial protection against the catastrophic health expenditure (25). It is a comprehensive health system approach that helps to provide improved access to health care services which significantly improves the health outcomes (26). UHC can be achieved through a matured health system that can provide sufficient and continuous pooled resources for health (27). Apart from improving access to health care services, policy makers must focus on extending quality care, especially to poor families (28). LMICs can implement community-based health insurance (CBHI) which can go a long way in achieving UHC (29).
The future plan of the research will be to measure the economic burden of ailments at different threshold levels. Along with-it different sources of finance used to cope up with OOP health expenditure for different ailments will also be studied. A comparative analysis with previous data rounds may also be useful.
Data Availability Statement
This paper is based on anonymized survey data collected by the National Sample Survey organization (NSSO), a department of the Ministry of Statistics and Programme Implementation, Government of India. Data is available in the public domain. The data is already available in publicly available repositories to individuals both at national and international level through http://www.mospi.gov.in/
Author Contributions
RT and SS conceived the idea with inputs from VD. SS performed the statistical analysis and prepared the initial draft of the manuscript. RT and VD assisted in the revision of the manuscript. All authors read and approved the final manuscript.
Conflict of Interest Statement
The authors declare that the research was conducted in the absence of any commercial or financial relationships that could be construed as a potential conflict of interest.
References
1. Tolla MT, Norheim OF, Verguet S, Bekele A, Amenu K, Abdisa SG, et al. Out-of-pocket expenditures for prevention and treatment of cardiovascular disease in general and specialised cardiac hospitals in Addis Ababa, Ethiopia: a cross-sectional cohort study. BMJ Global Health (2017) 2:e000280. doi: 10.1136/bmjgh-2016-000280
2. WHO. World Health Report 2010: Health Systems Financing the Path to Universal Coverage. Geneva: WHO (2010).
3. Xu K, Evans DB, Kawabata K, Zeramdini R, Klavus J, Murray CJ. Household catastrophic health expenditure: a multicountry analysis. Lancet (2003) 362:111–7. doi: 10.1016/S0140-6736(03)13861-5
4. Dieleman J, Campbell M, Chapin A, Eldrenkamp E, Fan VY, Haakenstad A, et al. Evolution and patterns of global health financing 1995–2014: development assistance for health, and government, prepaid private, and out-of-pocket health spending in 184 countries. Lancet (2017) 389:1981–2004. doi: 10.1016/S0140-6736(17)30874-7
5. van Doorslaer E, O'Donnell O, Rannan-Eliya RP, Somanathan A, Adhikari SR, Garg CC, et al. Effect of payments for health care on poverty estimates in 11 countries in Asia: an analysis of household survey data. Lancet (2006) 368:1357–64. doi: 10.1016/S0140-6736(06)69560-3
6. Mahal AS, Karan A, Engelgau M. Economic Implications of Non-communicable Disease for India. Washington, DC: World Bank (2010).
7. Van Minh H, Kim Phuong NT, Saksena P, James CD, Xu K. Financial burden of household out-of pocket health expenditure in Viet Nam: findings from the National Living Standard Survey 2002–2010. Soc Sci Med. (2013) 96:258–63. doi: 10.1016/j.socscimed.2012.11.028
9. Karan A, Selvaraj S, Mahal A. Moving to universal coverage? Trends in the burden of out-of-pocket payments for health care across social groups in India, 1999–2000 to 2011–12. PLoS ONE (2014) 9:e105162. doi: 10.1371/journal.pone.0105162
10. Kumar K, Singh A, Kumar S, Ram F, Singh A, Ram U, et al. Socio-economic differentials in impoverishment effects of out-of-pocket health expenditure in China and India: evidence from WHO SAGE. PLoS ONE (2015) 10:e0135051. doi: 10.1371/journal.pone.0135051
11. Rajpal S, Kumar A, Joe W. Economic burden of cancer in India: evidence from cross-sectional nationally representative household survey, 2014. PLoS ONE (2018) 13:e0193320. doi: 10.1371/journal.pone.0193320
12. Russell S. The economic burden of illness for households in developing countries: a review of studies focusing on malaria, tuberculosis, and human immunodeficiency virus/acquired immunodeficiency syndrome. Am J Trop Med Hyg. (2004) 71 (2_suppl):147–55. doi: 10.4269/ajtmh.2004.71.147
13. NSSO. Key Indicators of Social Consumption in India: Health, 71st Round (January-June 2014). New Delhi: Ministry of Statistics and Programme Implementation, Government of India (2014).
14. Corp 2015. Stata. Stata Statistical Software: Release 14. College Station, TX: StataCorp LP 2014 (2014).
15. Wagstaff A, van Doorslaer E. Catastrophe and impoverishment in paying for health care: with applications to Vietnam 1993–1998. Health Econ. (2003) 12:921–33. doi: 10.1002/hec.776
16. Pradhan M, Prescott N. Social risk management options for medical care in Indonesia. Health Econ. (2002) 11:431–46. doi: 10.1002/hec.689
18. ICMR. PHFI and IHME. India: Health of the Nation's States - The India State Level Disease Burden Initiative. New Delhi: Indian Council of Medical Research, Public Health Foundation of India and Institute for Health Metrics and Evaluation (2017).
19. Zaidi AA, Ansari TZ, Khan A. The financial burden of cancer: estimates from patients undergoing cancer care in a tertiary care hospital. Int J. Equit Health (2012) 11:60. doi: 10.1186/1475-9276-11-60
20. Huffman MD, Rao KD, Pichon-Riviere A, Zhao D, Harikrishnan S, Ramaiya K, et al. A cross-sectional study of the microeconomic impact of cardiovascular disease hospitalization in four low-and middle-income countries. PLoS ONE (2011) 6:e20821. doi: 10.1371/journal.pone.0020821
21. Laokri S, Dramaix-Wilmet M, Kassa F, Anagonou S, Dujardin B. Assessing the economic burden of illness for tuberculosis patients in Benin: determinants and consequences of catastrophic health expenditures and inequities. Trop Med Int Health (2014) 19:1249–58. doi: 10.1111/tmi.12365
22. Onwujekwe O, Hanson K, Uzochukwu B, Ichoku H, Ike E, Onwughalu B. Are malaria treatment expenditures catastrophic to different socio-economic and geographic groups and how do they cope with payment? A study in southeast Nigeria. Trop Med Int Health (2010) 15:18–25. doi: 10.1111/j.1365-3156.2009.02418.x
23. Prinja S, Chauhan AS, Karan A, Kaur G, Kumar R. Impact of publicly financed health insurance schemes on healthcare utilization and financial risk protection in india: a systematic review. PLoS ONE (2017) 12:e0170996. doi: 10.1371/journal.pone.0170996
24. Karan A, Yip W, Mahal A. Extending health insurance to the poor in India: an impact evaluation of Rashtriya Swasthya Bima Yojana on out of pocket spending for healthcare. Soc Sci Med. (2017) 181:83–92. doi: 10.1016/j.socscimed.2017.03.053
25. Assembly, UN General. Transforming Our World: The 2030 Agenda for Sustainable Development. New York, NY: United Nations (2015).
26. Ranabhat CL, Atkinson J, Park MB, Kim CB, Jakovljevic M. The influence of universal health coverage on life expectancy at birth (LEAB) and healthy life expectancy (HALE): a multi-country cross-sectional study. Front Pharmacol. (2018) 9:960. doi: 10.3389/fphar.2018.00960
27. Dieleman JL, Sadat N, Chang AY, Fullman N, Abbafati C, Acharya P, et al. Trends in future health financing and coverage: future health spending and universal health coverage in 188 countries, 2016–40. Lancet (2018) 391:1783–98. doi: 10.1016/S0140-6736(18)30697-4
28. Khera R, Valero-Elizondo J, Okunrintemi V, Saxena A, Das SR, de Lemos JA, et al. Association of out-of-pocket annual health expenditures with financial hardship in low-income adults with atherosclerotic cardiovascular disease in the United States. JAMA Cardiol. (2018) 3:729–38. doi: 10.1001/jamacardio.2018.1813
Keywords: economic burden, impoverishment, ailments, infections, morbidity
Citation: Sangar S, Dutt V and Thakur R (2019) Comparative Assessment of Economic Burden of Disease in Relation to Out of Pocket Expenditure. Front. Public Health 7:9. doi: 10.3389/fpubh.2019.00009
Received: 05 July 2018; Accepted: 10 January 2019;
Published: 29 January 2019.
Edited by:
Obinna E. Onwujekwe, University of Nigeria, NigeriaReviewed by:
Chhabi Lal Ranabhat, Yonsei University, South KoreaNatasa Djordjevic, University of Kragujevac, Serbia
Copyright © 2019 Sangar, Dutt and Thakur. This is an open-access article distributed under the terms of the Creative Commons Attribution License (CC BY). The use, distribution or reproduction in other forums is permitted, provided the original author(s) and the copyright owner(s) are credited and that the original publication in this journal is cited, in accordance with accepted academic practice. No use, distribution or reproduction is permitted which does not comply with these terms.
*Correspondence: Ramna Thakur, cmFtbmFAaWl0bWFuZGkuYWMuaW4=