 Milos Stepovic1
 Nemanja Rancic2,3*
 Berislav Vekic4,5
 Viktorija Dragojevic-Simic2,3Stefan Vekic6
 Nenad Ratkovic3,7
 Mihajlo Jakovljevic8,9,10
- 1Faculty of Medical Science, University of Kragujevac, Kragujevac, Serbia
- 2Centre for Clinical Pharmacology, Military Medical Academy, Belgrade, Serbia
- 3Medical Faculty of the Military Medical Academy, University of Defence, Belgrade, Serbia
- 4Clinic for Surgery, University Hospital Center “Dr. Dragisa Misovic”, Belgrade, Serbia
- 5Department of Surgery, Faculty of Medical Sciences, University of Kragujevac, Kragujevac, Serbia
- 6Faculty of Economics, University of Belgrade, Belgrade, Serbia
- 7Treatment Sector, Military Medical Academy, Belgrade, Serbia
- 8Institute of Comparative Economic Studies, Hosei University, Tokyo, Japan
- 9The N.A.Semashko Public Health and Healthcare Department, I.M. Sechenov First Moscow State Medical University (Sechenov University), Moscow, Russia
- 10Department of Global Health Economics and Policy, Faculty of Medical Sciences, University of Kragujevac, Kragujevac, Serbia
Background: Dynamics of health care has changed over time along with development of the countries themselves. The aim of the study is to compare macroeconomic and health expenditure indicators of interest, such as total health expenditure (THE) as percentage of global domestic product, global domestic product per capita in US$, and private households' out-of-pocket payments of Balkan and Eastern European countries on health, as well as to assess their progress over the observed period.
Methods: This research report represents a descriptive data analysis of indicators extracted from the European Health for All database. The data were analyzed using a linear trend and regression analysis to estimate the timeline changes.
Results: Greece and Slovenia have the largest median values of global domestic product per capita throughout the whole period, and the largest increment trend was in Lithuania. Median value in out-of-pocket payment of THE was the highest in Albania and Ukraine, while the largest decrease in trend was noticed in Albania and Bosnia and Herzegovina. Bosnia and Herzegovina and Greece had the largest median value of THE as percentage of Gross Domestic Product (GDP) in the observed period, while regression trend analysis showed that Serbia had the largest increase. Most of the countries showed a significant correlation between observed indicators.
Conclusion: Trends in the economy must be constantly monitored due to the fact that the population is aging and non-communicable diseases are multiplying, which requires innovations in medical treatment and pharmaceutical development.
Background
The health system must be adequately funded or “the holes will lead to a rapid sinking” (1). There are a lot of suggested options in order to increase funding, such as increment in Gross Domestic Product (GDP) investments, better organization of resource allocation in health, introducing taxes on harmful products, insurance options, etc. (1). Better communication between health policymakers and controllers of public spending would result in more sustainable system that covers the most or all of citizen health care needs. Many changes affect countries, whether they are richer or poorer. Poor countries face challenges to organize affordable and sufficient quality health services, while richer countries struggle with aging populations. Both need to keep health expenditures under control, while they are rising a lot (2, 3).
By the method of health system funding, European countries can be sorted into three groups. The first group would present the countries with the Beveridge model of funding based mostly on taxation. This model is found in Great Britain, Spain, and New Zealand (4). The second group with the Bismark model rely their health funds on social insurance. This model is represented in Germany, France, Belgium, the Netherlands, Japan, and Switzerland (5). The third group of countries with the Semashko model bases their health funds on health care provided by the government for its citizens (6). The last one is characteristic for Russia and most other post-communist countries as well as in the most of the Southeastern countries and Balkan countries. Since they have a common past, they really look like each other in terms of forming good health systems, which means that they look up to the Russian Federation as a country that has set up such a system (7). This health system undertook some changes and transitioned into the social insurance or mixed social insurance/taxation-based system (8, 9). The former Yugoslavia had this kind of combined health system, while many Eastern European countries (the Russian Federation, Latvia, and Estonia) adopted this system during the 1990s. Changes always lead to certain problems, mainly through increased expenditures and increased labor costs. This has further led to one of the most regressive forms of payment for health services, and that is direct payment by the patient causing further conflicts: inequality between rich and poor (10, 11).
Therefore, adaptations of health systems began, which certainly could not be universal, because different countries had different levels of development. Universal health coverage became the ultimate goal for each country but, so far, none of them fully succeed. Some of them had better ideas, but adaptation varied, mostly dependent on the decisions and policies of the government. Economic analysis and comparison studies become the most relevant tools for accessing the health situation. The results of these studies proved to be very important in decision making concerning health investments, but a lot of aspects must be covered and many other factors need to be considered for outcomes to lead to universal coverage of health costs (12). Communicable, non-communicable diseases, aging population, new medical interventions and medications, gender inequalities, different level of country development, economic investments, and many other factors need to be considered (13).
Total health care spending increased during the 1960s and 1970s, slowed in the 1980s, and rose again in 1990s. This upward trend has continued, but the average percentage increase in gross domestic product (GDP) varied. The largest was in Romania and Estonia, from an average of 5 to 11% of GDP. As the GDP for health increased, the public health spending followed that rise accordingly. In the mid-1980s, this trend slowed down, and in the late 1990s and 2000s, it reached on average 6%. In the most EU countries, it varied between 12 and 15% in 2010 (14). Many researches show the significant correlation between higher spending on health in the countries that invest higher percentage of GDP per capita in comparison to the lower-income countries (15–18).
The well-known trend of health care systems in Central and Eastern European countries of using private budgets to cover medical expenses is in particular caused by health policy aiming to reduce the burden of the health problems of patients. Therefore, the form of full or partial payments for some medicines is used (19). In 2004, OOP payments accounted for 73–98% of total private health expenditures, and those payments mostly included dentists, laboratory tests, private treatments, etc. Expenditures of inpatient care and medicine and outpatient care are on the trend rise in Belarus, Estonia, and Hungary, and those difficulties will affect the people with lower socioeconomic status, resulting in delayed or unutilized health care needs (20).
Because of similar history and, also, the similar health system between these countries, we conducted a short data report to investigate the progress of selected economic indicators and to find a possible relationship between them. By doing this, we have obtained data concerning health financing of these countries that have similar development levels. By observing positive trends and analyzing their progress, it looks like that countries with less success in health system financing are more likely to adopt patterns of government investments, in comparison to more developed countries.
The aim of this study was to compare the total health expenditure (THE) as percentage of GDP, GDP per capita in US$, and private households' out-of-pocket payments on health as percentage of THE between Balkan and East European countries. The progress over the period between 1990 and 2014 was assessed.
Methods
This research report article represents a descriptive data analysis of macroeconomic and health expenditure indicators, extracted from European Health for All database (HFA-DB) (21). This database provides indicators for 53 countries and 153 health indicators. Member States of the WHO European Region have been reporting essential health-related statistics to the Health for All (HFA) family of databases since the mid-1980s, making it one of the oldest sources of data of WHO. As it is based on reported data, the HFA family of databases is also particularly valuable. HFA databases bring together the indicators that are part of major monitoring frameworks (https://gateway.euro.who.int/en/indicators/hfa_565-6710-total-health-expenditure-as-of-gdp-who-estimates/).
Indicator of interest—THE as percentage of GDP, GDP per capita in US$, and private households' out-of-pocket payments on health as percentage of THE were extracted from the database. It included the following Balkan and Southeastern European countries: Albania, Bulgaria, Bosnia and Herzegovina, Belarus, Greece, Croatia, North Macedonia, Montenegro, Romania, the Russian Federation, Serbia, Slovenia, Turkey, Estonia, Lithuania, Latvia, and Ukraine. Observation period was from 1990 to 2014.
The data will be analyzed using a linear trend estimate. It is a statistical technique that helps interpret data where a series of process measurements are treated as a time series, a trend estimate used to make and justify statements of tendencies in the data, linking the measurements to the times in which they occurred. Linear trend estimation will show the occurrence of possible patterns in the behavior of the variables over the observed time period and will provide information on whether the trend developed is positive, negative, or even absent. Trend results will be presented in tabular form. Linear trend and regression analysis were used to access the timeline changes in observed indicators for each country and to calculate the progress of these countries over time. Median operation and interquartile range 25th–75th percentile were used for better comparison of each country. Financial parameters are expressed in US currency.
The data were also analyzed using the statistical program SPSS version 20. Pearson's coefficient of correlation was used to determine the relationship between each group of indicators of interest. Statistically significant results had a p value of <0.01.
The data are anonymous and do not belong to individual citizens. Therefore, there is no question of protecting the privacy of the data. According to the International Ethical Guidelines for Biomedical Research involving Humans and Good Clinical Practice Guidelines, a study like this does not require consideration by the Ethics Committee;
https://cioms.ch/wp-content/uploads/2017/01/WEB-CIOMS-EthicalGuidelines.pdf;
Results
The largest median value of THE as percentage of GDP expenditure in the observed period had Bosnia and Herzegovina (8.75%) and Greece (8.66%) and the smallest had Turkey (5.35%) and Romania (5.25%) (Table 1). Regression trend analysis showed that the trend had the biggest increase in Serbia (y = 0.2481x + 5.8157; R2 = 0.9101) and Romania (y = 0.125x + 3.5459; R2 = 0.8148). The biggest decrement was in Albania (y = −0.0856x + 7.1254; R2 = 0.7184) and North Macedonia (y = −0.1663x + 9.6064; R2 = 0.7607).
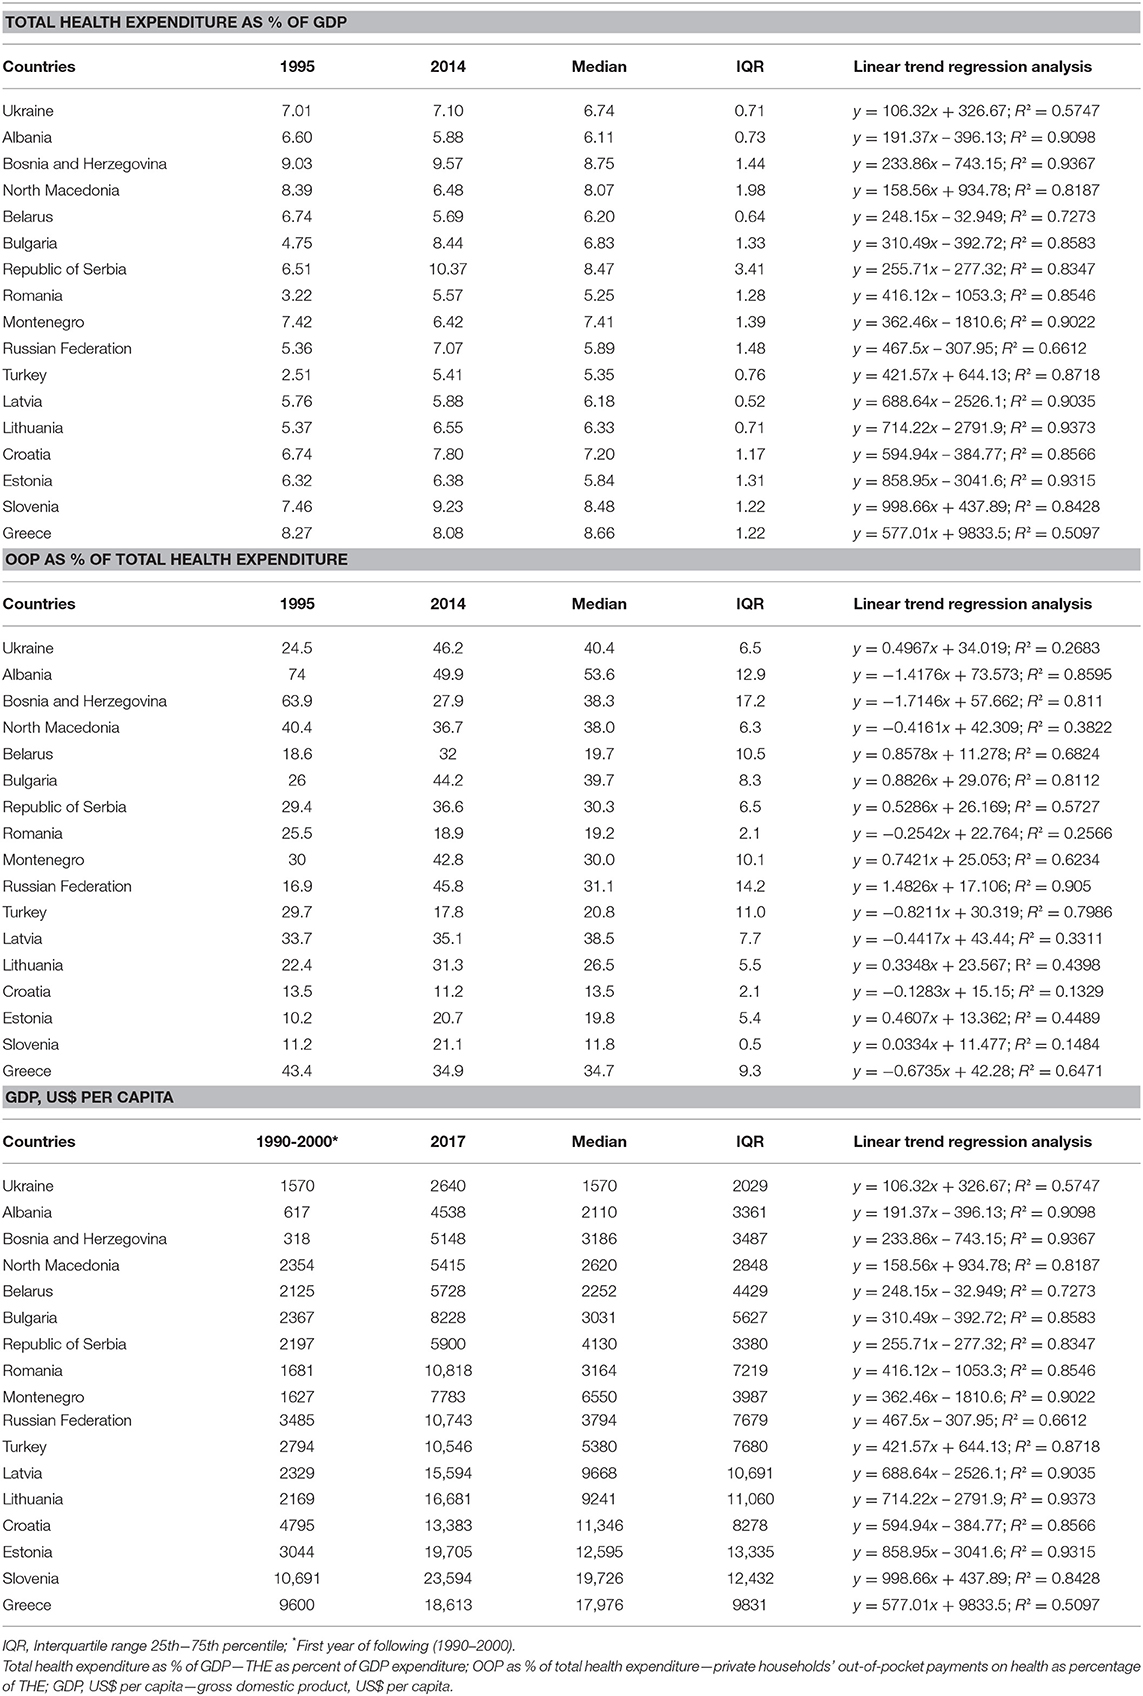
Table 1. Total health expenditure (THE) as % of GDP, OOP as % of THE and GDP, US$ per capita for first and last year of observation, median for entire observed period, interquartile range, and linear trend regression analysis for all 17 countries.
The biggest median percentage in private households' out-of-pocket payments on health as percentage of THE (OOP payment of THE) came from Albania (53.6%) and Ukraine (40.4%) and the smallest percentages were noticed in Slovenia (11.8%) and Croatia (13.5%). Looking at the regression analysis, trend lines vary from country to country in the observed period. The biggest decrease was noticed in Albania (y = −1.4176x + 73.573; R2 = 0.8595) and Bosnia and Herzegovina (y = −1.7146x + 57.662; R2 = 0.811). The largest increase was noticed in Russia (y = 1.4826x + 17.106; R2 = 0.905) and Bulgaria (y = 0.8826x + 29.076; R2 = 0.8112) (Table 1).
Greece and Slovenia have the largest median values of GDP, US$ per capita throughout that period. This indicator for Greece was US$17,976 and that for Slovenia was US$19,726, while the smallest numbers were recorded in Ukraine (US$1570) and Albania (US$2110). Looking at the regression analysis, all countries showed increase over the observed time, with the biggest increase in Lithuania (y = 714.22x – 2791.9; R2 = 0.9373) and Bosnia and Herzegovina (y = 233.86x – 743.15; R2 = 0.9367) (Table 1 and Graph 1).
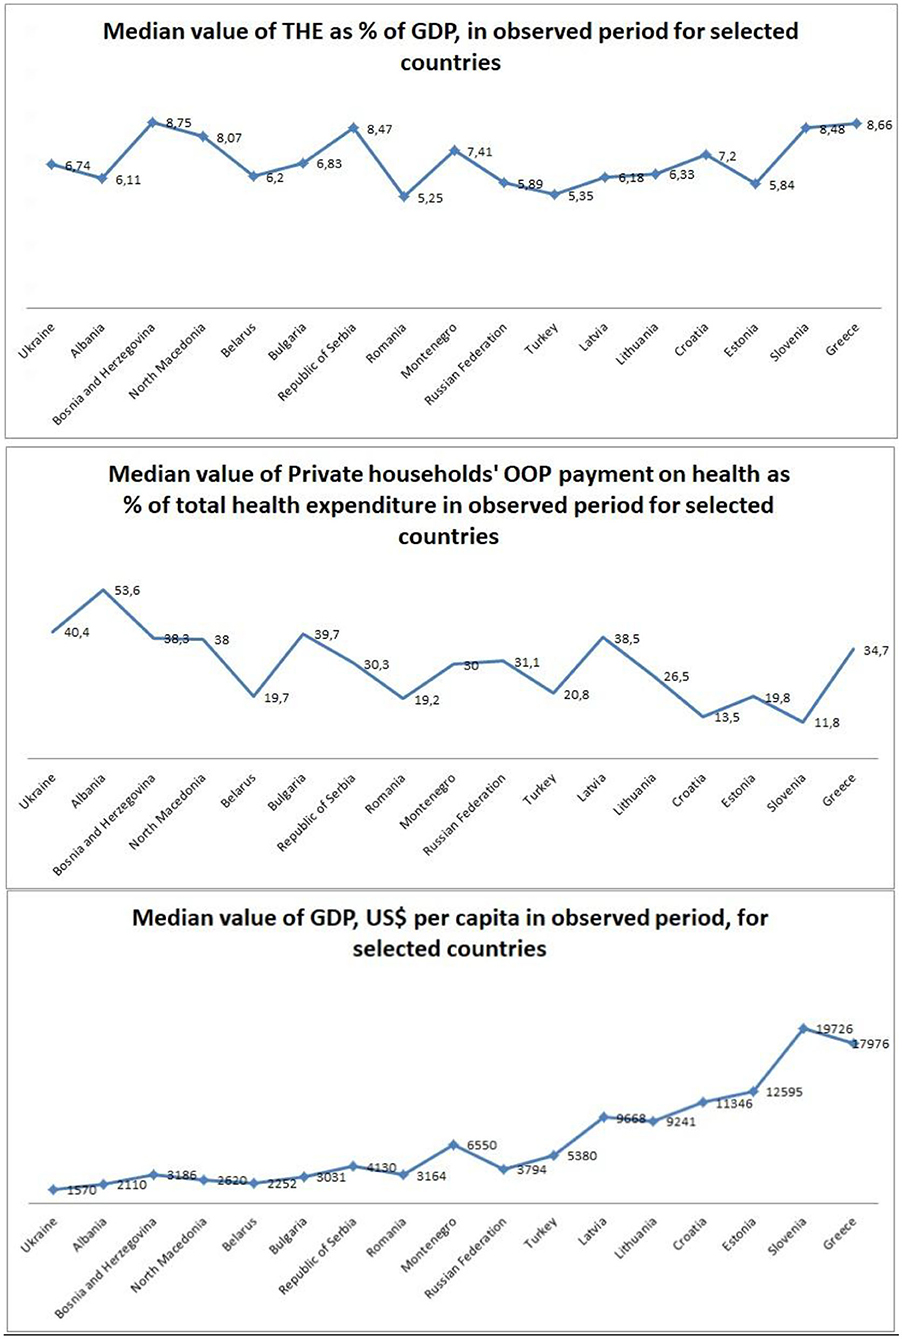
Graph 1. Median values for economic indicators in observed period for selected countries, shown as trend graphics.
Pearson's correlation indicated that from 17 considered countries (Table 2), a total of 11 showed existence of significant positive (Albania, North Macedonia, Bulgaria, Republic of Serbia, and the Russian Federation) or negative (Romania, Montenegro, Turkey, Croatia, Estonia, and Greece) correlation between indicators THE as percentage of GDP expenditure and private households' out-of-pocket payments on health as percentage of THE. In Albania, North Macedonia, Bulgaria, Republic of Serbia, and the Russian Federation, growth of THE is in positive correlation with OOP, meaning that THE grows along with growth of OOP (correlation range from 0.51 in the Russian Federation to 0.87 in Albania). Opposite from this, negative correlation exists in Romania, Montenegro, Turkey, Croatia, Estonia, and Greece, meaning that with OOP growth, THE decreases (−0.42 in Estonia to −0.82 in Montenegro). The establishing relationship of THE as percentage of GDP expenditure and GDP, US$ per capita in 15 countries showed a significant correlation between those indicators, with the exception of Latvia and Estonia. Ten countries showed a positive correlation between these indicators with a correlation range from 0.47 in Bosnia and Herzegovina to 0.91 in the Republic of Serbia, meaning that an increase of THP is followed by an increase of GDP, US$. Five countries showed negative correlation, with a correlation range from −0.67 in Belarus to −0.94 in North Macedonia. Finally, private households' out-of-pocket payments on health as percentage of THE and GDP US$ per capita showed significant correlations in 14 out of 17 countries. Eight countries showed a positive correlation with a correlation range from 0.50 in Slovenia to 0.88 in Montenegro, meaning that OOP payments on health increase, as the GDP US per capita increases along. Six countries showed a negative correlation with a correlation range from −0.59 in Greece to −0.90 in Albania.
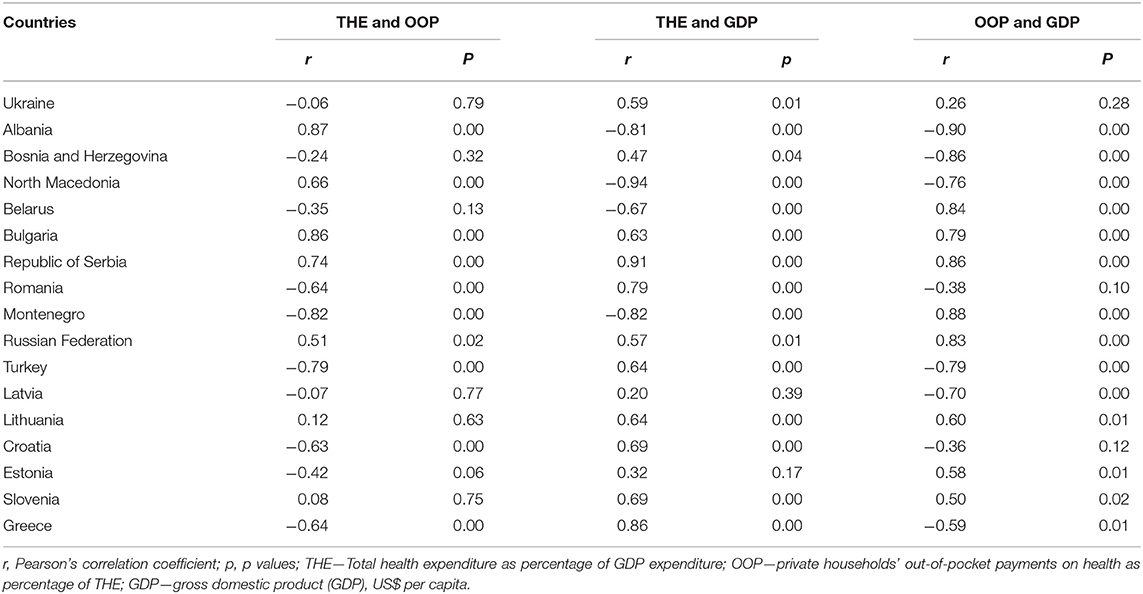
Table 2. Correlation between selected indicators: THE as % of GDP, OOP as % of THE, and GDP, US$ per capita for all 17 countries.
Discussion
In the period from 1880 to 1990, data on the OECD countries showed similar rising paths in investing of GDP on health, with France being in the leading spot (22). Looking at the OECD countries nowadays, which are high-income countries, it can be noticed that they spend a large percentage of GDP on health. The United States is the country that spends the highest percentage of all countries in the OECD group, with almost 17% in 2018 (23). Comparing Balkan and East European Countries with the OECD group, it can be concluded that, first of all, they do not belong to the same income group, so one can expect that THE as % of GDP is much lower for these countries. However, Serbia is the country with the highest investment of all of these countries, with 10.37% in 2014. On the other hand, a larger share of GDP does not necessarily indicate the existence of a better health care system. The United States spends more on health care due to higher prices of health services, and not because of the greater use of those services (24).
Unfortunately, more than 80% of people living in low- and middle-income countries have benefited from only 20% of global health spending (25). The World Health Organization has divided countries into six regions according to what part of GDP is invested in health. Among them, the European region invested the most in the monitoring period, from 2000 to 2017, with 7.8% in the last considered year (26). Countries that were analyzed in our research belong to the European region.
In 2014, the global average level of GDP percentage spent on health was 6.1%, while the average value of all countries considered in our research for the same year was 7.2%, higher than the global average (26). From all of the European countries, Switzerland had the highest investments (12.3%), while Turkey (4.2%), Romania (5.25%), and Latvia and Lithuania (both 6.3%) had the lowest ones in 2017 (27, 28). Romania (5.25%) and Turkey (5.35%) had the lowest median percentage of GDP investments in health within the 17-year follow-up period, which is in line with previous research presenting these two countries as the ones with slowest growth (29). Similar results were found in Eurostat analysis, where Romania had the lowest investment of GDP in health, roughly 5%.
Governments provide an average of 51% of a health spending of countries, while more than 35% of health spending per country comes from out-of-pocket expenses (30). On the average, in 2015, 32% of health expenditure was out-of-pocket (31). More than half of countries in our analysis showed increase of OOP spending, with the highest percentage in the Russian Federation in which the OOP increased 2.7 times in 2014 in comparison to 1995. On the contrary, in Bosnia and Herzegovina, there was a decrease of 2.3 times in the analyzed period. Out-of-pocket share of health expenditure in 2016 was the highest in Switzerland, accounting for 30% (32).
Our results showed that more than half of the analyzed countries have OOP percent share higher than 30%, with Albania on the top with 50%, followed by Ukraine and Russia accounting for 46%. They are in line with the database “Our world in data” with these three countries as the ones with the highest OOP share, along with Bulgaria (33). Slovenia (11.8%) and Croatia (13.5%) showed the smallest percentage, similar to the United States.
The GDP per capita in the United States was recorded at the amount of US$53,356 in 2017 (34). Compared to any country in our analysis, the United States has far higher health spending that is almost twice as high as Slovenia's costs (US$23,594), and these costs are higher than in all other countries in our study.
Slovenia, in 2018, according to data from World Bank, had spending equal to US$26,234, ranking 36th. Estonia (US$22,928) and Greece (US$20,324) were listed as 41st and 42nd, respectively, while Croatia was 57th (US$14,869) (35). Looking at the data from our study, countries with the highest spending were Slovenia (US$23,594) on top, followed by Estonia (US$19,705) and Greece (US$18,613). Countries that had the least health spending were Ukraine (US$2640) and Albania (US$4538)—nine and five times smaller than Slovenia, respectively.
Out-of-pocket expenditures are also positively correlated with the GDP share spent on health. The OOP budget share is higher in countries that spend a large share of their GDP on health and lower in countries that channel more of their total health spending through social health insurance (36). Those results are in line with our findings where higher spending on GDP led to higher share of OOP spending in nine observed countries.
THEs rise along with the development of the country. Such development allows access to new pharmaceuticals, medical technology, and also a new point of view, in general. However, many medical decisions must be carefully considered because the inappropriate application of new technologies can lead to severe consequences for government funds and unnecessary costs for the citizens themselves, leading more to problems than to some desired solutions (37, 38). Rancic et al. showed that THE, expressed as percentage of GDP in the most of the selected Balkan countries, for the period from 1995 to 2012, had an obvious increase (39). THE share of GDP among observed countries in 2012 was highest in Albania, while Romania, Serbia, and Bulgaria recorded about 1.5-fold higher share in comparison to 1995. Our study shows that Bulgaria, Serbia, and Slovenia had the biggest progress.
During the last two decades, significant change in US dollar health expenditure per capita was observed, where, in 2000, average world spending on health was $472, and in 2016, it increased more than double, with $1026 (40, 41). Our analysis pointed out that Balkan and Southeastern countries have also shown an increased trend concerning per capita spending, with Slovenia and Greece at the top.
It is well known that OOP payment prevents some people from accessing needed care, while others face financial hardship when they access services. In 2000, percentage of OOP spending on health in the world was around 19, and in 2014, it decreased to about 18% (42). Our study considering Balkan and Southeastern countries showed that Albania, Ukraine, and the Russian Federation had greater difference from the world's average (average of percentage of OOP spending on health worldwide in 2014 was 18%).
The problem of population aging is one of the worrying problems in all countries where medical costs are rising, and such is the situation in the Balkans and Eastern Europe (43). Older people have more needs related to medicine and health systems that do not include these age groups adequately and will adversely affect both national and private budgets that need to cover that (44, 45). This problem is realistic, since older people suffer from more than one non-communicable disease or should be subjected to more than one surgical intervention accompanied by necessary laboratory analyses (46, 47). Also, the home care should not be forgotten, since this kind of health care is usually provided by family members (out-of-pocket expenditures) (48, 49).
Health systems are influenced by epidemiological transition and health financing, which affect the type of services needed. Health care expenditures are rising fast, faster than the global economy, becoming a huge global concern especially in the low- and middle-income countries (50, 51). WHO report on Universal Health Coverage issued on 2016 indicates that the world has spent almost 10% of GDP on health with an average per capita expenditure of US$1000.
More than 70% of health care costs relate to outpatient and inpatient treatment, medications, and medical supplies, which limits other types of care, such as prevention services or health administration services (52, 53). Recent findings about global burden of diseases and risk factors for them can be of large help in decision making concerning health expenditure rise and health investments (54, 55). These facts should be available for as much country as it is possible, especially concerning their economic level of development.
Health economy becomes of strong importance in the public health area, or even in the field of national policy. The results of studies in the field of economics, thanks to what they provide, can influence important decisions, such as the level of investment in health care, as part of GDP, and can help to solve existing problems in a better way (56, 57). Comparing the results with countries that have a similar health care system can help prevent the emergence of similar problems that are observed in those countries (58, 59). Increasing number of health care policymakers and managers has enabled health economics to become a tool for making allocation of resources more rational (60, 61).
Conclusions
Our study compared macroeconomic and health expenditure indicators of interest between selected Balkan and Eastern European countries in the period from 1995 to 2014. The results show that Greece and Slovenia have the largest median values of GDP per capita throughout the whole period and the largest increment trend was in Lithuania. The median value in OOP payment of THE was the highest in Albania and Ukraine, while the largest decrease in trend was noticed in Albania and Bosnia and Herzegovina. Bosnia and Herzegovina and Greece had the largest median value of THE as percentage of GDP in the observed period, while regression trend analysis showed that Serbia had the largest increase. Most of the countries showed a significant correlation between the observed indicators.
Data Availability Statement
The raw data supporting the conclusions of this article will be made available by the authors, without undue reservation.
Author Contributions
MS, NR, MJ, and BV: conception of work. MS, MJ, and BV: design of the work. VD-S, NR, MS, BV, and SV: the acquisition and analysis. MS, NR, BV, VD-S, and SV: interpretation of data. NR, BV, MS, and VD-S: drafted the work and substantively revised it. All authors read and approved the final manuscript.
Funding
The authors would like to express their gratitude to the Ministry of Education, Science and Technological Development of the Republic of Serbia for Grant Nos. 175014 and 175093, out of which this research project was partially financed.
Conflict of Interest
The authors declare that the research was conducted in the absence of any commercial or financial relationships that could be construed as a potential conflict of interest.
Abbreviations
GDP, gross domestic product; OOP, out-of-pocket spending; THE, total health expenditure; HFA, Health for All.
References
1. Stepovic M. GDP growth and health care expenditures worldwide. Open Pharmacoeconom Health Econ J. (2019) 7:9–18. doi: 10.2174/1874129001907010009
2. Wang KM. Health care expenditure and economic growth: Quantile panel-type analysis. Econ Model. (2011) 28:1536–49. doi: 10.1016/j.econmod.2011.02.008
3. Jakovljevic M, Camilleri C, Rancic N, Grima S, Jurisevic M, Grech K, et al. Cold war legacy in public and private health spending in Europe. Front Public Health. (2018) 6:215. doi: 10.3389/fpubh.2018.00215
4. Kutzin J. Bismarck vs. Beveridge: is There Increasing Convergence Between Health Financing Systems. 2011. Available online at: https://www.oecd.org/gov/budgeting/49095378.pdf (accessed 11 April 2020).
5. Gerlinger T, Schmucker R. A long farewell to the Bismarck system: incremental change in the german health insurance system. German Policy Studies. (2009) 5:3–20. doi: 10.1016/j.healthpol.2012.11.001
6. Chernichenko MY. Semashko HA the first people's commissar of health: a new century – new research horizons. History Med. (2014) 3:73–81. doi: 10.17720/2409-5583.t1.3.2014.38k
7. Arsentyev EV, Reshetnikov VA. To the biography of N A Semashko: the activities of the first Commissar of Health in 1920-1925. Hist Med. (2018) 3:183–92. doi: 10.3897/hmj.5.3.32480
8. Golinowska S, Sowa A. Health and morbidity in the accession countries. Country report: Poland. Brussels, European Network of Economic Policy Research Institutes;. ENEPRI research report No. 2 (2006). Available online at: http://www.enepri.org/files/AHEAD/Reports/WP2-Poland.pdf
9. Nemec J, Kolisnichenko N. Market-based health care reforms in Central and Eastern Europe: lessons after ten years of change. Int Rev Admin Sci. (2006) 72:11–26. doi: 10.1177/0020852306061611
10. Łyszczarz B. Public-private mix and performance of health care systems in CEE and CIS countries. Oeconomia Copernicana. (2016) 7:169–85. doi: 10.12775/OeC.2016.01139
11. Borda M. The role of private health care financing in the central and Eastern European countries. Ekonomika/Economics. (2008) 83:100–9. doi: 10.15388/Ekon.2008.17678
12. Jakovljevic MB. Resource allocation strategies in Southeastern European health policy. Eur J Health Econ. (2013) 14:153. doi: 10.1007/s10198-012-0439-y
13. World Health Assembly 66. Follow-up to the Political Declaration of the High-level Meeting of the General Assembly on the Prevention and Control of Non-communicable Diseases. (2013). Available online at: https://apps.who.int/iris/handle/10665/150161 (accessed February 15, 2020).
14. Przywara B. Projecting future healthcare expenditure at European level: drivers, methodology and main results. Eur Econ. (2010). doi: 10.2765/42844. Available online at: https://ec.europa.eu/economy_finance/publications/economic_paper/2010/pdf/ecp417_en.pdf
15. Schieber G, Maeda A. Health care financing and delivery in developing countries. Health Affairs. (1999) 18:193–205. doi: 10.1377/hlthaff.18.3.193
16. Arze del Granado J, Gupta S, Hajdenberg A. Is social spending procyclical? evidence for developing countries. World Dev. (2013) 42:16–27. doi: 10.1016/j.worlddev.2012.07.003
17. Lu C, Schneider MT, Gubbins P, Leach-Kemon K, Jamison D, Murray CJ. Public financing of health in developing countries: a cross-national systematic analysis. Lancet. (2010) 375:1375–87. doi: 10.1016/s0140-6736(10)60233-4
18. Dieleman J, Campbell M, Chapin A, Eldrenkamp E, Fan VY, Haakenstad A, et al. Evolution and patterns of global health financing 1995–2014: development assistance for health, and government, prepaid private, and out-of-pocket health spending in 184 countries. Lancet. (2017) 389:1981–2004. doi: 10.1016/s0140-6736(17)30874-7
19. Rancic N, Kovacevic A, Dragojevic-Simic V. Long term health expenditure changes in selected Balkan countries. Front Public Health. (2015) 3:152. doi: 10.3389/fpubh.2015.00152
20. Galbraith AA, Wong ST, Kim SE, Newacheck PW. Out-of-pocket financial burden for low-Income families with children: socioeconomic disparities and effects of insurance. Health Serv Res. (2005) 40:1722–36. doi: 10.1111/j.1475-6773.2005.00421.x
21. WHO. European Health for All databases (HFA-DB). Geneva (2020). Available online at: https://gateway.euro.who.int/en/datasets/european-health-for-all-database/ (accessed February 17, 2020).
22. Ortiz-Ospina E, Roser M. Financing Healthcare. (2017). Available online at: https://ourworldindata.org/financing-healthcare#citation (accessed May 22, 2020).
23. Mikulic M. Health Expenditure as a Percentage of GDP in Select Countries 2018. (2020). Available online at: https://www.statista.com/statistics/268826/health-expenditure-as-gdp-percentage-in-oecd-countries/ (accessed May 22, 2020).
24. Rice T, Rosenau P, Unruh L, Barnes A, Saltman R, Van Ginneken E. United States of America: health system review. Health Syst Trans. (2013) 15:1–431.
25. World Health Organization. Public Spending on Health: A Closer Look at Global Trends. (2018). Available online at: https://apps.who.int/iris/bitstream/handle/10665/276728/WHO-HIS-HGF-HF-WorkingPaper-18.3-eng.pdf?ua=1 (accessed February 15, 2020).
26. World Health Organization. Current Health Expenditure (CHE) as Percentage of Gross Domestic Product (GDP) (%). (2020). Available online at: https://apps.who.int/gho/data/view.main.GHEDCHEGDPSHA2011REGv?lang=en (accessed February 15, 2020).
27. OECD/European Union. Health Expenditure in Relation to GDP. (2018) doi: 10.1787/health_glance_eur-2018-30-en (accessed February 24, 2020).
28. Morgan D, Astolfi R. Health spending continues to stagnate in many OECD countries. OECD Health Work Papers. (2014) 68. http://dx.doi.org/10.1787/5jz5sq5qnwf5-en
29. Eurostat. Healthcare Expenditure Across the EU: 10% of GDP. (2020). Available online at: https://ec.europa.eu/eurostat/web/products-eurostat-news/-/DDN-20190904-12019 (accessed August 11, 2020).
30. World Health Organization (2019). Available online at: https://www.who.int/news-room/detail/20-02-2019-countries-are-spending-more-on-health-but-people-are-still-paying-too-much-out-of-their-own-pockets (accessed May 15, 2020).
31. World Health Organization. Out-of-Pocket Expenditure as a Percentage of Current Health Expenditure (CHE). (2020). Available online at: https://www.who.int/gho/health_financing/out_of_pocket_spending/en/ (accessed February 25, 2020).
32. Health System Tracker. (2016). Available online at: https://www.healthsystemtracker.org/indicator/access-affordability/out-of-pocket-spending/ (accessed February 26, 2020).
33. Our World in Data. (2014). Available online at:https://ourworldindata.org/grapher/share-of-out-of-pocket-expenditure-on-healthcare?region=Europe (accessed February 25, 2020).
34. Trading Economics. (2018). Available online at: https://tradingeconomics.com/united-states/gdp-per-capita (2018). (accessed February 15, 2020).
35. Macrotrends. (2020). Available online at: https://www.macrotrends.net/countries/USA/united-states/gdp-per-capita. (accessed February 20, 2020).
36. Wagstaff A, Eozenou P, Smitz M. Out-of-Pocket Expenditures on Health A Global Stocktake. (2019). Available online at:http://documents.worldbank.org/curated/en/404051554751713745/pdf/Out-of-Pocket-Expenditures-on-Health-A-Global-Stocktake.pdf (accessed February 25, 2020).
37. Bredenkamp C, Mendola M, Gragnolati M. Catastrophic and impoverishing effects of health expenditure: new evidence from the Western Balkans. Health Policy Plan. (2011) 26:349–56. doi: 10.1093/heapol/czq070
38. Alpern DJ, Stauffer MW, Kesselheim SA. High-cost generic drugs – implications for patients and policymakers. N Engl J Med. (2014) 371:1859–62. doi: 10.1056/NEJMp1408376
39. Rancic N, Kovacevic A, Dragojevic-Simic V. Long-term health expenditure changes in selected Balkan countries. Front. Public Health. (2015) 3:152. doi: 10.3389/fpubh.2015.0015
40. The World Bank. (2020). Available online at: https://data.worldbank.org/indicator/SH.XPD.CHEX.PC.CD. (accessed March 15, 2020).
41. Sawyer B, Cox C. How Does Health Spending in the U.S. Compare to Other Countries? Available online at: https://www.healthsystemtracker.org/chart-collection/health-spending-u-s-compare-countries/#item-start. (accessed March 15, 2020).
42. The World Bank. (2020). Available online at: https://data.worldbank.org/indicator/SH.XPD.OOPC.CH.ZS. (accessed March 15, 2020).
43. Jakovljevic M. Population ageing alongside health care spending growth. Srpski Arhiv. (2017) 145:534–9. doi: 10.2298/SARH160906113J
44. Jakovljevic M, Vukovic M, Fontanesi J. Life expectancy and health expenditure evolution in Eastern Europe – DiD and DEA analysis. Expert Rev Pharmacoeco Outcomes Res. (2016) 16:537–46. doi: 10.1586/14737167.2016.1125293
45. Jakovljevic M. The aging of Europe. The unexplored potential. Farmeconomia Health Econ Therapeut. Pathways. (2015) 16:89–92. doi: 10.7175/fe.v16i4.1220
46. Rancic N, Jakovljevic MB. Long term health spending alongside population aging in N-11 emerging nations. East Eur Bus Econ J. (2016) 2:2–26.
47. Eaton ML, Kennedy D. Innovation in Medical Technology: Ethical Issues and Challenges. Baltimore, MD: JHU Press. (2007)
48. Qendrim S. Cross-country Comparative Analysis of Healthcare Financing in Western Balkans: its Effect On Performance and Quality. (2013). Rochester Institute of Technology. Available online at: https://www.semanticscholar.org/paper/Cross-country-Comparative-Analysis-of-Healthcare-in-Sopjani/cf0ef36fa88945d5bf13bca4d724850afc9293ca (accessed 25 Mar 2020).
49. Jakovljevic M. Commentary: patient cost sharing and medical expenditures for the elderly. Front Pharmacol. (2016) 7:73. doi: 10.3389/fphar.2016.00073
50. Jakovljevic M, Potapchik E, Popovich L, Barik D, Getzen T. Evolving health expenditure landscape of the BRICS nations and projections to 2025. Health Econ. (2017) 26:844–52. doi: 10.1002/hec.3406
51. Jakovljevic M, Jakab M, Gerdtham U, McDaid D, Ogura S, Varavikova E, et al. Comparative financing analysis and political economy of noncommunicable diseases. J Med Econ. (2019) 22:722–7. doi: 10.1080/13696998.2019.1600523
52. WHO. Universal Health Coverage: An Affordable Goal for All. (2016). Available online at: https://www.who.int/mediacentre/commentaries/2016/universal-health-coverage/en/ (accessed March 19, 2020).
53. Kovačević A, Rancic N, Segrt Z, Dragojevic-Simic V. Pharmaceutical expenditure and burden of non-communicable diseases in Serbia. Front Pharmacol. (2016) 7:373. doi: 10.3389/fphar.2016.00373
54. Bloom DE, Cafiero ET, Jané-Llopis E, Abrahams-Gessel S, Bloom LR, Fathima S, et al. The Global Economic Burden of Noncommunicable Diseases. Geneva: World Economic Forum. (2011) Available online at: http://www3.weforum.org/docs/WEF_Harvard_HE_GlobalEconomicBurdenNonCommunicableDiseases_2011.pdf. (accessed March 19, 2020).
55. Jakovljevic M, Jakab M, Gerdtham U, McDaid D, Ogura S, Varavikova E, et al. Comparative financing analysis and political economy of noncommunicable diseases. J Med Econ. (2019) 22:722–7. doi: 10.1080/13696998.2019.1600523
56. Chalkidou K, Culyer AJ, Nemzoff C. Perspective in economic evaluations of health care interventions in low- and middle-income countries—one size does not fit all. CGD Policy Paper. (2018). Available online at: https://www.cgdev.org/publication/perspective-economic-evaluations-healthcare-interventions-low-and-middle-income. (accessed March 25, 2020).
57. Horton S, Gelband H, Jamison D, Levin C, Nugent R, Watkins D. Ranking 93 Health Interventions for Low- and Middle-Income Countries by Cost-Effectiveness. PLoS ONE. (2017) 12:e182951. doi: 10.1371/journal.pone.0182951
58. Neumann PJ, Sanders GD, Russell LB, Siegel JE, Ganiats TG. Cost Effectiveness in Health and Medicine (2016).
59. Culyer A, Chalkidou K, Teerawattananon Y, Santatiwongchai B. 2018 Rival Perspectives in Health Technology Assessment and Other Economic Evaluations for Investing in Global and National Health. Who Decides? Who Pays? (2018). doi: 10.12688/f1000research.13284.1
60. World Health Organization. Global Spending on Health: A World in Transition. (2019). Available online at: https://www.who.int/health_financing/documents/health-expenditure-report-2019.pdf?ua=1 (accessed March 22, 2020).
61. Tedros AG. All Roads Lead to Universal Coverage. (2017). Available online at: http://www.who.int/mediacentre/commentaries/2017/universal-healthcoverage/en/ (accessed March 25, 2020).
Keywords: health care, private health expenditure, public health expenditure, Balkan, Southeastern countries
Citation: Stepovic M, Rancic N, Vekic B, Dragojevic-Simic V, Vekic S, Ratkovic N and Jakovljevic M (2020) Gross Domestic Product and Health Expenditure Growth in Balkan and East European Countries—Three-Decade Horizon. Front. Public Health 8:492. doi: 10.3389/fpubh.2020.00492
Received: 13 June 2020; Accepted: 31 July 2020;
Published: 15 September 2020.
Edited by:
Sandra C. Buttigieg, University of Malta, MaltaReviewed by:
Martin Dlouhy, University of Economics, Prague, CzechiaTomasz Holecki, Medical University of Silesia, Poland
Copyright © 2020 Stepovic, Rancic, Vekic, Dragojevic-Simic, Vekic, Ratkovic and Jakovljevic. This is an open-access article distributed under the terms of the Creative Commons Attribution License (CC BY). The use, distribution or reproduction in other forums is permitted, provided the original author(s) and the copyright owner(s) are credited and that the original publication in this journal is cited, in accordance with accepted academic practice. No use, distribution or reproduction is permitted which does not comply with these terms.
*Correspondence: Nemanja Rancic, bmVjZTg0QGhvdG1haWwuY29t