 Xiaoxia Gao
 Qingxiang Zheng
 Xiumin Jiang
 Xiaoqian Chen
 Yanping Liao
 Yuqing Pan
- 1School of Nursing, Fujian Maternity and Child Health Hospital, Fujian Medical University, Fuzhou, China
- 2Fujian Maternity and Child Health Hospital, College of Clinical Medicine for Obstetrics and Gynecology and Pediatrics, Fujian Medical University, Fuzhou, China
Objective: To examine the effect of diet quality on the risk of gestational diabetes mellitus.
Methods: This review included cohort and case-control studies reporting an association between diet quality and gestational diabetes mellitus. We searched PubMed, Cochrane Library, Web of Science, Embase, PsycINFO, CINAHL Complete, Chinese Periodical Full-text Database, China National Knowledge Infrastructure, Chinese Biomedical Literature Database, and China Wanfang Database for studies published from inception to November 18, 2022. The Newcastle-Ottawa Scale was used for quality assessment, and the overall quality of evidence was assessed using the GRADEpro GDT.
Results: A total of 19 studies (15 cohort, four case-control) with 108,084 participants were included. We found that better higher diet quality before or during pregnancy reduced the risk of developing gestational diabetes mellitus, including a higher Mediterranean diet (OR: 0.51; 95% CI: 0.30–0.86), dietary approaches to stop hypertension (OR: 0.66; 95% CI: 0.44–0.97), Alternate Healthy Eating Index (OR: 0.61; 95% CI: 0.44–0.83), overall plant-based diet index (OR: 0.57; 95% CI: 0.41–0.78), and adherence to national dietary guidelines (OR: 0.39; 95% CI:0.31–0.48). However, poorer diet quality increased the risk of gestational diabetes mellitus, including a higher dietary inflammatory index (OR: 1.37; 95% CI: 1.21–1.57) and overall low-carbohydrate diets (OR: 1.41; 95% CI: 1.22–1.64). After meta-regression, subgroup, and sensitivity analyses, the results remained statistically significant.
Conclusions: Before and during pregnancy, higher diet quality reduced the risk of developing gestational diabetes mellitus, whereas poorer diet quality increased this risk.
Systematic review registration: https://www.crd.york.ac.uk/PROSPERO/, identifier: CRD42022372488.
1. Introduction
Gestational diabetes mellitus (GDM) is the most prevalent medical illness in pregnancy and is defined as glucose intolerance of varying degrees, with onset or first detection during pregnancy (1). The average prevalence of GDM ranges from 9 to 30%, and up to 31.5% in some areas (2, 3). The prevalence of GDM has been progressively increasing due to changes in lifestyle and dietary structure (4). GDM carries significant short- and long-term health concerns for both mothers and their children. Mothers are at an increased risk of adverse pregnancy outcomes, such as premature rupture of membranes, infection, preterm labor, gestational hypertension, pre-eclampsia, excess amniotic fluid, and cesarean section; in severe cases, they may suffer ketoacidosis and have a lifetime risk of type 2 diabetes mellitus (T2DM), which is up to 20 times higher than that in normal pregnant women (5, 6). The offspring may have a significantly increased risk of hypoglycemia, macrosomia, neonatal epigenetic alterations, neonatal respiratory distress syndrome, and in severe cases, they may suffer high risk of fetal death (5, 6). In addition, offspring will carry a lifetime risk of obesity, and T2DM and metabolic syndrome are more common for them (7, 8). As a result, it is crucial for health care providers to work with pregnant women to prevent the development of GDM.
GDM has many influencing factors, including race or ethnicity, family history of diabetes mellitus, age at delivery, obesity, overweight, and lack of exercise (9); dietary factors also play an important role in its development (10). Diet quality is defined as the degree of adherence to dietary patterns recommended in dietary guidelines or indicators of a varied diet (11). In contrast to single food or nutrient intake, diet quality has been demonstrated to be a reasonable and important measure of total nutritional intake in several studies (12–14), and is a promising tool for examining the relationship between overall diet and diseases (15). Therefore, high diet quality reflects the achievement of more optimal nutrient intake profiles and a lower risk of diet-related non-communicable diseases (including T2DM) (16). A higher-quality diet is an important protective factor for diabetes (17) and is negatively associated with fasting glucose and glycated hemoglobin in adults with T2DM (18). A high-quality diet during pregnancy can help to decrease the risk of pathoglycemia, hypertension, pre-eclampsia, and excessive weight gain (19, 20); poor diet quality increases the risk of preterm birth, neonatal intensive care unit admissions, small for gestational age babies, low birth weight, and congenital heart defects (21, 22). However, the role of diet quality in the risk of GDM development has not been systematically evaluated. In addition, studies have found that the quality of a woman's diet does not change significantly before or during pregnancy (23). Schwingshackl et al. (24) encourages all women of childbearing age to adopt healthier eating behaviors, even before they become pregnant. Therefore, this study aimed to systematically review the available evidence regarding the relationship between diet quality and GDM before or during pregnancy.
2. Methods
The study protocol was registered in PROSPERO (no.: CRD42022372488; https://www.crd.york.ac.uk/PROSPERO/).
2.1. Search strategy
We searched PubMed, Cochrane Library, Web of Science, Embase, PsycINFO, CINAHL Complete, Chinese Periodical Full-text Database, China National Knowledge Infrastructure, Chinese Biomedical Literature Database, and China Wanfang Database for studies published from inception to November 18, 2022. In addition, references to relevant studies and review articles were manually searched to avoid missing publications. See Supplementary Table 1 for the search strategies.
2.2. Selection criteria
The inclusion criteria for this study were as follows: (1) Population: women before or during pregnancy who were involved in studies related to diet quality and GDM; (2) Exposure: studies that included diet quality as the exposure of interest, such as the Mediterranean diet (MD), dietary approaches to stop hypertension (DASH), Alternate Healthy Eating Index (AHEI), or other diet quality indices or scores; diet quality indices or scores referenced were based on established national or regional dietary guidelines; (3) Outcome: GDM; (4) Study design: cohort and case-control study; (5) Other inclusion criteria: results reported as the odds ratio (OR) or risk ratio (RR) with a 95% confidence interval (CI); studies using multiple dietary assessment methods were included.
The exclusion criteria were as follows: (1) studies with no diet quality scores but only described dietary patterns, such as clusters, factors or reduced rank regression analysis; (2) studies that examined single nutrients, foods, or food groups; (3) randomized controlled trials, cross-sectional and qualitative studies; (4) studies involving animals; (5) unpublished data and gray literature, including conference abstracts, papers, and patents.
2.3. Study selection
After duplicate removal, titles and abstracts were screened and full-text articles were obtained for further assessment. Study selection was independently conducted by two reviewers (Gao and Zheng). Any disagreement between the reviewers was discussed with a third reviewer (Jiang), who specialized in studying women's diets during the perinatal period. The PRISMA flowchart (http://www.prisma-statement.org/PRISMAStatement/FlowDiagram.aspx) were created to detail the inclusion/exclusion process.
2.4. Quality assessment
Two independent reviewers assessed the quality of included studies using the Newcastle-Ottawa Scale (NOS) (25). The NOS contains nine items categorized into three dimensions, including selection, comparability, and depending on the study type, outcome (cohort studies) or exposure (case-control studies). For each item, a series of response options were provided. The top-quality studies received a maximum score of one for each item, with the exception of the comparability item that received two scores. Each study had a maximum score of nine. Studies with a score ≥7 were considered to have a low risk of bias, and studies with a score of 3–6 were considered to have a moderate risk of bias. Studies with a high risk of bias were excluded from the meta-analysis. Any disagreement between the reviewers (Gao and Zheng) was resolved by a third reviewer (Jiang).
The overall quality of evidence for the prevalence of GDM in the diet quality of included studies was assessed using GRADEpro Guideline Development Tool (GDT) software based on the principles of Grading of Recommendations, Assessment, Development, and Evaluations (GRADE) (26). To assess the overall quality of the evidence, each outcome in GRADE was evaluated under various factors, such as the risk of bias, directness of evidence, consistency and precision of results, risk of publication bias, magnitude of the effect, dose-response gradient, and influence of residual plausible confounding factors. The final overall GRADE may be high, moderate, low, or very low depending on the scoring of the GRADE factors (27). The online version of the GRADE software was accessed and utilized for GRADE analysis.
2.5. Data extraction
Data extracted from each study included the first author, country, study design, follow-up duration/time, sample size, participants, dietary assessment tools, diagnostic criteria, key findings, OR/RR, and adjustment variables. For studies providing multiple estimates, we used the most complex model (i.e., including the largest number of confounders). If there was any disagreement during the data extraction, two researchers (Gao and Zheng) reviewed the full text and discussed it with a third reviewer (Jiang).
2.6. Data synthesis
The OR was used to analyze the results of this study. We utilized the following calculation from Deeks and Altman to convert values provided as RR to OR, where pc is the usual occurrence rate without treatment (i.e., event rate in the control group) (28):
ORs were log-transformed (i.e., lnOR) for analysis. Between-study heterogeneity was examined using the Q-test and I2 index. When I2 ≥ 50, the random effects model was used; otherwise, the fixed effects model was used.
For the purposes of the study, we conducted a subgroup analysis of the dietary assessment tools, types of participants (pregnancy or pre-pregnancy), and study design (cohort or case-control study). If significant heterogeneity remained after the analyses, we used subgroup analysis on study quality (low or moderate risk of bias) and country (developed or developing country) to identify the source of heterogeneity. Meta-regression analysis was used to identify the impact of adjustment variables on the study results (if there were more than 10 included studies); if P < 0.05, subgroup analysis was used for further exploration.
Publication bias was assessed using Begg's and Egger's tests if more than 10 studies used the same diet quality assessment tool. Sensitivity analyses were performed to confirm the stability of the overall results (29). All statistical analyses were conducted using the STATA software (version 14.0).
3. Results
3.1. Study selection
After removing duplicates, we screened the titles and abstracts of 2,429 articles for relevance. A total of 144 studies were identified as potentially eligible, and 19 were ultimately included in this systematic review. No additional articles were identified in the reference list. A flow chart is shown in Figure 1.
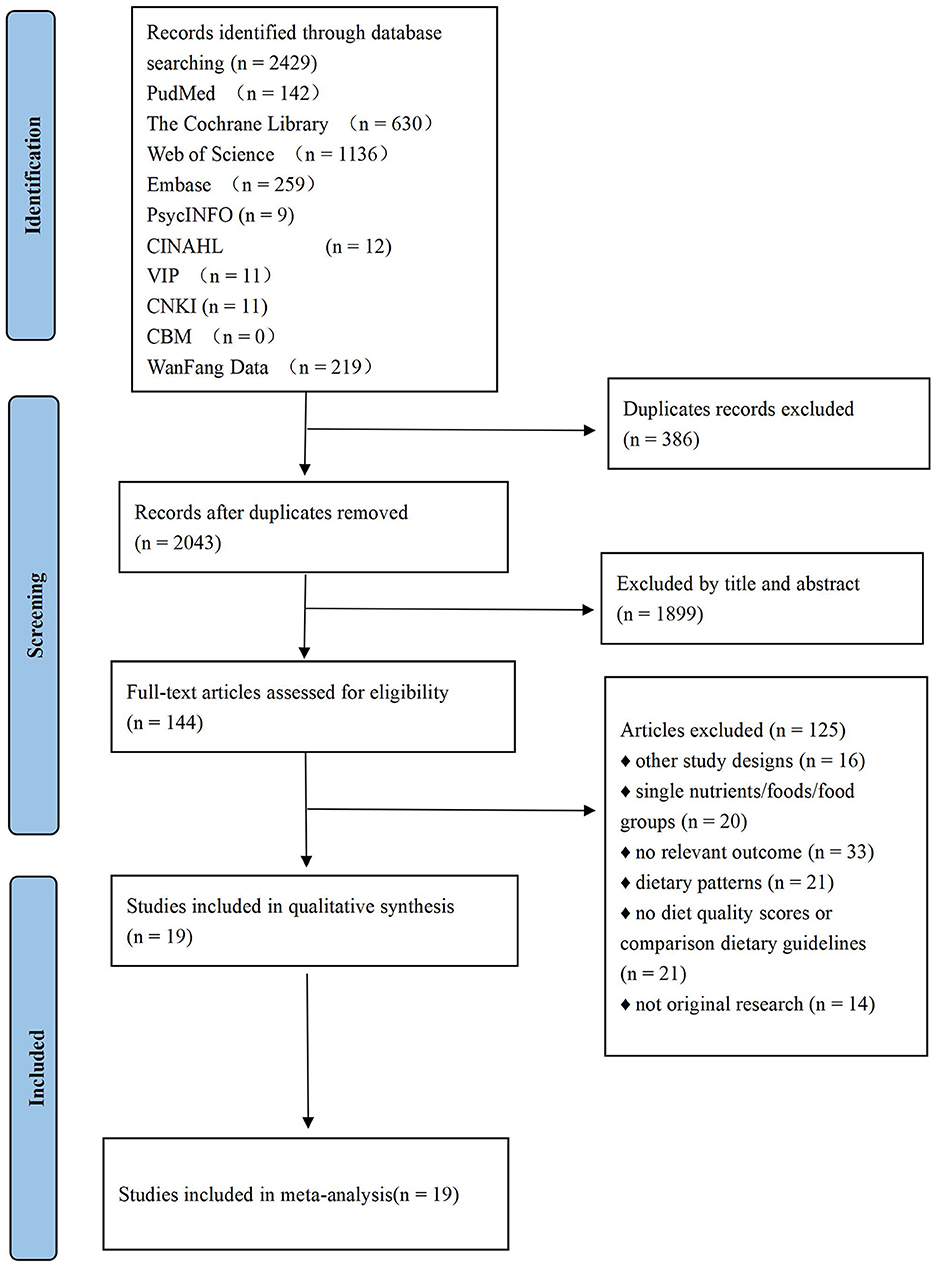
Figure 1. Flow diagram of included studies.
3.2. Study characteristics
The 19 included studies were published between 2012 and 2022 and included 108,084 study participants. Six studies were conducted in the United States (30–35), five in China (36–40), three in Iran (41–43), and the remaining in Japan (44), Spain (45), Iceland (46), Australia (47), and Finland (48). Six studies included pre-pregnancy (30, 31, 34, 44, 45, 47), and the remaining were pregnancy. The reported GDM diagnostic methods included a 100 g (n = 3) (34, 42, 45) and 75 g (n = 8) (36–40, 44, 46, 48) oral glucose tolerance test (OGTT), a combination of these (n = 5) (32, 35, 41, 43, 47), or were extrapolated from medical records (n = 3) (30, 31, 33).
In addition, the predominant dietary collection tool was the validated FFQ (n = 14). A total of eight diet quality assessment tools were included: one for Group A (i.e., the higher the diet score, the higher the diet quality) and the other for Group B (i.e., the higher the diet score, the worse the diet quality). We systematically evaluated these two groups separately. Group A included the MD, DASH, AHEI, overall plant-based diet index (overall PDI), and dietary guidelines (including China and Iceland); Group B included overall dietary inflammatory index (overall DII) and overall low-carbohydrate diets (overall LCD). Three studies simultaneously used three diet assessment tools (30, 35, 41). The characteristics and key findings of the eligible studies are presented in Table 1 and Supplementary Table 2.
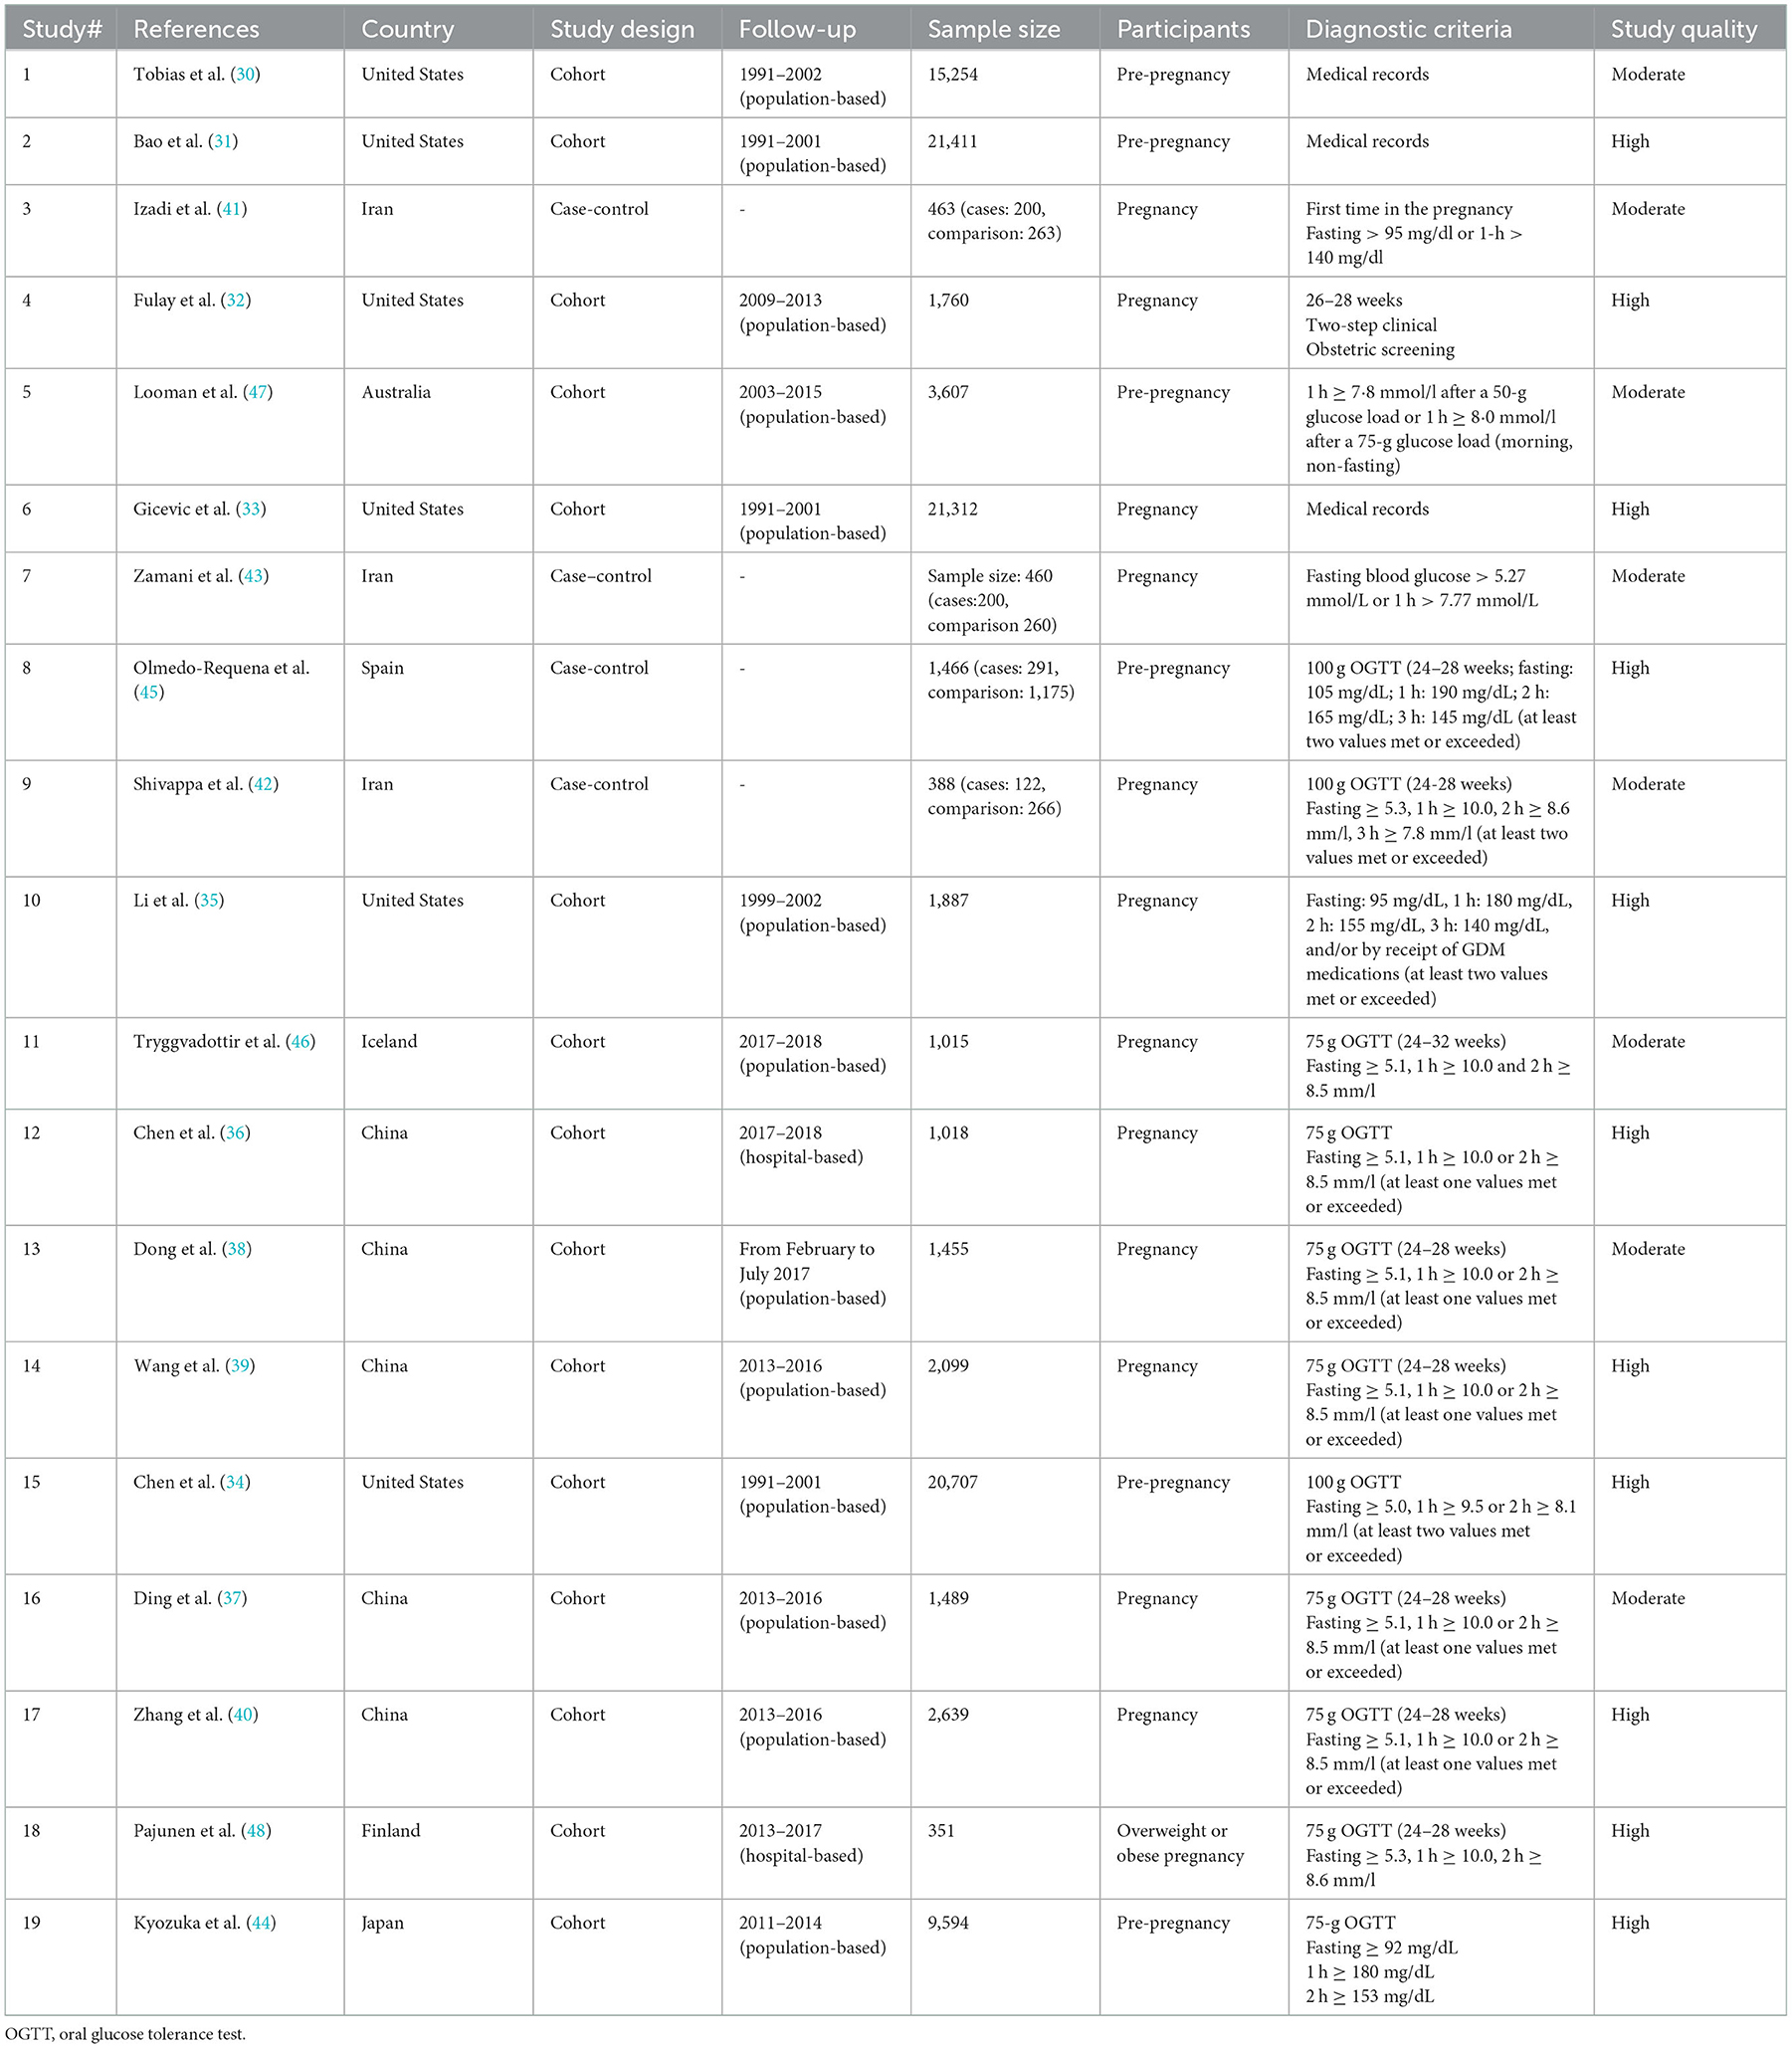
Table 1. Eligible study characteristics.
We observed that most studies adjusted for age and body mass index (BMI; 89.47 and 84.21%, respectively), and only a few studies adjusted for gestational weight gain (GWG), alcohol use, and socioeconomic status (15.79, 21.05, and 26.32%, respectively; Supplementary Figure 1).
3.3. Quality and GRADE assessment
The eligible studies included 15 cohort studies and four case-control studies. Eleven studies had a low risk of bias [10 cohort studies (31–36, 39, 40, 44, 48) and one case-control study (45)], and eight studies had a moderate risk of bias [five cohort studies (30, 37, 38, 46, 47) and three case-control studies (41–43)] (Figure 2).
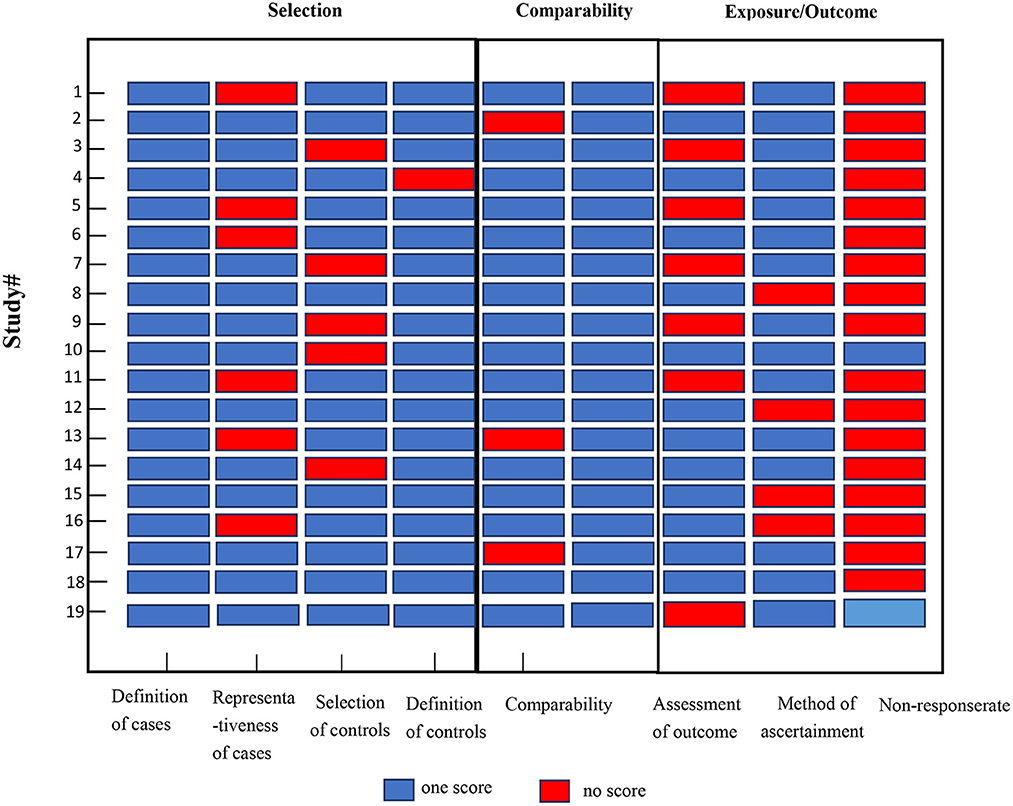
Figure 2. Quality assessments of the included studies. Study # is the same as in Table 1.
In the GRADE analysis, in Group A, the inconsistency domain was downgraded by two levels because of the presence of considerable heterogeneity between the included studies (I2 = 91.1%). We upgraded one level in the influence of residual plausible confounding factors because of the use of the most complex model. No serious issues were observed in the risk of bias, indirectness, and imprecision domains. The publication bias domain was downgraded, and there were no other additional factors. The overall GRADE recommendation in Group B (seven cohort) was “low-quality” which indicates that the true effect may be substantially different from the estimate of the effect; however, the rest were “very low-quality” which indicated that “any estimate of effect observed is very uncertain” (Table 2).
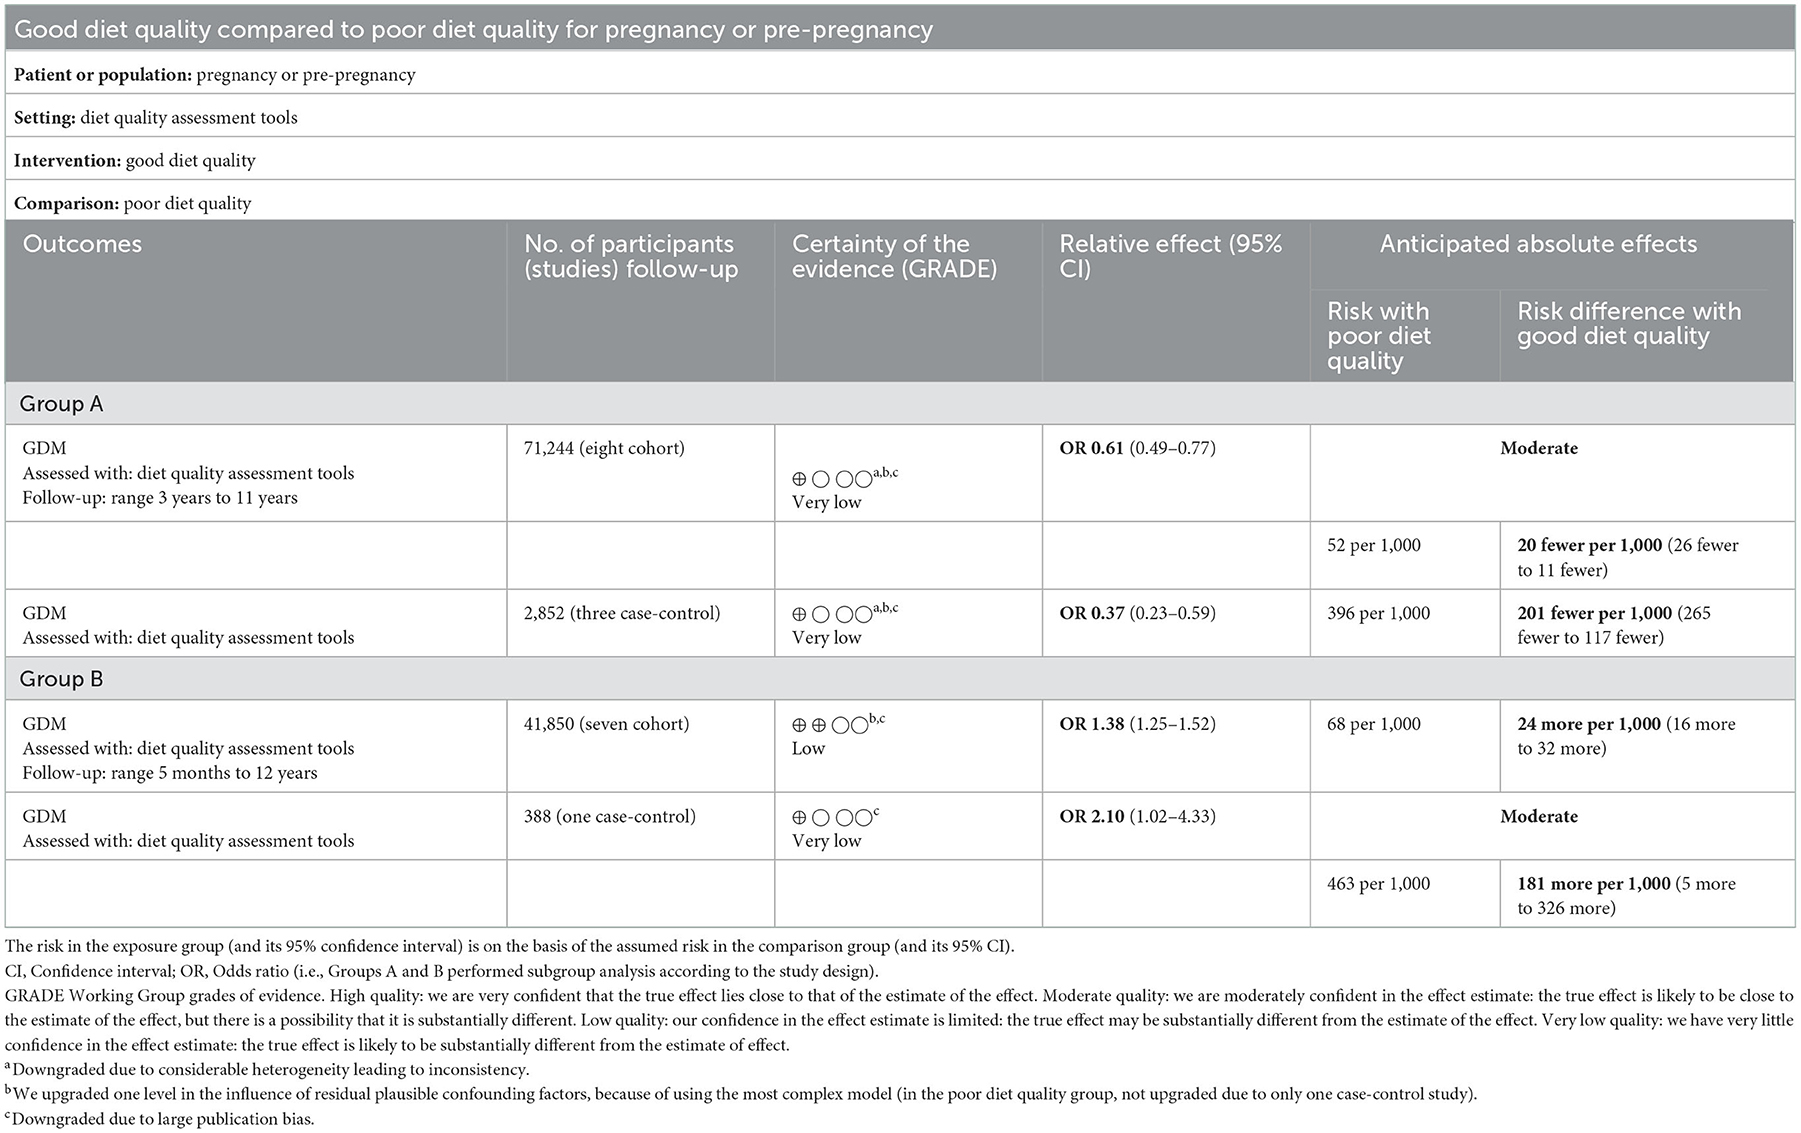
Table 2. GRADE assessment of the included studies.
3.4. Meta-analysis
3.4.1. Group A effects on GDM
The pooled effect size of 11 studies (30, 32–35, 37, 39, 41, 43, 45, 46) (including six assessment tools) indicated that there was a significant inverse association between high-quality diet and risk of GDM (OR: 0.54, 95% CI: 0.43–0.68, I2 = 91.6%, random effects model; Figure 3). Subgroup analysis based on dietary assessment tools indicated that the overall PDI (OR: 0.57, 95% CI: 0.41–0.78, I2 = 42.4%), DASH (OR: 0.66, 95% CI: 0.44–0.97, I2 = 90%), AHEI (OR: 0.61, 95% CI: 0.44–0.83, I2 = 65.9%), MD (OR: 0.51, 95% CI: 0.30–0.86, I2 = 82.9%), and dietary guidelines (OR: 0.39, 95% CI: 0.31–0.48, I2 = 0.0%) were all inversely associated with the risk of GDM. The results of subgroup analysis by participants showed that high-quality diet was inversely associated with GDM in both pregnancy and pre-pregnancy (OR: 0.46, 95% CI: 0.31–0.67, I2 = 93.9%; OR: 0.73, 95% CI: 0.66–0.81, I2 = 0.0%, respectively). A subgroup analysis based on the study design indicated that heterogeneity could not be eliminated (I2 = 71%). A subgroup analysis of countries and study quality was conducted to determine the main parameters involved in heterogeneity. After stratification by country, between-study heterogeneity was removed in both subgroups (I2 = 29.9%); however, heterogeneity could not be eliminated through stratification of study quality (I2 = 85.7%; Table 3).
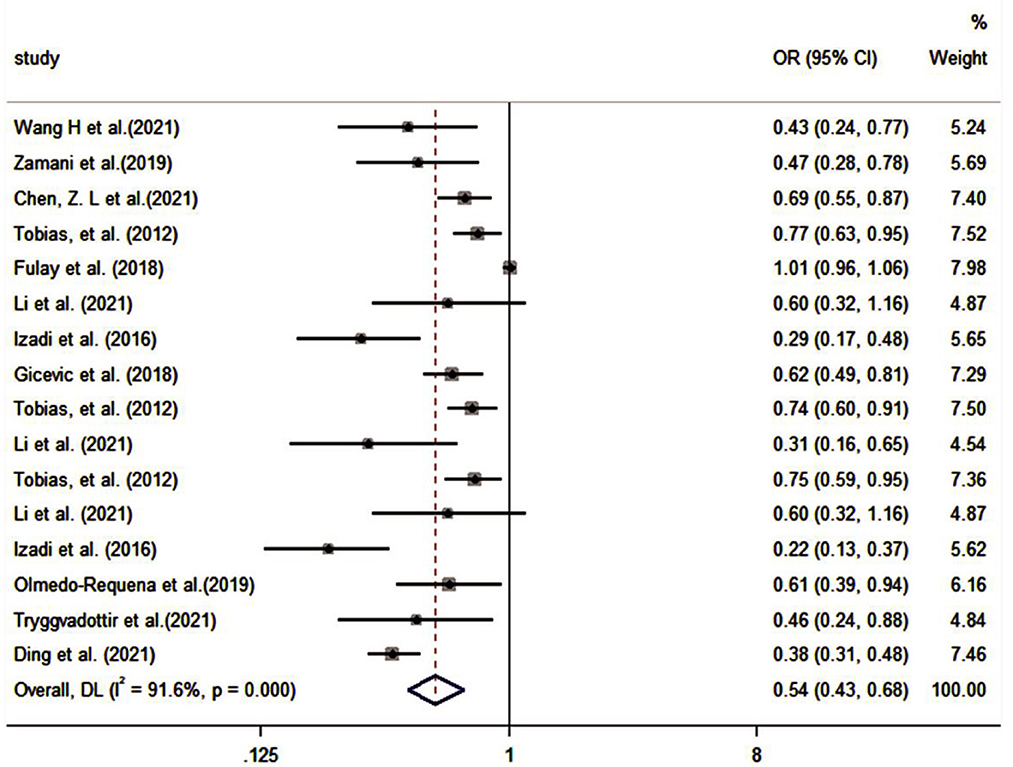
Figure 3. Forest plot for the association of the Group A with GDM (weights are from random-effects model).
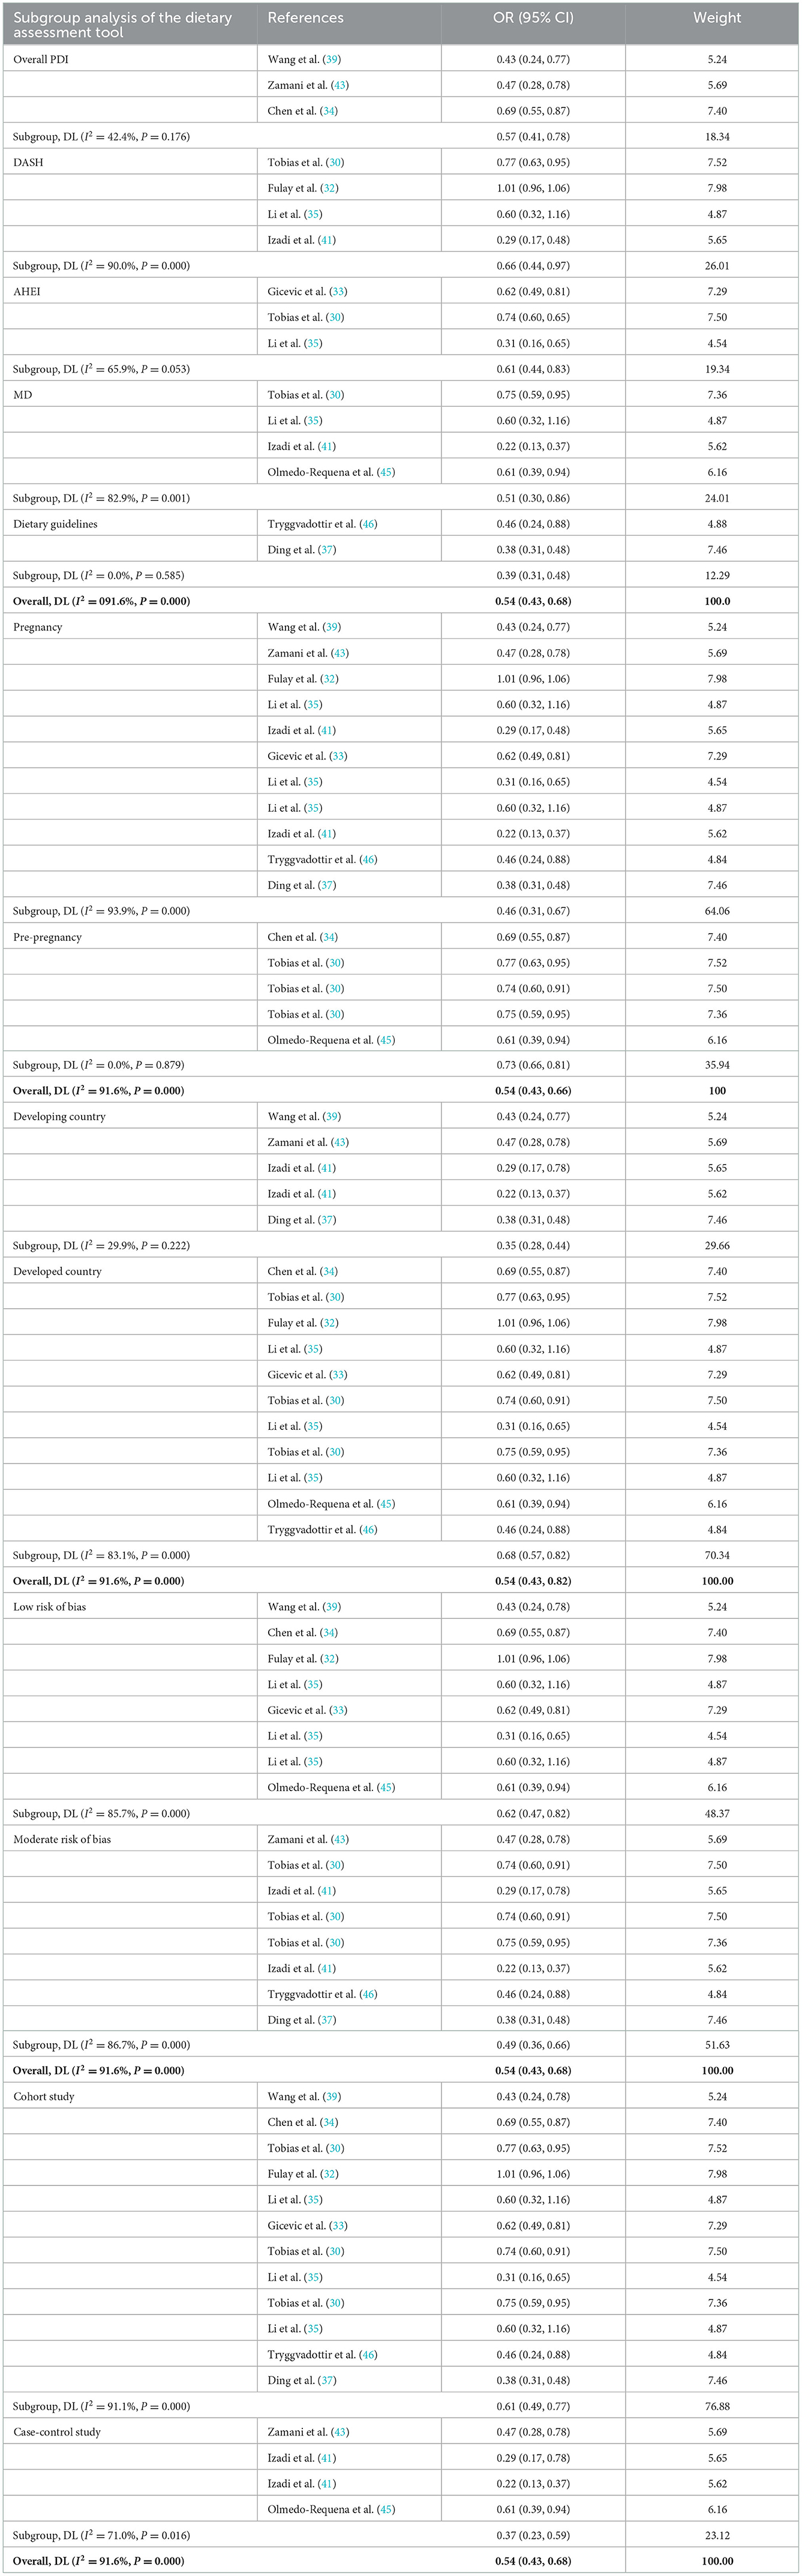
Table 3. Subgroup analysis of the Group A (including dietary assessment tools, participants, country, study quality, and study design).
We used meta-regression analysis for the adjustment variables (race or ethnicity, age, BMI, education, socioeconomic status, physical activity, smoking status, alcohol status, gravidity, family history of diabetes, energy intake, and GWG until the time of the study). The meta-regression analysis showed that the adjustment variables had an impact on the study results (Supplementary Table 3). Subgroup analysis of these adjustment variables indicated that physical activity, family history of diabetes, gravidity and socioeconomic status eliminated inter-group heterogeneity (0, 0.5, 8.7, and 34.1%, respectively; Supplementary Table 4).
MD and DASH were the most used diet quality assessment tools in the included studies (< 5 studies), and the significance of funnel plot asymmetry could not be tested. The results of the sensitivity analysis performed on Group A showed that the results of the systematic evaluation were reliable (Figure 4).
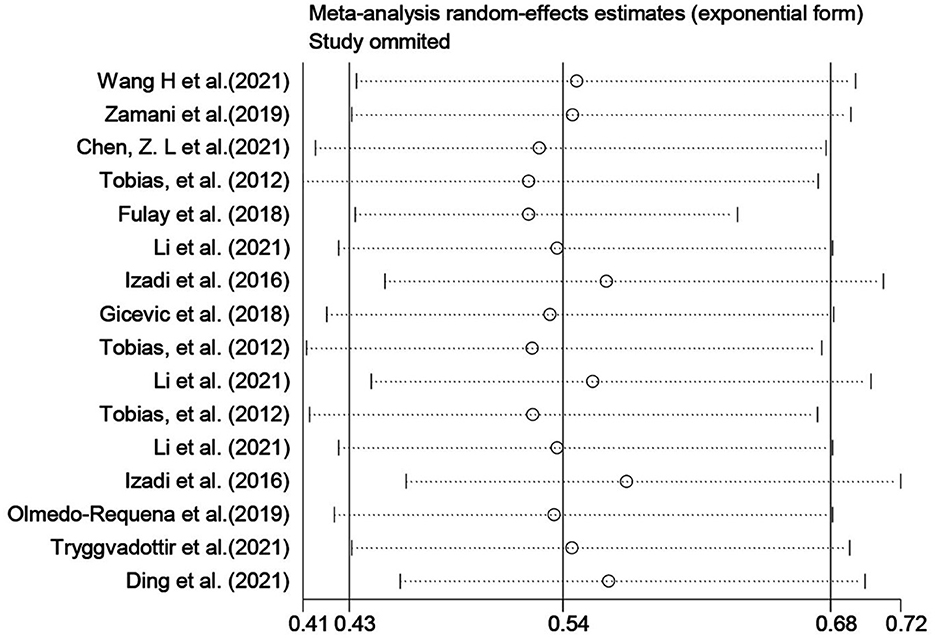
Figure 4. Group A sensitivity analysis.
3.4.2. Group B effects on GDM
The pooled effect size of eight studies (including two assessment tools) indicated that there was a significantly positive association between poor diet quality and GDM (OR: 1.39, 95% CI: 1.26–1.53, I2 = 0.0%, the fixed effects model; Figure 5). Subgroup analyses were based on dietary assessment tools, indicating that both overall LCD and DII were positively associated with GDM (OR: 1.41, 95% CI: 1.22–1.64, I2 = 0.0%; OR: 1.37, 95% CI: 1.21–1.57, I2 = 24.5%, respectively). Subgroup analyses were conducted for pregnancy and pre-pregnancy, and the results indicated that both were positively associated with GDM (OR: 1.37, 95% CI: 1.21–1.56, I2 = 0.0%; OR: 1.41, 95% CI: 1.21–1.65, I2 = 22.1%; respectively). Subgroup analysis based on study design indicated that both cohort and case-control were positively associated with GDM (OR: 1.38, 95% CI: 1.25–1.52, I2 = 0.0%; OR: 2.10; 95% CI: 1.02–4.33, I2 = 0%; respectively; Table 4).
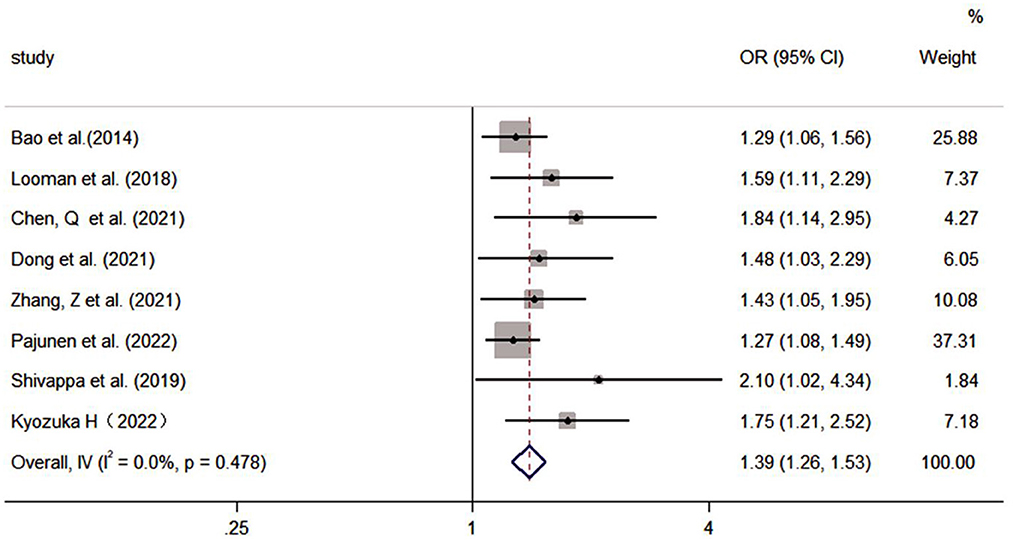
Figure 5. Forest plot for the association of the Group B with GDM.
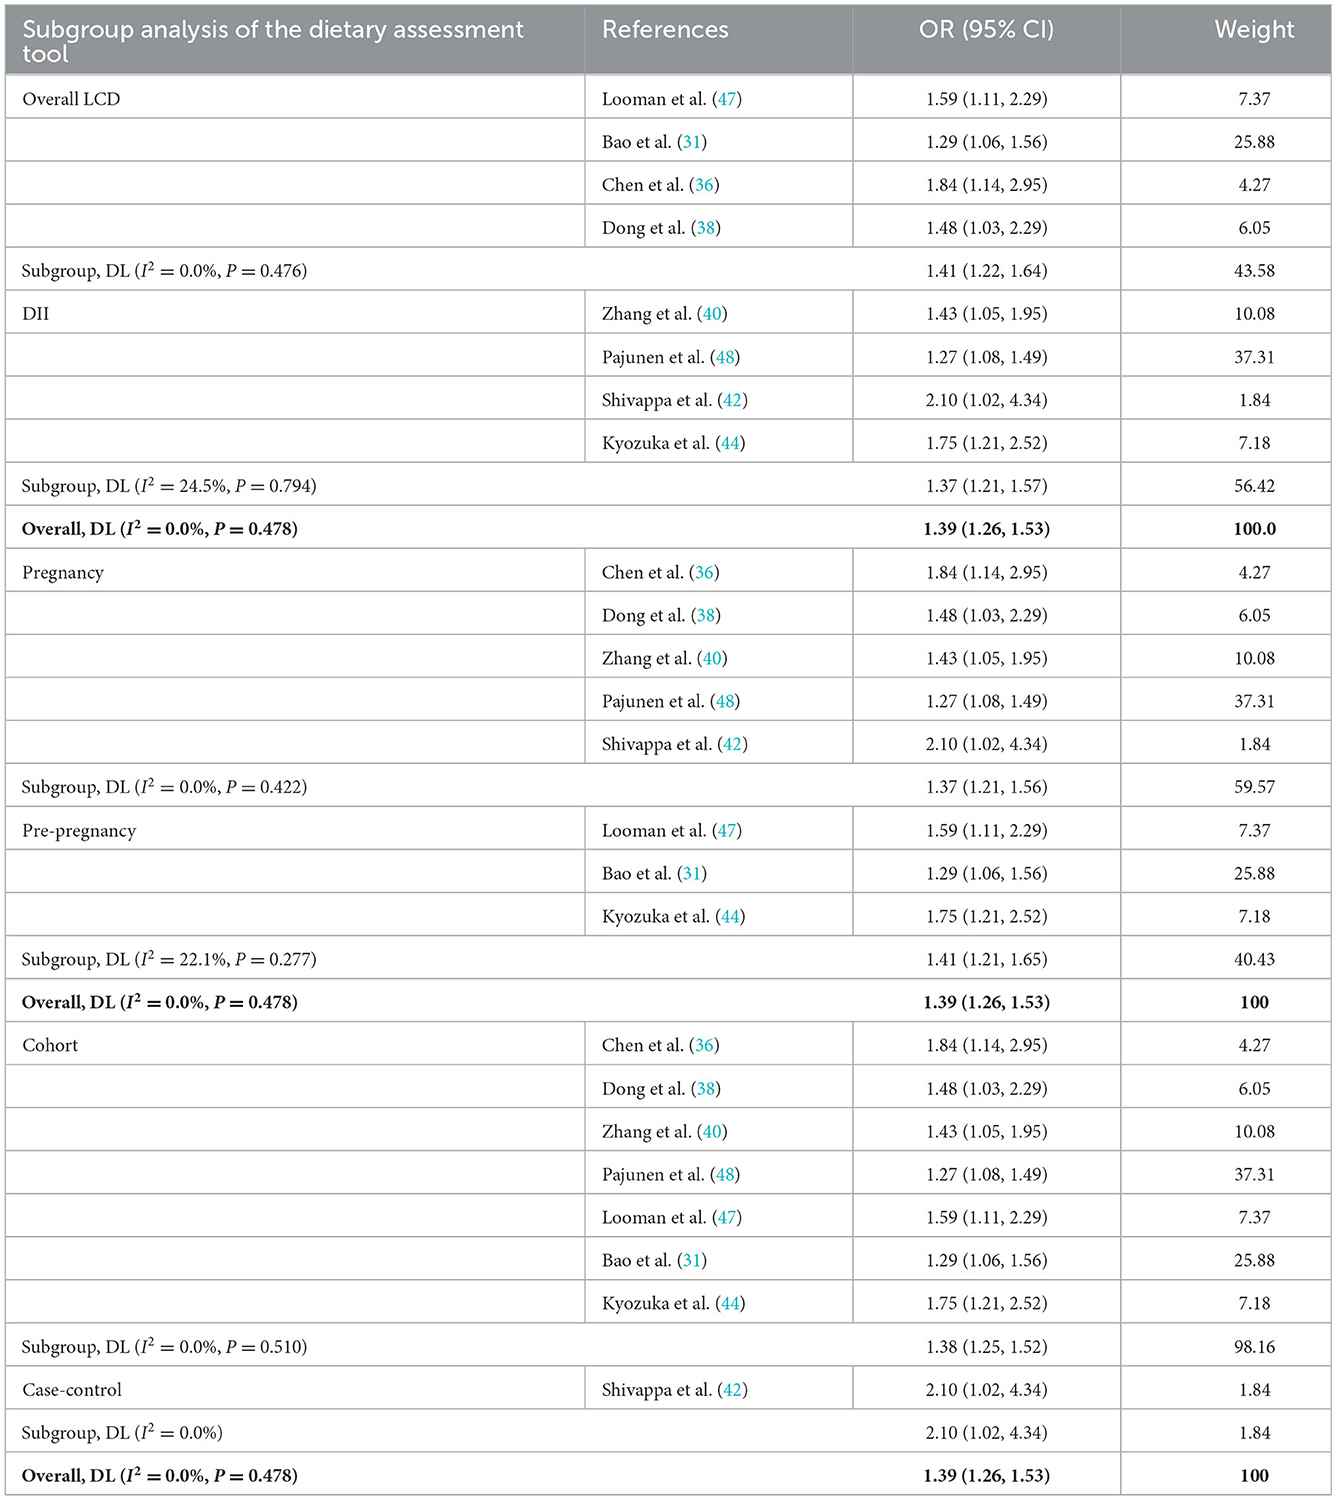
Table 4. Subgroup analysis of the Group B (including dietary assessment tools, participants, and study design).
The results of the sensitivity analysis were performed on Group B, showed that the results of the systematic evaluation were reliable (Figure 6).
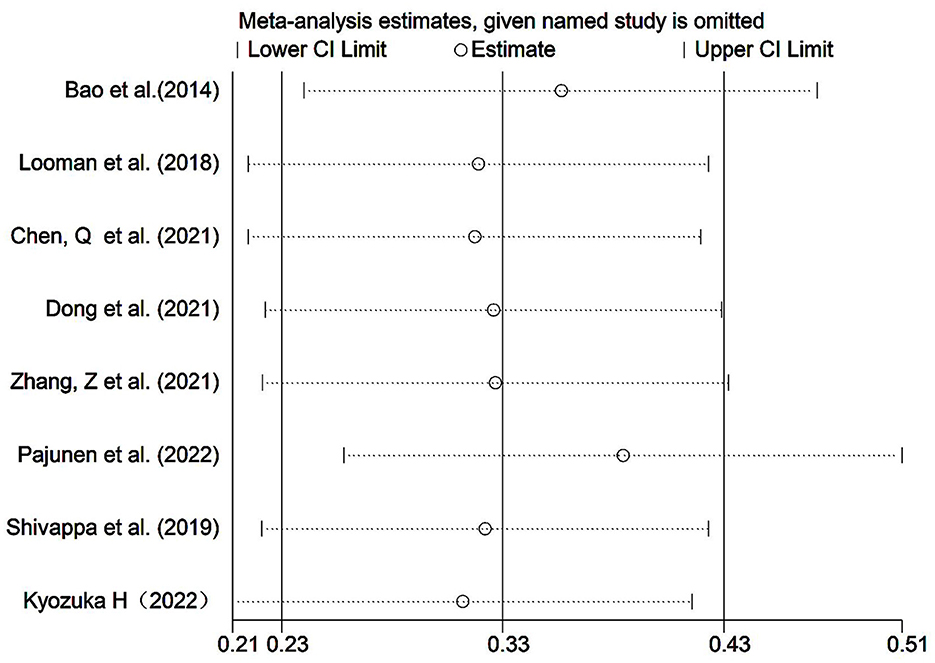
Figure 6. Group B sensitivity analysis.
4. Discussion
This study provides a systematic review and summary of the existing literature on the relationship between diet quality and GDM risk. The results, which included 19 studies (108,084 participants) with a total of eight diets, demonstrated that higher quality diet (MD, DASH diet, AHEI, PDI, or adherence to national dietary guidelines) before or during pregnancy reduced the risk of GDM, whereas poorer diet quality (higher DII or LCD diet) was associated with a high risk of GDM.
Although the exact molecular mechanism remains to be elucidated, the results of this study are biologically plausible. As shown in Table 5, high diet quality was mainly characterized by a higher intake of fruits, vegetables, legumes, and whole grains and a lower intake of red meat, processed meat, and trans fats. Vegetables and fruits are rich in antioxidants, fiber, polyunsaturated fatty acids, and micronutrients that can reduce glucose absorption, increase insulin secretion, and improve insulin sensitivity to assist glucose metabolism (49). Whole grain foods provide more nutrients, fiber, and phytochemicals, which serve to increase satiety, prolong the time for food to go through the digestive system, promote gut health, and reduce the glycemic response (50, 51). Vegetables, fruits, and whole grains can be directly or indirectly involved in the management of intestinal inflammation by altering intestinal flora and reducing the systemic inflammatory response (52). In contrast, red and processed meats are rich in saturated fat, hemoglobin, iron, nitrosamines, and other compounds associated with β-cell destruction, oxidative stress, insulin resistance, and GDM (53). In addition, such foods promote inflammation, alter cellular metabolic processes in the adipose tissue, liver, and pancreas, and increase the inflammatory response in GDM (54, 55).

Table 5. Dietary characteristics.
Studies have shown that dietary patterns (i.e., increased intake of higher-quality foods and reduced intake of poor-quality foods) are associated with a lower risk of GDM before and/or during pregnancy (56). Healthier eating patterns like the MD, DASH and AHEI diets can lower the risk of GDM by 15–38% (57). In contrast, a diet that is high in added sugars and organ meats, and low in fruit, vegetables, and seafood (51), a low-carbohydrate pre-pregnancy diet (58), and non-compliance with national dietary guidelines (19) were associated with a higher risk of GDM. Our findings are similar. Research on food for the prevention of GDM has received a lot of attention and has shown some promise. However, studies have shown that pre-pregnant and pregnant women may not meet the minimum dietary recommendations (59); the adherence to all food types during pregnancy even decreased (60). In conclusion, although women of childbearing age and pregnant women were given varied nutritional or eating advice, there were still grounds for concern regarding the actual quality of their diet. Yu et al. (61) recommended that health practitioners or policymakers should tailor strategies to the quality level of women's diets.
In contrast to dietary patterns, dietary quality assessment can combine large amounts of dietary data into a practical dietary indicator, thereby increasing the feasibility of translating food intake into daily food consumption and providing visualization of the intake of different food groups (62). Studies have shown that stress in women of childbearing age is inversely associated with poor diet quality (63). Borge et al. (64) found a positive association between better maternal diet quality during pregnancy and functioning of the child. A high dietary quality is a strong predictor of chronic diseases (all-cause mortality, cardiovascular disease, and T2DM) (65, 66). However, only a few studies have examined the relationship between diet quality and GDM. This systematic research discovered that high quality diet reduced the risk of developing GDM. As a result, assessment of diet quality can have the potential to be a quick and easy way to screen for dietary habits associated with GDM before or during early pregnancy.
Donazar-Ezcurra et al. (67) found that, compared to pre-pregnancy, healthy dietary measures adopted during pregnancy seem to be ineffective because they require more time to properly curb the development of GDM. However, similar to the results of a previous systematic review (19, 68), we found that high quality diet before and during pregnancy was beneficial for preventing GDM. At present, the well-documented risk factors for GDM include advanced maternal age, family history of diabetes, having a macrosomic baby, non-Caucasian race/ethnicity, being overweight or obese, and cigarette smoking (69). This study found that the impacts of adjustment variables such as family history of diabetes, socioeconomic status, physical activity, and gravidity on the risk of developing GDM should be considered when systematically evaluating outcome analysis.
Some limitations of this meta-analysis should be considered. First, studies were observational, making causal inferences difficult. Although the studies adjusted for some confounders, the possibility of residual confounding cannot be ruled out completely. Most studies accounted for maternal age, BMI, and family history of diabetes; however, most of the included studies did not adjust for GWG, socioeconomic or alcohol status, previous macrosomia, or polycystic ovary syndrome, which may be important risk factors for GDM (70) (Supplementary Figure 1). Secondly, the most studied countries (61%) were the United States and China, where populations have different dietary habits. Although many studies assessed dietary intake with validated measurement tools (e.g., FFQ), these dietary data were self-reported. Additionally, the timing of the dietary data assessment was heterogeneous. We did not know how much time elapsed between the assessment of diet quality and the diagnosis of GDM; in some studies, diet was assessed years before pregnancy, and in others, it was assessed during pregnancy. Finally, no evidence of publication bias based on Egger's test was found in this meta-analysis.
We suggest the following recommendations for future studies. During the sampling and survey phases, studies should be conducted in diverse populations with varying racial/ethnic backgrounds, socioeconomic status, BMI ranges, and diet culture. Research should improve the collection methods of food intake, which can combine contemporary Internet technology such as applets and real-time recording, to capture the complexity of dietary habits more accurately. During the design and analysis phase, appropriate analytical methods should be used, and adjustments for covariates should be demonstrated through causal considerations and graphs, particularly for physical activity, gravidity, and socioeconomic status. Comparability studies should be improved by increasing the uniformity of the timing of dietary assessments and the outcomes measured. When possible, adequately powered randomized controlled trials should be conducted to support better causal inferences. In addition, one should investigate what are the micronutrient levels in women of childbearing age or in pregnant women with high or poor dietary quality.
5. Conclusions
In conclusion, positive association between better maternal diet quality during pregnancy and functioning of the child. However, only a few studies have examined the relationship between diet quality and GDM. This study found that higher diet quality (MD, DASH diet, AHEI, PDI, or adherence to national dietary guidelines) before or during pregnancy reduced the prevalence of GDM; while poorer diet quality (higher DII or LCD) increased the risk of developing GDM. And then, the assessment of diet quality can have the potential to be a quick and easy way to screen for dietary habits associated with GDM before or during early pregnancy. Further studies are necessary to ascertain the relationship between food quality and GDM.
Data availability statement
The original contributions presented in the study are included in the article/Supplementary material, further inquiries can be directed to the corresponding author.
Author contributions
XG, QZ, and XJ conceived and designed the experiments. XG and QZ performed the experiments and wrote the paper. XG, YP, and YL analyzed the data. XC contributed materials and analysis tools. All authors read and approved the final manuscript prior to submission.
Funding
Joint Funds for the Innovation of Science and Technology, Fujian Province (grant no. 2020Y9133).
Conflict of interest
The authors declare that the research was conducted in the absence of any commercial or financial relationships that could be construed as a potential conflict of interest.
Publisher's note
All claims expressed in this article are solely those of the authors and do not necessarily represent those of their affiliated organizations, or those of the publisher, the editors and the reviewers. Any product that may be evaluated in this article, or claim that may be made by its manufacturer, is not guaranteed or endorsed by the publisher.
Supplementary material
The Supplementary Material for this article can be found online at: https://www.frontiersin.org/articles/10.3389/fpubh.2022.1062304/full#supplementary-material
References
1. Organization WH. Part 1: Diagnosis and Classification of Diabetes Mellitus. Geneva: World Health Organization (1999).
2. Johns EC, Denison FC, Norman JE, Reynolds RM. Gestational diabetes mellitus: Mechanisms, treatment, and complications. Trends Endocrinol Metab. (2018) 29:743–54. doi: 10.1016/j.tem.2018.09.004
3. Paulo MS, Abdo NM, Bettencourt-Silva R, Al-Rifai RH. Gestational diabetes mellitus in Europe: A systematic review and meta-analysis of prevalence studies. Front Endocrinol. (2021) 12:691033. doi: 10.3389/fendo.2021.691033
4. Ovesen PG, Fuglsang J, Andersen MB, Wolff C, Petersen OB, McIntyre HD. Temporal trends in gestational diabetes prevalence, treatment, and outcomes at Aarhus University Hospital, Skejby, between 2004 and 2016. J Diabetes Res. (2018) 2018:5937059. doi: 10.1155/2018/5937059
5. Hod M, Kapur A, McIntyre HD. Evidence in support of the International Association of Diabetes in Pregnancy study groups' criteria for diagnosing gestational diabetes mellitus worldwide in 2019. Am J Obstet Gynecol. (2019) 221:109–16. doi: 10.1016/j.ajog.2019.01.206
6. Saravanan P. Gestational diabetes: Opportunities for improving maternal and child health. Lancet Diabetes Endocrinol. (2020) 8:793–800. doi: 10.1016/S2213-8587(20)30161-3
7. Andersson-Hall UK, Järvinen EAJ, Bosaeus MH, Gustavsson CE, Hårsmar EJ, Niklasson CA, et al. Maternal obesity and gestational diabetes mellitus affect body composition through infancy: The PONCH study. Pediatr Res. (2019) 85:369–77. doi: 10.1038/s41390-018-0248-9
8. Cremona A, Saunders J, Cotter A, Hamilton J, Donnelly AE, O'Gorman CS. Maternal obesity and degree of glucose intolerance on neonatal hypoglycaemia and birth weight: A retrospective observational cohort study in women with gestational diabetes mellitus. Eur J Pediatr. (2020) 179:653–60. doi: 10.1007/s00431-019-03554-x
9. Zhang Y, Xiao C-M, Zhang Y, Chen Q, Zhang X-Q, Li X-F, et al. Factors associated with gestational diabetes mellitus: A meta-analysis. J Diabetes Res. (2021) 2021:6692695. doi: 10.1155/2021/6692695
10. Englund-Ögge L, Brantsæter AL, Sengpiel V, Haugen M, Birgisdottir BE, Myhre R, et al. Maternal dietary patterns and preterm delivery: Results from large prospective cohort study. Br Med J. (2014) 348:g1446. doi: 10.1136/bmj.g1446
11. Szmuilowicz ED, Josefson JL, Metzger BE. Gestational diabetes mellitus. Nat Rev Dis Primers. (2019) 5:47. doi: 10.1038/s41572-019-0098-8
12. Voortman T, Kiefte-de Jong JC, Ikram MA, Stricker BH, van Rooij FJA, Lahousse L, et al. Adherence to the 2015 Dutch dietary guidelines and risk of non-communicable diseases and mortality in the Rotterdam Study. Eur J Epidemiol. (2017) 32:993–1005. doi: 10.1007/s10654-017-0295-2
13. Miller V, Webb P, Micha R, Mozaffarian D, Database GD. Defining diet quality: A synthesis of dietary quality metrics and their validity for the double burden of malnutrition. Lancet Planet Health. (2020) 4:e352–e70. doi: 10.1016/S2542-5196(20)30162-5
14. Jang E-H, Han Y-J, Jang S-E, Lee S. Association between diet quality and sarcopenia in older adults: Systematic review of prospective cohort studies. Life. (2021) 11:80811. doi: 10.3390/life11080811
15. Wirt A, Collins CE. Diet quality–what is it and does it matter? Public Health Nutr. (2009) 12:2473–92. doi: 10.1017/S136898000900531X
16. Green R, Sutherland J, Dangour AD, Shankar B, Webb P. Global dietary quality, undernutrition and non-communicable disease: A longitudinal modelling study. Br Med J Open. (2016) 6:e009331. doi: 10.1136/bmjopen-2015-009331
17. Xu F, Earp JE, Adami A, Weidauer L, Greene GW. The relationship of physical activity and dietary quality and diabetes prevalence in US adults: Findings from NHANES 2011-2018. Nutrients. (2022) 14:163324. doi: 10.3390/nu14163324
18. Sepandi M, Parastouei K, Samadi M. Diet quality indices in relation to cardiovascular risk factors in T2DM patients: A systematic review. Int J Prev Med. (2022) 13:106. doi: 10.4103/ijpvm.IJPVM_494_20
19. Schoenaker DAJM, Mishra GD, Callaway LK, Soedamah-Muthu SS. The role of energy, nutrients, foods, and dietary patterns in the development of gestational diabetes mellitus: A systematic review of observational studies. Diabetes Care. (2016) 39:16–23. doi: 10.2337/dc15-0540
20. Stephenson J, Heslehurst N, Hall J, Schoenaker DAJM, Hutchinson J, Cade JE, et al. Before the beginning: Nutrition and lifestyle in the preconception period and its importance for future health. Lancet. (2018) 391:1830–41. doi: 10.1016/S0140-6736(18)30311-8
21. Yee LM, Silver RM, Haas DM, Parry S, Mercer BM, Iams J, et al. Quality of periconceptional dietary intake and maternal and neonatal outcomes. Am J Obstetr Gynecolo. (2020) 223:121.e1–e8. doi: 10.1016/j.ajog.2020.01.042
22. Yang J, Chang Q, Dang S, Liu X, Zeng L, Yan H. Dietary quality during pregnancy and congenital heart defects. Nutrients. (2022) 14:173654. doi: 10.3390/nu14173654
23. Doyle I-M, Borrmann B, Grosser A, Razum O, Spallek J. Determinants of dietary patterns and diet quality during pregnancy: A systematic review with narrative synthesis. Public Health Nutr. (2017) 20:1009–28. doi: 10.1017/S1368980016002937
24. Schwingshackl L, Watzl B, Meerpohl JJ. The healthiness and sustainability of food based dietary guidelines. Br Med J. (2020) 370:m2417. doi: 10.1136/bmj.m2417
25. Stang A. Critical evaluation of the Newcastle-Ottawa scale for the assessment of the quality of nonrandomized studies in meta-analyses. Eur J Epidemiol. (2010) 25:603–5. doi: 10.1007/s10654-010-9491-z
26. Balshem H, Helfand M, Schünemann HJ, Oxman AD, Kunz R, Brozek J, et al. Guidelines: 3. Rating the quality of evidence. J Clin Epidemiol. (2011) 64:401–6. doi: 10.1016/j.jclinepi.2010.07.015
27. Grimes DA, Schulz KF. An overview of clinical research: The lay of the land. Lancet. (2002) 359:57–61. doi: 10.1016/S0140-6736(02)07283-5
28. Deeks JJ, Altman DG. Effect Measures for Meta–Analysis of Trials With Binary Outcomes: Systematic Reviews in Health Care: Meta-Analysis in Context. 2nd ed. (2008). doi: 10.1002/9780470693926.ch16
29. Becerra-Tomás N, Mejía SB, Viguiliouk E, Khan T, Kendall CWC, Kahleova H, et al. Mediterranean diet, cardiovascular disease and mortality in diabetes: A systematic review and meta-analysis of prospective cohort studies and randomized clinical trials. Crit Rev Food Sci Nutr. (2020) 60:1207–27. doi: 10.1080/10408398.2019.1565281
30. Tobias DK, Zhang C, Chavarro J, Bowers K, Rich-Edwards J, Rosner B, et al. Prepregnancy adherence to dietary patterns and lower risk of gestational diabetes mellitus. Am J Clin Nutr. (2012) 96:289–95. doi: 10.3945/ajcn.111.028266
31. Bao W, Bowers K, Tobias DK, Olsen SF, Chavarro J, Vaag A, et al. Prepregnancy low-carbohydrate dietary pattern and risk of gestational diabetes mellitus: A prospective cohort study. Am J Clin Nutr. (2014) 99:1378–84. doi: 10.3945/ajcn.113.082966
32. Fulay AP, Rifas-Shiman SL, Oken E, Perng W. Associations of the dietary approaches to stop hypertension (DASH) diet with pregnancy complications in Project Viva. Eur J Clin Nutr. (2018) 72:1385–95. doi: 10.1038/s41430-017-0068-8
33. Gicevic S, Gaskins AJ, Fung TT, Rosner B, Tobias DK, Isanaka S, et al. Evaluating pre-pregnancy dietary diversity vs. dietary quality scores as predictors of gestational diabetes and hypertensive disorders of pregnancy. PLoS ONE. (2018) 13:e0195103. doi: 10.1371/journal.pone.019532
34. Chen Z, Qian F, Liu G, Li M, Voortman T, Tobias DK, et al. Prepregnancy plant-based diets and the risk of gestational diabetes mellitus: A prospective cohort study of 14,926 women. Am J Clin Nutr. (2021) 114:1997–2005. doi: 10.1093/ajcn/nqab275
35. Li M, Grewal J, Hinkle SN, Yisahak SF, Grobman WA, Newman RB, et al. Healthy dietary patterns and common pregnancy complications: A prospective and longitudinal study. Am J Clin Nutr. (2021) 114:1229–37. doi: 10.1093/ajcn/nqab145
36. Chen Q, Chen YJ, Wu WJ, Tang N, Wang D, Chen Y, et al. Low-carbohydrate diet and maternal glucose metabolism in Chinese pregnant women. Br J Nutr. (2021) 126:392–400. doi: 10.1017/S0007114520004092
37. Ding Y, Xu F, Zhong C, Tong L, Li F, Li Q, et al. Association between Chinese dietary guidelines compliance index for pregnant women and risks of pregnancy complications in the Tongji Maternal and Child Health Cohort. Nutrients. (2021) 13:30829. doi: 10.3390/nu13030829
38. Dong HL, Sun H, Cai CJ, Rang X, Bai D, Lan X, et al. A low-carbohydrate dietary pattern characterised by high animal fat and protein during the first trimester is associated with an increased risk of gestational diabetes mellitus in Chinese women: A prospective cohort study. Br J Nutr. (2021) 126:1872–80. doi: 10.1017/S0007114521000611
39. Wang H, Huang L, Lin L, Chen X, Zhong C, Li Q, et al. The overall plant-based diet index during pregnancy and risk of gestational diabetes mellitus: A prospective cohort study in China. Br J Nutr. (2021) 126:1519–28. doi: 10.1017/S0007114521000234
40. Zhang Z, Wu Y, Zhong C, Zhou X, Liu C, Li Q, et al. Association between dietary inflammatory index and gestational diabetes mellitus risk in a prospective birth cohort study. Nutrition. (2021) 2021:87–8. doi: 10.1016/j.nut.2021.111193
41. Izadi V, Tehrani H, Haghighatdoost F, Dehghan A, Surkan PJ, Azadbakht L. Adherence to the DASH and Mediterranean diets is associated with decreased risk for gestational diabetes mellitus. Nutrition. (2016) 32:1092–6. doi: 10.1016/j.nut.2016.03.006
42. Shivappa N, Hébert JR, Akhoundan M, Mirmiran P, Rashidkhani B. Association between inflammatory potential of diet and odds of gestational diabetes mellitus among Iranian women. J Maternal Fetal Neonatal Med. (2019) 32:3552–8. doi: 10.1080/14767058.2018.1466275
43. Zamani B, Milajerdi A, Tehrani H, Bellissimo N, Brett NR, Azadbakht L, et al. Association of a plant-based dietary pattern in relation to gestational diabetes mellitus. Nutr Dietet. (2019) 76:589–96. doi: 10.1111/1747-0080.12512
44. Kyozuka H, Murata T, Isogami H, Imaizumi K, Fukuda T, Yamaguchi A, et al. Preconception dietary inflammatory index and risk of gestational diabetes mellitus based on maternal body mass index: Findings from a Japanese Birth Cohort Study. Nutrients. (2022) 14:194100. doi: 10.3390/nu14194100
45. Olmedo-Requena R, Gomez-Fernandez J, Amezcua-Prieto C, Mozas-Moreno J, Khan KS, Jiménez-Moleón JJ, et al. Pre-pregnancy adherence to the mediterranean diet and gestational diabetes mellitus: A case-control study. Nutrients. (2019) 11:51003. doi: 10.3390/nu11051003
46. Tryggvadottir EA, Halldorsson TI, Landberg R, Hrolfsdottir L, Birgisdottir BE, Magnusdottir OK, et al. Higher alkylresorcinol concentrations, a consequence of whole-grain intake, are inversely associated with gestational diabetes mellitus in Iceland. J Nutr. (2021) 151:1159–66. doi: 10.1093/jn/nxaa449
47. Looman M, Schoenaker D, Soedamah-Muthu SS, Geelen A, Feskens EJM, Mishra GD. Pre-pregnancy dietary carbohydrate quantity and quality, and risk of developing gestational diabetes: The Australian Longitudinal Study on Women's Health. Br J Nutr. (2018) 120:435–44. doi: 10.1017/S0007114518001277
48. Pajunen L, Korkalo L, Koivuniemi E, Houttu N, Pellonperä O, Mokkala K, et al. A healthy dietary pattern with a low inflammatory potential reduces the risk of gestational diabetes mellitus. Eur J Nutr. (2022) 61:1477–90. doi: 10.1007/s00394-021-02749-z
49. Zhang C, Yi N. Effect of dietary and lifestyle factors on the risk of gestational diabetes: Review of epidemiologic evidence. Am J Clin Nutr. (2011) 2011(Suppl.6):1975S. doi: 10.3945/ajcn.110.001032
50. Belobrajdic DP, Bird AR. The potential role of phytochemicals in wholegrain cereals for the prevention of type-2 diabetes. Nutr J. (2013) 12:62. doi: 10.1186/1475-2891-12-62
51. Qin JB, Yang TB, Li FR, Wang H. Whole-grain intake and risk of type 2 diabetes. Am J Clin Nutr. (2016) 104:1722–3. doi: 10.3945/ajcn.116.143180
52. Kang C, Wang B, Kaliannan K, Wang X, Lang H, Hui S, et al. Gut microbiota mediates the protective effects of dietary capsaicin against chronic low-grade inflammation and associated obesity induced by high-fat diet. mBio. (2017) 8:17. doi: 10.1128/mBio.00470-17
53. Quan W, Zeng M, Jiao Y, Li Y, Xue C, Liu G, et al. Western dietary patterns, foods, and risk of gestational diabetes mellitus: A systematic review and meta-analysis of prospective cohort studies. Adv Nutr. (2021) 12:1353–64. doi: 10.1093/advances/nmaa184
54. Skórzyńska-Dziduszko KE, Kimber-Trojnar Z, Patro-Małysza J, Olszewska A, Zaborowski T, Małecka-Massalska T. An interplay between obesity and inflammation in gestational diabetes mellitus. Curr Pharm Biotechnol. (2016) 17:603–13. doi: 10.2174/1389201017666160127105926
55. Rodrigo N, Glastras SJ. The emerging role of biomarkers in the diagnosis of gestational diabetes mellitus. J Clin Med. (2018) 7:60120. doi: 10.3390/jcm7060120
56. Raghavan R, Dreibelbis C, Kingshipp BL, Wong YP, Abrams B, Gernand AD, et al. Dietary patterns before and during pregnancy and maternal outcomes: A systematic review. Am J Clin Nutr. (2019) 109(Suppl.7):705s−28s. doi: 10.1093/ajcn/nqy216
57. Mijatovic-Vukas J, Capling L, Cheng S, Stamatakis E, Louie J, Cheung NW, et al. Associations of diet and physical activity with risk for gestational diabetes mellitus: A systematic review and meta-analysis. Nutrients. (2018) 10:60698. doi: 10.3390/nu10060698
58. Cui Y, Liao M, Xu A, Chen G, Liu J, Yu X, et al. Association of maternal pre-pregnancy dietary intake with adverse maternal and neonatal outcomes: A systematic review and meta-analysis of prospective studies. Crit Rev Food Sci Nutr. (2021) 2021:1–22. doi: 10.1080/10408398.2021.1989658
59. Caut C, Leach M, Steel A. Dietary guideline adherence during preconception and pregnancy: A systematic review. Matern Child Nutr. (2020) 16:e12916. doi: 10.1111/mcn.12916
60. Olmedo-Requena R, Gómez-Fernández J, Mozas-Moreno J, Lewis-Mikhael A-M, Bueno-Cavanillas A, Jiménez-Moleón J-J. Factors associated with adherence to nutritional recommendations before and during pregnancy. Women Health. (2018) 58:1094–111. doi: 10.1080/03630242.2017.1388332
61. Yu Y, Feng C, Bédard B, Fraser W, Dubois L. Diet quality during pregnancy and its association with social factors: 3D Cohort Study (Design, Develop, Discover). Matern Child Nutr. (2022) 18:e13403. doi: 10.1111/mcn.13403
62. Kant AK. Indexes of overall diet quality: A review. J Am Diet Assoc. (1996) 96:785–91. doi: 10.1016/S0002-8223(96)00217-9
63. Khaled K, Tsofliou F, Hundley V, Helmreich R, Almilaji O. Perceived stress and diet quality in women of reproductive age: A systematic review and meta-analysis. Nutr J. (2020) 19:92. doi: 10.1186/s12937-020-00609-w
64. Borge TC, Aase H, Brantsæter AL, Biele G. The importance of maternal diet quality during pregnancy on cognitive and behavioural outcomes in children: A systematic review and meta-analysis. Br Med J Open. (2017) 7:e016777. doi: 10.1136/bmjopen-2017-016777
65. Chiuve SE, Fung TT, Rimm EB, Hu FB, McCullough ML, Wang M, et al. Alternative dietary indices both strongly predict risk of chronic disease. J Nutr. (2012) 142:1009–18. doi: 10.3945/jn.111.157222
66. Morze J, Danielewicz A, Hoffmann G, Schwingshackl L. Diet quality as assessed by the healthy eating index, alternate healthy eating index, dietary approaches to stop hypertension score, and health outcomes: A second update of a systematic review and meta-analysis of cohort studies. J Acad Nutr Diet. (2020) 120:1998–2031.e15. doi: 10.1016/j.jand.2020.08.076
67. Donazar-Ezcurra M, López-Del Burgo C, Bes-Rastrollo M. Primary prevention of gestational diabetes mellitus through nutritional factors: A systematic review. BMC Pregn Childb. (2017) 17:30. doi: 10.1186/s12884-016-1205-4
68. Teede HJ, Bailey C, Moran LJ, Khomami MB, Enticott J, Ranasinha S, et al. Association of antenatal diet and physical activity-based interventions with gestational weight gain and pregnancy outcomes: A systematic review and meta-analysis. J Am Med Assoc Intern Med. (2022) 182:106–14. doi: 10.1001/jamainternmed.2021.6373
69. Zhang C, Rawal S, Chong YS. Risk factors for gestational diabetes: Is prevention possible? Diabetologia. (2016) 59:1385–90. doi: 10.1007/s00125-016-3979-3
Keywords: diet quality, diet, gestational diabetes mellitus, pregnancy, pre-pregnancy
Citation: Gao X, Zheng Q, Jiang X, Chen X, Liao Y and Pan Y (2023) The effect of diet quality on the risk of developing gestational diabetes mellitus: A systematic review and meta-analysis. Front. Public Health 10:1062304. doi: 10.3389/fpubh.2022.1062304
Received: 05 October 2022; Accepted: 14 December 2022;
Published: 09 January 2023.
Edited by:
António Raposo, Universidade Lusófona Research Center for Biosciences & Health Technologies, PortugalReviewed by:
Paulo Mascarenhas, Egas Moniz Interdisciplinary Research Center, PortugalKabelo Mokgalaboni, University of KwaZulu-Natal, South Africa
Milad Jalilian, Kermanshah University of Medical Sciences, Iran
Tommaso Filippini, University of Modena and Reggio Emilia, Italy
Copyright © 2023 Gao, Zheng, Jiang, Chen, Liao and Pan. This is an open-access article distributed under the terms of the Creative Commons Attribution License (CC BY). The use, distribution or reproduction in other forums is permitted, provided the original author(s) and the copyright owner(s) are credited and that the original publication in this journal is cited, in accordance with accepted academic practice. No use, distribution or reproduction is permitted which does not comply with these terms.
*Correspondence: Xiumin Jiang,  anhtNTUwQDE2My5jb20=
†These authors have contributed equally to this work and share first authorship