 Lu Ye1,2Yan-qi Yang3Guo-yun Zhang2Wen-jun Wang2Mei-xia Ren2Pan Ge3Jian Zhang3Nan Zhang3Xing-zhou Liu1Ming-lei Zhang1Yu-jiao Tong1Liang-cai Lu1Mo-qi Lv3*
 Dang-xia Zhou3*Cheng Pei4*
- 1Health Science Center, Xi'an Jiaotong University, Xi'an, China
- 2Shaanxi Eye Hospital, Xi'an People's Hospital (Xi'an Fourth Hospital), Xi'an, China
- 3Department of Pathology, School of Basic Medical Sciences, Health Science Center, Xi'an Jiaotong University, Xi'an, China
- 4Department of Ophthalmology, The First Affiliated Hospital of Xi'an Jiaotong University, Xi'an, China
Purpose: The present study was performed to detect the prevalence of myopia among primary-school students in Xi'an, north-western of China.
Methods: The present study was a school-based study with students aged from 6 to 13 years old. All the individuals underwent ophthalmological examination and spherical equivalent (SE) of refractive error were measured with non-cycloplegic refraction. Myopia was defined as a SE of ≤ -0.5 diopters (D), and further divided into three stratified groups based on SE: low myopia (≤ -0.5 to >-3.0 D), moderate myopia (≤ -3.0 to >-6.0 D), and high myopia (≤ -6.0 D). Relative risk factors, including age, sex, grade and ethnicity were investigated using questionnaire.
Results: A total of 4,680 individuals were eligible for this survey and 4,654 (99.4% participation rate) were finally included (51.2% boys). The mean age of participants was 8.756 ± 1.727 years. The whole city-level prevalence of total myopia was 57.1% (95% CI: 55.7–58.6%). Additionally, the prevalence of low, moderate, and high myopia was 45.0% (95% CI: 43.5–46.4%), 11.1% (95% CI: 10.2–12.0%), and 1.0% (95% CI: 0.7–1.3%), respectively. Moreover, grade (education level) instead of age, sex and ethnicity was the most essential risk factor for prevalence of overall myopia (OR = 1.844, 95% CI: 1.605–2.119), and an increase of prevalence by 84.4% per grade was seen. Furthermore, similar associations of grade were significant with low myopia (OR = 1.613, 95% CI: 1.385–1.877) and moderate myopia (OR = 2.186, 95% CI: 1.693–2.823), meanwhile, prevalence of low myopia and moderate myopia demonstrated an increase of prevalence by 61.3 and 118.6% per grade, respectively. None of the factors included in the present study was significant risk factor for high myopia.
Conclusions: The present study investigated a non-negligible high prevalence of myopia among primary-school students in Xi'an, north-western of China, and a gradual increasing in proportion with education level.
Introduction
Myopia (“near sightedness”) is reported as a major global health problem of twenty-first century (1), and is projected to affect approximate half of the world population by 2050 (2). Myopia is associated with various ocular diseases and contributes to a significant cause of vision loss (3). Myopia is also treated as an increasingly common refractive error among school-aged children worldwide (4), particularly in east Asia where around 80% of students completing middle school myopic (5–7).
In China, myopia prevention is an important public health priority, since the prevalence of myopia in Chinese school-aged students is one of the highest around the world (3, 8). Compared to western countries, this dramatic high prevalence of myopia may be attributable to Chinese specific cultures including early educational achievements, rigorous schooling system, frequent passing exams, and the long hours children spend studying, and the less time children spend outdoors (9, 10). Considering that children usually develop myopia at the age of 6 (2), prevention of myopia is needed in younger children, especially in primary-school students. Recently, the prevalence of myopia in primary-school students was reported in some large cities in south-eastern China (11–14), however, the prevalence of myopia among primary-school students in north-western China was scarcely reported.
Xi'an, which is the largest city in the north-western China, has more than 10 million population accounting for nearly one-third of the total population of Shaanxi Province (15). Compared with coastal and south-eastern regions of China, Xi'an has distinct geographic characteristics, cultural behaviors, and lifestyles, which have potential to affect the prevalence of myopia. Given this background, in order to detect the prevalence of myopia in Xi'an and to fill an important gap in prevalence of myopia around China, we performed this cross-sectional study to investigate the prevalence of myopia among primary-school students in Xi'an and to explore the potentially contributing factors to myopia.
Materials and methods
Study design and population
In 2021, the present study was performed to reveal the prevalence of myopia and its relative risk factors in primary-school students (from grades 1–6) in Xi'an, north-western of China. The sample size was calculated with a prevalence rate of 33.9% for myopia reported in previous studies (16) with a 2% error rate and a 95% confidence interval. Considering the non-response rate and the clustering design effect, which were assumed as 10 and 3%, respectively, the final ideal sample size was 956. All the students in this primary schools were eligible to participate in the study. Parent of each student was informed to sign a written consent forms before the ophthalmological examinations. This study followed the tenets of Declaration of Helsinki and was approved by the Institutional Medical Ethics Committee of Xi'an Jiaotong University.
Ophthalmological examination and questionnaire
On the school premises, ophthalmological examinations were performed using the non-cycloplegic auto-refractometry (auto-refractor KR-800; Topcon Co., Tokyo, Japan). To assure data quality, the mean of three readings were taken. Spherical equivalent (SE) of the refractive error was calculated as the spherical refractive error plus half of the minus cylindrical refractive error. Based on the previous study (17), myopia was defined as a SE of ≤ -0.5 diopters (D) in the worse eye which had lower value of SE. Myopia was further divided into three categories: low myopia (SE: ≤ -0.5 to >-3.0 D), moderate myopia (SE: ≤ -3.0 to >-6.0 D), and high myopia (SE: ≤ -6.0 D) (8). The questionnaire items addressed potential risk factors including age, sex grade, and ethnicity.
Statistical analysis
Continuous variables were presented as the mean ± standard deviation (SD), and categorical variables were presented as frequencies of the total. The prevalence of myopia was presented as a value and a 95% confidence interval (CI). Independent t-test was used to investigate differences between the two groups, and R by C chi-square test was used to analyze the differences of distribution from different groups. Spearman analysis was performed to investigate the association of SEs with age and grade.
Univariate logistic regression analyses were performed to examine potential associations between the prevalence of myopia with “myopia/non-myopia” as dependent variable and “relative risk factors including age, sex, grade, and ethnicity” as independent variable. Thereafter, multivariate logistic regression analyses with step-wise backward method were conducted to assess potential factors which were statistically significant in univariate analysis. Odds ratios (OR) and 95% confidence intervals (CIs) were presented in logistic regression analyses.
Stratified analyses were applied to determine whether various categories of myopia undertook different prevalence. Additionally, stratified univariate and multivariate logistic regression analyses were conducted to determine whether various categories of myopia undertook different risk factors for the development of myopia, using “low-myopia/non-low-myopia,” “moderate-myopia/non-moderate-myopia,” and “high-myopia/non-high-myopia” as dependent variable, independently. Furthermore, sensitivity analysis was performed to access the stability of our model.
All P-values were two-sided and P < 0.05 was considered to be statistically significant.
Results
Demographic characteristics
Four thousand six hundred and eighty children from public primary-school in south Xi'an were recruit in this study. Twenty-six individuals failed to finish the ophthalmological examination, 22 of which were absent on the examination day, one of which could not finish the examination due to the ocular trauma, and three of which rejected to perform the examination. Finally, 4,654 children were included in the present study with a mean age of 8.756 ± 1.727 years. Boys accounted for 51.2% (2,385/4,654) and Han ethnicity accounted for the majority (4,601/4,654, 98.9%). Among the included children, 17.4% students were in Grade 1, 17.2% students were in Grade 2, 17.3% students were in Grade 3, 17.0% students were in Grade 4, 16.4% students were in Grade 5, and 14.7% students were in Grade 6. The details of demographic data were shown in Table 1.
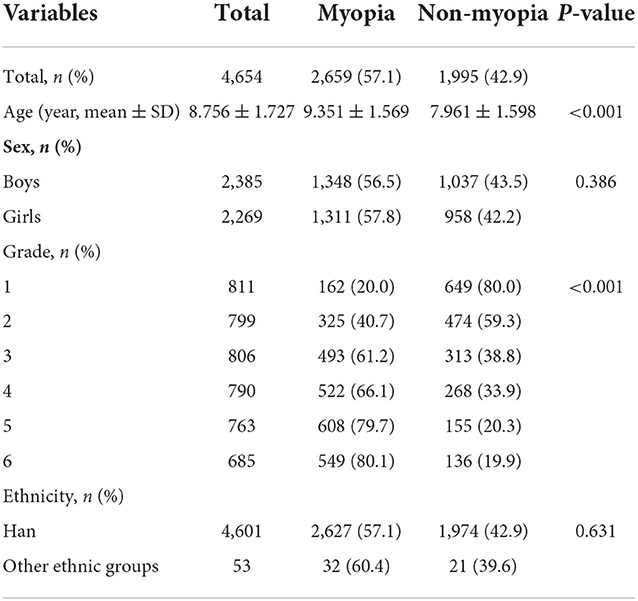
Table 1. Demographic factors associated with myopia in children.
Spherical equivalent of refractive errors among ages, sex, grades, and ethnicity
Mean SE for the left and right eyes were −1.070 ± 1.664 D and −1.138 ± 1.680 D. In right eye, no difference of SE was observed between girls and boys (girls: −1.125 ± 1.667 D, boys: −1.151 ± 1.693 D; P = 0.597; Figure 1A), as well as between Han and non-Han children (Han ethnicity: −1.135 ± 1.678 D, non-Han ethnicity: −1.459 ± 1.821 D; P = 0.163; Figure 1B). In addition, SE was negatively associated with age (r for Pearson = −0.409, P < 0.001; Figure 2B) and grade (r for Pearson = −0.431, P < 0.001; Figure 2D).
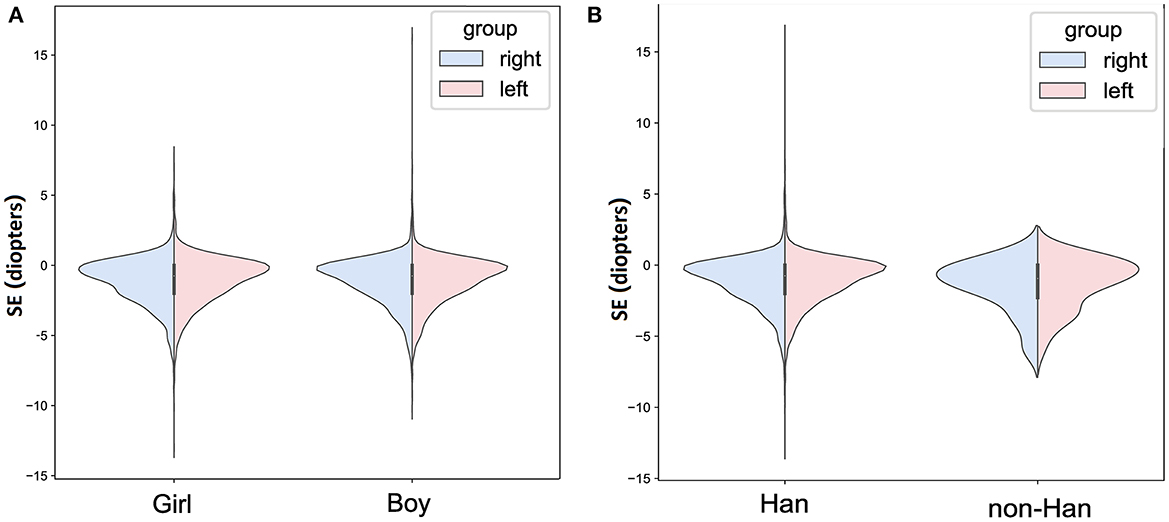
Figure 1. The bilateral spherical equivalent in different age or grade in primary-school students in Xi'an. (A) The bilateral spherical equivalent in different age; (B) the bilateral spherical equivalent in different grade. SE, spherical equivalent.
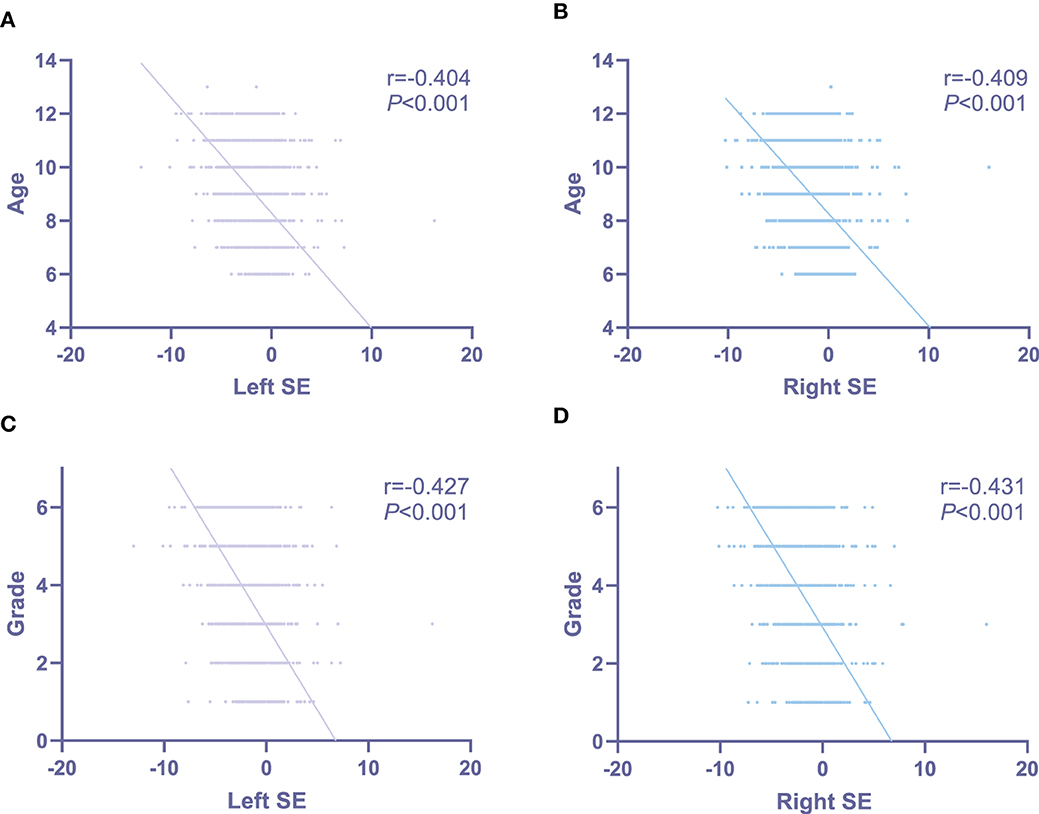
Figure 2. The associations of bilateral spherical equivalent with age and grade in primary-school students in Xi'an. (A) The associations of left spherical equivalent with age; (B) the associations of right spherical equivalent with age; (C) the associations of left spherical equivalent with grade; (D) the associations of right spherical equivalent with grade. SE, spherical equivalent.
Similar results were seen in left eye (Figures 1, 2).
Prevalence of myopia
Overall analysis
The overall prevalence of myopia in primary-school students in Xi'an was 57.1% (95% CI: 55.7–58.6%; Table 2). The prevalence of myopia increased signifcantly with grades (P < 0.001, Table 1). It was 20.0% (95% CI: 17.2–22.7%), 40.1% (95% CI: 37.3–44.1%), 61.2% (95% CI: 57.8–64.5%), 66.1% (95% CI: 62.8–69.4%), 79.7% (95% CI: 76.8–82.5%), and 80.1% (95% CI: 77.2–83.1%) in Grade 1, 2, 3, 4, 5, and 6, respectively (Tables 1, 2; Figure 3). No statistically significant difference in prevalence of myopia was seen between boys and girls (P = 0.159, Table 1), as well as between Han and non-Han ethnicity (P = 0.631, Table 1).
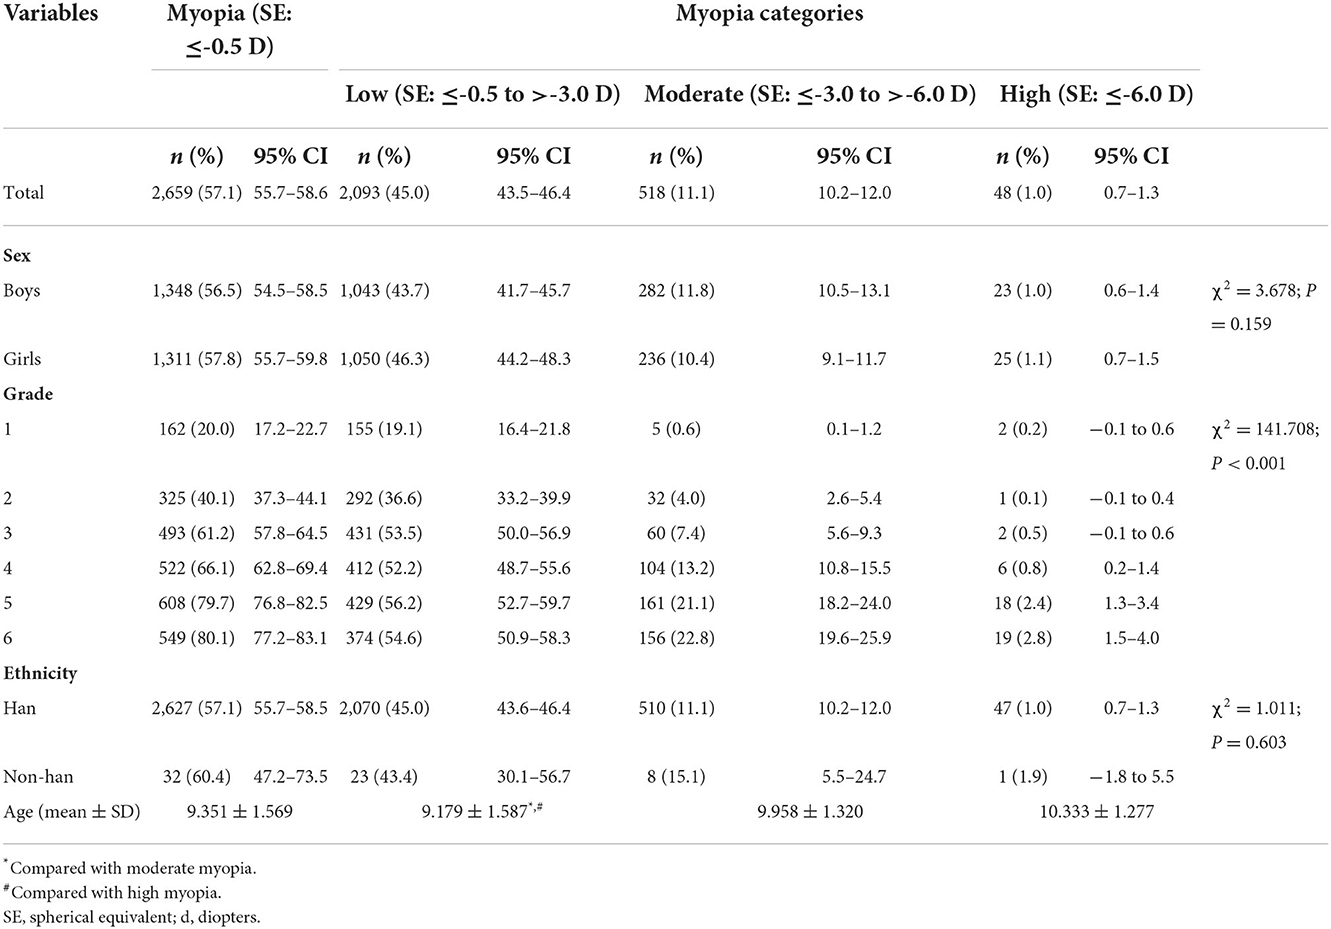
Table 2. Prevalence rate and categories of myopia stratified by age, sex, grade, and ethnicity.
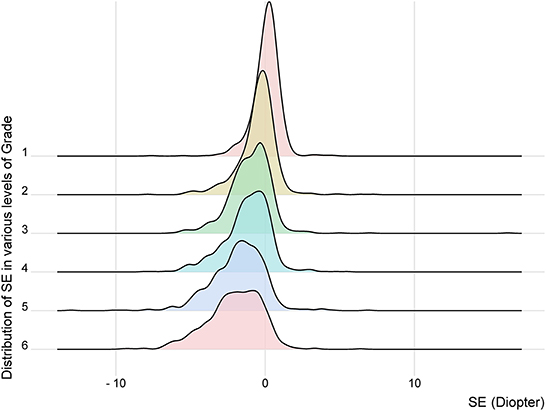
Figure 3. The distribution of spherical equivalent in various levels of grade. SE, spherical equivalent.
Stratified analyses
When stratified according to myopia categories, low myopia showed the highest prevalence (45.0%, 95% CI: 43.5–46.4%), followed by moderate (11.1%, 95% CI: 10.2–12.0%), and high myopia (1.0%, 95% CI: 0.7–1.3%, Table 2). Additionally, children with low myopia had significant lower age compared with individuals with moderate (P < 0.001, Table 2) and high myopia (P < 0.001, Table 2). Moreover, grades could alter distributions of prevalence in different myopia categories (χ2 = 141.708; P < 0.001). Low myopia prevalence significantly increased with increasing grade, ranging from 19.1% in grade 1–54.6% in grade 6 with a slope of 6.714 (P = 0.031, Figure 4). Likewise, similar increasing prevalence with more gentle slopes were showed in moderate and high myopia (Table 2; Figure 4). Furthermore, sex (χ2 = 3.678; P = 0.159) and ethnicity (χ2 = 1.011; P = 0.603) could not alter the distributions of prevalence in different myopia categories (Table 2).
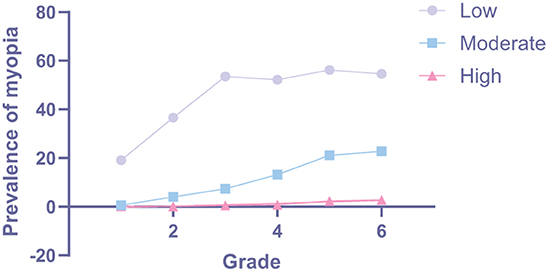
Figure 4. Grade specific incidence of in different categories of myopia.
Risk factors for the development of myopia
Overall analysis
Univariate logistic regression analyses were employed to assess the association between myopia and relevant factors including age, sex grade, and ethnicity. In the present study, higher prevalence of myopia was associated with older age (OR = 1.696, 95% CI: 1.629–1.766; P < 0.001; Table 3) and higher grade (OR = 1.762, 95% CI: 1.690–1.837; P < 0.001; Table 3). However, no significant associations of the risk of myopia was observed with sex (OR = 0.950, 95% CI: 0.846–1.067; P = 0.386; Table 3) and ethnicity (OR = 0.873, 95% CI: 0.502–1.519; P = 0.632; Table 3).
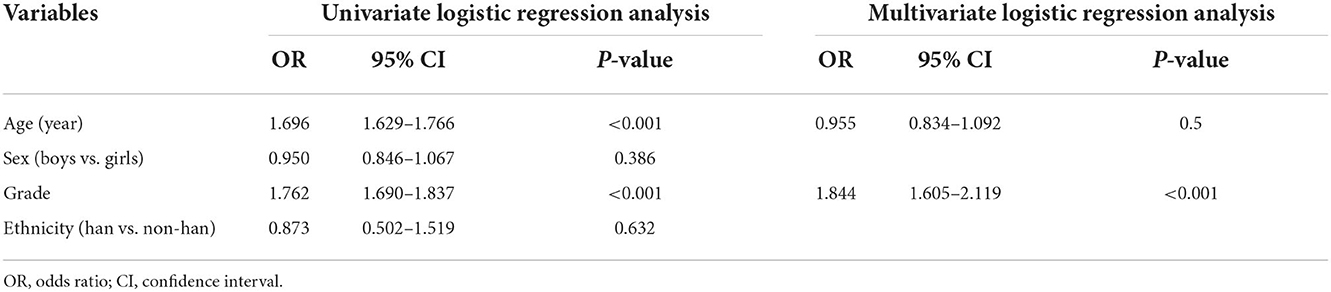
Table 3. Associations between the prevalence of myopia and associated factors.
Moreover, in order to further analyze the factors contributing to the prevalence of myopia, multivariate logistic regression analysis was performed on age and grade, all of which had demonstrated a notable association with the prevalence of myopia in the univariate logistic regression analysis. Consequently, we found that only the higher grade (OR = 1.844, 95% CI: 1.605–2.119; P < 0.001; Table 3) continued to show a significant association with higher prevalence of myopia. Specifically, an increase in grade showed significant association with a 84.4% increase in the relative risk of myopia. In that model, prevalence of myopia was no longer significantly associated with age (OR = 0.955, 95% CI: 0.834–1.092; P = 0.500; Table 3).
Stratified analyses
When stratified according to myopia categories, univariate logistic regression analysis indicated that high prevalence of low myopia remained significantly associated with older age (OR = 1.563, 95% CI: 1.495–1.7633; P < 0.001; Table 4) and higher grade (OR = 1.612, 95% CI: 1.540–1.687; P < 0.001; Table 4). And multivariate logistic regression analysis demonstrated that only the higher grade (OR = 1.613, 95% CI: 1.385–1.877; P < 0.001; Table 4) continued to show a significant association with higher prevalence of low myopia. Specifically, an increase in grade showed significant association with a 61.3% increase in the relative risk of low myopia.
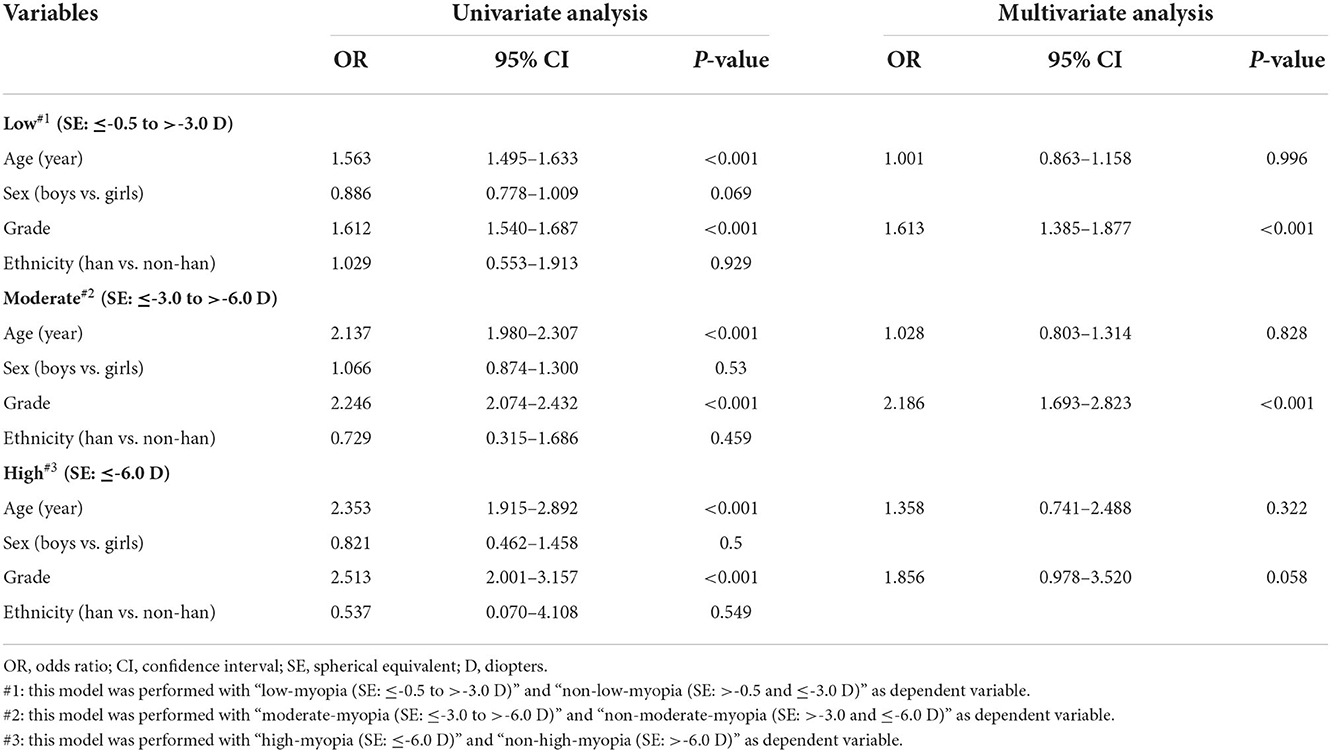
Table 4. Associations between the prevalence of different categories of myopia and associated factors.
Similarity, in moderate myopia group, univariate logistic regression analysis showed significant association of the high prevalence with older age (OR = 2.137, 95% CI: 1.980–2.307; P < 0.001; Table 4) and higher grade (OR = 2.246, 95% CI: 2.074–2.432; P < 0.001; Table 4). And multivariate logistic regression analysis confirmed the statistic association only with higher grade (OR = 2.186, 95% CI: 1.693–2.823; P < 0.001; Table 4). Specifically, an increase in grade showed significant association with a 118.6% increase in the relative risk of moderate myopia.
However, in high myopia group, although age (OR = 2.353, 95% CI: 1.915–2.892; P < 0.001; Table 4) and grade (OR = 2.513, 95% CI: 2.001–3.157; P < 0.001; Table 4) indicated positive associations with prevalence of myopia in univariate logistic regression analysis, the two factors failed to be verified as significant relative risk factors for myopia in multivariate logistic regression analysis (age: OR = 1.358, 95% CI: 0.741–2.488; P = 0.322; grade: OR = 1.856, 95% CI: 0.978–3.520; P = 0.058; Table 4).
Sensitivity analyses
Associations between prevalence of myopia and relative risk factors in girls, in boys, and in Han individuals were generally similar to those in the overall group, respectively (Table 5).
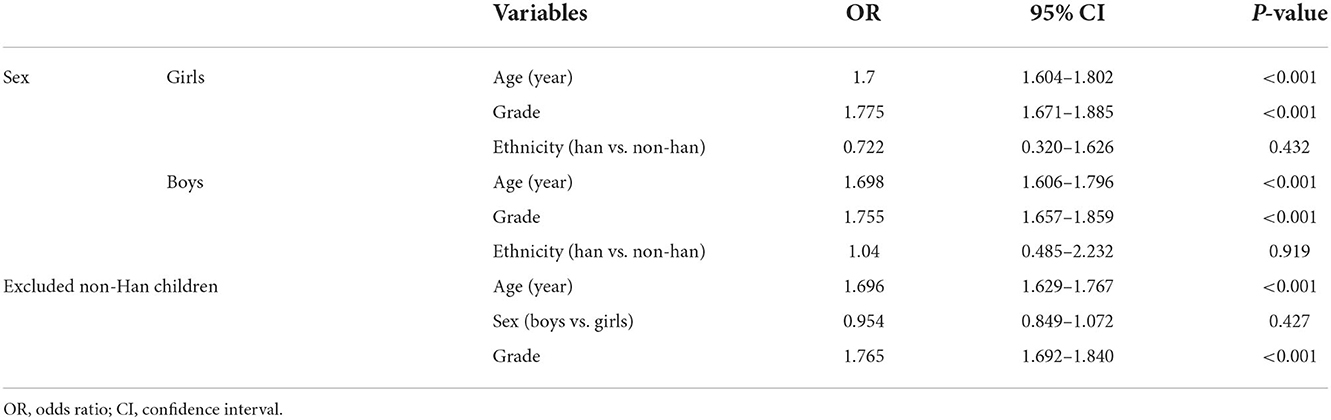
Table 5. Detail of sensitivity analyses of logistic regression models in all samples.
Discussion
Our findings
To our knowledge, the present study is the first school-based study to assess the prevalence of myopia in primary-school students in Xi'an, north-western of China. The present study indicated four key findings: (1) the total prevalence of myopia in students from public primary-school in Xi'an, north-western China was 57.1%; (2) the prevalence of low, moderate, and high myopia was 45.0, 11.1, and 1.0%, respectively; (3) grade instead of age, sex, and ethnicity was the most essential risk factor for prevalence of myopia, specifically an increase in grade indicated significant association with a 84.4% increase in the relative risk of myopia; (4) similar associations of grade were seen with low and moderate myopia, and prevalence of low and moderate myopia demonstrated a increase by 61.3 and 118.6% per grade, respectively; however, none of the factors included in the present study was significant risk factor for high myopia.
Compared to previous studies
Several previous researches reported the prevalence of myopia among Chinese children and adolescent strongly suggesting a non-negligible health issue in ophthalmology, and triggered studies into the reason for the high prevalence, aiming for prevention. As shown in Table 6 and Figure 5, Dong et al. (18) summarized 19 population-based studies selecting data from 1998 to 2016 around the whole China and indicted that the pooled prevalence of myopia was 37.7% in children with 3–19 years old. This lower prevalence might result from the highly increased prevalence (2) and the different cycloplegia refraction (23–25). In addition, Pan et al. (19) and Shi et al. (20) reported that the prevalence of myopia was 29.5% and 47.5 in south-western China and western China, respectively. Western and south-western China have more ethnic diversity and less study burden which were confirmed to be relative factors for the development of myopia (26, 27). This might be essential reasons for the differences between the studies of Pan et al./Shi et al. and ours.
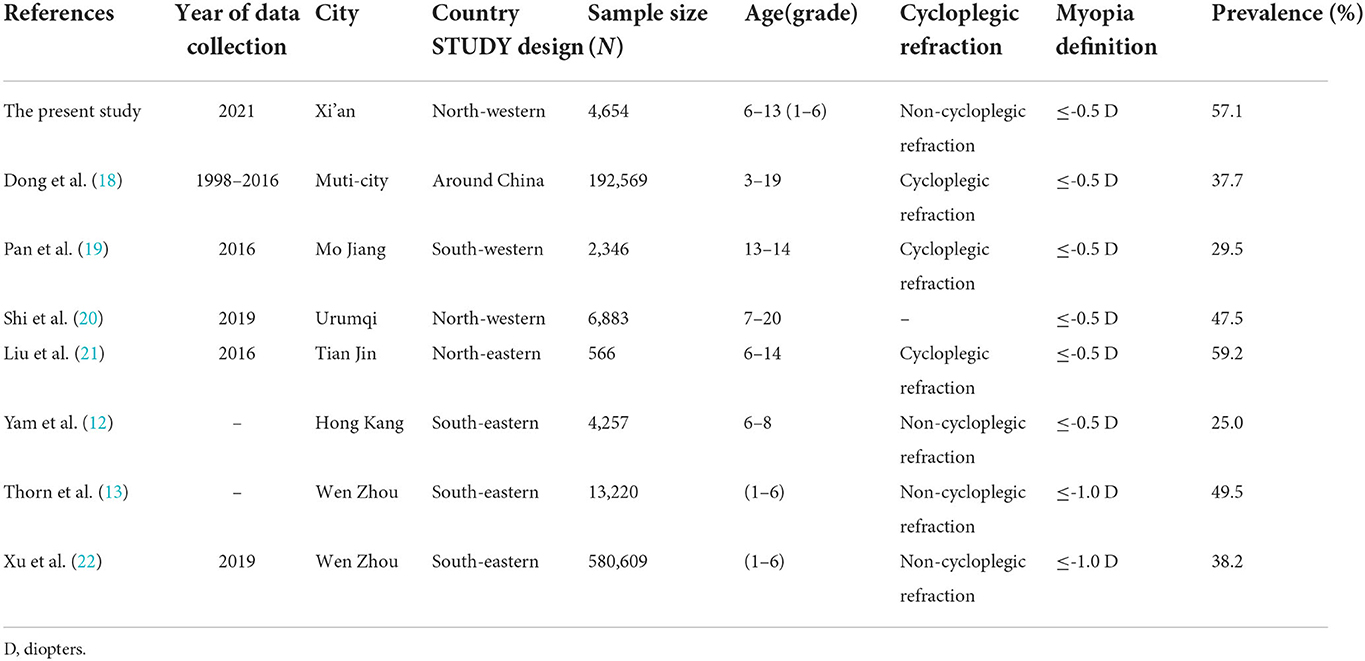
Table 6. The prevalence of myopia around China by published studies.
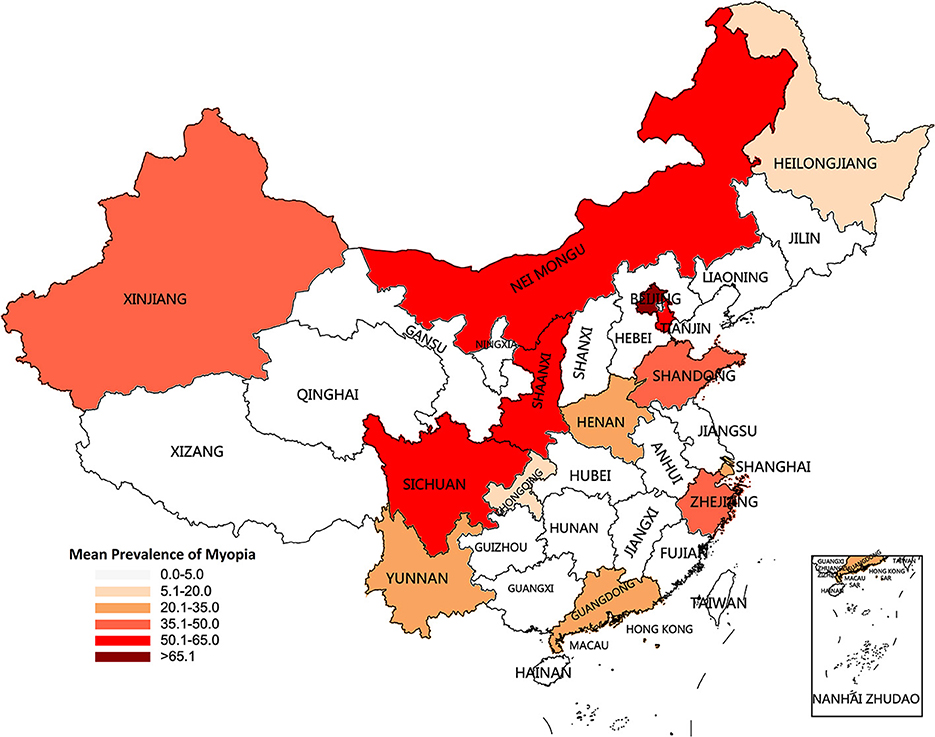
Figure 5. Characteristics and mean prevalence of myopia for the recent decade (1998–2021) by province in the current study, Dong et al. (18), Pan et al. (19), Shi et al. (20), Liu et al. (21), Yam et al. (12), Thorn et al. (13), and Xu et al. (22).
As for primary-school students, Liu et al. (21) revealed a prevalence of 59.2% among children in Tianjin, which was in accord with our findings. Yam et al. (12) analyzed data from children with 6–8 years old and found the prevalence was 25.0%. The lower prevalence might due to the younger age and less study burden (27). Thorn et al. (13) and Xu et al. (22) claimed that the prevalence of myopia was 49.5 and 38.1% in south-eastern China, respectively, which was lower than that in our study. The standard in the two studies was defined myopia as SE ≤ −1.0 D, which was stricter than ours. This was one of the reasons for these differences. Some other underlying reasons might be contributed to geographic differences implying variations of ethnicity (26), socio-economic status (28), life/study style (29–31), air condition (1), educational pressures (32), and genetic background (33).
The possible factors influencing development of myopia
Apart from age, ethnicity, educational pressures, socio-economic status, study style, air condition, and genetic background mentioned upon, sex and grade (education level) were some other most well-known factors affecting development of myopia.
The correlation between sex and the prevalence of myopia remained confused. Majority studies revealed that girls had higher prevalence of myopia when compared with boys (13, 27, 34–36), however, our findings show little difference of the prevalence of myopia between girls and boys. The discrepancy might be result from the different distribution of age and the different definition of myopia.
A cross-sectional study enrolled 812,979 youths across five surveys in China by Zhang et al. (37) demonstrated that grade or education level was associated with a decrease in mean spherical equivalent which was equal to an increase in the prevalence of myopia, which was consistent with our conclusion. Similar results were demonstrated by other researches in Europe and the U.S. (38–40). Preparing for examinations, pressure and competition, and longer digital screen time stemming from higher grade will enhance spherical equivalent and increase the prevalence of myopia. Noteworthily, popularization of digital screen has been cited as a potential modifiable environmental risk factor that can increase myopia risk (41, 42). More smartphones, pads and telescreens used in children's daily life and study could partly explain the increasing prevalence and the younger-age trend of myopia.
Myopia categories
As it wildly known, high myopia had potential to cause vision-threatening complications, including choroid neovascularization, rhegmatogenous retinal detachment, and macular hemorrhage, which harms public visual health (43, 44). Thus, preventing occurrence and progression of high myopia is an essential public health issue. Our findings indicated that low and moderate myopia showed shaper trends of increase in prevalence with grade, however, high myopia showed an extremely gentle increase in prevalence with grade. Likewise, grade was confirmed to be a risk factor for low and moderate myopia, but not for high myopia. Additionally, age, sex, and ethnicity were also failed to be verified as relative factors for high myopia. This was different from previous studies, which revealed a significant association between high myopia and age (45, 46). One of the possible explanations was the various distribution of grade. Previous studies recruited students covering primary-school, middle-school, and high-school, however, our study only included students from primary-school. Compared with individuals in primary and middle school, high school students particularly exhibited prominent higher prevalence of high myopia (27). The small sample size might bias our analyses. Another possible explanation was that, since myopia might be a result of gene-environment interactions, younger children with low and moderate myopia was more inclined to attributing to environment factor, however, younger children with high myopia was more inclined to attributing to genetic background (47).
Limitations
This study has several limitations. First, considering that this was a retrospective study, the possibility of observation and inclusion biases could not be rules out. Although we have conducted sensitivity analyses to confirm our statistical models were stable and robust, further studies with larger sample sizes were expected to relieve this bias. Second, non-cycloplegia refraction was conducted attribute to the large-scale investigation, which would overestimate the myopia prevalence of children. However, this might not pose serious measurement errors for the present study since it was the annual shift that was of interest instead of absolute values. Thirdly, we mainly assessed the associations between prevalence of myopia and some potential risk factors including age, sex grade, and ethnicity. Considering the limited understanding ability of primary-school students, we simplified the questionnaire. Hence, some certain other related factors, such as daily eye habits, daily study habits, and lifestyle habits were not collected in the present study. More comprehensive myopia-related factors collected with the help of parents are expectant to be applied in further studies.
Conclusions
In summary, the present study was the first study to reveal a non-negligible high prevalence of myopia in primary-school students in Xi'an, north-western of China. Higher prevalence of myopia was significantly associated with an increasing level of education (grade). Our findings indicated serious reproductive health warnings and appealed to more attention to preventing the progression of myopia.
Data availability statement
The raw data supporting the conclusions of this article will be made available by the authors, without undue reservation.
Ethics statement
The studies involving human participants were reviewed and approved by the Institutional Medical Ethics Committee of Xi'an Jiaotong University. Written informed consent to participate in this study was provided by the participants' legal guardian/next of kin.
Author contributions
CP, M-qL, and D-xZ: conception and design of the study. LY, G-yZ, W-jW, M-xR, X-zL, M-lZ, Y-jT, and L-cL: data collection. Y-qY and PG: illustrations, statistical analysis, and interpretation of data. LY, CP, JZ, and NZ: administrative, technical, or material support. M-qL and LY: drafting of the manuscript. D-xZ and M-qL: critical revision of the manuscript. JZ and CP: study supervision. All authors read and approved the final manuscript.
Funding
This study was supported by the Key Research Plan of Shaanxi Province (Grant Number 2022ZDLSF03-10), the National Natural Science Foundation of China (Grant Numbers 81673224 and 81273018), the Natural Science Foundation of Shaanxi Province (Grant Number 2022JM-507), the School Enterprise Joint Project of Xi'an Jiaotong University (Grant Number 20201065-ZKT02), and the Innovation Project for Medical Integration in XJTU (Grant Number YXJLRH2022080).
Acknowledgments
We are thankful to the Xi'an People's Hospital (Xi'an Fourth Hospital) for promoting survey among all schools.
Conflict of interest
The authors declare that the research was conducted in the absence of any commercial or financial relationships that could be construed as a potential conflict of interest.
Publisher's note
All claims expressed in this article are solely those of the authors and do not necessarily represent those of their affiliated organizations, or those of the publisher, the editors and the reviewers. Any product that may be evaluated in this article, or claim that may be made by its manufacturer, is not guaranteed or endorsed by the publisher.
References
1. Pan CW, Ramamurthy D, Saw SM. Worldwide prevalence and risk factors for myopia. Ophthal Physiol Optics. (2012) 32:3–16. doi: 10.1111/j.1475-1313.2011.00884.x
2. Holden BA, Fricke TR, Wilson DA, Jong M, Naidoo KS, Sankaridurg P, et al. Global prevalence of myopia and high myopia and temporal trends from 2000 through 2050. Ophthalmology. (2016) 123:1036–42. doi: 10.1016/j.ophtha.2016.01.006
3. Wang J, Ying GS, Fu X, Zhang R, Meng J, Gu F, et al. Prevalence of myopia and vision impairment in school students in Eastern China. BMC Ophthalmol. (2020) 20:2. doi: 10.1186/s12886-019-1281-0
4. Morgan IG, Ohno-Matsui K, Saw SM. Myopia. Lancet. (2012) 379:1739–48. doi: 10.1016/S0140-6736(12)60272-4
5. Lin LL, Shih YF, Hsiao CK, Chen CJ. Prevalence of myopia in Taiwanese schoolchildren: 1983 to 2000. Ann Acad Med Singapore. (2004) 33:27–33.
6. Wu HM, Seet B, Yap EP, Saw SM, Lim TH, Chia KS. Does education explain ethnic differences in myopia prevalence? A population-based study of young adult males in Singapore. Optomet Vis Sci. (2001) 78:234–9. doi: 10.1097/00006324-200104000-00012
7. You QS, Wu LJ, Duan JL, Luo YX, Liu LJ Li X, et al. Prevalence of myopia in school children in greater Beijing: the Beijing Childhood Eye Study. Acta Ophthalmol. (2014) 92:e398–406. doi: 10.1111/aos.12299
8. Guo L, Yang J, Mai J, Du X, Guo Y, Li P, et al. Prevalence and associated factors of myopia among primary and middle school-aged students: a school-based study in Guangzhou. Eye. (2016) 30:796–804. doi: 10.1038/eye.2016.39
9. Zhao J, Pan X, Sui R, Munoz SR, Sperduto RD, Ellwein LB. Refractive error study in children: results from Shunyi District, China. Am J Ophthalmol. (2000) 129:427–35. doi: 10.1016/S0002-9394(99)00452-3
10. Li L, Zhong H, Li J, Li CR, Pan CW. Incidence of myopia and biometric characteristics of premyopic eyes among Chinese children and adolescents. BMC Ophthalmol. (2018) 18:178. doi: 10.1186/s12886-018-0836-9
11. Ma Y, Qu X, Zhu X, Xu X, Zhu J, Sankaridurg P, et al. Age-specific prevalence of visual impairment and refractive error in children aged 3-10 years in Shanghai, China. Invest Ophthalmol Vis Sci. (2016) 57:6188–96. doi: 10.1167/iovs.16-20243
12. Yam JC, Tang SM, Kam KW, Chen LJ, Yu M, Law AK, et al. High prevalence of myopia in children and their parents in Hong Kong Chinese population: the Hong Kong Children Eye Study. Acta Ophthalmol. (2020). doi: 10.1111/aos.14350
13. Thorn F, Chen J, Li C, Jiang D, Chen W, Lin Y, et al. Refractive status and prevalence of myopia among Chinese primary school students. Clin Exp Optomet. (2020) 103:177–83. doi: 10.1111/cxo.12980
14. Lam CS, Lam CH, Cheng SC, Chan LY. Prevalence of myopia among Hong Kong Chinese schoolchildren: changes over two decades. Ophthal Physiol Optics. (2012) 32:17–24. doi: 10.1111/j.1475-1313.2011.00886.x
15. Wang JY, Zhang KG, Ruan JX, Chen W, Wang L. Shift in HIV/AIDS epidemic and factors associated with false positives for hiv testing: a retrospective study from 2013 to 2018 in Xi'an, China. Curr HIV Res. (2020) 18:219–26. doi: 10.2174/1570162X18666200415123607
16. Xie Z, Long Y, Wang J, Li Q, Zhang Q. Prevalence of myopia and associated risk factors among primary students in Chongqing: multilevel modeling. BMC Ophthalmol. (2020) 20:146. doi: 10.1186/s12886-020-01410-3
17. Hashemi H, Rezvan F, Ostadimoghaddam H, Abdollahi M, Hashemi M, Khabazkhoob M. High prevalence of refractive errors in a rural population: 'Nooravaran Salamat' Mobile Eye Clinic experience. Clin Experiment Ophthalmol. (2013) 41:635–43. doi: 10.1111/ceo.12071
18. Dong L, Kang YK Li Y, Wei WB, Jonas JB. Prevalence and time trends of myopia in children and adolescents in China: a systemic review and meta-analysis. Retina. (2020) 40:399–411. doi: 10.1097/IAE.0000000000002590
19. Pan CW, Qiu QX, Qian DJ, Hu DN Li J, Saw SM, et al. Iris colour in relation to myopia among Chinese school-aged children. Ophthal Physiol Optics. (2018) 38:48–55. doi: 10.1111/opo.12427
20. Shi H, Fu J, Liu X, Wang Y, Yong X, Jiang L, et al. Influence of the interaction between parental myopia and poor eye habits when reading and writing and poor reading posture on prevalence of myopia in school students in Urumqi, China. BMC Ophthalmol. (2021) 21:299. doi: 10.1186/s12886-021-02058-3
21. Liu S, Ye S, Xi W, Zhang X. Electronic devices and myopic refraction among children aged 6-14 years in urban areas of Tianjin, China. Ophthal Physiol Optics. (2019) 39:282–93. doi: 10.1111/opo.12620
22. Xu L, Zhuang Y, Zhang G, Ma Y, Yuan J, Tu C, et al. Design, methodology, and baseline of whole city-million scale children and adolescents myopia survey (CAMS) in Wenzhou, China. Eye Vis. (2021) 8:31. doi: 10.1186/s40662-021-00255-1
23. Li T, Zhou X, Zhu J, Tang X, Gu X. Effect of cycloplegia on the measurement of refractive error in Chinese children. Clin Exp Optomet. (2019) 102:160–5. doi: 10.1111/cxo.12829
24. Zhu D, Wang Y, Yang X, Yang D, Guo K, Guo Y, et al. Pre- and postcycloplegic refractions in children and adolescents. PLoS ONE. (2016) 11:e0167628. doi: 10.1371/journal.pone.0167628
25. Li Y, Xing Y, Jia C, Ma J, Li X, Zhou J, et al. Beijing Pinggu childhood eye study: the baseline refractive characteristics in 6- to 12-year-old Chinese primary school students. Front Public Health. (2022) 10:890261. doi: 10.3389/fpubh.2022.890261
26. Chiang SY, Weng TH, Lin CM, Lin SM. Ethnic disparity in prevalence and associated risk factors of myopia in adolescents. J Formos Med Assoc. (2020) 119:134–43. doi: 10.1016/j.jfma.2019.03.004
27. Zhang J, Li Z, Ren J, Wang W, Dai J, Li C, et al. Prevalence of myopia: a large-scale population-based study among children and adolescents in weifang, china. Front Public Health. (2022) 10:924566. doi: 10.3389/fpubh.2022.924566
28. Rai BB, Ashby RS, French AN, Maddess T. Rural-urban differences in myopia prevalence among myopes presenting to Bhutanese retinal clinical services: a 3-year national study. Graefes Arch Clin Exp Ophthalmol. (2021) 259:613–21. doi: 10.1007/s00417-020-04891-6
29. Ramamurthy D, Lin Chua SY, Saw SM, A. review of environmental risk factors for myopia during early life, childhood and adolescence. Clin Exp Optomet. (2015) 98:497–506. doi: 10.1111/cxo.12346
30. Lee SS, Mackey DA. Prevalence and risk factors of myopia in young adults: review of findings from the Raine study. Front Public Health. (2022) 10:861044. doi: 10.3389/fpubh.2022.861044
31. Gupta S, Joshi A, Saxena H, Chatterjee A. Outdoor activity and myopia progression in children: a follow-up study using mixed-effects model. Indian J Ophthalmol. (2021) 69:3446–50. doi: 10.4103/ijo.IJO_3602_20
32. Morgan IG, French AN, Ashby RS, Guo X, Ding X, He M, et al. The epidemics of myopia: aetiology and prevention. Prog Retin Eye Res. (2018) 62:134–49. doi: 10.1016/j.preteyeres.2017.09.004
33. Cai XB, Shen SR, Chen DF, Zhang Q, Jin ZB. An overview of myopia genetics. Exp Eye Res. (2019) 188:107778. doi: 10.1016/j.exer.2019.107778
34. Lee SS, Lingham G, Sanfilippo PG, Hammond CJ, Saw SM, Guggenheim JA, et al. Incidence and progression of myopia in early adulthood. JAMA Ophthalmol. (2022) 140:162–9. doi: 10.1001/jamaophthalmol.2021.5067
35. Rudnicka AR, Kapetanakis VV, Wathern AK, Logan NS, Gilmartin B, Whincup PH, et al. Global variations and time trends in the prevalence of childhood myopia, a systematic review and quantitative meta-analysis: implications for aetiology and early prevention. Br J Ophthalmol. (2016) 100:882–90. doi: 10.1136/bjophthalmol-2015-307724
36. Li Y, Liu J, Qi P. The increasing prevalence of myopia in junior high school students in the Haidian District of Beijing, China: a 10-year population-based survey. BMC Ophthalmol. (2017) 17:88. doi: 10.1186/s12886-017-0483-6
37. Zhang C, Li L, Jan C, Li X, Qu J. Association of school education with eyesight among children and adolescents. JAMA Netw Open. (2022) 5:e229545. doi: 10.1001/jamanetworkopen.2022.9545
38. Williams KM, Bertelsen G, Cumberland P, Wolfram C, Verhoeven VJ, Anastasopoulos E, et al. Increasing prevalence of myopia in Europe and the impact of education. Ophthalmology. (2015) 122:1489–97. doi: 10.1016/j.ophtha.2015.03.018
39. Nickels S, Hopf S, Pfeiffer N, Schuster AK. Myopia is associated with education: results from NHANES 1999-2008. PLoS ONE. (2019) 14:e0211196. doi: 10.1371/journal.pone.0211196
40. Plotnikov D, Williams C, Atan D, Davies NM, Ghorbani Mojarrad N, Guggenheim JA. Effect of education on myopia: evidence from the United Kingdom ROSLA 1972 reform. Invest Ophthalmol Vis Sci. (2020) 61:7. doi: 10.1167/iovs.61.11.7
41. Lanca C, Saw SM. The association between digital screen time and myopia: a systematic review. Ophthal Physiol Optics. (2020) 40:216–29. doi: 10.1111/opo.12657
42. Foreman J, Salim AT, Praveen A, Fonseka D, Ting DSW, Guang He M, et al. Association between digital smart device use and myopia: a systematic review and meta-analysis. Lancet Digital Health. (2021) 3:e806–18. doi: 10.1016/S2589-7500(21)00135-7
43. Iwase A, Araie M, Tomidokoro A, Yamamoto T, Shimizu H, Kitazawa Y. Prevalence and causes of low vision and blindness in a Japanese adult population: the Tajimi Study. Ophthalmology. (2006) 113:1354–62. doi: 10.1016/j.ophtha.2006.04.022
45. Qian DJ, Zhong H, Li J, Niu Z, Yuan Y, Pan CW. Myopia among school students in rural China (Yunnan). Ophthal Physiol Optics. (2016) 36:381–7. doi: 10.1111/opo.12287
46. Singh NK, James RM, Yadav A, Kumar R, Asthana S, Labani S. Prevalence of myopia and associated risk factors in schoolchildren in North India. Optom Vis Sci. (2019) 96:200–5. doi: 10.1097/OPX.0000000000001344
Keywords: primary school, myopia, prevalence, cross-sectional studies, Xi'an city, north-western China
Citation: Ye L, Yang Y-q, Zhang G-y, Wang W-j, Ren M-x, Ge P, Zhang J, Zhang N, Liu X-z, Zhang M-l, Tong Y-j, Lu L-c, Lv M-q, Zhou D-x and Pei C (2022) Increasing prevalence of myopia and the impact of education in primary-school students in Xi'an, north-western of China. Front. Public Health 10:1070984. doi: 10.3389/fpubh.2022.1070984
Received: 15 October 2022; Accepted: 29 November 2022;
Published: 19 December 2022.
Edited by:
Songlin He, Chongqing Medical University, ChinaReviewed by:
Kai Wang, Peking University People's Hospital, ChinaNingli Wang, Capital Medical University, China
Copyright © 2022 Ye, Yang, Zhang, Wang, Ren, Ge, Zhang, Zhang, Liu, Zhang, Tong, Lu, Lv, Zhou and Pei. This is an open-access article distributed under the terms of the Creative Commons Attribution License (CC BY). The use, distribution or reproduction in other forums is permitted, provided the original author(s) and the copyright owner(s) are credited and that the original publication in this journal is cited, in accordance with accepted academic practice. No use, distribution or reproduction is permitted which does not comply with these terms.
*Correspondence: Mo-qi Lv, OTE0Mzk4OTQ2QHFxLmNvbQ==; Dang-xia Zhou, emR4dG91Z2FvQDE2My5jb20=; Cheng Pei, cGVpY2g3MUAxNjMuY29t