 Maryam Maharat
 Seyedeh Forough Sajjadi
 Seyedeh Parisa Moosavian
- Department of Community Nutrition, Vice-Chancellery for Health, Shiraz University of Medical Sciences, Shiraz, Iran
Background: COVID-19 pandemic has impacted human health through sudden lifestyle changes, including isolation at home, and social distancing. Therefore, the current study aimed to investigate the effect of the COVID-19 pandemic on eating habits, weight status, and their associations with socioeconomic status.
Methods: This cross-sectional study was conducted using an online structured questionnaire that inquired demographic, anthropometric (reported weight and height); dietary habits (weekly intake of certain foods); and dietary supplement intake information.
Results: A total of 1,187 participants completed the questionnaire, and after validation of the data, 1,106 respondents were included in the study, with a mean age of 34.5 ± 9.4 years. Our findings showed that the body mass index (BMI) of the participants significantly increased during COVID-19 (P < 0.001). Also, there were significant changes in the intake of a variety of food and beverage during the COVID-19, including less consumption of milk, yogurt, red meat, fish, canned fish, homemade fast foods, take out fast foods, carbonated drinks, and more consumption of whole bread, legumes (chickpeas, lentil, peas, kidney beans, black beans, pinto beans, and navy beans), soy bean, nuts, seeds, high vitamin C vegetables, high vitamin C fruits, green-yellow fruits and vegetables, onion/garlic, dried fruits, natural fruit juices, and water (P < 0.001; for all). It is informed that individuals consumed more vitamin and mineral supplements (P < 0.001). Also, before and during COVID-19 pandemic weekly intakes of dairy, red meat, poultry, high vitamin C fruits, and whole bread were positively associated with socioeconomic status (P < 0.001).
Conclusion: Overall, this study indicates changes in body weight, dietary habits and supplement intake during the pandemic. Therefore, the findings of this study are valuable for, health professionals and politicians to better public health practice and policy making.
Introduction
COVID-19 has dramatically expanded across the world since its first detection in Wuhan, China. The virus has reached nearly every country worldwide in < 6 months (1). Over half of the world's population is, or has been, under some form of social distancing or lockdown in an attempt to contain the health crisis. This has led to a deep alteration of the usual patterns of daily living, such as closure of businesses and a shift to a “working from home” business model (2), changes in social dynamics (3), reduced physical activity and increasing sedentary behavior (4). These societal changes have also led to alterations in individual's food practices (2). In addition, COVID-19 pandemic resulted in increased stress, anxiety or depression induced by the quarantine and disruption of daily routine, along with fear of infection (5, 6). Mental health impact hunger, food choices, and the desire to eat and food choices (7, 8). It has been reported that anxiety is associated with more consumption of high calorie, high fat and high sugar foods during COVID-19 pandemic (9–11).
COVID-19 pandemic may have both direct and indirect effects on food security and nutrition (12).
It is suggested that home confinement due to the COVID-19 may have led to better overall diet quality through more frequency of cooking and eating at home (13–15). However, this has not been a consistent finding. On the other hand, limited access to grocery shopping and panic buying during lockdown may reduce the consumption of fresh foods, especially fruit, and vegetables, in favor of unhealthy foods with longer shelf lives (16, 17). Also, lockdown indirectly decrease the financial capacity to purchase foods due to loss of work, even more so among more vulnerable populations, which leading to worse dietary habits and an overall diet of lesser quality (13, 18).
On the other hand, several researchers across the worldwide have observed weight gain during the COVID-19 pandemic due to poor food choices, physical inactivity, and social isolation (19–21). For example, the weight gain in Italy during the pandemic ranged between 1.5 and 3 kg (21). Also, an average of 0.62 kg weight increase had been reported in the United States (22).
Poor dietary habits along with an unhealthy lifestyle, can cause serious health problems. Therefore, in this critical period optimizing nutrition is essential (23, 24). Having knowledge about individuals' dietary habits may help prevent chronic conditions and their associated risks (24). In addition, both health professionals and governments use this data for public health practice, economic analysis and policy setting (24).
Iran is a middle-income country located in the Middle East. In this country, food security and nutrition situation varies by geography and demography. Unfortunately, Iranian households prioritize abdominal satiety over the consumption of nutritious foods. Overall, even before the COVID 19 pandemic took hold, the consumption of milk and dairy products, eggs, vegetables, and fruits by Iranians is low (25). Food price is the main factor in influencing people's food choices. The COVID 19 pandemic can change the quality of diet due to its impact on social and economic conditions (26). Therefore, the primary aim of this study was to investigate the effects of the COVID-19 pandemic on dietary intake among Iranian adults. The second is to examine the association between socioeconomic status and food intake before and during COVID-19 pandemic.
Methods
Study design
This cross-sectional study was conducted among Iranian adults during the COVID-19 out-break.
The inclusion criteria to participate in the study was age>18 years. We collected data using an online platform, accessible through any device with an Internet connection. The link for the e-form was forwarded throughout social media platforms (WhatsApp, and Instagram). Participants were asked to share the survey link with their family and friends. It was facilitated the wide dissemination of the survey questionnaire during the pandemic. This method provides a statistical collective whose population parameters cannot be controlled, as it is the case for probabilistic sampling. A brief description of the study and its intent was provided at the start of the survey. The study was anonymous, and participation was voluntary.
The sample size was estimated using Gpower software (α = 0.05, β = 0.2) according to the pervious study (27). Therefore, the minimum sample size required for this study is 515 respondents. A total of 1,187 participants responded to this survey; however, findings in the present study were based on the responses from 1,106 participants, after excluding participants who did not complete the questionnaire appropriately. The study protocol was approved by the Research Ethics Committee of Shiraz University of Medical sciences (IR. SUMS.REC.1401.344). This Web-based surveys reported according to the CHERRIES guidelines (28).
Questionnaire
Data were collected through a digital questionnaire consisted of 4 sections. The first part gathers information about socio-demographic characteristics, including age, gender, education, physical activity. Socioeconomic status (SES) was defined based on scoring of the education, income, asset and wealth of their household (homeownership, personal vehicle, washing machine, LCD/LED TV, dishwasher, laptop/ computer, refrigerator, and microwave) variables. The questions and the assigned scores were as follows: education (lower than 12-year formal education = 1, 12-year formal education = 2, 12–16 year formal education =3, more than 16-year formal education = 4), income (lower than 100 United States dollar (USD) = 1, 100 to less than 200 USD = 2, 200 to less than 300 USD = 3, 300 USD and more = 4), asset and wealth (Having 3 items or less = 1, 4–6 items = 2, 7 items and more = 3). Then, participants were classified based on tertiles of SES score to low, middle, and high SES. Self-reported weight and height before and during the pandemic were obtained. Body mass index (BMI) was then calculated by dividing weight to high squared (m2). BMI status was classified based on the WHO categories (29) as follows: underweight (BMI < 18.5), normal weight (BMI between 18.5 and 24.9), overweight (BMI between 25 and 29.9) and obese (BMI ≥ 30). Physical activity level was estimated using the short-form of the International Physical Activity Questionnaire (SF-IPAQ). The SF-IPAQ questionnaire had been validated in Iran and the correlation coefficient for reliability was 0.7 (30). This questionnaire is composed of seven questions about physical activity in a typical week. The physical activity of the participants was calculated as metabolic equivalents (MET)-minutes/week. According to the guidelines for data processing and analysis of the IPAQ, participants were stratified into three categories [low (≤ 600 MET-minutes/week), moderate (600 to < 1,200 MET-min/week), and high levels (≥1,200 MET-min/week) of physical activity] (31). The second section asked about the participants' health status, such as chronic diseases (diseases with proven diagnosis), and whether they were previously infected with COVID-19. Based on the UK NHS report (32), if respondents had any of 10 medical conditions (e.g., diabetes, weakened immune system, chronic kidney disease…), they were considered as “high risk” for COVID-19. The third part of the questionnaire asked about the participants' dietary habits on before the COVID-19 outbreak and during the pandemic. A semi-quantitative food frequency questionnaire (SFFQ), which was validated by Keshteli et al. (33), was used to evaluate the eating behavior. The correlation coefficient for reliability was 0.77. Since this study was performed during the pandemic, we slightly shortened the questionnaire to prevent the adverse effects of the length of the questionnaire on the response rate. Intakes of each food item were recorded based on servings per week. The final part obtains data about nutritional supplement consumption.
Statistical analysis
Data analysis was conducted using IBM SPSS version 26.0. Data are represented as number and percentage for quantitative variables, or median and interquartile range for quantitative data. Normality distribution of variables was evaluated using Shapiro–Wilk test. The Chi-square test was used to determine whether categorical variables differed. Mann–Whitney U and Kruskal–Wallis tests were performed to compare continuous variables. P < 0.05 is considered statistically significant.
Results
A total of 1,187 participants completed the questionnaire, and, after validation of the data, 1,106 respondents have been included in the study, with a mean age of 34.5 ± 9.4 years. The socio-demographic characteristics of the study participants are indicated in Table 1. Most of the participants were female (85.2%). Statistically, the largest group was people aged 31–50 years. Moreover, they mainly lived in urban (76.2%). Most subjects had 12 years of education (45.1%), low physical activity (40.6%), and low SES (61%). In terms of marital status, 79.9% of participants were married. Furthermore, 32.8% of respondents had a high risk for COVID-19, and 32.1% had been diagnosed COVID-19. Hypothyroidism is the most prevalent diseases reported (10.3%).
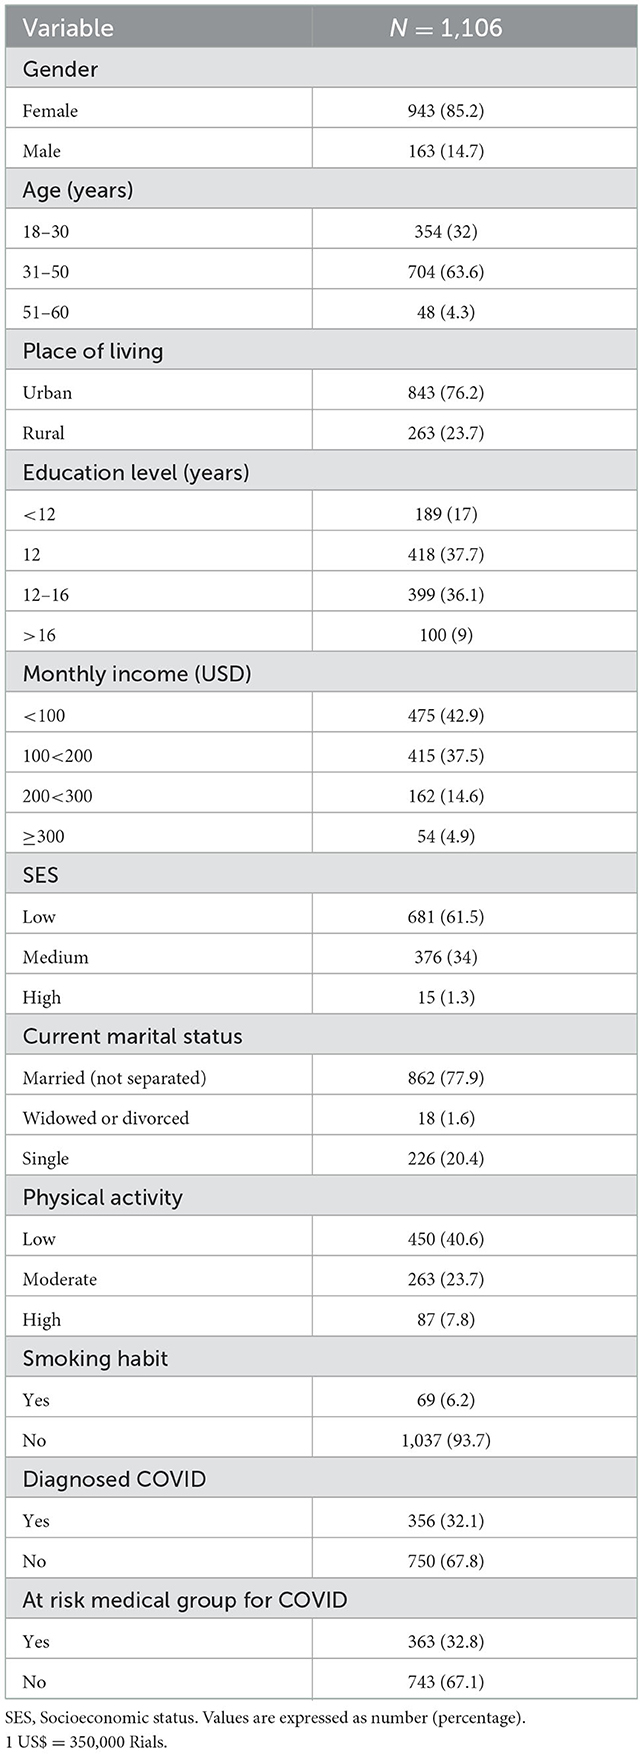
Table 1. Socio-demographic characteristics of the participants who filled out the questionnaire.
As shown in Table 2, the BMI of the participants significantly increased during COVID-19 (P < 0.001). In comparison to the before COVID-19 pandemic, the number of the subject with overweight, and obesity increased significantly (P < 0.001).
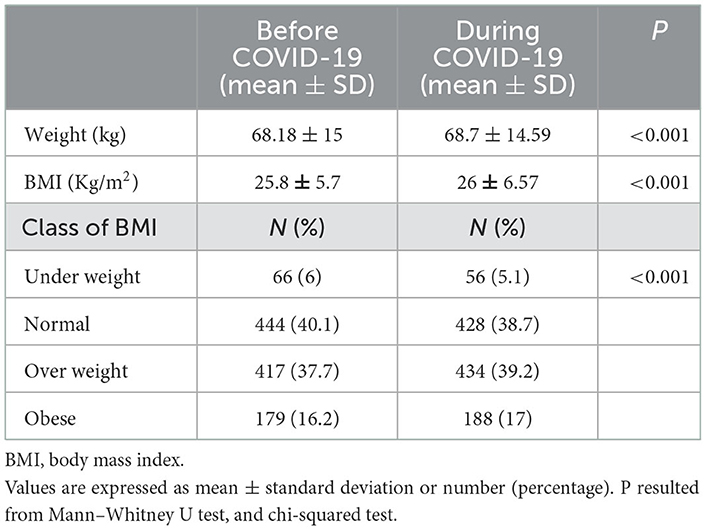
Table 2. Weight status of participants before and during COVID.
Comparison of dietary intake patterns before and during COVID-19 pandemic are presented in Table 3. During the COVID-19 pandemic, consumption of whole bread, legumes, soybean, nuts, seeds, high vitamin C vegetables, high vitamin C fruits, green-yellow fruits and vegetables, onion/garlic, dried fruits, natural fruit juices, and water increased significantly (P < 0.001). However, significant decrease were observed in the intake of milk, yogurt, red meat, fish, canned fish, homemade fast foods, take-out fast foods, and carbonated drinks (P < 0.001).

Table 3. Dietary intake patterns before and during COVID-19 pandemic.
Dietary supplement intake before and during the COVID-19 pandemic is reported in Table 4. Vitamin C, zinc, multivitamin, Calcium + Vitamin D consumption increased significantly during the COVID-19 pandemic (P < 0.001). Moreover, compared to the before COVID-19 pandemic, the number of subjects who intake vitamin D increased notably (P < 0.001).
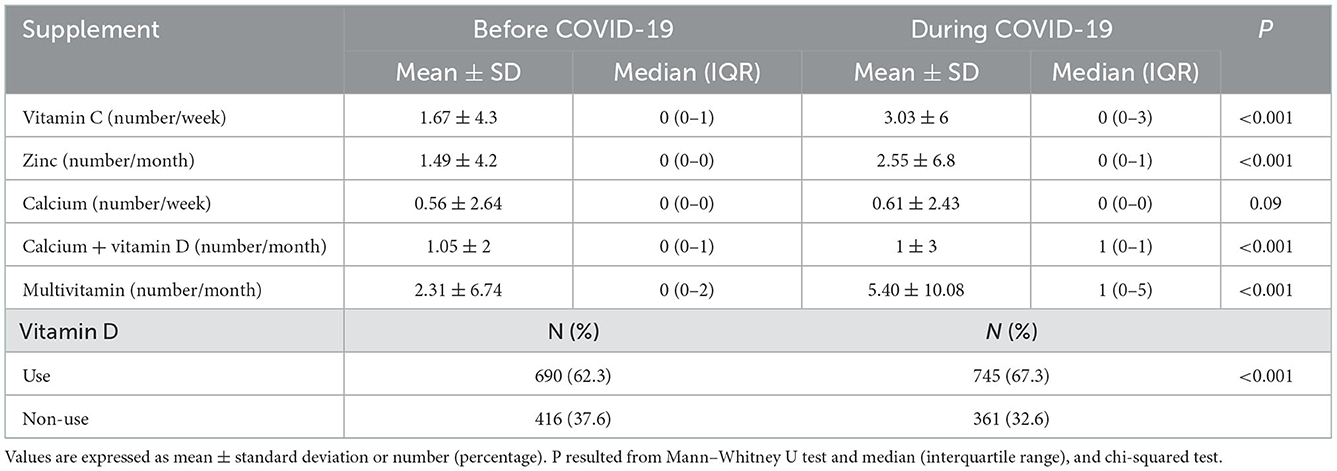
Table 4. Dietary supplement intake before and during COVID-19 pandemic.
Comparison of food intake in each socioeconomic status before and during COVID-19 pandemic are shown in Table 5. Before and during the COVID-19 pandemic, weekly intakes of dairy, red meat, poultry, high vitamin C fruits, and whole bread were positively associated with socioeconomic status (P < 0.001). However, consumption of egg was higher in respondents with low socioeconomic status than other before and during COVID-19 pandemic (P < 0.001). There were no significant differences in the intake of high vitamin C vegetables between groups.
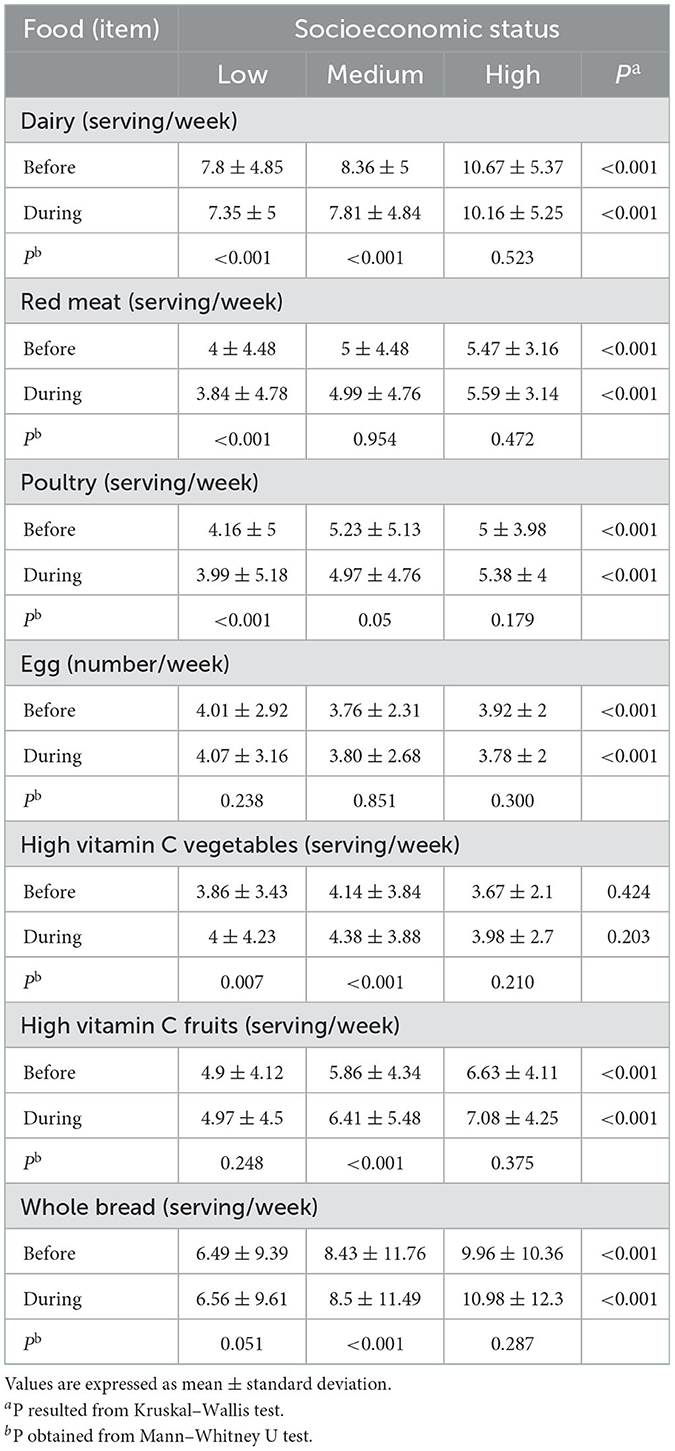
Table 5. Food intake in each socioeconomic status before and during COVID-19 pandemic.
Within-group analyses indicated that dairy, red meat, and poultry intake in subjects with low socioeconomic status significantly decreased (P < 0.001), and consumption of high vitamin C vegetables increased (P = 0.007) during COVID-19 out-break compared to the before pandemic.
Also, in subjects with medium socioeconomic status, mean intake of dairy significantly decreased (P < 0.001), however, high vitamin C vegetables, high vitamin C fruits, and whole bread consumption increased (P < 0.001) during COVID-19 out-break. No significant differences were identified in participants with high socioeconomic status in terms of food intake before and during COVID-19 pandemic.
Discussion
The main goal of the present study was to evaluate how Iranian participants' dietary habits changed during COVID-19 pandemic. Our findings indicated that COVID-19 had a negative effect on BMI. In line with our study, previous findings reported that weight was increased during the COVID-19 (19, 20, 22, 34–38). Also Zhu et al. performed a cross-sectional study using an online questionnaires among 889 residents of Jiangsu and other provinces of China aged between 16 and 70 years and found an average gain weight of 0.5 kg during the pandemic (39), which was similar to the current study. In another online cross-sectional survey among 1,200 participants in USA, 22% of the sample stated they gained 5–10 pounds during the COVID-19 pandemic (19). Several factors may have effect on weight gain and obesity during the COVID-19 out-break, including sedentary behaviors, physical inactivity, and screen time (36, 40–42). Also, access to physical activity resources, such as sports clubs was limited due to the quarantine. An online longitudinal study showed that time of watching TV significantly increased in French-speaking countries (i.e., Belgium, France, and Switzerland) during the pandemic (43). Moreover, unhealthy dietary habits including, overconsumption, and high intake of canned food could be another factor related to weight gain during the pandemic (19, 34, 41, 44). An online cross-sectional survey conducted among individuals older than 18 years in Spain and reported that higher odds of weight gain were associated with increased consumption of sugary drinks, homemade pastries and fried food, eating more than usual, and increased snacking during the pandemic (44).
In addition, we informed significant changes in the intake of a variety of food and beverage during COVID-19, including less consumption of milk, yogurt, red meat, fish, canned fish, homemade fast foods (pizza, chicken Burger, hamburger, Cheeseburger, and so on) take out fast foods, carbonated drinks, and more consumption of whole bread, legumes, soy bean, nuts, seeds, high vitamin C vegetables, high vitamin C fruits, green-yellow fruits and vegetables, onion/garlic, dried fruits, natural fruit juices, and water. In line with our results, previous studies reported that milk, and yogurt intake significantly decreased during the pandemic (27, 45). Also, Jia et al. conducted a cross-sectional study using an online questionnaires among 10,082 chines adults and identified a significant decrease in the intake of red meat (45). With regard to dietary fish, Chinese individuals reduced their consumption of fish during the COVID-19 out-break (46). Also, another study which conducted among 1,553 Iranian adults using an online questionnaires reported that both fresh and canned fish intake significantly decreased in the outbreak period (27). The reduced consumption of dairy products, red meat, fresh and canned fish during the pandemic might be due to the lockdown/home confinement at this time (47).
The results of this study indicated a significant decrease in the intake of homemade fast foods, take out-fast foods, and carbonated drinks. A recent systematic review of the 32 studies conducted by Bakaloudi et al. observed a downward trend in fast-food consumption (48). Kriaucioniene et al. in an online cross-sectional survey among 2,447 individuals older than 18 years identified that intake of carbonated or sugary drinks, fast food and commercial pastries decreased in Spain during the COVID-19 out-break (44). It seems possible that long time staying at home and increased free time resulting from quarantine made individuals to spend more time in cooking (34, 49, 50). Another reason could be the tendency to eat healthier foods in reaction to COVID-19 out-break (7). Finally, it could be the outcome of the fear from the transmission of COVID-19 disease via unhygienic practices at restaurants or delivery services (45).
We found that before and during pandemic weekly intakes of dairy, red meat, poultry, high vitamin C fruits, and whole bread were positively associated with socioeconomic status. In contrast, egg intake was higher in respondents with low socioeconomic status than other before and during COVID-19 pandemic. In the present study, higher socioeconomic status is associated with higher educational level and income. A growing body of research found an increasing trend toward a better quality diet with the increase in socioeconomic status (51). Gómez et al. examined the effect of socioeconomic status (SES) on diet quality using data from the “Latin American Health and Nutrition Study (ELANS),” a multi-country (Argentina, Brazil, Chile, Colombia, Costa Rica, Ecuador, Peru and Venezuela), population-based study of 9,218 participants, and found that participants from the low SES consumed less fruits, vegetables, whole grains, fiber and fish and seafood and more legumes than those in the high SES. Also, the diet quality level, assessed by DQS (dietary quality score), DDS (dietary diversity score) and NAR (nutrients adequacy ratio) mean, increased with SES (52). López-Olmedo et al. analyzed data from adults participating in the subsample with dietary information from the Mexican National Health and Nutrition Survey 2012 (n = 2,400), and they found that a lower educational level and lower assets index were positively associated with higher Mexican Diet Quality Index scores (53). In agreement with our results, a positive association between belonging to a higher level of SES and consumption of meats, dairy, and fruits were observed in other studies (54, 55). However, the higher consumption of eggs in people with low SES might be due to the lower price of it than other animal proteins.
On the other hand, decrement of dairy, red meat, and poultry intake, and increment of high vitamin C vegetables in people with low SES during pandemic might be due to replacing expensive food with high vitamin C vegetables that are recommended to enhance immune system.
The current study have some limitation. First, the sample is limited to adults who had access to a smart phone or computer to complete the online survey, which may have led to selection bias. Second, data were self-reported by respondents, which could lead to recall bias. Third, participant's income was assessed only during the pandemic and its information before the Corona out-break was not collected, which may make the results of the association between socioeconomic status and food intake before and after Corona unreliable. Despite these potential limitations, these findings provide valuable insights into how the COVID-19 out-break has impacted adults' dietary food intake, body weight, and dietary supplements intake.
In conclusion, our findings revealed that there were significant changes in body weight, dietary habits and supplement intake during COVID-19 pandemic among Iranian population. In addition, before and during COVID-19 pandemic weekly dietary intakes were associated with socioeconomic status. The information from the present study would be useful for health professionals and policymakers.
Data availability statement
The original contributions presented in the study are included in the article/Supplementary material, further inquiries can be directed to the corresponding author.
Ethics statement
The studies involving human participants were reviewed and approved by the Research Ethics Committee of Shiraz University of Medical Sciences (IR. SUMS.REC.1401.344). The patients/participants provided their written informed consent to participate in this study.
Author contributions
MM and SFS contributed to the study's design and data collection. SPM contributed to the data analysis. SPM, SFS, and MM wrote the manuscript. All authors approved the final version of the manuscript.
Funding
The present study was approved and financially supported by a grant from Vic-Chancellor for Research, Shiraz University of Medical Sciences, Shiraz, Iran (Ethics code: IR.SUMS.REC.1401.344; Grant number: 23989).
Conflict of interest
The authors declare that the research was conducted in the absence of any commercial or financial relationships that could be construed as a potential conflict of interest.
Publisher's note
All claims expressed in this article are solely those of the authors and do not necessarily represent those of their affiliated organizations, or those of the publisher, the editors and the reviewers. Any product that may be evaluated in this article, or claim that may be made by its manufacturer, is not guaranteed or endorsed by the publisher.
Supplementary material
The Supplementary Material for this article can be found online at: https://www.frontiersin.org/articles/10.3389/fpubh.2022.1080589/full#supplementary-material
References
1. Machhi J, Herskovitz J, Senan AM, Dutta D, Nath B, Oleynikov MD, et al. The natural history, pathobiology, and clinical manifestations of SARS-CoV-2 infections. J Neuroimmune Pharmacol. (2020) 15:359–86. doi: 10.1007/s11481-020-09944-5
2. Murphy B, Benson T, McCloat A, Mooney E, Elliott C, Dean M, et al. Changes in consumers' food practices during the COVID-19 lockdown, implications for diet quality and the food system: a cross-continental comparison. Nutrients. (2020) 13:20. doi: 10.3390/nu13010020
3. Curtis RG, Olds T, Ferguson T, Fraysse F, Dumuid D, Esterman A, et al. Changes in diet, activity, weight, and wellbeing of parents during COVID-19 lockdown. PLoS ONE. (2021) 16:e0248008. doi: 10.1371/journal.pone.0248008
4. Werneck AO, Silva DRD, Malta DC, Souza-Júnior PRB, Azevedo LO, Barros MBA, et al. Lifestyle behaviors changes during the COVID-19 pandemic quarantine among 6,881 Brazilian adults with depression and 35,143 without depression. Cien Saude Colet. (2020) 25(suppl. 2):4151–6. doi: 10.1590/1413-812320202510.2.27862020
5. Yoon HS, Cho CH, Yun MS, Jang SJ, You HJ, Kim J-h, et al. Akkermansia muciniphila secretes a glucagon-like peptide-1-inducing protein that improves glucose homeostasis and ameliorates metabolic disease in mice. Nat Microbiol. (2021) 6:563–73. doi: 10.1038/s41564-021-00880-5
6. Wilding S, O'Connor D, Ferguson E, Cleare S, Wetherall K, O'Carroll R, et al. Probable COVID-19 infection is associated with subsequent poorer mental health and greater loneliness in the UK COVID-19 Mental Health & Wellbeing study. Sci Rep. (2022) 12:1-1. doi: 10.31234/osf.io/sjbav
7. Husain W, Ashkanani F. Does COVID-19 change dietary habits and lifestyle behaviours in Kuwait: a community-based cross-sectional study. Environ Health Prev Med. (2020) 25:1–13. doi: 10.1186/s12199-020-00901-5
8. Zysberg L. Emotional intelligence, anxiety, and emotional eating:a deeper insight into a recently reported association? Eat Behav. (2018) 29:128–31. doi: 10.1016/j.eatbeh.2018.04.001
9. Rodriguez-Moreno DV, Vazquez S, Cheslack-Postava K, Xu G, Cycowicz YM. Changes in appetite during quarantine and their association with pre-COVID-19 mental and physical health. Appetite. (2022) 2022:106104. doi: 10.1016/j.appet.2022.106104
10. Kaya S, Uzdil Z, Cakiroglu FP. Evaluation of the effects of fear and anxiety on nutrition during the COVID-19 pandemic in Turkey. Public Health Nutr. (2021) 24:282–9. doi: 10.1017/S1368980020003845
11. Christofaro DG, Tebar WR, Silva GC, Lofrano-Prado MC, Botero JP, Cucato GG, et al. Anxiety is more related to inadequate eating habits in inactive than in physically active adults during COVID-19 quarantine. Clin Nutr ESPEN. (2022) 51:301–6. doi: 10.1016/j.clnesp.2022.08.010
12. Zorbas C, Browne J, Chung A, Peeters A, Booth S, Pollard C, et al. Shifting the social determinants of food insecurity during the COVID-19 pandemic: the Australian experience. Food Secur. (2022) 17:1–20. doi: 10.1007/s12571-022-01318-4
13. Lamarche B, Brassard D, Lapointe A, Laramée C, Kearney M, Côté M, et al. Changes in diet quality and food security among adults during the COVID-19-related early lockdown: results from NutriQuébec. Am J Clin Nutr. (2021) 113:984–92. doi: 10.1093/ajcn/nqaa363
14. Sarda B, Delamaire C, Serry AJ, Ducrot P. Changes in home cooking and culinary practices among the French population during the COVID-19 lockdown. Appetite. (2022) 168:105743. doi: 10.1016/j.appet.2021.105743
15. Rodríguez-Pérez C, Molina-Montes E, Verardo V, Artacho R, García-Villanova B, Guerra-Hernández EJ, et al. Changes in dietary behaviours during the COVID-19 outbreak confinement in the Spanish COVIDiet study. Nutrients. (2020) 12:1730. doi: 10.3390/nu12061730
16. Wang C, Pan R, Wan X, Tan Y, Xu L, Ho CS, et al. Immediate psychological responses and associated factors during the initial stage of the 2019 coronavirus disease (COVID-19) epidemic among the general population in China. Int J Environ Res Public Health. (2020) 17:1729. doi: 10.3390/ijerph17051729
17. Tan M, He FJ, MacGregor GA. Obesity and covid-19: the role of the food industry. BMJ. (2020) 369:m2237. doi: 10.1136/bmj.m2237
18. Devereux S, Béné C, Hoddinott J. Conceptualising COVID-19's impacts on household food security. Food Security. (2020) 12:769–72. doi: 10.1007/s12571-020-01085-0
19. Zachary Z, Brianna F, Brianna L, Garrett P, Jade W, Alyssa D, et al. Self-quarantine and weight gain related risk factors during the COVID-19 pandemic. Obes Res Clin Pract. (2020) 14:210–6. doi: 10.1016/j.orcp.2020.05.004
20. Flanagan E, Beyl R, Fearnbach S, Altazan A, Martin C, Redman L. The impact of COVID-19 stay-at-home orders on health behaviors in adults. Obesity. (2021) 29:438–45. doi: 10.1002/oby.23066
21. Pellegrini M, Ponzo V, Rosato R, Scumaci E, Goitre I, Benso A, et al. Changes in weight and nutritional habits in adults with obesity during the “lockdown” period caused by the COVID-19 virus emergency. Nutrients. (2020) 12:2016. doi: 10.3390/nu12072016
22. Bhutani S, Vandellen MR, Cooper JA. Longitudinal weight gain and related risk behaviors during the COVID-19 pandemic in adults in the US. Nutrients. (2021) 13:671. doi: 10.3390/nu13020671
23. Hui D, Nortje N, George M, Wilson K, Urbauer DL, Lenz CA, et al. Impact of an interdisciplinary goals-of-care program among medical inpatients at a comprehensive cancer center during the COVID-19 pandemic: a propensity score analysis. J Clin Oncol. (2022):Jco2200849. doi: 10.1200/JCO.22.00849
24. Kamyari N, Soltanian AR, Mahjub H, Moghimbeigi A. Diet, nutrition, obesity, and their implications for COVID-19 mortality: development of a marginalized two-part model for semicontinuous data. JMIR Public Health Surveill. (2021) 7:e22717. doi: 10.2196/22717
25. Abdi F, Atarodi KZ, Mirmiran P, Esteki T. Surveying global and Iranian food consumption patterns: a review of the literature. JABS. (2015) 5:159–67.
26. Ghassemi H, Harrison G, Mohammad K. An accelerated nutrition transition in Iran. Public Health Nutr. (2002) 5:149–55. doi: 10.1079/PHN2001287
27. Akbarzadeh M, Barati-Boldaji R, Mohsenpour MA, Ferns GA, Jalali M, Mosallanezhad Z, et al. Did Iranians change their eating behavior following COVID-19 outbreak? J Res Med Sci. (2021) 26:116. doi: 10.4103/jrms.JRMS_1234_20
28. Eysenbach G. Improving the quality of Web surveys: the Checklist for Reporting Results of Internet E-Surveys (CHERRIES). J Med Internet Res. (2004) 6:e132. doi: 10.2196/jmir.6.3.e34
29. WHO. Obesity: Preventing and Managing the Global Epidemic. WHO (2000). Available online at: https://www.who.int/data/gho/data/themes/topics/topic-details/GHO/body-mass-index (accessed June 16, 2022).
30. Vafainajar A, Vahedian SM, Tehrani H, Dogonchi M, Lael ME. The effectiveness of physical activity training on depersonalization and lack of accomplishment of employees. Iran J Health Educ Health Promot. (2015) 3:116–24. doi: 10.3389/fpubh.2022.973690
31. Committee IR. Guidelines for data processing analysis of the International Physical Activity Questionnaire (IPAQ)-short long forms. (2005). Available online at: https://ugc.futurelearn.com/uploads/files/bc/c5/bcc53b14-ec1e-4d90-88e3-1568682f32ae/IPAQ_PDF.pdf (accessed June 22, 2022).
32. NHS. People at higher risk for coronavirus. (2020). Available online at: https://www.nhs.uk/conditions/coronavirus-covid-19/people-at-higher-risk/whos-at-higher-risk-from-coronavirus/ (accessed March 27, 2022).
33. Keshteli AH, Esmaillzadeh A, Rajaie S, Askari G, Feinle-Bisset C, Adibi P. A dish-based semi-quantitative food frequency questionnaire for assessment of dietary intakes in epidemiologic studies in Iran: design and development. Int J Prev Med. (2014) 5:29.
34. Sidor A, Rzymski P. Dietary choices and habits during COVID-19 lockdown: experience from Poland. Nutrients. (2020) 12:1657. doi: 10.3390/nu12061657
35. Micheletti Cremasco M, Mulasso A, Moroni A, Testa A, Degan R, Rainoldi A, et al. Relation among perceived weight change, sedentary activities and sleep quality during covid-19 lockdown: a study in an academic community in Northern Italy. Int J Environ Res Public Health. (2021) 18:2943. doi: 10.3390/ijerph18062943
36. Alfawaz H, Amer OE, Aljumah AA, Aldisi DA, Enani MA, Aljohani NJ, et al. Effects of home quarantine during COVID-19 lockdown on physical activity and dietary habits of adults in Saudi Arabia. Sci Rep. (2021) 11:1–7. doi: 10.1038/s41598-021-85330-2
37. Alshahrani SM, Alghannam AF, Taha N, Alqahtani SS, Al-Mutairi A, Al-Saud N, et al. The impact of COVID-19 pandemic on weight and Body Mass Index in Saudi Arabia: a longitudinal study. Front Public Health. (2021) 9:775022. doi: 10.3389/fpubh.2021.775022
38. Khubchandani J, Price JH, Sharma S, Wiblishauser MJ, Webb FJ. COVID-19 pandemic and weight gain in American adults: a nationwide population-based study. Diabetes Metab Syndr Clin Res Rev. (2022) 16:102392. doi: 10.1016/j.dsx.2022.102392
39. Zhu Q, Li M, Ji Y, Shi Y, Zhou J, Li Q, et al. “Stay-at-Home” lifestyle effect on weight gain during the COVID-19 outbreak confinement in China. Int J Environ Res Public Health. (2021) 18:1813. doi: 10.3390/ijerph18041813
40. Abdulsalam NM, Khateeb NA, Aljerbi SS, Alqumayzi WM, Balubaid SS, Almarghlani AA, et al. Assessment of dietary habits and physical activity changes during the full COVID-19 curfew period and its effect on weight among adults in Jeddah, Saudi Arabia. Int J Environ Res Public Health. (2021) 18:8580. doi: 10.3390/ijerph18168580
41. Gallo LA, Gallo TF, Young SL, Moritz KM, Akison LK. The impact of isolation measures due to COVID-19 on energy intake and physical activity levels in Australian university students. Nutrients. (2020) 12:1865. doi: 10.3390/nu12061865
42. Abouzid M, El-Sherif DM, Eltewacy NK, Dahman NBH, Okasha SA, Ghozy S, et al. Influence of COVID-19 on lifestyle behaviors in the Middle East and North Africa Region: a survey of 5896 individuals. J Transl Med. (2021) 19:1–11. doi: 10.1186/s12967-021-02767-9
43. Sigre-Leirós V, Billieux J, Mohr C, Maurage P, King DL, Schimmenti A, et al. Binge-watching in times of COVID-19: a longitudinal examination of changes in affect and TV series consumption patterns during lockdown. Psychol Popular Media. (2022). doi: 10.1037/ppm0000390
44. Kriaucioniene V, Bagdonaviciene L, Rodríguez-Pérez C, Petkeviciene J. Associations between changes in health behaviours and body weight during the COVID-19 quarantine in Lithuania: the Lithuanian COVIDiet study. Nutrients. (2020) 12:3119. doi: 10.3390/nu12103119
45. Jia P, Liu L, Xie X, Yuan C, Chen H, Guo B, et al. Changes in dietary patterns among youths in China during COVID-19 epidemic: the COVID-19 impact on lifestyle change survey (COINLICS). Appetite. (2021) 158:105015. doi: 10.1016/j.appet.2020.105015
46. Zhao A, Li Z, Ke Y, Huo S, Ma Y, Zhang Y, et al. Dietary diversity among Chinese residents during the COVID-19 outbreak and its associated factors. Nutrients. (2020) 12:1699. doi: 10.3390/nu12061699
47. Ammar A, Brach M, Trabelsi K, Chtourou H, Boukhris O, Masmoudi L, et al. Effects of COVID-19 home confinement on eating behaviour and physical activity: results of the ECLB-COVID19 international online survey. Nutrients. (2020) 12:1583. doi: 10.3390/nu12061583
48. Bakaloudi DR, Jeyakumar DT, Jayawardena R, Chourdakis M. The impact of COVID-19 lockdown on snacking habits, fast-food and alcohol consumption: A systematic review of the evidence. Clin Nutr. (2021) 41:3038–45. doi: 10.1016/j.clnu.2021.04.020
49. Górnicka M, Drywień ME, Zielinska MA, Hamułka J. Dietary and lifestyle changes during COVID-19 and the subsequent lockdowns among Polish adults: a cross-sectional online survey PLifeCOVID-19 study. Nutrients. (2020) 12:2324. doi: 10.3390/nu12082324
50. Di Renzo L, Gualtieri P, Pivari F, Soldati L, Attinà A, Cinelli G, et al. Eating habits and lifestyle changes during COVID-19 lockdown: an Italian survey. J Transl Med. (2020) 18:1–15. doi: 10.1186/s12967-020-02399-5
51. Darmon N, Drewnowski A. Contribution of food prices and diet cost to socioeconomic disparities in diet quality and health: a systematic review and analysis. Nutr Rev. (2015) 73:643–60. doi: 10.1093/nutrit/nuv027
52. Gómez G, Kovalskys I, Leme ACB, Quesada D, Rigotti A, Cortés Sanabria LY, et al. Socioeconomic status impact on diet quality and body mass index in eight latin american countries: ELANS study results. Nutrients. (2021) 13:2404. doi: 10.3390/nu13072404
53. López-Olmedo N, Popkin BM, Taillie LS. Association between socioeconomic status and diet quality in Mexican men and women: a cross-sectional study. PLoS ONE. (2019) 14:e0224385. doi: 10.1371/journal.pone.0224385
54. Abdollahi M, Mohammadi NF, Houshiarrad A, Ghafarpour M, Ghodsi D, Kalantari N. Socio-economic differences in dietary intakes: the comprehensive study on household food consumption patterns and nutritional status of IR Iran. Nutri Food Sci Res. (2014) 1:19–26.
Keywords: COVID-19, dietary habits, weight, dietary supplements, socioeconomic status
Citation: Maharat M, Sajjadi SF and Moosavian SP (2023) Changes in dietary habits and weight status during the COVID-19 pandemic and its association with socioeconomic status among Iranians adults. Front. Public Health 10:1080589. doi: 10.3389/fpubh.2022.1080589
Received: 26 October 2022; Accepted: 21 December 2022;
Published: 12 January 2023.
Edited by:
William Tebar, University of São Paulo, BrazilReviewed by:
Rita de Cássia Akutsu, University of Brasília, BrazilMuhammad Fawad Rasool, Bahauddin Zakariya University, Pakistan
Copyright © 2023 Maharat, Sajjadi and Moosavian. This is an open-access article distributed under the terms of the Creative Commons Attribution License (CC BY). The use, distribution or reproduction in other forums is permitted, provided the original author(s) and the copyright owner(s) are credited and that the original publication in this journal is cited, in accordance with accepted academic practice. No use, distribution or reproduction is permitted which does not comply with these terms.
*Correspondence: Seyedeh Parisa Moosavian,  cF9tb29zYXZpYW5AeWFob28uY29t