 Chaoxin Jiang1
 Wenjin Fu
- 1Department of Laboratory, Guangdong Provincial Hospital of Integrated Traditional Chinese and Western Medicine, Foshan, China
- 2Department of Pathology, Guangzhou Chest Hospital, Guangzhou, China
- 3Department of Laboratory, Affiliated Houjie Hospital, Guangdong Medical College, Dongguan, China
Objective: To run a systematic review and meta-analysis of related studies on body mass index (BMI) and the risk of death among pulmonary hypertension (PH) patients, as well as, to shed light on the shape and strength of the dose-response association.
Methods: Studies published up to Jun 2021 in scientific databases such as Scopus, and PubMed as well as Google Scholar were searched. Cohort studies that reported risk estimates for at least two categories of BMI or per certain increase in BMI in relation to mortality in PH patients were included. Summary relative risks were determined with random effects models. Non-linear relationship was discovered with dose-response analysis.
Results: All in all, 15 cohort studies were selected. The number of participants was 127,215 out of which 73,999 were reported dead. The summary RR for mortality per a 5-unit increment in BMI was 0.83 (95% confidence interval 0.77–0.89; I2 = 75.6%, n = 9) among PH patients. There was a non-linear dose-response relation between BMI and mortality in PH patients (Pnon−linearity < 0.001), with the lowest risk being at BMI 32–38 kg/m2.
Conclusion: Higher BMI is related to decreased risk of mortality among PH patients and the lowest point of the curve was seen at BMI 32–38.
Introduction
Obesity is considered as one of the main contributors to health issues throughout the world (1, 2). Body Mass Index (BMI) has regularly been used to measure the amount of excess fat in human body. BMI has been approved by the World Health Organization (WHO) as a reliable means of measuring obesity (3) despite the fact that it does not measure the distribution of fat in one's body directly. A bulk of research have shown that obesity can independently be a cardiovascular risk factor that significantly increases the chances of coronary artery disease, pulmonary hypertension (PH), disordered breathing, heart failure (HF), and increased morbidity and mortality (4–7).
Pulmonary arterial hypertension (PAH) is an infrequent cardiopulmonary disease that only 15–150 people per million experience it (8). Age-standardized mortality rates related to PH has been reported between 4.5 and 7.3% in African Americans and 5–5.5% in whites (9). In addition, the survival rates of PH at 1, 3, and 5 years have been indicated to be 68, 48, and 34%, respectively, with an estimated median survival of 2.8 years (10).
Being a consequence of pathophysiological changes in pulmonary vascular structure, which often leads to unusually high pulmonary artery pressures, pulmonary arterial hypertension (PAH), is known as a key cardiovascular condition which typically results in severe cases such as right-sided heart failure as well as death (4). PAH patients suffer from higher catabolic burden and cachexia due to higher baseline inflammatory condition (11). Thus, additional adipose tissue may have beneficial effect in PAH patients.
Recent data showed that an independent positive relationship between obesity and PH (7, 12). BMI has been confirmed to be conversely related to long term mortality in hemodialysis patients as well as some chronic diseases, such as chronic obstructive pulmonary disease, peripheral vascular disease, and coronary artery diseases (5, 13–16).
Although obesity is considered as an important independent PH risk factor, the existing data show decreased mortality in obese PH patients (17–20). The term “obesity paradox” has been coined for this epidemiological finding.
Considering the lack of systematic review and meta-analysis to examine the relation of BMI with mortality in PH patients, this study aimed to evaluate such associations.
Materials and Methods
The framework of the present study was based on the principles of the Preferred Reporting Items for Systematic Reviews and Meta-Analyses (PRISMA) statement (21).
Search Strategy
PubMed, Scopus, and Google Scholar were explored using relevant terms to find related research papers published up to Jun 2021. The selected keywords were: [(“body mass index” OR BMI OR “Obesity” OR “Obesity/complications” OR “overweight” OR “adiposity”) AND (survival OR mortality OR death OR “Survival Rate”) AND (“Pulmonary Hypertension”)]. No filters were applied for searching the above-mentioned databases. In order to prevent any missing or unknown article, the reference lists of the included articles and reviews were manually inspected.
Inclusion Criteria
Two investigators evaluated the titles, abstracts, and, in some cases, the full texts of papers, taking into considerations the following inclusion criteria: (1) cohort studies, (2) studies on the association of BMI with risk of mortality, (3) studies conducted on PH patients, (4) those reported hazard ratio (HR), rate ratio (RR), and odds ratio (OR) and the corresponding 95% confidence interval (CI) in a linear or categorical approach in discovering the associations (5) studies with English language. When encountering paradoxes, the investigators managed to find solutions by discussing them with the Principal Investigator.
Studies which were concerned with patients other than PH sufferers or those which concentrated on other types of hypertensions, such as systemic blood pressure along with PH were excluded. In the same vein, studies with similar populations, and studies that assessed obesity based on ICD-9 codes and did not provide enough information on body mass index, were also removed. Last but not least, review articles, randomized clinical trials, abstracts, unpublished studies, letters and comments, as well as in vitro or animal studies were not included in this study.
Data Extraction
Each paper was carefully examined by two independent authors and the following information was extracted: author's first name, country, study design, participants' age mean/range, publication year, PH and mortality assessment approach, duration of follow-up, the number of PH patients and deaths, used cut-points for PH definition, participants' gender, continuous or categorical values, and adjustment. We extracted the adjusted RRs when the studies had both crude and adjusted RRs. In cases where the two authors did not agree on an issue, the corresponding author mediated in resolving the point of disagreement.
Risk of Bias Assessment
In order to measure risk of bias, with respect to each eligible study the Newcastle-Ottawa Scale (NOS) scale (22) was used. This scale comprises three parts, namely; selection, comparability, and exposure or outcome. The total score ranged between 0 and 9. In the present study, those research papers which had a score of 7 or above met our high-quality criteria. Meanwhile, the two authors evaluated each study separately, and if there was a discrepancy, a final decision was made after consulting the PI.
Statistical Analysis
The random-effects model was applied to determine estimated risk with 95% CIs to combine the RRs of five-increment in BMI and mortality in PH patients. Heterogeneity among included studies was assessed using I2 test. The I2 values of 25–50, 50–75, and >75% were defined as low, moderate, and high heterogeneity, respectively (23). Subgroup analysis and meta-regression were also run to detect the sources of heterogeneity focusing on the following variables: confounder adjustments (age, smoking), mediator adjustment (diabetes, hypertension), country, sample size, quality score, and duration of follow-up. In order to detect any evidence of publication bias, Funnel plot and egger test was applied (24). Also, Sensitivity analysis was performed to assess the impact that each study had on summary effect size.
In addition, dose-response analyses was conducted using the methods suggested by Greenland and Longnecker (25) and Orsini et al. (26). A two-stage random effects dose-response meta-analysis was carried out to examine possible non-linear associations between BMI and mortality in PH patients (26). The number of deaths, person-year, BMI range, and risk estimates for each category were extracted from studies which had at least two BMI categories. For those studies which did not report the number of deaths or PH patients in each category, our presupposition was that it was similar across all categories. Non-linear associations were investigated by modeling exposure levels with the using limited cubic splines with 3 knots at the 10th, 50th, and 95th percentiles of the distribution (27). The null hypothesis for this study was as follows: coefficient of the second spline is equal to zero.
Also, a linear dose-response association between BMI and risk of death in PH patients was identified and examined for each 5 kg/m2 augment in BMI by using a two-stage generalized least-squares trend estimation method (25, 26, 28). First, study-specific slope lines were calculated then, these lines were merged so that an overall average slope could be obtained (26). Study-specific slope lines were combined applying a random effects model (29). STATA software version 16.0 was used in all statistical analyses. The P-value below 0.05 was considered as significant.
Results
Going through a systematic literature search we obtained 1,197 articles after removing duplicates (Figure 1). After reviewing the articles' titles and abstracts, a total of 934 publications were decided to be excluded. Of the 27 remaining publications, 12 papers were excluded because: They were either an RCT study or a review article; PH and systemic hypertension were simultaneously analyzed; the same population was chosen for more than one study; participants other than PH patients were included in the study; Obesity was assessed with parameters other than BMI, or the presented results were irrelevant. On the whole, 15 cohort studies met our criteria and were selected for the final systematic review and meta-analysis (7, 12, 17–20, 30–38).
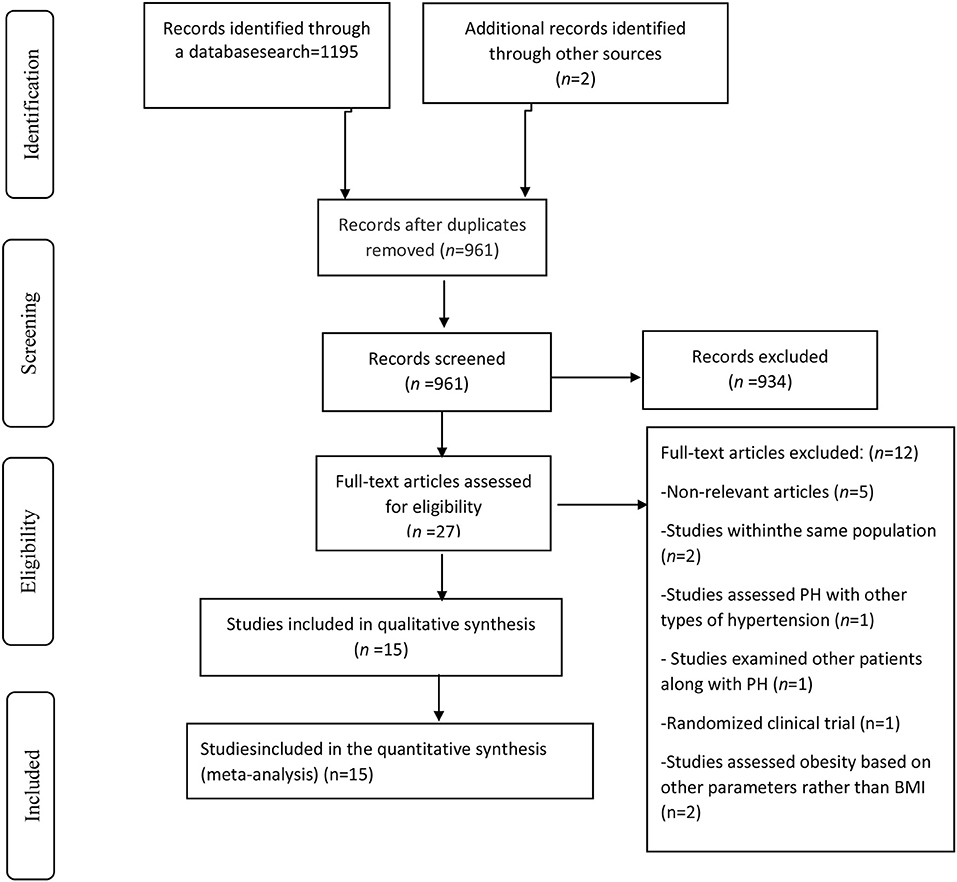
Figure 1. Study selection flow diagram.
As mentioned above, a total of fifteen studies were selected which, all in all, reported on a total of 127,215 participants and 73,999 incident cases published from 2005 to 2020. Most of relevant studies were conducted in US (n = 8) (7, 12, 18, 19, 30, 32, 35, 37), while others were run in China (n = 2) (20, 31), Kenia (n = 1) (34), France (n = 1) (38), Italy (n = 1) (33), Israel (n = 1) (17), Australia and New Zealand (n = 1) (36). All studies focused on risk estimates for males and females. The follow-up duration in the cohort studies varied from 0.5 to 8 years. Also, participants' age range varied between 18 and 80 years old. Table 1 depicts a more detailed description of different features of the included studies. In most of these publications, important cofounders such as age (n = 7), smoking (n = 2), and mediators including diabetes (n = 6), hypertension (n = 3) were adjusted in the analysis. Among the selected essays, six of them enjoy a rather high methodological quality (score ≥7) (7, 18, 20, 34, 37, 38), while the other nine have a low quality (<7) (Table 2).
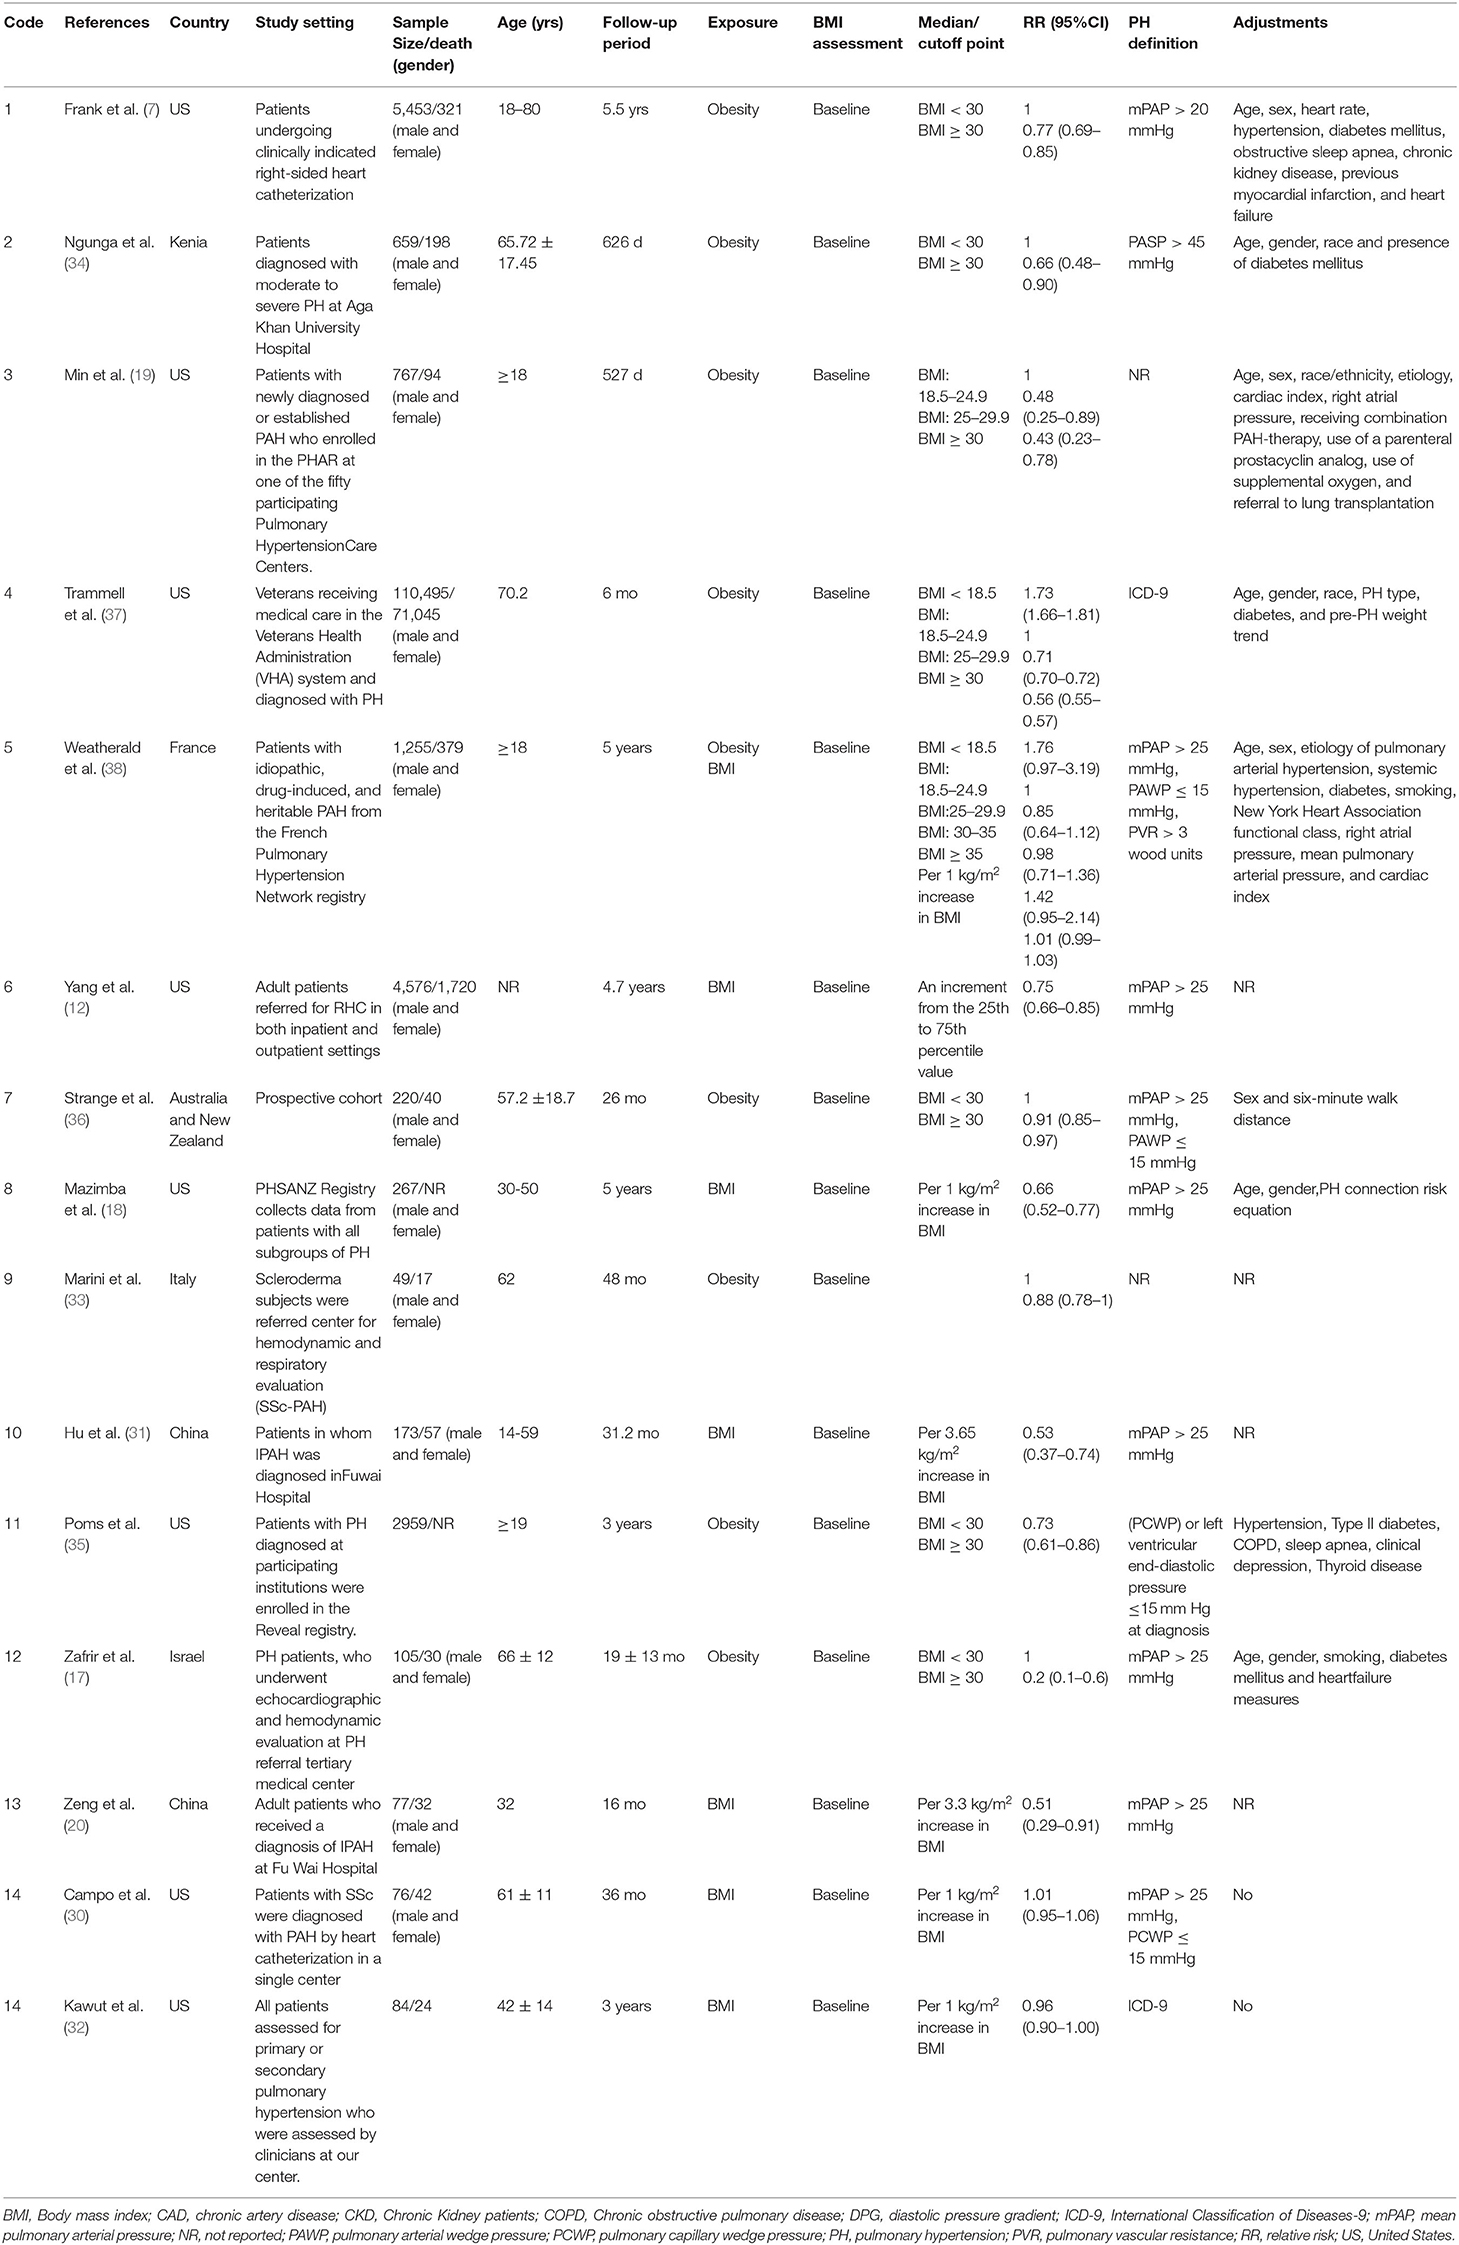
Table 1. Characteristics of cohort studies eligible in the systematic review and meta-analysis.
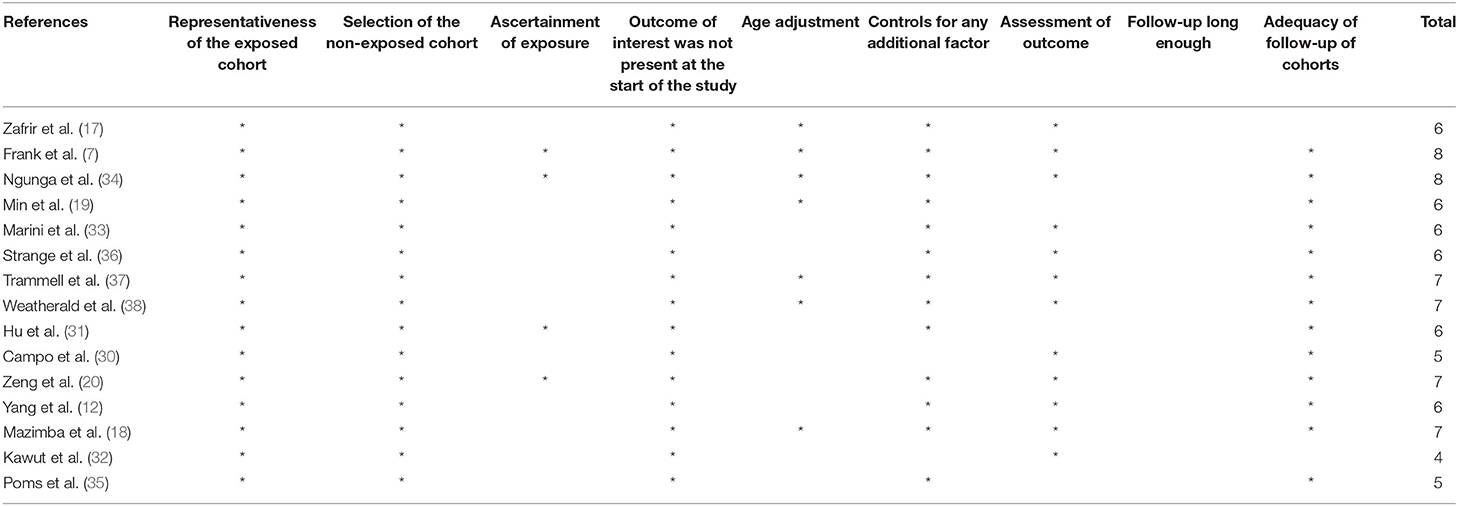
Table 2. Quality assessment of cohort studies based on Newcastle-Ottawa Scale.
Meta-Analysis
A linear trend estimation revealed that a 5 kg/m2 increment in BMI was related to 17% lowered risk of mortality among PH patients [Pooled risk estimate: 0.83 (95% CI: 0.77, 0.89; I2 = 75.6, n = 9) (Figure 2)]. No evidence of publication bias was confirmed with Egger's regression test (P = 0.688) or funnel plot (Supplementary Figure 1). More importantly, sensitivity analyses confirmed that none of the studies affected the overall risk estimate to a significant extend (Supplementary Figure 2). Running a subgroup analysis, country, age adjustment, and sample size were recognized as the sources of heterogeneity. Subgroup analysis also showed the relationship between BMI and mortality in PH patients participating in studies run in US, in which age was adjusted, diabetes was not controlled for, and studies had a shorter duration of follow-up (<5 yrs). Furthermore, Studies which focused on higher sample sizes (≥4,000) revealed more lowered mortality (Tables 2, 3).
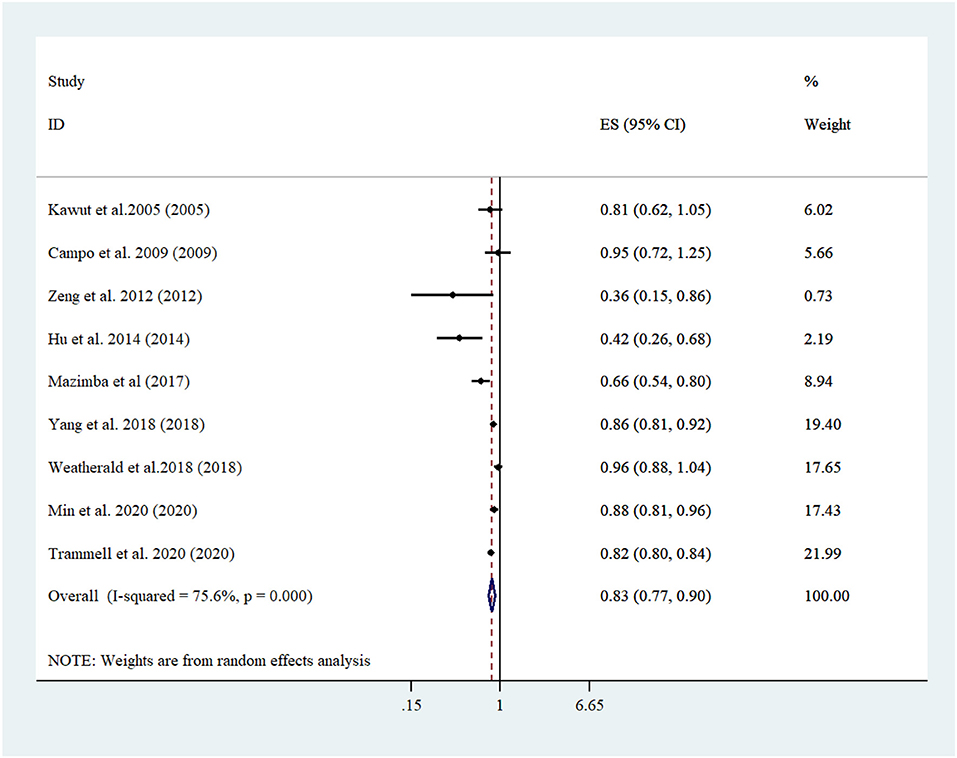
Figure 2. Forest plot derived from random-effects meta-analysis of studies investigating the association between 5-unit increment in body mass index and mortality among pulmonary hypertension patients. CI, confidence interval; ES, effect size.

Table 3. Results of subgroup analysis for body mass index and risk of mortality among pulmonary hypertension patients.
Some evidence suggested a non-linear dose–response relation between BMI and risk of mortality among those suffering from PH (P-non-linearity <0.001, n = 7 studies) (Figure 3).
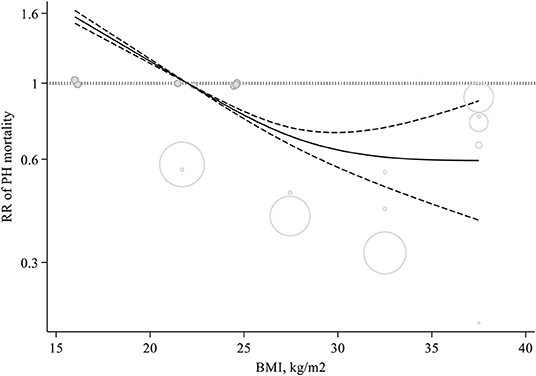
Figure 3. Non-linear dose-response meta-analysis of cohort studies investigating the association between body mass index and mortality among pulmonary hypertension patients (P < 0.001).
Discussion
This systematic review and meta-analysis stablished to investigate the relation between BMI and mortality among patients with PH. The most noticeable issue that we came across in our study was that higher BMI was associated to decreased mortality. This entails that the phenomenon known as “obesity paradox” does in fact exist among PH patients. We noticed that 5 kg/m2 increment in BMI lowered mortality risk among PH patients to 17%. This relationship was found to be dose-dependent in such a way that mortality risk among the PH patients decreased from BMI 22–23 kg/m2 to higher amounts. When BMI reached 32–38 kg/m2, the RR was at its lowest.
We realized that among those suffering from PH, higher BMI was associated with decreased mortality. Similarly, in a clinical trial, it was found that when body mass increased by 10 kg/m2 the end result was a 10-year mortality decrease (39). Some studies indicated that BMI and long-term mortality were related in an opposite way with respect to hemodialysis as well as some chronic diseases, including; chronic obstructive pulmonary disease (40), peripheral vascular disease (41), coronary artery disease (42, 43). On the other hand, death risk has been confirmed to have a parallel relationship with higher BMI among the general population (44). Furthermore, based on the result of several studies, higher BMI is confirmed to be among the main risk factors for increased risk of PH (7, 12).
Subgroup analysis showed an inverse relationship between BMI and mortality among PH patients in studies conducted in US, those which were adjusted to age, those that not controlled diabetes, as well as those with lower duration of follow-up (<5 years). Obviously, a definite risk factor regarding PH mortality was age. A separate study also claimed that people who aged ≥65 years have higher mortality rates (45). Older obese patients were found to experience more concurrent conditions like diabetes and systemic hypertension (46, 47). Moreover, pulmonary hypertension (PH) is highly common in the United States and affects more than 5 million adults. We also found a growing prevalence in studies adjusted for age and those were carried out in US.
Despite the fact that a persuasive explanation has not yet been proposed for this phenomenon, data suggests that in comparison with non-obese patients, obese ones enjoy a better prognosis, which is in fact due to the abundance of adipose tissue (48). Considering patients suffering from chronic diseases like chronic obstructive pulmonary disease, heart failure, coronary heart disease, and PAH, were found to sustain a higher baseline inflammatory condition, with markers like interleukin-1, interleukin-6, tumor necrosis factor–alpha levels, they undergo higher catabolic burden and cachexia (11). Thus, the extra adipose tissue may ultimately result in a reduction of cytokines in PAH as well which in turn affects the prognosis in a positive way. Additionally, considering that renin-angiotensin system upregulation in late experimental PAH was confirmed to be strongly related to mortality, it is safe to conclude that there is an advantage for those patients who are obese since they are proved to have weakened reaction to renin-angiotensin system (49). Based on the reports of a PH animal model, obesity paradox may, partially, be explained by considering the overexpression of the sympathetic nervous activity which regulates the pulmonary vascular tone in a different way, hence limiting the debilitative impacts of the severity of PH (50). In the same vein, some authors have hypothesized that ischemic preconditioning, from random exposures of chronic hypoxemia, and growing sympathetic nervous activity in obesity, might paradoxically grant a survival advantage (51). Moreover, the overweight and obese groups were found to have a lower pulmonary vascular resistance, although the degree of resistance was similar when indexed to body surface area, therefore no explanation for the differences in the survival observed could be provided based on them (19). Also, obese individuals had higher pulmonary artery wedge pressures, which likely reflects a greater prevalence of concomitant HFpEF, which in turn, leads in a lower trans pulmonary gradient and PVR (19).
This study has some strengths. The prospective design of the included studies was the main strength of the present meta-analysis. Also, linear and non-linear dose-response analysis, provided the most compelling evidence in help us have a quantitative evaluation of relationships. Thanks to this analysis, we could estimate the shape of these possible associations. This relationship was found to be dose-dependent in such a way that mortality risk among the PH patients decreased from BMI 22–23 kg/m2 to higher amounts. When BMI reached 32–38 kg/m2, the RR was at its lowest.
Limitations of the present study are referral bias and confounding by indication, which might limit the generalizability of the findings to some extent. We studied the association of BMI with mortality among PH patients rather than any general population, which likely reflects referral bias. As mentioned earlier, our data are observational, and therefore no causal inferences can be drawn. The role of residual confounders which result from unmeasured factors such as behavioral and biological ones or biases which inevitably occur in the measurement of covariates, cannot be completely excluded thanks to the observational nature of the included studies. Although there are some limitations using BMI as measure for obesity, it is still the most established and universally accepted indicator for obesity. Moreover, this meta-analysis revealed a noticeable heterogeneity between the studies. Therefore, a subgroup analysis seemed necessary to conduct to discover the cause of heterogeneity; and, we could detect some possible sources in linear analysis. Besides, some of the studies adjusted for factors like diabetes and hypertension which could be either confounders or intermediates in the relationship that could affect the identified associations. Furthermore, most of included studies had low quality which decrease the accuracy of our finding. Finally, we searched only main databases such as PubMed, Scopus and did not search other databases including ISI Web of Knowledge, EMBASE.
In conclusion, higher BMI were confirmed to decrease mortality risk with a dose-response relation among individuals with PH, and the lowest point of the dose-response curve appears to be in the BMI range of 32–38.
It is of outmost importance to stress that this relatively strong association between obesity and favorable survival, which is indeed paradoxical, does not stand for causation and is never meant to tempt people to obtain weight. The current results must be interpreted with caution. The dear reader should know that these results do not (1) confirm a constant causal relationship between weight gain and risk of mortality in PH, (2) support the idea that gaining weight reduces the risk of mortality (as only PH cases were included), and (3) suggest that gaining weight is healthy or leads to disease improvement in PH.
Data Availability Statement
The original contributions presented in the study are included in the article/Supplementary Material, further inquiries can be directed to the corresponding author/s.
Author Contributions
CJ wrote the first draft of the manuscript. All authors were contributed to the design of the study, data extraction and analysis, and critically revised and approved the manuscript.
Conflict of Interest
The authors declare that the research was conducted in the absence of any commercial or financial relationships that could be construed as a potential conflict of interest.
Publisher's Note
All claims expressed in this article are solely those of the authors and do not necessarily represent those of their affiliated organizations, or those of the publisher, the editors and the reviewers. Any product that may be evaluated in this article, or claim that may be made by its manufacturer, is not guaranteed or endorsed by the publisher.
Supplementary Material
The Supplementary Material for this article can be found online at: https://www.frontiersin.org/articles/10.3389/fpubh.2022.761904/full#supplementary-material
References
1. Puhl RM, Heuer CA. Obesity stigma: important considerations for public health. Am J Public Health. (2010) 100:1019–28. doi: 10.2105/AJPH.2009.159491
2. Williams EP, Mesidor M, Winters K, Dubbert PM, Wyatt SB. Overweight and obesity: prevalence, consequences, and causes of a growing public health problem. Curr Obes Rep. (2015) 4:363–70. doi: 10.1007/s13679-015-0169-4
3. Lainscak M, von Haehling S, Doehner W, Anker SD. The obesity paradox in chronic disease: facts and numbers. J Cachexia Sarcopenia Muscle. (2012) 3:1–4. doi: 10.1007/s13539-012-0059-5
4. Agarwal M, Agrawal S, Garg L, Lavie CJ. Relation between obesity and survival in patients hospitalized for pulmonary arterial hypertension (from a nationwide inpatient sample database 2003 to 2011). Am J Cardiol. (2017) 120:489–93. doi: 10.1016/j.amjcard.2017.04.051
5. Poirier P, Giles TD, Bray GA, Hong Y, Stern JS, Pi-Sunyer FX, et al. Obesity and cardiovascular disease: pathophysiology, evaluation, and effect of weight loss: an update of the 1997 American Heart Association Scientific Statement on Obesity and Heart Disease from the Obesity Committee of the Council on Nutrition, Physical Activity, and Metabolism. Circulation. (2006) 113:898–918. doi: 10.1161/CIRCULATIONAHA.106.171016
6. Berrington de Gonzalez A, Hartge P, Cerhan JR, Flint AJ, Hannan L, MacInnis RJ, et al. Body-mass index and mortality among 1.46 million white adults. N Engl J Med. (2010) 363:2211–9. doi: 10.1056/NEJMoa1000367
7. Frank RC, Min J, Abdelghany M, Paniagua S, Bhattacharya R, Bhambhani V, et al. Obesity is associated with pulmonary hypertension and modifies outcomes. J Am Heart Assoc. (2020) 9:e014195. doi: 10.1161/JAHA.119.014195
8. Peacock A, Murphy N, McMurray J, Caballero L, Stewart S. An epidemiological study of pulmonary arterial hypertension. Eur Respir J. (2007) 30:104–9. doi: 10.1183/09031936.00092306
9. Hyduk A, Croft JB, Ayala C, Zheng K, Zheng Z-J, Mensah GA. Pulmonary hypertension surveillance—United States, 1980–2002. MMWR Surveill Summ. (2005) 54:1–28.
10. D'Alonzo GE, Barst RJ, Ayres SM, Bergofsky EH, Brundage BH, Detre KM, et al. Survival in patients with primary pulmonary hypertension: results from a national prospective registry. Ann Intern Med. (1991) 115:343–9. doi: 10.7326/0003-4819-115-5-343
11. Groth A, Vrugt B, Brock M, Speich R, Ulrich S, Huber LC. Inflammatory cytokines in pulmonary hypertension. Respir Res. (2014) 15:47. doi: 10.1186/1465-9921-15-47
12. Yang BQ, Assad TR, O'Leary JM, Xu M, Halliday SJ, D'Amico RW, et al. Racial differences in patients referred for right heart catheterization and risk of pulmonary hypertension. Pulm Circ. (2018) 8:2045894018764273. doi: 10.1177/2045894018764273
13. Lainscak M, von Haehling S, Doehner W, Sarc I, Jeric T, Ziherl K, et al. Body mass index and prognosis in patients hospitalized with acute exacerbation of chronic obstructive pulmonary disease. J Cachexia Sarcopenia Muscle. (2011) 2:81–6. doi: 10.1007/s13539-011-0023-9
14. Fonarow GC, Srikanthan P, Costanzo MR, Cintron GB, Lopatin M, Committee ASA, et al. An obesity paradox in acute heart failure: analysis of body mass index and inhospital mortality for 108 927 patients in the Acute Decompensated Heart Failure National Registry. Am Heart J. (2007) 153:74–81. doi: 10.1016/j.ahj.2006.09.007
15. Uretsky S, Messerli FH, Bangalore S, Champion A, Cooper-DeHoff RM, Zhou Q, et al. Obesity paradox in patients with hypertension and coronary artery disease. Am J Med. (2007) 120:863–70. doi: 10.1016/j.amjmed.2007.05.011
16. Lavie CJ, Sharma A, Alpert MA, De Schutter A, Lopez-Jimenez F, Milani RV, et al. Update on obesity and obesity paradox in heart failure. Prog Cardiovasc Dis. (2016) 58:393–400. doi: 10.1016/j.pcad.2015.12.003
17. Zafrir B, Adir Y, Shehadeh W, Shteinberg M, Salman N, Amir O. The association between obesity, mortality and filling pressures in pulmonary hypertension patients; the “obesity paradox”. Respir Med. (2013) 107:139–46. doi: 10.1016/j.rmed.2012.10.019
18. Mazimba S, Holland E, Nagarajan V, Mihalek A, Kennedy J, Bilchick K. Obesity paradox in group 1 pulmonary hypertension: analysis of the NIH-Pulmonary Hypertension registry. Int J Obes. (2017) 41:1164–8. doi: 10.1038/ijo.2017.45
19. Min J, Feng R, Badesch D, Berman-Rosenzweig E, Burger C, Chakinala M, et al. Obesity in pulmonary arterial hypertension (PAH): The Pulmonary Hypertension Association Registry (PHAR). Ann Am Thorac Soc. (2021) 18:229–37. doi: 10.1513/AnnalsATS.202006-612OC
20. Zeng W-J, Sun Y-J, Gu Q, Xiong C-M, Li J-J, He J-G. The impact of pulmonary arterial hypertension-targeted therapy on survival in Chinese patients with idiopathic pulmonary arterial hypertension. Pulm Circ. (2012) 2:373–8. doi: 10.4103/2045-8932.101655
21. Moher D, Shamseer L, Clarke M, Ghersi D, Liberati A, Petticrew M, et al. Preferred reporting items for systematic review and meta-analysis protocols (PRISMA-P) 2015 statement. Syst Rev. (2015) 4:1. doi: 10.1186/2046-4053-4-1
22. O'Connell WGSB, Losos DPJWV. M, Tugwell P. The Newcastle-Ottawa Scale (NOS) for assessing the quality if nonrandomized studies in meta-analyses. (2012)
23. Higgins JP, Green S. Cochrane handbook for systematic reviews of interventions. Chichester, England; Hoboken. NJ: Wiley-Blackwell;. (2008) doi: 10.1002/9780470712184
24. Egger M, Smith GD, Schneider M, Minder C. Bias in meta-analysis detected by a simple, graphical test. BMJ. (1997) 315:629–34. doi: 10.1136/bmj.315.7109.629
25. Greenland S, Longnecker MP. Methods for trend estimation from summarized dose-response data, with applications to meta-analysis. Am J Epidemiol. (1992) 135:1301–9. doi: 10.1093/oxfordjournals.aje.a116237
26. Orsini N, Bellocco R, Greenland S. Generalized least squares for trend estimation of summarized dose-response data. Stata J. (2006) 6:40. doi: 10.1177/1536867X0600600103
27. Orsini N, Li R, Wolk A, Khudyakov P, Spiegelman D. Meta-analysis for linear and nonlinear dose-response relations: examples, an evaluation of approximations, and software. Am J Epidemiol. (2012) 175:66–73. doi: 10.1093/aje/kwr265
28. Berlin JA, Longnecker MP, Greenland S. Meta-analysis of epidemiologic dose-response data. Epidemiology. (1993) 4:218–28. doi: 10.1097/00001648-199305000-00005
29. DerSimonian R, Laird N. Meta-analysis in clinical trials. Control Clin Trials. (1986) 7:177–88. doi: 10.1016/0197-2456(86)90046-2
30. Campo A, Mathai SC, Le Pavec J, Zaiman AL, Hummers LK, Boyce D, et al. Hemodynamic predictors of survival in scleroderma-related pulmonary arterial hypertension. Am J Respir Crit Care Med. (2010) 182:252–60. doi: 10.1164/rccm.200912-1820OC
31. Hu EC, He JG, Liu ZH, Ni XH, Zheng YG, Gu Q, et al. High levels of serum lactate dehydrogenase correlate with the severity and mortality of idiopathic pulmonary arterial hypertension. Exp Ther Med. (2015) 9:2109–13. doi: 10.3892/etm.2015.2376
32. Kawut SM, Horn EM, Berekashvili KK, Garofano RP, Goldsmith RL, Widlitz AC, et al. New predictors of outcome in idiopathic pulmonary arterial hypertension. Am J Cardiol. (2005) 95:199–203. doi: 10.1016/j.amjcard.2004.09.006
33. Marini C, Formichi B, Bauleo C, Michelassi C, Airò E, Rossi G, et al. Survival protection by bodyweight in isolated scleroderma-related pulmonary artery hypertension. Intern Emerg Med. (2016) 11:941–52. doi: 10.1007/s11739-016-1446-2
34. Ngunga M, Abeid AM, Jeilan Mohamed D, Barasa A. Long-term outcomes and factors associated with mortality in patients with moderate to severe pulmonary hypertension in Kenya. Glob Heart. (2020) 15:6. doi: 10.5334/gh.384
35. Poms AD, Turner M, Farber HW, Meltzer LA, McGoon MD. Comorbid conditions and outcomes in patients with pulmonary arterial hypertension: a REVEAL registry analysis. Chest. (2013) 144:169–76. doi: 10.1378/chest.11-3241
36. Strange G, Lau EM, Giannoulatou E, Corrigan C, Kotlyar E, Kermeen F, et al. Survival of idiopathic pulmonary arterial hypertension patients in the modern era in Australia and New Zealand. Heart Lung Circ. (2018) 27:1368–75. doi: 10.1016/j.hlc.2017.08.018
37. Trammell AW, Hemnes AR, Tseng V, Shah AJ, Phillips LS, Hart CM. Influence of body weight and diabetes mellitus in patients with pulmonary hypertension. Am J Cardiol. (2020) 134:130–7. doi: 10.1016/j.amjcard.2020.07.062
38. Weatherald J, Huertas A, Boucly A, Guignabert C, Taniguchi Y, Adir Y, et al. Association between BMI and obesity with survival in pulmonary arterial hypertension. Chest. (2018) 154:872–81. doi: 10.1016/j.chest.2018.05.006
39. Benza RL, Gomberg-Maitland M, Naeije R, Arneson CP, Lang IM. Prognostic factors associated with increased survival in patients with pulmonary arterial hypertension treated with subcutaneous treprostinil in randomized, placebo-controlled trials. J Heart Lung Transplant. (2011) 30:982–9. doi: 10.1016/j.healun.2011.03.011
40. Cao C, Wang R, Wang J, Bunjhoo H, Xu Y, Xiong W. Body mass index and mortality in chronic obstructive pulmonary disease: a meta-analysis. PLoS ONE. (2012) 7:e43892. doi: 10.1371/journal.pone.0043892
41. Golledge J, Cronin O, Iyer V, Bradshaw B, Moxon JV, Cunningham MA. Body mass index is inversely associated with mortality in patients with peripheral vascular disease. Atherosclerosis. (2013) 229:549–55. doi: 10.1016/j.atherosclerosis.2013.04.030
42. Wang ZJ, Zhou YJ, Galper BZ, Gao F, Yeh RW, Mauri L. Association of body mass index with mortality and cardiovascular events for patients with coronary artery disease: a systematic review and meta-analysis. Heart. (2015) 101:1631–8. doi: 10.1136/heartjnl-2014-307119
43. Jialin W, Yi Z, Weijie Y. Relationship between body mass index and mortality in hemodialysis patients: a meta-analysis. Nephron Clin Pract. (2012) 121:c102–c11. doi: 10.1159/000345159
44. Aune D, Sen A, Prasad M, Norat T, Janszky I, Tonstad S, et al. BMI and all cause mortality: systematic review and non-linear dose-response meta-analysis of 230 cohort studies with 3.74 million deaths among 30.3 million participants. BMJ. (2016) 353:i2156. doi: 10.1136/bmj.i2156
45. Chang WT, Weng SF, Hsu CH, Shih JY, Wang JJ, Wu CY, et al. Prognostic factors in patients with pulmonary hypertension—a nationwide cohort study. J Am Heart Assoc. (2016) 5:e003579. doi: 10.1161/JAHA.116.003579
46. Strange G, Playford D, Stewart S, Deague JA, Nelson H, Kent A, et al. Pulmonary hypertension: prevalence and mortality in the Armadale echocardiography cohort. Heart. (2012) 98:1805–11. doi: 10.1136/heartjnl-2012-301992
47. Gall H, Felix JF, Schneck FK, Milger K, Sommer N, Voswinckel R, et al. The giessen pulmonary hypertension registry: survival in pulmonary hypertension subgroups. J Heart Lung Transplant. (2017) 36:957–67. doi: 10.1016/j.healun.2017.02.016
48. Parto P, Lavie CJ, Arena R, Bond S, Popovic D, Ventura HO. Body habitus in heart failure: understanding the mechanisms and clinical significance of the obesity paradox. Future Cardiol. (2016) 12:639–53. doi: 10.2217/fca-2016-0029
49. Lavie CJ, Alpert MA, Arena R, Mehra MR, Milani RV, Ventura HO. Impact of obesity and the obesity paradox on prevalence and prognosis in heart failure. JACC Heart Fail. (2013) 1:93–102. doi: 10.1016/j.jchf.2013.01.006
50. Diong C, Jones P, Tsuchimochi H, Gray E, Hughes G, Inagaki T, et al. Sympathetic hyper-excitation in obesity and pulmonary hypertension: physiological relevance to the ‘obesity paradox’. Int J Obes. (2016) 40:938–46. doi: 10.1038/ijo.2016.33
Keywords: body mass index, mortality, pulmonary hypertension, meta-analysis, dose-response
Citation: Jiang C, Fang X and Fu W (2022) The Association of Body Mass Index With Mortality Among Pulmonary Hypertension Patients: A Systematic Review and Meta-Analysis of Cohort Studies. Front. Public Health 10:761904. doi: 10.3389/fpubh.2022.761904
Received: 20 August 2021; Accepted: 29 March 2022;
Published: 10 May 2022.
Edited by:
Erin Hennessy, Tufts University, United StatesReviewed by:
Mojtaba Heydari, Shiraz University of Medical Sciences, IranFoong Ming Moy, University of Malaya, Malaysia
Copyright © 2022 Jiang, Fang and Fu. This is an open-access article distributed under the terms of the Creative Commons Attribution License (CC BY). The use, distribution or reproduction in other forums is permitted, provided the original author(s) and the copyright owner(s) are credited and that the original publication in this journal is cited, in accordance with accepted academic practice. No use, distribution or reproduction is permitted which does not comply with these terms.
*Correspondence: Wenjin Fu, ZGZmd2pAc2luYS5jb20=