 Dan Qiang
 Lingzhu Zhang
 Xiaotong Huang
- 1Department of Architecture, College of Architecture and Urban Planning, Tongji University, Shanghai, China
- 2Key Laboratory of Ecology and Energy-Saving Study of Dense Habitat, Tongji University, Shanghai, China
Transit-oriented development (TOD) has been widely adopted as a primary urban planning strategy to better integrate transit and land use; further, the pedestrian-oriented perspective has been receiving increasing attention. However, most studies so far have only focused on few features and fail to capture comprehensive perceptions in the transportation (T), pedestrian-oriented accessibility (O), and urban development (D) dimensions. New emerging urban datasets provide a more refined and systematic approach to quantify the characteristics of metro station areas. This study offers a more efficient and convenient process and comprehensive approach to measure TOD performance. With a combination of traditional data collected by an official department, high-resolution open data, and innovative technology, large-scale analyses of 347 metro stations in Shanghai were conducted. Fifteen indicators for T, O, and D were chosen to categorize TOD performance into five clusters. Radar charts, boxplots, and colored maps were used to display numerous quantitative factors for each type. Combining the results with the Shanghai Comprehensive Plan (2017–2035) showed that the majority of Cluster 4 is located at the center of the Five New Towns. The correlation analysis between ridership and TOD performance showed that the transportation dimension indicator has a strong correlation with daily ridership, followed by the O and D indicators. Moreover, ridership per capita was found to be affected by resident density, employment density, O value, and D value, whereas no significant correlation was found between ridership per capita and T value. Population plays a pivotal role in metro passenger traffic, indicating ridership per capita had a high, strong correlation with resident density, with R = 0.658 for weekdays and R = 0.654 for weekends. This study reinterpreted the node-place method and 5Ds framework, resulting in a renewal method with new datasets and analysis tools. It contributes to providing pedestrian-oriented TOD planning methodology for urban planners and policymakers by combining T, O, and D dimensions and visualizing the results with current urban planning.
1. Introduction
China has undergone urbanization at an unprecedented rate over the last few decades. According to the National Bureau of Statistics of China, more than 60% of Chinese residents lived in cities in 2020, and this percentage is expected to rise to 70% by 2035 (1, 2). The cities' general expansion usually leads to large-scale construction of transportation infrastructure as a result of the increasing travel distance (3, 4). For example, urban rail transit is an effective alternative mode that can help mitigate the negative effects of rapid urbanization on the urban transportation system (5–7). Meanwhile, using transit and land-use integration (or “station-city integration”) to develop urban rail transit is one of the most effective strategies, and is frequently endorsed by policymakers (8–10). Transit-oriented development (TOD) is a common response to this integration (11, 12), as it encourages maximizing urban development around public transportation stations and forming high-density communities with diverse functions and walkable environments (13, 14).
In recent years, China has widely adopted TOD as a primary urban planning strategy (15, 16). However, there is still significant progress to be made to achieve efficient TOD, due to the slow growth of theory and practice. In most of China's recent planning strategies, transit station characteristics have received overwhelming attention. In addition, profit-driven land development and fragmentary management have created institutional obstacles to integrating land use and transit (17). Therefore, governments and developers should sufficiently promote the concept of TOD in local contexts and improve their comprehensive understanding of this concept to better integrate transit and land-use (18–20).
Most recently, a rapid increase in quantitative analytical tools and new urban data have provided new research potential in urban transport research. In China, many pioneering studies utilized big data to access daily travel and activities at fine-grained spatial networks (17, 21), and to understand how they interact with social, environmental, and urban forms (22, 23). In terms of evaluating urban structure and function, some researchers identified work and home locations and commuting patterns (24–27), while others revealed the urban polycentric structure and function distribution (28–31). Nevertheless, the application of big data for measuring TOD performance has seldom been studied in China (32).
TOD performance can measure the extent of the existing integration of transit and land use, as well as other attributes, such as pedestrian friendliness, urban form, and quality of public facilities around TOD sites (33, 34). Although several studies have generated many insights on quantifying TOD performance, little research has explored how new urban data could furnish unexpected outcomes and improvement. Multi-source urban data, including points of interest (PoIs), location-based service data, street view images (SVIs), and built environment data, offer a larger and more representative sample and a finer scale of spatiotemporal resolution (35, 36). New technologies, such as machine learning algorithms and Spatial Design Network Analysis (sDNA) based on ArcGIS, provide novel analysis methods for quantifying the characteristics of road and pedestrian networks (37, 38). This can help overcome some limitations of traditional data, including labor consumption, small samples, and low frequency.
In this context, Zhou analyzed a case of 167 metro stations in Shenzhen, combining traditional and non-traditional data (e.g., social media data, digital maps, PoIs, interviews, and surveys) to propose new indicators of TOD performance and its relationship to spatial and behavior characteristics (39). Nonetheless, this previous study mostly focused on transportation behavior on a citywide scale, paying less attention to pedestrian-oriented urban design as well as transit and land use integration. In addition, other quantitative studies have rarely examined TOD types and variations in China to further optimize future urban planning.
Thus, exploring how metro stations can be integrated into urban spaces under the concept of station-city integration, studying the relationship between transit nodes and urban places in-depth, and developing a quantitative synergy evaluation index via multi-source urban data are all crucial components of prioritizing sustainable transportation and realizing digital management.
The remainder of the article is organized as follows. Section 2 provides a review of the literature review on TOD performance, node-place model, and human-oriented indicators. Section 3 introduces the methods—the city sample, data, and analysis. Section 4 presents the results on five TOD types. Section 5 provides a discussion on urban planning implications and contributions. Finally, Section 6 presents conclusions and limitations.
2. Literature Review
Previous researchers have found that TOD typologies contribute to targeted strategies for TOD promotion (40, 41), the identification of prevalent issues (42, 43), and investment estimates (44). During the late 20th century, many researchers suggested the idea of mixed-use, compact developments with pedestrian-friendly built environments. The “3Ds” (45)—density, diversity, and design—are commonly regarded as the most fundamental indicators for evaluating the TOD performance of railway station areas. However, by combining destination accessibility and distance to transit (46), the “5Ds” became more systematic standards.
The node-place theory provides a practical method for evaluating TOD performance based on travel demand (“node”) and land use (“place”) (47), which subsequent studies have referred to as the “T” (node) and “D” (place) dimensions, respectively (48). A node index was created using the connection, frequency, and diversity of transport services, while a location index was developed using factors such as the functional mixture, number of inhabitants, or number of employees. Five TOD typologies (i.e., balance, stress, dependency, unsustained place, and unsustained node) were identified when two indices were converted into an XY diagram. The station is defined as an “unsustained node” when T exceeds D. It is an “unsustained place” when D surpasses T. The node-place theory is capable of and effective in assessing the balance between transportation supply (T) and surrounding urban development (D) under the station-city integration concept.
However, locations in the node-place method were criticized for being Transit Adjacent Development (TAD), rather than TOD (49, 50). Accordingly, a significant amount of research has introduced numerous modifications and extensions. Table 1 summarizes selected studies on the quantification of TOD performance. Notably, of the 27 publications, 14 referred to walking and pedestrian indicators. Among them, several researchers had introduced a new dimension to extend the classic “node-place” model. Vale (50) proposed the pedestrian shed ratio as a measure of pedestrian friendliness. Based on this, Lyu (48) established an additional “Oriented” (O) dimension of functional and morphological characteristics and selected 18 out of 94 systematic variables to assess Chinese context-based TOD in Beijing. Recent studies have extended “node-place” model to “node-tie-place” model (51) and “node-functionality-place” model (52) by adding functionality indicators (51, 52). Moreover, several previous studies have also emphasized pedestrian-oriented perspective as an important dimension in transit station areas (11, 39, 53–58). Nevertheless, pedestrian-friendly dimension quantitative studies are rarely conducted to comprehensively examine the TOD performance.
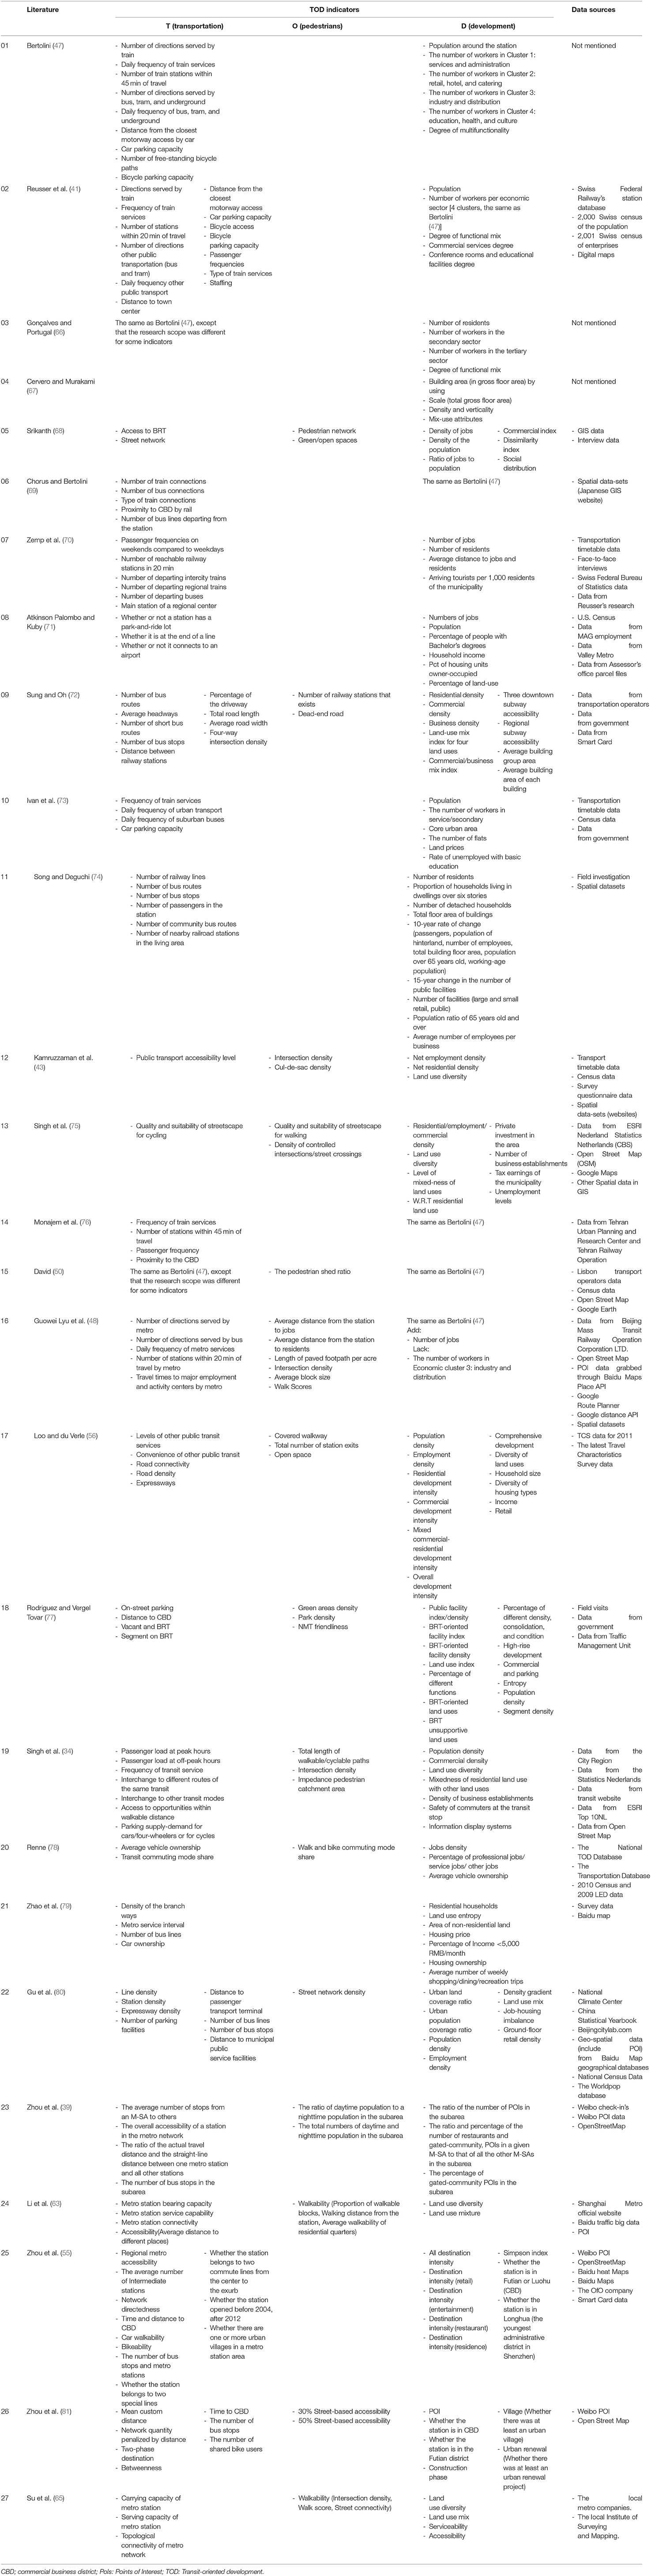
Table 1. Comparison of the indicators used in the reviewed literature to measure TOD performance.
Although many studies have begun to employ quantitative approaches to investigate the relationship between metro station accessibility and neighborhood vitality, a majority of them still rely on the traditional manually collected data. Thus, there is a need for a more systematic and human-oriented approach to evaluate TOD performance in metro station areas, especially in high-density cities. In this study, based on multi-source data and quantitative approach from the pedestrian-oriented perspective, we opted to combine the pedestrian-friendly dimension with T and D. With reference to earlier studies, we considered specific pedestrian-friendly features of the “oriented” dimension that can receive interventions by policymakers, urban planners, or designers as practical TOD planning tools.
3. Data and Methods
3.1 Analytical Framework
The four key steps of the present study were data collection, element extraction, evaluation, measurement, and guidance (Figure 1). First, metro lines and stations, 3D building information and PoIs, the third economic census, and the street network of Shanghai were gathered. Second, three critical TOD performance variables were extracted from the dataset. Each dimension was evaluated by five sub-indicators, the calculation details of which will be discussed later. Third, the evaluation process had two stages: (1) to create five TOD performance categories, hierarchical cluster analysis was utilized to organize the dataset into a cluster tree; (2) radar charts were then used to directly display numerous quantitative factors for each type. Therefore, a TOD performance measurement system was created to provide planners and policymakers with a better understanding of existing TOD and to diagnose common problems and design targeted policies for special station types.
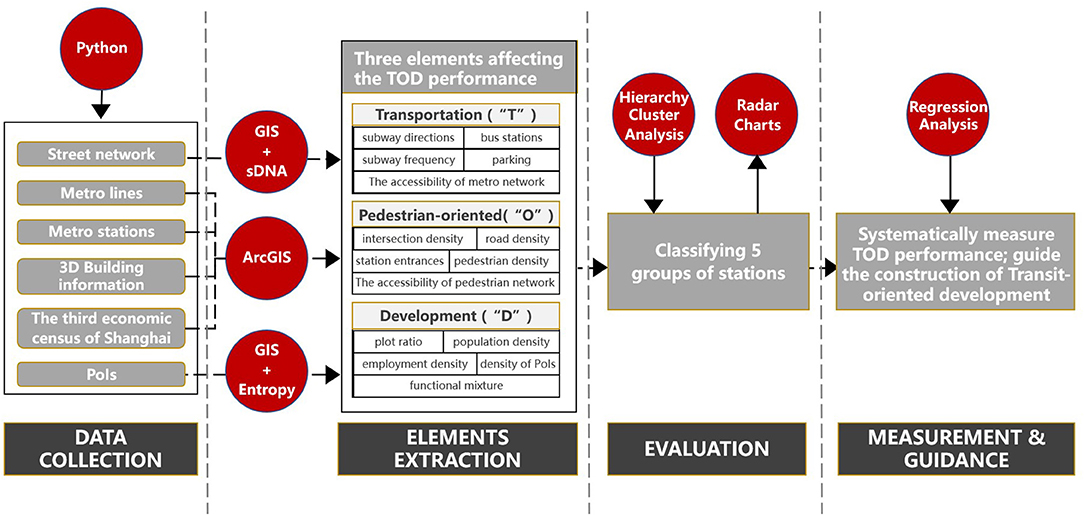
Figure 1. Analytic framework.
3.2 Study Area: Shanghai
Shanghai, China's metropolis, has what is officially the longest railway network worldwide (59). According to the Shanghai Transportation Industry Operation Bulletin, as of June 2021, the city has completed 460 metro stations and 19 lines, with a total operational length of 772 km. The metro railway is Shanghai's major mode of transportation, carrying over 10 million passengers each weekday. However, the performance and types of stations vary significantly, as do the surrounding land use and morphology. Thus, Shanghai provides a sufficient number of cases, and it is essential to analyze the TOD variants and typology to discover common problems and offer targeted strategies.
Local governors have introduced the TOD concept to land-use planning and adopted the TOD as a critical strategy for sustainable urban development. Recently, the Shanghai municipal government announced the Fourteenth 5-Year Plan for Shanghai Comprehensive Transportation Development, which emphasizes station-city integration as a more specific requirement for metro station construction. In particular, building a systematic and comprehensive transportation system for new towns is highlighted in this plan to achieve internal high-quality traffic (60). In addition, Shanghai has outlined its plan for digital transformation, aiming to become a global capital for digitization by 2,035. Therefore, a data-driven approach to systematically measuring TOD performance seems urgent for understanding and promoting better place-making.
3.3 Measuring TOD Performance via Three Dimensions
This study used Shanghai's existing metro stations in 2019 as cases, which comprised 347 metro stations and 18 metro lines (Figure 2). In accordance with the TOD theory and comfortable walking distance in Shanghai (9), the research scope (RS) of the built environment surrounding each metro station was within a 500-meter radius. In the context of a Chinese city, Lyu (48) conducted a systematic review of TOD indicators and divided them into three categories. Considering the occurrence frequency of each indicator in earlier literature (Table 1) and their data availability, we selected 15 indicators from three dimensions, “Transportation (T),” “Pedestrian-oriented (O),” and “Development (D),” to measure the TOD performance of the aforementioned stations (Table 2). The T dimension represents transport development in metro station areas, D dimension reveals the land use development, and O dimension represents the pedestrian-oriented functional and morphological characteristics in metro station areas.
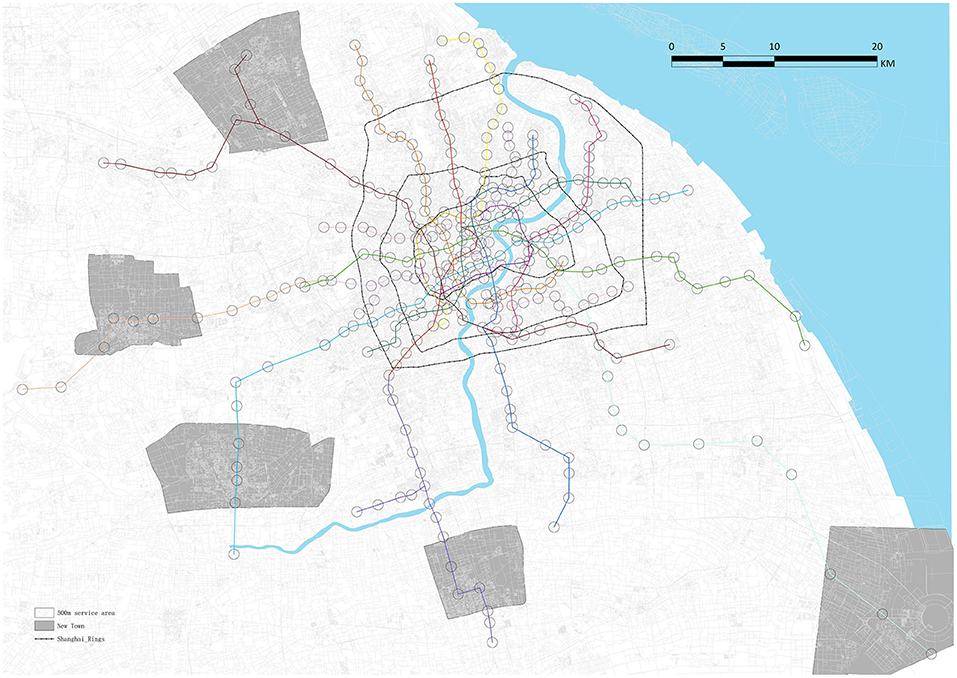
Figure 2. The study area and 500 m metro service area.
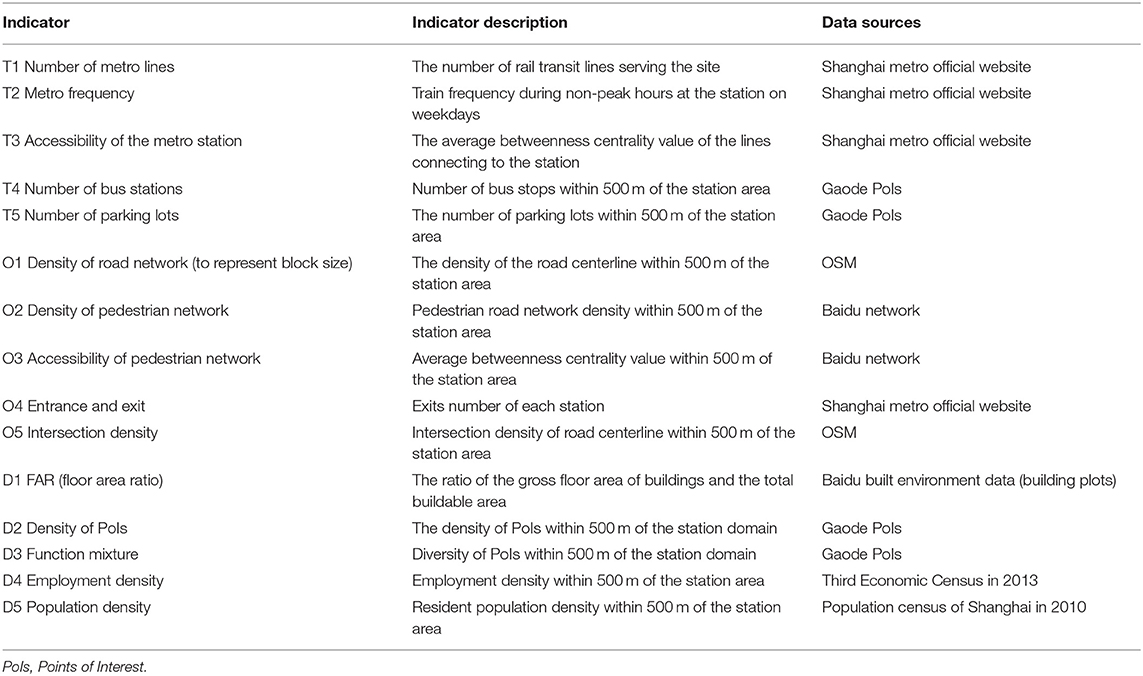
Table 2. Overview of indicators.
For three dimensions, with reference to the earlier literature (25, 48, 52), we first chose the indicators “Number of metro lines,” “Metro frequency,” “Accessibility (betweenness) of the metro station,” “Number of bus stops,” and “Number of parking lots” for T dimension; “Density of road network,” “Intersection density,” and “Number of entrances and exits” for O dimension; and “Function mixture,” “Employment density,” “Population density” for D dimension. Second, to show an overall character of walking capability around the metro station, we introduced new indicators to provide a more precise perspective; both O2-Density of pedestrian network and O3- Accessibility of pedestrian network were calculated by sDNA (61), based on pedestrian network from Baidu Map. Third, with the help of built environment data, we used “Floor area ratio and Density of PoIs” to enrich the “D” dimension.
3.3.1 Dataset
Multi-sourced urban data, including traditional and non-traditional data, were collected to represent aforementioned indicators. For example, on the one hand, for non-traditional data, 77,724 street polyline from Open Street Map (OSM) (2019), 559,777 street polyline and 754,607 building plots data from Baidu maps API and Python (2019), and a total of more than 2.7 million PoIs data from Gaode Map (2019) were collected. On the other hand, traditional data provided by Shanghai metro official website and Shanghai census was used to represent the physical characteristics of metro stations and social attributes of surrounding blocks.
Then, further data preprocessing was conducted in ArcGIS. For building plots data, each building with a height below 3m or over Shanghai's highest building (640 m) was removed. For PoIs data, we deleted some unimportant information, retaining only the name, geographical location, and multilevel categories' fields. Next, repetitive records and any record with publication time after July 16, 2019 were deleted. As for multilevel categories of this PoIs dataset, we used the second-level category to sift out bus stations and parking plots. The top-level category, used to calculate function mixture, was grouped into nine categories according to the types of residents' daily activities and the actual functions of each PoIs, including residential communities, traffic facilities, commercial and business, tourist attractions, food and shopping, education facilities, government and public services, financial services, and public facilities (62). Among them, those in the commercial and business categories were replaced with the same type of Baidu PoIs, since each Gaode PoI in this category represents one shopping mall rather than an individual retail store by Baidu PoI.
Thereafter, all datasets were intersected with RS separately. As a result, 65,981 polylines and 154,480 building plots of Baidu Map, 20,465 polylines of OSM, and 169,168 PoIs of Gaode Map were extracted. In the finalized data analysis, which is demonstrated below, the resultant data matrix had 347 rows, one for each station, and 15 columns, one for each indicator.
3.3.2 Transportation Dimension
As previously stated, the T dimension was used to depict the station's convenience for automobiles and the surrounding environment. The number of metro directions, bus stations, and parking spaces, along with metro frequency and metro network accessibility, were chosen to represent the “T” component. For example, the number of metro directions and metro frequency can indicate metro station size, whereas the other three indicators can indicate how convenient it is to get to this station by vehicle.
The number of metro directions and metro frequency were obtained from Shmetro's official website (63), which is the administrative authority for Shanghai's metro railways. The number of metro directions distinguishes terminal stations; however, the number of metro lines obtained directly from the website does not. The metro frequency indicated the number of metro trains that would run through the station per hour. Python and AutoNavi's Map API were used to capture 2,764,864 PoIs. Following that, the numbers of bus stations and parking spaces, which are typically impossible to estimate manually, were indicted by the number of matching functions of PoIs within a 500-meter radius of each station. The measure of betweenness centrality of each line between two stations was calculated by sDNA (61) to reflect the flow potential of each link of the metro network (Figure 3). Betweenness centrality was measured using the following equation:
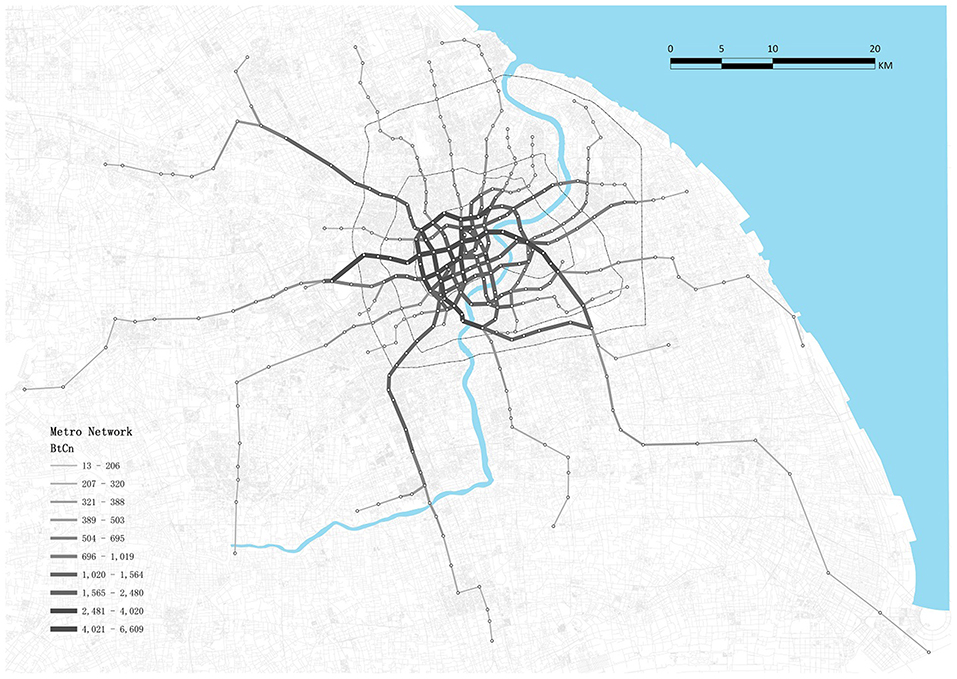
Figure 3. Betweenness centrality of Shanghai metro network.
where is 1 if x lies on the shortest path from y to z and 0 if it does not.
The betweenness centrality of each station is the average value of links within each station area.
3.3.3 Pedestrian-Oriented Dimension
The O dimension was used to reflect the station's pedestrian accessibility and the surrounding environment. Similarly, the density of the road network, pedestrian network, and intersections, and the number of metro station entrances and accessibility of the pedestrian network were chosen to represent the “O” component. For example, the number of metro station entrances can demonstrate how many ways citizens can walk to the station, whereas the other four indications can illustrate how convenient it is to reach the station on foot.
Except for the number of metro station entrances, which was obtained from Shmetro's official website, the other four indicators were calculated on ArcGIS, based on the road network from the Open Street Map (OSM) platform and the pedestrian network from Baidu; the later dataset contains more branches than the earlier one. Specifically, road network density was calculated by dividing the total length of the main roads in an RS by its area; the density of the pedestrian network and intersections were the total length and the intersection number of pedestrian roads in an RS over its area. Finally, as shown in Figure 4, the accessibility of the pedestrian network was captured by the betweenness hybrid (BtH500) of pedestrian network use, sDNA (37).
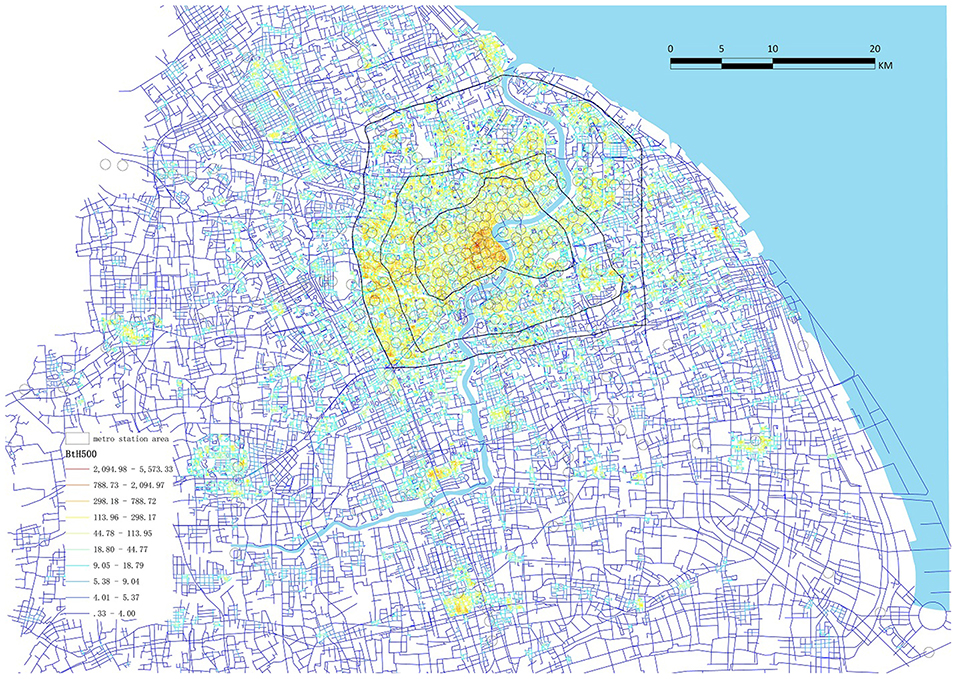
Figure 4. Hybrid betweenness centrality of the pedestrian network by the software sDNA (radius at 500 m).
3.3.4 Development Dimension
The final component was the D dimension, which was used to describe the development level of the station's surrounding built environment. The plot ratio, density of PoIs, functional mixture, employment density, and population density, which is more connected to society and economics, were chosen to symbolize the “D” component. Plot ratio and employment/population density, for instance, can be used to demonstrate the density of people and buildings inside the RS. The other two indicators, the density of PoIs and functional mixture, can substantially define its diversity.
These five indicators originate from various sources. First, the footprint and height information of buildings of 754,607 buildings plots were retrieved via Baidu maps API and Python to get FAR (floor area ratio). Second, the total number of PoIs over the range of the relevant RS was used to calculate PoI density (Figure 5). Further, the functional mixture was quantified using the Shannon entropy of the nine categories of PoIs (64). The formula used is as follows:
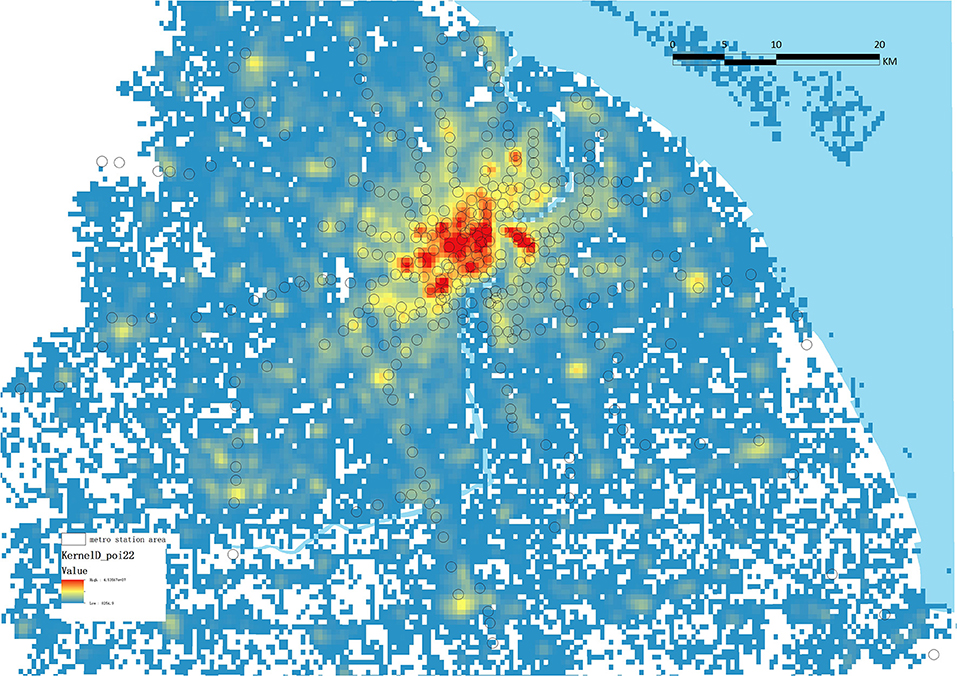
Figure 5. Example of nuclear density of PoIs.
where SWi represents the Shannon–Wiener index of each station area, Pi is the proportion of urban facilities belonging to the ith type of functional categories, and R is the total number of main functional categories (9 in our analysis).
3.3.5 Indicators Integration
To obtain the final integrated TOD performance, the abovementioned three components were added with equal weight. Before integrating all indicators, they were rescaled to have minimum and maximum values of 0 and 1, respectively, using the following formula:
4. Results
4.1 Quantitatively Measuring TOD Performance
In Figure 6, the box plots depict the descriptive statistics of various variables. The mean is represented by the x in the box, the median is represented by the line across the box, and the first (Q1) and third (Q3) quartiles are represented by the bottom and top of the box, respectively. The lengthy upper whiskers on all box plots imply that TOD performance varies depending on the variable's higher value. T and D's box plot positions are similar and low, showing that most of stations perform overall poorly on station-city integration.
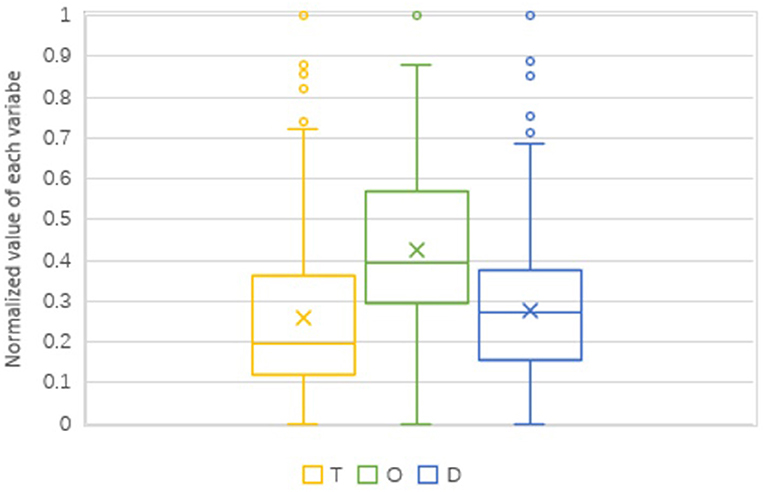
Figure 6. Boxplots for T, O, and D values (normalized).
Each variable was rated and then divided into five classes by natural breaks (Jenks) to determine the geographical distribution of the imbalanced TOD performance. The lowest quintile received a 1, whereas the top quintile received a 5. Figure 7 displays the score of three components for assessing TOD performance at the metro station-level in Shanghai.
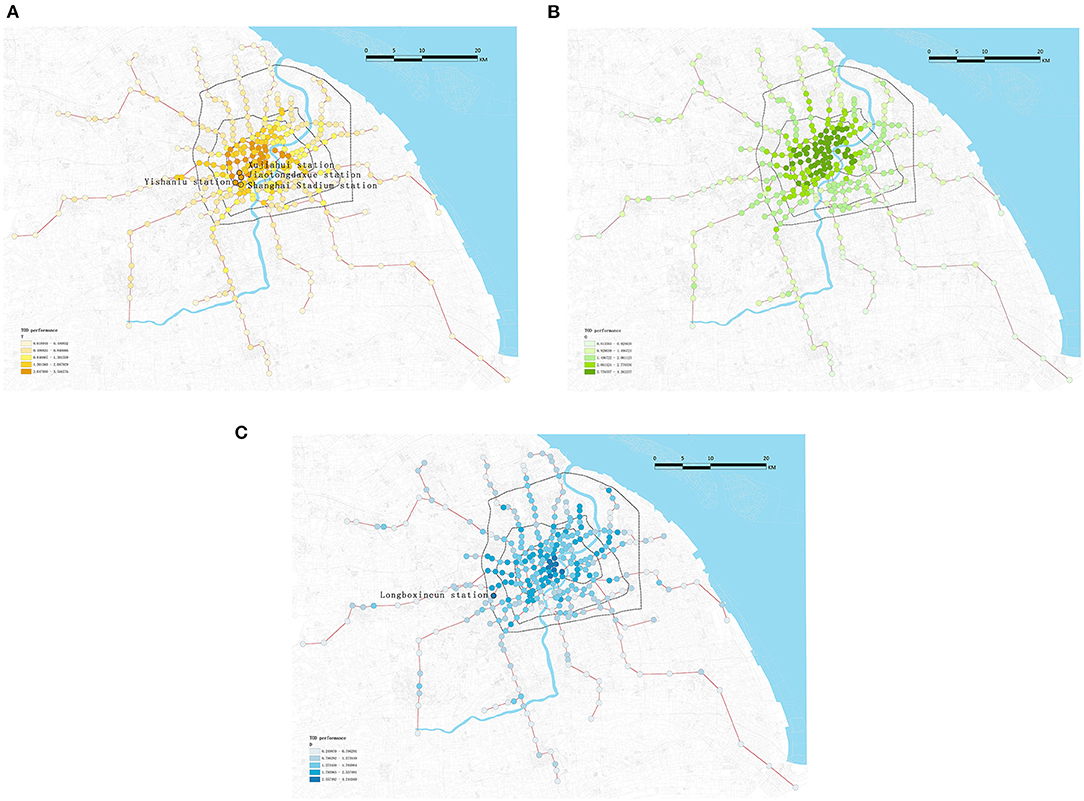
Figure 7. Visualization of (A) Transportation (T), (B) Pedestrian-oriented (O), and (C) Development (D) dimensions of TOD performance (dark color indicating high values and light color representing low values).
T component is shown in Figure 7A. The high values of the first and second grades are all within the inner ring, especially the stations of Lines 2 and 8 and those near the Lujiazui commercial business district (CBD) area. The north part of the Xuhui area is particularly notable, as its stations show high values despite its marginal location near the inner ring, such as Yishanlu, Xujiahui, Jiaotongdaxue, and Shanghai Stadium stations. This is mostly due to the fact that they are transfer stations with appropriate transportation facilities nearby.
As seen in Figure 7B, the number of the highest listed station for the O component is significantly larger than the other two. They were mostly evenly dispersed over the inner ring. Nonetheless, the most intriguing discovery was that the O values of the aforementioned unusual station in T and D were significantly reduced. Therefore, three variables of most stations are not in a coordinated development, while sharing the same characteristic of a decreasing tendency from the center to the periphery.
In comparison to T, D has fewer top-level values, but they are gathered more downtown (Figure 7C). Except for Longboxincun station, which is on the outer ring's boundary, almost all the top-ranked stations are in the most prosperous historical center. However, all these stations are surrounded by dense residential areas and CBDs. Another difference is that the second-highest stations on this map are significantly more dispersed than stations in the second-highest class of T component. This suggests that the degree of development inside the outer ring is reasonably even. This can also be seen in Figure 6, where the median and mean of D are almost equivalent, while the median and mean of T diverge the most.
4.2 Hierarchical Cluster Analysis
A hierarchical cluster analysis, which is a multivariate statistical method for grouping cases according to the similarity of their characteristics, was performed to classify the data. In this study, we classified stations using all 15 variables. The dendrogram shown in Figure 8 summarizes the clustering process and reveals five representative clusters. This cutoff number was chosen to obtain more representative clusters. Then, we focused on the five clusters to identify similarities and differences between them. The radar charts in Figure 9 highlight the average ratings of major sections in TOD performance, allowing for visual comparison. Figure 10 depicts the number of clusters and their spatial distribution. When Figures 9, 10 are taken together, we can observe that each cluster had the following key characteristics:
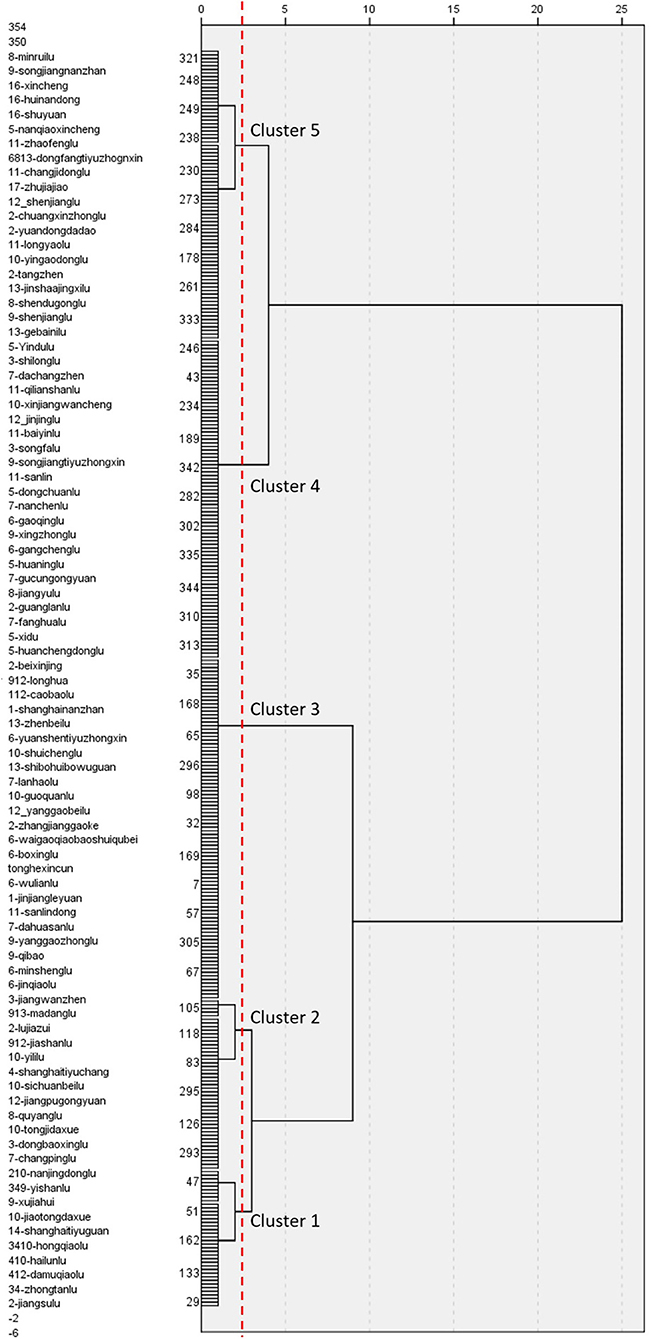
Figure 8. The hierarchical cluster analysis is based on three variables.
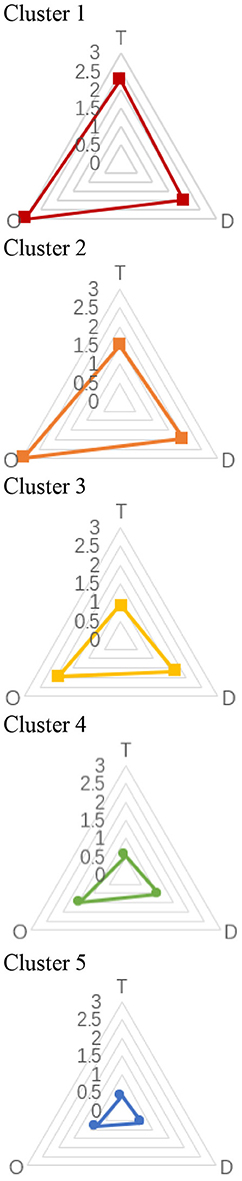
Figure 9. Rader charts for each variable by clusters.
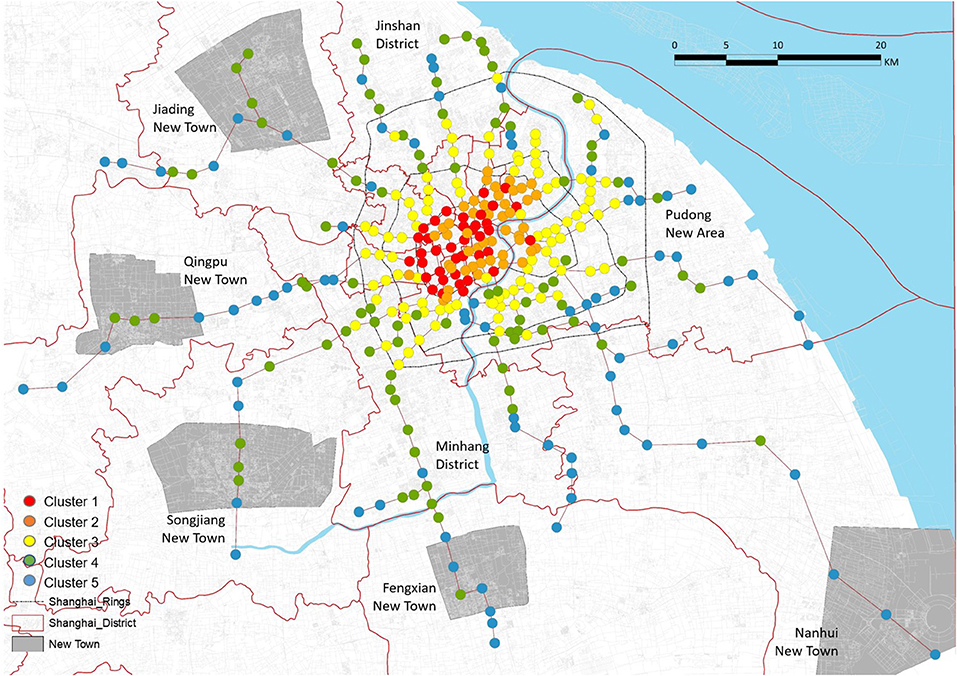
Figure 10. TOD performance by clusters in Shanghai.
Cluster 1—high TOD performance: The results for the three indicators for stations in these clusters were excellent (>2.0). T, O, and D all scored well in these groups, suggesting that the three variables were fairly balanced. Except for Shijidadao station in Pudong district, they are all situated at the center of the old town. Other stations in Pudong, although closer to the Lujiazui Financial Centre and Huangpu River, showed poor performance. This means that the busy areas may be uneven in TOD performance, although they are economically developed.
Cluster 2—relatively high performance except for T: The O and D indicators both showed reasonably high scores of 2.0 and 3.0, respectively. Variables in Cluster 2 are similar to those in Clusters 3 and 4 in terms of shape. In contrast to the other counterparts, the T component (1.5) was noticeably inadequate. This type of station could be found in the inner ring and surrounding Daxuelu area, Lujiazui area, Changshou, and Xujiahui road, which are Shanghai's subcenters. In this type, the transportation system could not sustain the exceeded growth intensity and vitality.
Cluster 3—medium performance: The three indicators in these clusters had mediocre scores (1.0 < scores < 2.0). The majority of them were found between the inner and outer rings. They also occurred in a consistent linear pattern. The cause for these unpleasant outcomes was similar to that in Cluster 2, but the built environment in their surrounding regions was poorer quality.
Cluster 4—relatively low performance, especially T: The three indicators for stations in this cluster had relatively low scores. Some of the stations of this type were in the middle ring, some were in the outer ring, and others were beyond the outer ring. However, the stations of this type beyond the outer ring of appeared where road network density suddenly increased. In addition, when we combined their spatial distribution with Shanghai's regional policy, some unexpected findings were revealed. The locations of these metro stations perfectly matched the core area of new towns in the Fourteenth 5-Year Plan (2021–2025). The plan contributed significantly to the growth of suburbs since the regions around these stations are equivalent to a quiet neighborhood in the inner ring. However, defects were still in evidence, which we will discuss in the next section.
Cluster 5—poor TOD performance: This cluster was fundamentally low-performing, with all indicators' ratings below 1.0. The vast of these metro stations are located in remote areas. In general, the south of Shanghai performed worse in TOD than the north, resulting in the city's uneven growth on a wider scale.
It is worth mentioning that we compared our results with previous research (51, 52), and found some differences. Our study, to some extent, is consistent with that of Li et al. suggesting that some metro stations in central areas are balanced (Cluster 1) in T and D. However, in reality, a number of central stations are not balanced (65). More than a half of the stations in the inner ring are Clusters 2 and 3. It is easy to notice in the radar chart that the T dimension is slightly lower than D in Cluster 2 and the overall TOD performance is relatively poor in Cluster 3.
5. Discussion and Conclusion
5.1 Shanghai Comprehensive Plan (2017–2035) and Implications for TOD Planning
The traditional core region of Shanghai, Puxi's seven districts, showed pretty good TOD performances. The TOD performance in Pudong New Area was the most unequal, with TOD categories diminishing from the inner to outer ring. Minhang and Baoshan were found to have the most Cluster 4 stations among the eight suburban districts, indicating that they are significantly more developed than the other six fringe areas. The northernmost district, Chongming Island, was excluded, since it did not have a metro station. As for the other areas, Shanghai announced a local Comprehensive Plan (2017–2035), which emphasizes the development of “Five New Towns,” including Qingpu, Fengxian, Jiading, Nanhui, and Songjiang. These new towns are envisioned as a comprehensive node city that prioritizes public services and living environment quality, representing a development shift from the urban core to new towns. In addition, the TOD categories mentioned above can also demonstrate the plan's effectiveness to some extent.
Differentiation can be noted between their TOD performance scores, although all new towns have relatively low performance. They only contain Clusters 4 and 5 stations. Moreover, the majority of Cluster 4 is located in the center of the new town. Those places were once satellite cities built 20 years ago. The numbers of type 4 station are, however, different in each of the five new towns. Notably, Jiading, Songjiang, and Qingpu each have more than three of this type, whereas Fengxian has only one, and Nanhui has none. This illustrates that, in comparison to other areas, Nanhui and Fengxian are inadequate in terms of population density, transportation, functional diversity, and living convenience. This is in line with the realities of spatial planning and transportation.
Therefore, targeted optimization guidelines should be introduced to different categories for their distinctive characteristics. For Clusters 4 and 5, which are the most potential categories, where their TOD surrounding areas are barely constructed, it is critical for the new territory development plan to integrate transportation planning and urban planning into the whole framework and make rather high-intensity constructions. For Clusters 2 and 3, where the T indicators are relatively low, planners can build new metro lines connecting them between the inner and the outer rings, reducing the inconvenience of a detour transfer. As for stations in Cluster 1, introducing more public areas and amenities could be beneficial for further improvement.
5.2 Transit Ridership, Transit Ridership per Capita, and TOD Performance
The correlation between ridership and TOD performance was analyzed to reveal the relationship between TOD performance and expected outcomes (Table 3). The correlation was analyzed with Pearson's correlation. Statistical significance was defined as a two-sided p-value of <0.05. Daily ridership data for 1 weekday (July 16) and 1 weekend day (July 20) of 2019 was used. As anticipated, the ridership on both weekdays and weekends increased with the TOD performance index. More specifically, the T value, which relates to transport infrastructure, was strongly correlated with daily ridership (R = 0.660 for weekdays and R = 0.634 for weekends). the O indicator was more strongly correlated with the ridership on weekdays (R = 0.612) than on weekends (R = 0.558). The D value, which measures the development of the station area, had a relatively lower correlation, with R = 0.580 for weekday and R = 0.551 for weekend, respectively. Moreover, comparing with daily ridership, the exiting ridership in morning peak hours has even stronger correlation with both T and O indicators, and has a slightly lower correlation (R = 0.543) with D value, indicating that the T and O dimensions are more important for commuters in choosing to ride the metro than it is for other types of train riders. This was in general consistent with existing studies, such as Zhou et al. (39).
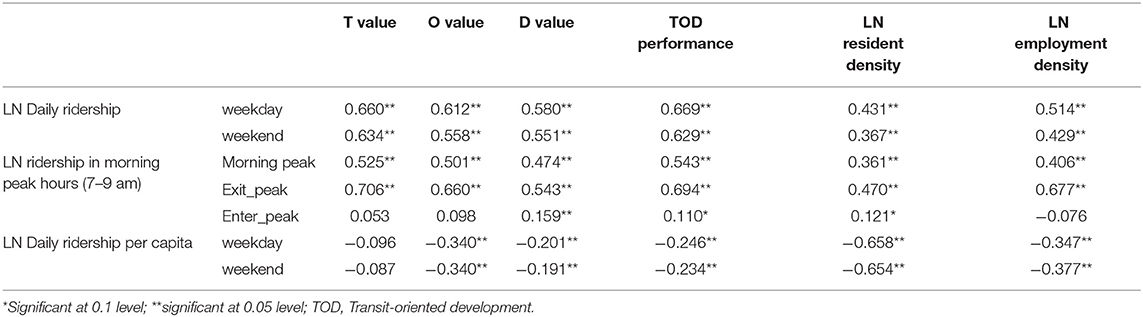
Table 3. R correlation between ridership, ridership per capita, and TOD performance.
We then explored the impact of TOD performance on ridership per capita. The indicator of ridership per capita had a high, strong correlation with resident density, with R = 0.658 for weekdays and R = 0.654 for weekends, indicating that the population plays a pivotal role in metro passenger traffic. In addition, employment density, O value, and D value were significantly correlated with ridership per capita. Among them, people's willingness to travel by metro was more affected by job density and O value. No significant correlation was found between T value and ridership per capita, indicating that the impact of T value on ridership relies on population density.
5.3 Contributions and Limitations
In high-density cities, such as Shanghai, TOD construction is a critical component for both economic growth and daily wellbeing. The classic node-place method is unable to achieve the pedestrian-friendly and human-oriented goals of a sustainable city. By incorporating the pedestrian-oriented dimension in the classic “node-space” method and 5Ds framework, this study provided a comprehensive framework for measuring TOD performance.
Although various supplementary methods have been conducted to measure the accessibility of pedestrian networks, few of them have shown the overall character of walking capability around the metro station. Unlike previous studies, this study offers a data-driven and more efficient approach toward conducting an inclusive and fine-scale framework to measure TOD performance. With a combination of traditional data collected by an official government department, high-resolution open data, and innovative technology, large-scale analyses will be easy to conduct. The method can be quantitatively achieved from the pedestrians' point by combining new techniques with more precise datasets, such as the pedestrian network, the metro ridership, and 3D built environment data. Moreover, the findings of this research were summarized and described in radar charts, box plots, and colored maps, making the structured analysis easy to understand, providing an operable and effective methodology to support urban planners and policymakers by visualizing the results with the ongoing Shanghai Comprehensive Plan (2017–2035). The simple visualized results can also be shown to communities with a developing application on mobile phone, allowing the TOD performance to be assessed using public awareness.
In the future, we can further or enhance this study in the following aspects: First, the indicator of the O dimension is insufficient. New urban data and technology can be examined, such as SVIs and emotion sensors combined with virtual reality, could reflect pedestrians' feelings more in-depth. Second, the numbers of workers and inhabitants were only represented by the official census data. Changes in population density are vital for future studies. Consistent location-based service data and mobile phone data can help with this information. Finally, TOD indicators are interdependent with each other when classifying its typologies (65). For follow-up research, experts in urban fields should be invited to verify the validity of the chosen indicators and determine their proportions by using the analytic hierarchy process.
Data Availability Statement
The datasets analyzed for this study are included in the article/table, further inquiries can be directed to the corresponding authors.
Author Contributions
LZ: conceptualization and funding acquisition. DQ and LZ: data collection, methodology, software, and writing—review & editing. DQ and XH: formal analysis and visualization and writing—original draft. All authors contributed to the article and approved the submitted version.
Funding
This research was funded by the National Natural Science Foundation of China (52008297); Shanghai Pujiang Program (21PJC114).
Conflict of Interest
The authors declare that the research was conducted in the absence of any commercial or financial relationships that could be construed as a potential conflict of interest.
Publisher's Note
All claims expressed in this article are solely those of the authors and do not necessarily represent those of their affiliated organizations, or those of the publisher, the editors and the reviewers. Any product that may be evaluated in this article, or claim that may be made by its manufacturer, is not guaranteed or endorsed by the publisher.
Acknowledgments
We want to thank Hengjia Li for assistance in data analysis and preparation.
References
1. Zhang Q, Su S. Determinants of urban expansion and their relative importance: a comparative analysis of 30 major metropolitans in China. Habitat Int. (2016) 58:89–107. doi: 10.1016/j.habitatint.2016.10.003
2. Feng Y, Wu S, Wu P, Su S, Weng M, Bian M. Spatiotemporal characterization of megaregional poly-centrality: evidence for new urban hypotheses and implications for polycentric policies. Land Use Policy. (2018) 77:712–31. doi: 10.1016/j.landusepol.2018.06.022
3. Li S, Liu X, Li Z, Wu Z, Yan Z, Chen Y, et al. Spatial and temporal dynamics of urban expansion along the Guangzhou–Foshan inter-city rail transit corridor, China. Sustainability. (2018) 10:593. doi: 10.3390/SU10030593
4. Liu TY, Su CW. Is transportation improving urbanization in China? Socio Eco Plan Sci. (2021) 77:101034. doi: 10.1016/J.SEPS.2021.101034
5. Chen E, Ye Z, Wang C, Zhang W. Discovering the spatio-temporal impacts of built environment on metro ridership using smart card data. Cities. (2019) 95:102359. doi: 10.1016/j.cities.2019.05.028
6. Yu L, Xie B, Chan EH. Exploring impacts of the built environment on transit travel: distance, time and mode choice, for urban villages in Shenzhen, China. Trans Res Part E Logis Trans Rev. (2019) 132:57–71. doi: 10.1016/j.tre.2019.11.004
7. Gan Z, Yang M, Feng T, Timmermans HJ. Examining the relationship between built environment and metro ridership at station-to-station level. Trans Res Part D Trans Environ. (2020) 82:102332. doi: 10.1016/j.trd.2020.102332
8. Banister D. The sustainable mobility paradigm. Trans Policy. (2008) 15:73–80. doi: 10.1016/j.tranpol.2007.10.005
9. Pan H, Shen Q, Liu C. Transit-oriented development at the urban periphery: insights from a case study in < city>Shanghai < /city>, China. Trans Res Rec. (2011) 2245:95–102. doi: 10.3141/2245-12
10. Suzuki H, Cervero R, Iuchi K. Transforming Cities With Transit: Transit and Land-Use Integration For Sustainable Urban Development. Washington, DC: World Bank Publications (2013). p. 205.
11. Schlossberg M, Brown N. Comparing transit-oriented development sites by walkability indicators. Transp Res Rec. (2004) 1887:34–42. doi: 10.3141/1887-05
12. Nasri A, Zhang L. The analysis of transit-oriented development (TOD) in Washington, DC and Baltimore metropolitan areas. Trans Policy. (2014) 32:172–9. doi: 10.1016/j.tranpol.2013.12.009
13. Dittmar H, Poticha S. Defining transit-oriented development: The new regional building block. In: Dittmar H, Ohland G, editor. The New Transit Town: Best Practices in Transit-Oriented Development. Washington, DC: Island Press. (2004). p. 19–40.
14. Bertolini L, Spit T. Cities on Rails: The Redevelopment of Railway Stations and Their Surroundings. Oxfordshire: Routledge (2005). p. 256.
15. Cervero R, Day J. Suburbanization and transit-oriented development in China. Transp Policy. (2008) 15:315–23. doi: 10.1016/j.tranpol.2008.12.011
16. Loo BP, Chen C, Chan ET. Rail-based transit-oriented development: lessons from New York City and Hong Kong. Landscape Urban Plan. (2010) 97:202–12. doi: 10.1016/j.landurbplan.2010.06.002
17. Zhao P, Yang H, Kong L, Liu Y, Liu D. Disintegration of metro and land development in transition China: a dynamic analysis in Beijing. Trans Res Part A Policy Pract. (2018) 116:290–307. doi: 10.1016/j.tra.2018.06.017
18. Lin Y, Deng W. Study on the urban land use pattern based on transit oriented development (TOD). J Trans Eng Inform. (2004) 4:90–4. doi: 10.3969/j.cn.51-1652(U).2004.04.16
19. Yang Z, Li D. Study on transit oriented development and its application in China [J]. Urban Trans China. (2004) 2:15–8. doi: 10.13813/j.cn11-5141/u.2004.02.003
20. Lu H, Zhao J. Study on TOD planning methodology for Chinese cities. Highway Eng. (2008) 33:64–8. doi: 10.3969/j.cn43-1481(U).2008.06.16
21. Wang D, Lin T. Built environment, travel behavior, and residential self-selection: a study based on panel data from Beijing, China. Transportation. (2019) 46:51–74. doi: 10.1007/s11116-017-9783-1
22. Liu Y, Wang F, Xiao Y, Gao S. Urban land uses and traffic ‘source-sink areas': evidence from GPS-enabled taxi data in Shanghai. Lands Urban Plan. (2012) 106:73–87. doi: 10.1016/J.LANDURBPLAN.2012.02.012
23. Zhou J, Yang Y. Transit-based accessibility and urban development: an exploratory study of Shenzhen based on big and/or open data. Cities. (2021) 110:102990. doi: 10.1016/J.CITIES.2020.102990
24. Long Y, Zhang Y, Cui C. Identifying commuting pattern of Beijing using bus smart card data. Acta Geographica Sinica. (2012) 67:1339–52. doi: 10.3969/j.cn.11-1856(P).2012.10.05
25. Zhou J, Long Y. Jobs-housing balance of bus commuters in Beijing: exploration with large-scale synthesized smart card data. Trans Res Rec. (2014) 2418:1–10. doi: 10.3141/2418-01
26. Huang J, Levinson D, Wang J, Zhou J, Wang ZJ. Tracking job and housing dynamics with smartcard data. Proc Natl Acad Sci USA. (2018) 115:12710–12715. doi: 10.1073/pnas.1815928115
27. Li X, Mou Y, Wang H, Yin C, He Q. How does polycentric urban form affect urban commuting? Quantitative measurement using geographical big data of 100 cities in China. Sustainability. (2018) 10:4566. doi: 10.3390/SU10124566
28. Liu X, Gong L, Gong Y, Liu Y. Revealing travel patterns and city structure with taxi trip data. J Trans Geog. (2015) 43:78–90. doi: 10.1016/j.jtrangeo.2015.01.016
29. Xinyi N, Liang D, Xiaodong S. Understanding urban spatial structure of Shanghai central City based on mobile phone data. China City Plan Rev. (2015) 24:15–23. doi: 10.3969/j.cn.11-1735(TU).2015.03.03
30. Shao H, Zhang Y, Li W. Extraction and analysis of city's tourism districts based on social media data. Comp Environ Urban Syst. (2017) 65:66–78. doi: 10.1016/j.compenvurbsys.2017.04.010
31. Tu W, Cao J, Yue Y, Shaw SL, Zhou M, Wang Z, et al. Coupling mobile phone and social media data: a new approach to understanding urban functions and diurnal patterns. Int J Geog Inform Sci. (2017) 31:2331–58. doi: 10.1080/13658816.2017.1356464
32. Tao S, Zhang M, Wu J. Big data applications in urban transport research in Chinese cities: an overview. In: Mark B, Graham C, Jonathan C, Robert S. editors. Big Data Applications in Geography and Planning. Oxfordshire: Edward Elgar Publishing. (2021). p. 220–44.
33. Papa E, Bertolini L. Accessibility and transit-oriented development in European metropolitan areas. J Trans Geog. (2015) 47:70–83. doi: 10.1016/j.jtrangeo.2015.07.003
34. Singh YJ, Lukman A, Flacke J, Zuidgeest M, Van Maarseveen MFAM. Measuring TOD around transit nodes-Towards TOD policy. Trans Policy. (2017) 56:96–111. doi: 10.1016/j.tranpol.2017.03.013
35. Yang L, Ao Y, Ke J, Lu Y, Liang Y. To walk or not to walk? Examining non-linear effects of streetscape greenery on walking propensity of older adults. J Trans Geog. (2021) 94:103099. doi: 10.1016/j.jtrangeo.2021.103099
36. Kitchin R. The Data Revolution: Big Data, Open Data, Data Infrastructures and Their Consequences. New York, NY: Sage. (2014). p. 240.
37. Zhang L, Chiaradia A, Zhuang Y. A configurational accessibility study of road and metro network in < city>Shanghai < /city>, China. In: Pan Q, Cao J, editor. In Recent developments in Chinese urban planning. Berlin, FL: Springer (2015). p. 219–45.
38. Ye Y, Zeng W, Shen Q, Zhang X, Lu Y. The visual quality of streets: a human-centred continuous measurement based on machine learning algorithms and street view images. Environ Plan B Urban Anal City Sci. (2019) 46:1439–57. doi: 10.1177/2399808319828734
39. Zhou J, Yang Y, Gu P, Yin L, Zhang F, Zhang F, et al. Can TODness improve (expected) performances of TODs? An exploration facilitated by non-traditional data. Trans Res Part D Trans Environ. (2019) 74:28–47. doi: 10.1016/J.TRD.2019.07.008
40. Renne JL. Transit-oriented development: developing a strategy to measure success. Trans Res Board. (2005). doi: 10.17226/23319
41. Reusser DE, Loukopoulos P, Stauffacher M, Scholz RW. Classifying railway stations for sustainable transitions–balancing node and place functions. J Trans Geog. (2008) 16:191–202. doi: 10.1016/j.jtrangeo.2007.05.004
42. Belzer D, Autler G. Transit Oriented Development: Moving From Rhetoric to Reality. Washington, DC: Brookings Institution Center on Urban and Metropolitan Policy. (2002). p. 46.
43. Kamruzzaman M, Baker D, Washington S, Turrell G. Advance transit oriented development typology: case study in Brisbane, Australia. J Trans Geog. (2014) 34:54–70. doi: 10.1016/j.jtrangeo.2013.11.002
44. Center for Transit-Oriented Development,. Transit-Oriented Development Typology Strategy for Allegheny County. (2013). Available online at: thttps://ctod.org/pittsburgh/201302pittsburgh-tod-book-web.pdf (accessed July 5, 2021).
45. Cervero R, Kockelman K. Travel demand and the 3Ds: density, diversity, and design. Trans Res Part D Trans Environ. (1997) 2:199–219. doi: 10.1016/S1361-9209(97)00009-6
46. Ewing R, Cervero R. Travel and the built environment: a synthesis. Trans Res Rec. (2001) 1780:87–114. doi: 10.3141/1780-10
47. Bertolini L. Spatial development patterns and public transport: the application of an analytical model in the Netherlands. Plan Pract Res. (1999) 14:199–210. doi: 10.1080/02697459915724
48. Lyu G, Bertolini L, Pfeffer K. Developing a TOD typology for Beijing metro station areas. J Trans Geog. (2016) 55:40–50. doi: 10.1016/J.JTRANGEO.2016.07.002
49. Paksukcharern Thammaruangsri K. Node and Place, a Study on the Spatial Process of Railway Terminus Area Redevelopment in Central London [Doctoral dissertation]. London: University of London, University College London (2003).
50. Vale DS. Transit-oriented development integration of land use and transport, and pedestrian accessibility: combining node-place model with pedestrian shed ratio to evaluate and classify station areas in Lisbon. J Trans Geog. (2015) 45:70–80. doi: 10.1016/J.JTRANGEO.2015.04.009
51. Xia Z, Zhang Y. From “5D” to “5D+N”: research published in english on the factors influencing TOD performance. Urban Plan Int. (2019) 34:109–16. doi: 10.22217/upi.2018.256
52. Nawrocki J, Nakagawa D, Matsunaka R, Oba T. Measuring walkability and its effect on light rail usage: a comparative study of the USA and Japan. Urban Transport XX. (2014) 138:305. doi: 10.2495/UT140261
53. Park S, Choi K, Lee JS. To walk or not to walk: testing the effect of path walkability on transit users' access mode choices to the station. Int J Sustain Trans. (2015) 9:529–41. doi: 10.1080/15568318.2013.825036
54. Jiang Y, Zegras PC, Mehndiratta S. Walk the line: station context, corridor type and bus rapid transit walk access in Jinan, China. J Trans Geog. (2012) 20:1–14. doi: 10.1016/J.JTRANGEO.2011.09.007
55. Zhou J, Yang Y, Webster C. Using big and open data to analyze transit-oriented development: new outcomes and improved attributes. J Am Plan Assoc. (2020) 86:364–76. doi: 10.1080/01944363.2020.1737182
56. Loo BP, du Verle F. Transit-oriented development in future cities: towards a two-level sustainable mobility strategy. Int J Urban Sci. (2017) 21:54–67. doi: 10.1080/12265934.2016.1235488
57. An D, Tong X, Liu K, Chan EH. Understanding the impact of built environment on metro ridership using open source in Shanghai. Cities. (2019) 93:177–87. doi: 10.1016/j.cities.2019.05.013
58. Data from: Shanghai Transportation Commission. The Fourteenth Five-Year Plan for Shanghai Comprehensive Transportation Development, 26 July. (2021). Available online at: http://jtw.sh.gov.cn/zcjd/20210726/a731b75277ce4ef9be2f5d58353d5d67.html (accessed October 4, 2021).
59. Data from: Shanghai Metro. The Information of Metro Stations. (2021). Available online at http://service.shmetro.com/czxx/index.htm (accessed October 6, 2021).
60. Cooper CH. Predictive spatial network analysis for high-resolution transport modeling, applied to cyclist flows, mode choice, targeting investment. Int J Sust Trans. (2018) 12:714–24. doi: 10.1080/15568318.2018.1432730
61. Cooper CH, Chiaradia AJ. sDNA: 3-d spatial network analysis for GIS, CAD, command line & python. SoftwareX. (2020) 12:100525. doi: 10.1016/j.softx.2020.100525
62. Liu X, He JL, Yao Y, Zhang JB, Liang HL, Wang HA, et al. Classifying urban land use by integrating remote sensing and social media data. Int J Geog Inform Sci. (2017) 31:1675–96. doi: 10.1080/13658816.2017.1324976
63. Li Z, Han Z, Xin J, Luo X, Su S, Weng, et al. Transit oriented development among metro station areas in < city>Shanghai < /city>, China: variations, typology, optimization and implications for land use planning. Land Use Policy. (2019) 82:269–82. doi: 10.1016/J.LANDUSEPOL.2018.12.003
64. van Eggermond MA, Erath AL. Quantifying diversity: an assessment of diversity indices and an application to Singapore. FCL Mag Spec Issue Urban Breed Grounds. (2016) 30–7. doi: 10.3929/ethz-b-000118467
65. Su S, Zhang H, Wang M, Weng M, Kang M. Transit-oriented development (TOD) typologies around metro station areas in urban China: a comparative analysis of five typical megacities for planning implications. J Trans Geog. (2021) 90:102939. doi: 10.1016/j.jtrangeo.2020.102939
66. Jorge A, Licínio S. Classificando Estacôes Metro-Ferroviárias Como Pólo Promotor Do Desenvolvimento Socioeconomico. Brasilia: 4° Concurso de Monografia CBTU 2° lugar (2008).
67. Cervero R, Murakami J. Rail and property development in Hong Kong: experiences and extensions. Urban Studies. (2009) 46:2019–43. doi: 10.1177/0042098009339431
68. Shastry S. Spatial assessment of transit oriented development in Ahmedabad, India [Master's thesis]. Univ Twente. (2010).
69. Chorus P, Bertolini L. An application of the node place model to explore the spatial development dynamics of station areas in Tokyo. J Trans Land Use. (2011) 4:45–58. doi: 10.5198/jtlu.v4il.145
70. Zemp S, Stauffacher M, Lang DJ, Scholz RW. Classifying railway stations for strategic transport and land use planning: context matters!. J Trans Geog. (2011) 19:670–9. doi: 10.1016/J.JTRANGEO.2010.08.008
71. Atkinson-Palombo C, Kuby MJ. The geography of advance transit-oriented development in metropolitan Phoenix, Arizona, 2000–2007. J Trans Geog. (2011) 19:189–99. doi: 10.1016/j.jtrangeo.2010.03.014
72. Sung H, Oh JT. Transit-oriented development in a high-density city: identifying its association with transit ridership in Seoul, Korea. Cities. (2011) 28:70–82. doi: 10.1016/J.CITIES.2010.09.00
73. Ivan I, Boruta T, Horák J. Evaluation of railway surrounding areas: the case of Ostrava city. In: Longhurst JWS, editor. Urban Transport XVIII-Urban Transport and the Environment in the 21st Century, Vol. 18. Ashurst Lodge: WIT Press (2012). p. 141–52. doi: 10.2495/UT120131
74. Song J, Deguchi A. Evaluation and typology of railway station areas in a 30km circumference suprounding central Tokoy from view of transit-oriented development. J Arch Plan. (2013) 78:413–20. doi: 10.3130/aija.78.413
75. Singh YJ, Fard P, Zuidgeest M, Brussel M, van Maarseveen M. Measuring transit oriented development: a spatial multi criteria assessment approach for the City Region Arnhem and Nijmegen. J Trans Geog. (2014) 35:130–43. doi: 10.1016/J.JTRANGEO.2014.01.014
76. Monajem S, Nosratian FE. The evaluation of the spatial integration of station areas via the node place model; an application to subway station areas in Tehran. Trans Res Part D Trans Environ. (2015) 40:14–27. doi: 10.1016/J.TRD.2015.07.009
77. Rodriguez DA, Vergel-Tovar CE. Urban development around bus rapid transit stops in seven cities in Latin-America. J Urbanism. (2018) 11:175–201. doi: 10.1080/17549175.2017.1372507
78. Renne J. Transit-oriented development and ports: a national analysis in the United States. J Trans Land Use. (2018) 11:297–304. doi: 10.5198/jtlu.2018.1121
79. Zhao P, Li S. Suburbanization, land use of TOD and lifestyle mobility in the suburbs: an examination of passengers' choice to live, shop and entertain in the metro station areas of Beijing. J Trans Land Use. (2018) 11:195–215. doi: 10.5198/JTLU.2018.1099
80. Gu P, He D, Chen Y, Zegras PC, Jiang Y. Transit-oriented development and air quality in Chinese cities: a city-level examination. Trans Res Part D Trans Environ. (2019) 68:10–25. doi: 10.1016/j.trd.2018.03.009
Keywords: transit-oriented development (TOD), TOD performance, pedestrian-oriented, multi-source urban data, station-city integration
Citation: Qiang D, Zhang L and Huang X (2022) Quantitative Evaluation of TOD Performance Based on Multi-Source Data: A Case Study of Shanghai. Front. Public Health 10:820694. doi: 10.3389/fpubh.2022.820694
Received: 23 November 2021; Accepted: 17 January 2022;
Published: 21 February 2022.
Edited by:
Linchuan Yang, Southwest Jiaotong University, ChinaReviewed by:
Xiaoling Chu, The University of Hong Kong, Hong Kong SAR, ChinaLongzhu Xiao, City University of Hong Kong, Hong Kong SAR, China
Copyright © 2022 Qiang, Zhang and Huang. This is an open-access article distributed under the terms of the Creative Commons Attribution License (CC BY). The use, distribution or reproduction in other forums is permitted, provided the original author(s) and the copyright owner(s) are credited and that the original publication in this journal is cited, in accordance with accepted academic practice. No use, distribution or reproduction is permitted which does not comply with these terms.
*Correspondence: Lingzhu Zhang, emhhbmdsekB0b25namkuZWR1LmNu