 Hyunmin Kim
 Asos Mahmood
 Noah E. Hammarlund5
- 1School of Health Professions, The University of Southern Mississippi, Hattiesburg, MS, United States
- 2Division of Health Systems Management and Policy, School of Public Health, The University of Memphis, Memphis, TN, United States
- 3Center for Health System Improvement, College of Medicine, University of Tennessee Health Science Center, Memphis, TN, United States
- 4Department of Medicine-General Internal Medicine, College of Medicine, University of Tennessee Health Science Center, Memphis, TN, United States
- 5Department of Health Services Research, Management and Policy, University of Florida, Gainesville, FL, United States
- 6Department of Economics, Fogelman College of Business and Economics, The University of Memphis, Memphis, TN, United States
Beginning in the early 2010s, an array of Value-Based Purchasing (VBP) programs has been developed in the United States (U.S.) to contain costs and improve health care quality. Despite documented successes in these efforts in some instances, there have been growing concerns about the programs' unintended consequences for health care disparities due to their built-in biases against health care organizations that serve a disproportionate share of disadvantaged patient populations. We explore the effects of three Medicare hospital VBP programs on health and health care disparities in the U.S. by reviewing their designs, implementation history, and evidence on health care disparities. The available empirical evidence thus far suggests varied impacts of hospital VBP programs on health care disparities. Most of the reviewed studies in this paper demonstrate that hospital VBP programs have the tendency to exacerbate health care disparities, while a few others found evidence of little or no worsening impacts on disparities. We discuss several policy options and recommendations which include various reform approaches and specific programs ranging from those addressing upstream structural barriers to health care access, to health care delivery strategies that target service utilization and health outcomes of vulnerable populations under the VBP programs. Future studies are needed to produce more explicit, conclusive, and consistent evidence on the impacts of hospital VBP programs on disparities.
Background and introduction
There have been numerous recent efforts in the United States (U.S.) to improve the quality of hospital care and contain costs. For years, American hospitals were reimbursed under a cost-based fee-for-service (FFS) system (1, 2). Though not the sole cause of all the financial and quality of care issues troubling the U.S. hospital system (3), the volume-driven and cost-based FFS payment system emerged as both a symbol of root cause and a target of reform. In the 1980s, for example, Medicare led the way in hospital payment reform by paying hospitals a fixed and predetermined amount based on a patient's admitting diagnosis and how it was classified in a new patient classification system called the diagnosis-related group (DRG). Today, the DRG system is still how Medicare reimburses hospitals, and private payers and health plans have all adopted some variant of this hospital payment model.
The DRG system is not without its own limitations and drawbacks. On the one hand, for example, hospital costs continued to grow rapidly, albeit at a slightly slower pace, after the adoption of the DRG system. On the other hand, the twin issues of quality of care and the growing inequality of care became the focus of reform beginning in early 2000 as DRG's lack of attention to quality and inequality became a pressing issue. Most recently in the first decade of the twenty-first century, a new class of payment and delivery models was developed and promoted to use patient and provider incentives to improve quality and to slow down the growth of health care expenditures (4). These included such new payment models as bundled payments that involved fixed and predetermined payments for delivering an entire episode of hospital care, Accountable Care Organizations (ACOs) that comprised providers and hospitals working together to deliver coordinated care, and patient-centered medical homes (PCMH) that provided coordinated care in the primary care settings to avoid expensive hospital care. In addition, and most importantly, a new class of pay-for-performance (P4P) programs that rewarded hospitals for adhering to accepted and evidence-based quality standards and processes were adopted under the general heading of the Value-Based Purchasing (VBP) Programs.
The purpose of this paper is to conduct a review of literature published between 2012 and 2022 to examine three original Centers for Medicare and Medicaid Service's (CMS) VBP programs that are hospital based: Hospital Value-Based Purchasing Program (HVBP), Hospital Readmission Reduction Program (HRRP), and Hospital-Acquired Condition Reduction Program (HACRP). Given that hospital care accounts for the largest portion of the U.S. total health expenditure (about 33%), and Medicare being the second largest source of it (5), it is urgent that we assess these programs' successes and pitfalls. Our specific aim is to evaluate the strength of evidence, both theoretical and empirical, that links the observed disparities in access and outcomes to the value-based method of reimbursing hospital care initiated by the CMS. We defined disparities as differences in quality and outcomes between groups of people that are closely linked to their social, economic, and environmental disadvantages over and beyond those that are attributable to variations in health care needs, patient preferences, and evidence-based professional treatment recommendations (6–8). The study contributes to the existing literature by filling a gap in our understanding of the implications of hospital VBP as a payment model on health and health care disparities and in opening future dialogues for improving health equity.
CMS's hospital VBP programs
The CMS has a long history of using financial incentives to improve quality and save costs. As early as the 1980s, for example, the CMS, or the federal Health Care Financing Administration (HCFA) as it was then called, began in earnest to explore the principles and mechanisms such as capitation and prospective payments to slow the growth of total as well as per capita Medicare and Medicaid costs. Specifically, in 1983, the DRG method of payment began, shifting from an FFS-based reimbursement to a lump sum payment to hospitals based on the patient's hospital admission and diagnoses. Although this payment contributed to lowering the growth rate of Medicare hospital costs, it was not sufficient to control rising costs associated with Medicare outpatient services and those brought by private purchasers (9).
In the early years of the Patient Protection and Affordable Care Act (ACA), the CMS, under the authorization of Congress and the urging of the Obama Administration, initiated a wide array of hospital VBP programs (i.e., HVBP, HRRP, and HACRP) to promote reimbursements that reward quality rather than volume. Both HVBP and HRRP were first enforced in 2012, and the HACRP was implemented in 2014. The Hospital-based VBP programs were built on the infrastructure of the Premier Hospital Quality Incentive Demonstration (HQID), a hospital P4P demonstration model, that was first implemented by the CMS in 2003 (10–12). The HQID used quality of inpatient care as the bases of providing hospitals with incentives (12). After the ACA, hospital-based VBP model expanded greatly upon the HQID and even employed several of the same performance measures in its design (12). As a matter of policy and program evaluation, the U.S. Department of Health and Human Services (DHHS) declared in 2015 that these programs would tie 85% of all Medicare FFS payments to value or quality by 2016 and 90% by 2018 (13).
In the HVBP Program, payment adjustment is made by a total performance score (TPS) based on quality compared to all hospitals, or on how much improvement hospitals have made on their own (14). Notably, quality is evaluated based on quality domains such as the process of care, clinical outcomes, safety, and patient experience (15). Further, the HVBP program offers favorable chances for extra payments to hospitals which reach performance thresholds or those which accomplish significant improvement in domains compared to the basic standard. In 2013 and 2014, it was shown that the largest amounts of extra, and penalty, payments were 1.25% of Medicare inpatient payments (14). Meanwhile, in the HACRP Program, quality assessment is carried out by calculating a score of total hospital-acquired conditions of which a value of 75% and above on the score scale will have reduced Medicare payments while payment reduction is reassessed by reflecting on the overall Medicare payments subject to other value-based payments (16, 17).
The HRRP, starting in 2012, assesses the quality of outcomes using the excessive readmission ratio (ERR) (i.e., predicted-to-expected readmissions) for the following conditions/procedures: heart failure (HF), pneumonia (with its additional types), acute myocardial infarction (AMI), chronic obstructive pulmonary disease, elective primary total hip arthroplasty and/or total knee arthroplasty, and coronary artery bypass graft surgery (18). A penalty is imposed on hospitals with ERRs larger than one, whereas those with an ERR of one or less are not subject to penalization. The penalty was initially limited to 1% of DRG payments. Then the payment limit increased to 2% in 2014 and 3% in 2015, in which CMS caps penalties at 3%. With the enactment of the twenty-first Century Cures Act in 2016, a change was to be made to HRRP in 2019 by adjusting for social risk factors through peer grouping to address a concern about its penalization of hospitals serving patients with socioeconomic disadvantages (19, 20). That is, based on the percentage of a hospital's dual Medicare-Medicaid inpatients, hospitals are categorized into one of five peer groups (20), of which those that exceed the median readmission rates (after controlling for risk factors) are penalized (21). Previously, the HRRP's formula for social risk adjustment had a drawback that it did not adequately control for social risk factors among patients resulting in higher readmissions (22) against which the peer grouping approach could address the concern. An overview of the three hospital VBP programs is provided in Table 1.
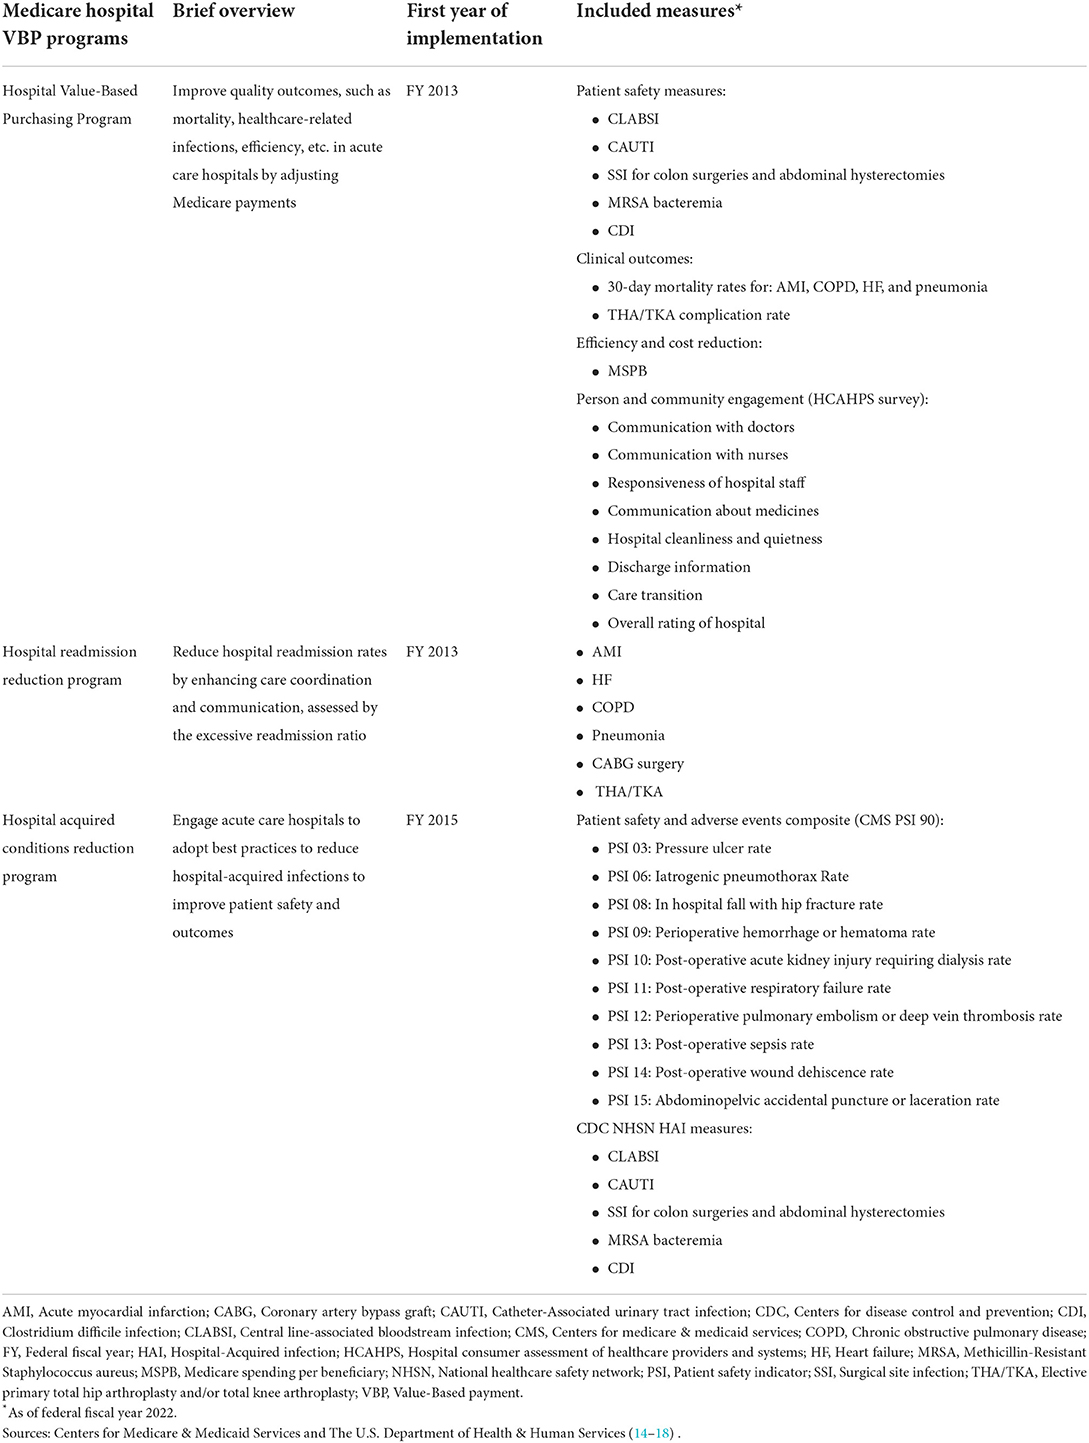
Table 1. Medicare hospital-based VBP programs in the United States.
Hospital VBP effectiveness and implications for equity and health care disparities
To date, available evidence on whether hospital-based VBP programs achieved their primary quality and cost reduction goals is mixed (12, 23). Many studies have found improvements in health care quality in certain cases even though the effects on cost containment appear to have been modest (4, 24–26). Other studies found no improvement in quality measures and claimed increased costs for certain programs and conditions (24, 27). However, these apparently conflicting findings might reflect heterogeneous hospital-level case-complexity where hospitals that care for increasingly complex patients may be less able to reduce costs and improve quality (24). This potential has given rise to the worry that hospital VBP programs might then exacerbate health disparities by disproportionately penalizing participating hospitals that serve larger proportions of disadvantaged populations (10, 12, 28). Safety-net hospitals, for instance, are more likely to serve patients with higher social risk factors and thus have worse performance measures on average (29). Therefore, hospital-based VBP programs may unintentionally increase financial penalties for social-safety net hospitals (30). Indeed, prior evidence indicates that safe-net hospitals participating in hospital VBP programs perform worse on several quality and cost measures compared with non-safety-net hospitals are thus more likely to be penalized (12, 24, 30–32).
Currently in the U.S., disparities exist in almost all aspects of health and health care, including access to care, quality, and health care utilization and outcomes (6, 33–35). The Institute of Medicine (IOM, now the National Academy of Medicine) in the U.S. defines health care disparities as racial or ethnic differences in the quality of health care that are not due to access-related factors or clinical needs, preferences, and appropriateness of intervention (36). However, health disparities are complex and multidimensional and can occur across various dimensions such as race and ethnicity, biological sex, sexual identity, age, disability, socioeconomic status, and geographic location (8, 37). In the U.S., substantial differences in social determinants of health including low socioeconomic status, poverty, lack of access to care exist along the race and ethnic lines that crucially contribute to disparities and poor health and health outcomes (7). The health and health care differences between groups of people that are closely linked with social, economic, and environmental/geographic disadvantages, which are not well-explained by variations in health care needs, treatment recommendations, or patient preferences, are broadly considered health and health care disparities (6–8). Disparities can be seen across a wide range of health conditions, including heart and cardiovascular diseases, hypertension, diabetes, cancer, asthma, and other acute or chronic health conditions (38).
As the U.S. population becomes more diverse, identifying and addressing health and health care disparities takes the forefront of most critical issues in the country (39). One of the overarching goals of Healthy People 2030 is to achieve health equity, eliminate health disparities, and attain health literacy by individuals to improve the health and wellbeing for the entire population (40). Further, health and health care disparities carry a huge economic burden. Health inequities in general are estimated to account for an approximate value of $320 billion in annual health care spending in the U.S. with a trajectory of reaching $1 trillion or more by year 2040 if left unaddressed (38). If the future projected estimates are reached, the country would face critical challenges related to health care quality, affordability, and access for the entire population that could have major additional consequences for the health and wellbeing of all individuals, especially the historically underserved populations (38). Health care disparities also have critical consequences for quality of life. An estimated $42 billion in lost productivity per year is accrued due to health disparities without even accounting for the economic loss of premature death (38).
Currently, relative to the knowledge of general impacts of hospital based VBP programs on health care quality and cost, comparatively less solid evidence is available on the impact of these programs on health care disparities (24). No study has thus far structurally reviewed and evaluated the collective empirical evidence and implications of the U.S. hospital VBP programs for health care disparities. Theoretically, most value-based programs do not explicitly incentivize equity and may inadvertently increase disparities as a side-effect of the incentive-based payments to providers. It is then imperative to review and analyze the existing evidence, and assess whether the implementation of hospital VBP programs have the potential to worsen disparities in the U.S.
Methods and results
Link between VBP and inequality from a conceptual perspective
Researchers and many national health policy advisory organizations such as the National Academies of Sciences, Engineering, and Medicine (NASEM) and Medicare Payment Advisory Commission (MedPAC) have recently analyzed newly available outcomes data and raised serious concerns over the Medicare VBP programs as they are currently structured (11, 41–45). They are particularly concerned about the potential biases of the VBP programs and their implications for health care equity and disparity (46–50). Specifically, these programs are suspected to have penalized hospitals and medical practices that serve patients of predominantly lower socioeconomic status (SES) who tend to live in areas with higher concentrations of poverty and minority population groups (12, 51–55). Some of the biases arose from the budgetary constraints and incentives design inherent in the existing VBP programs, while others were the results of their implementation as providers made self-interested decisions that might not be in the best interest of their patients. Indeed, a misalignment of financial incentives and policy goals (e.g., health equity and quality for all) can result in unintended consequences for socially at-risk population groups (41, 56).
In the post-ACA era of P4P innovation, three distinctive yet related forces of financial self-interest, budgetary constraints, and strategic gaming behaviors created a perfect storm of unintended consequences. First, Congress authorizes an annual budget to fund the operation of the federal government. The various federal agencies can propose reforms and administer them with the consent of the U.S. Congress, but they often proceed under the principle and fiscal constraint of budget neutrality. It is a zero-sum game, in which winners gain at the expense of losers who tend to be providers that treat a disproportionate share of low-income patients with greater social risk factors (41, 55). In this respect, there may be unintended consequences such that providers caring for disadvantaged or low SES patients show worse performance than their counterparts, even after adjusting for between-plan and between-provider disparities (57).
Second, not all the patients under the care of health care providers, particularly in the hospital setting, are equally healthy. Patients of lower SES tend to be sicker and costlier to treat than those who are more educated and affluent (58). However, evidence suggested that the hospital VBP programs implemented do not adequately take patients' clinical and socioeconomic characteristics into consideration when rating quality of care (44, 51). Further, many medical facilities and practices in poor neighborhoods do not have advanced electronic medical record systems and as a result, cannot produce the necessary data to attest to the quality of their services. Others are rated unfavorably simply because they serve predominantly vulnerable patient populations, including minority patients, who are associated with greater social and clinical risk factors that make them more complex and costly to treat on average. Thus, these hospitals are more likely to be financially penalized relative to practices treating patients with lower average social and clinical risks (52, 55).
Third, the CMS's VBP programs, as they are currently structured, encourage medical practices and their providers to avoid poorer and sicker patients and penalize medical providers located in poorer neighborhoods that treat a predominantly minority patient base (12, 45, 59). This behavior of selectively enrolling or accepting patients might create faulty underinvestment in the quality of care for patients with social risk factors (8, 41, 60), and further widen the gap of the already existing disparities between the rich and poor.
Economists have long understood that health care differs from other consumer goods and services because patients lack the necessary information to make rational choices and medical treatments that themselves involve inherent risks and uncertainties (61). Health care consumers are particularly more likely to be disadvantaged both financially and medically because of information asymmetry since providers know far more than their patients who rely heavily on their physicians and other providers to both diagnose and deliver the recommended services (1, 62, 63). These special characteristics of health care and the heavy reliance on health care providers as trusted agents to look after patients' best interests have resulted in a special relationship between them (64, 65). The fiduciary view of this relationship, shared commonly by ethicists and philosophers, sees physicians as having a moral obligation to do the best for their patients. In the opposing view, held mostly by legal experts and economists, undesirable outcomes may occur when physicians and patients disagree on what is best and/or when providers place their own interests ahead of those of the patient.
A new dimension of the mentioned relationship emerges with the additional consideration of patient SES. According to the Fundamental Cause Theory of Link and Phelan (1995), a link exists between SES and health status of poorer and less-educated individuals because SES “embodies an array of resources, such as money, knowledge, prestige, power, and beneficial social connections that protect health no matter what mechanisms are relevant at any given time” (66, 67). In other words, SES functions as a fundamental cause of health inequality because, other things being equal, many lower SES individuals lack resources and knowledge to protect and improve their health. For example, evidence suggests that disparities in cancer survival outcomes between white patients and other racial/ethnic minorities were greater for diseases that are more remediable or amendable to treatment (68). Further, social components such as racism and residential segregation may also serve as a fundamental cause of health inequity (69). Those elements, also called upstream structural factors (e.g., income, social status, etc.) have been increasingly considered to be incorporated in health-related interventions or programs (70). They aim to reform or amend the structural components that could affect health by, for example, redistributing resources, opportunities, etc. (70). Since incentive structures for VBP programs are primarily based on financial penalties and rewards, they tend to potentially worsen disparities because physicians and hospitals serving disadvantaged and minority patients and those with complex health issues are more likely to be penalized due to poorer clinical outcomes that are more associated with the patients' SES than with the quality of treatment.
Empirical evidence of the link
To examine the empirical effects of the CMS' hospital VBP programs on disparities, we conducted a search by focusing only on peer-reviewed, quantitative, English language, published articles. To select these articles, we first identified relevant ones that were released between 2012, the year HVBP and HRRP programs were both implemented, up to August 1, 2022, by conducting a MEDLINE search using each of the three VBP programs (i.e., HVBP, HRRP, and HACRP) as primary keywords, as well as a combination of secondary terms and phrases. To select secondary keywords in our search, we employed the Equity Framework (71, 72) as a guide. The framework was conceptualized and designed by the Committee on Accounting for Socioeconomic Status in Medicare Payment Programs—NASEM in 2016 to identify social factors that potentially affect performance indicators used in Medicare VBP programs and those influence patients' health outcomes (71, 72). Thus, in conjunction with the primary keywords, the secondary search terms utilized included: “disparities” “equity,” “socioeconomic status,” “dual Medicare/Medicaid eligibility,” “race and ethnicity,” “language barriers,” “gender identity,” “sexual orientation,” “marital status,” “geographic location,” “neighborhood,” “rural/urban location,” and “health literacy.” We also operationalized other constructs related to disparities such as “safety-net status” and “safety-net hospitals” that are widely referenced in health disparity literature.
The first round of search resulted in identifying several key articles evaluating the three VBP programs. We then extended the search to related studies from the key articles' references and their subsequent citations. This was performed by conducting a “backward search” by identifying relevant citations from key papers, and a “forward search” through Google Scholar to pinpoint relevant articles that cited the key articles. Together, the search yielded a combined total of 469 articles as non-unique results. We screened them by their titles and abstracts to determine whether they pertained to the CMS' hospital VBP programs. Finally, 35 articles were chosen for our review after eliminating duplicate studies and those that did not examine the programs' impact on disparities, or were shorter commentaries, or dispatches from the field. We summarized the selected studies and chronologically listed them based on their year of publication (see Table 2).
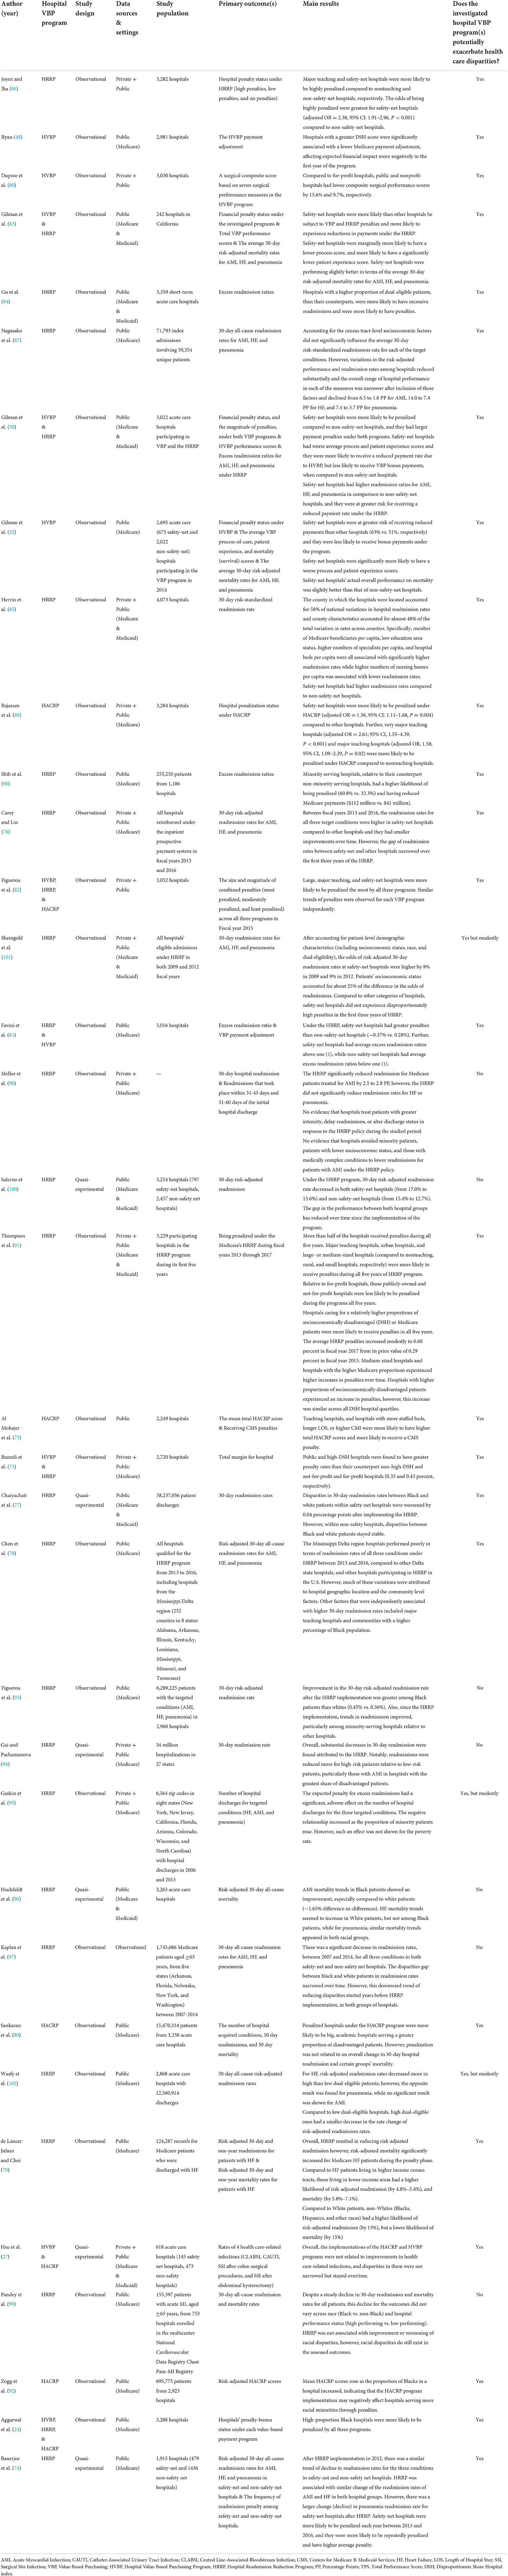
Table 2. Review of studies exploring the effects of medicare hospital VBP programs on health care disparities in the United States.
Many of the reviewed studies found that the hospital VBP programs have the potential of further exacerbating health care disparities by penalizing hospitals or facilities that treat a disproportionate share of minority and disadvantaged patients (24, 27, 30, 32, 48, 73–92) (see Table 2). For instance, Hsu et al. explored the impact of the HVBP and HACRP Programs on health care-related infections among 628 acute care hospitals. Their findings revealed that “… given the persistent disparities in health care–associated infection rates, value-based incentive programs currently function as a disproportionate financial penalty system for safety-net hospitals that provide no measurable population-level benefits” (27). Similarly, Chaiyachati et al. examined a cohort of hospitals to investigate whether racial disparities in hospital readmission rates might have worsened between safety-net and non-safety-net hospitals after participating in the Medicare HRRP Program. Their findings revealed that safety-net hospitals that treated predominantly low-income minority patients showed an increase in racial disparities in readmission rates (77).
Furthermore, an observational study of 2,981 hospitals participating in the HVBP Program examined whether hospitals that treated more patients with low SES and had other disadvantages as indicated by the Disproportionate Share Hospital (DSH) index had worse performance outcomes under HVBP (48). Their findings showed that hospitals with a higher DSH index value (signifying a heavier concentration of low-income patients) received lower Medicare payments per admission and more unsatisfactory outcomes under the HVBP than those with a lower DSH index value. Carey and Lin reported that during the HRRP implementation, and between fiscal years (FY) 2013 and 2016, the readmission rates for all three initial target conditions (i.e., AMI, HF, and pneumonia) were higher in safety-net hospitals, at the U.S. national level, compared to other hospitals, and they had smaller improvements over the first 3 years of the HRRP (76). Similarly, Thompson et al. analyzed data for 3,229 participating hospitals in the HRRP program during its first 5 years of implementation (FY 2013 through 2017) (91). They found that major teaching hospitals, urban hospitals, and large- or medium-sized hospitals (compared to non-teaching, rural, and small hospitals, respectively), were more likely to receive penalties during all 5 years of the HRRP program. Further, hospitals caring for a relatively higher proportions of socioeconomically disadvantaged (higher DSH index value), or for Medicare patients, were more likely to receive penalties in all 5 years. Hospitals with higher proportions of socioeconomically disadvantaged patients experienced an increase in penalties, however, this increase was similar across all DSH quartiles (91). During the same period, medium-sized hospitals and hospitals with the higher Medicare population proportions experienced greater increases in penalties over time.
Moreover, in an observational study of 3,284 hospitals, Rajaram et al. evaluated hospital characteristics and hospital penalization status under the HACRP in FY 2015 (88). Their key findings indicate that safety-net hospitals were more likely to be penalized under HACRP compared to other hospitals. Major teaching hospitals were also significantly more likely to be penalized under the program compared to non-teaching hospitals (88). Lastly, Aggarwal et al. evaluated hospitals participating in all three programs of HVBP, HRRP, & HACRP in FY 2019 and identified the hospitals' penalty-bonus status under each Medicare hospital VBP. The primary aim of the study was to compare the high-proportion Black hospitals to other categories of hospitals in terms of received a penalty (or bonus) under each program (24). They report that high-proportion Black hospitals were more likely to be penalized by all three programs compared to other categories of hospitals (24).
Not all the reviewed studies reached the same conclusion and a few of them found little or no worsening impact of hospital VBP programs on health care disparities or reached mixed or paradoxical conclusions (93–102) (See Table 2). For example, Gai and Pachamanova assessed the impact of the HRRP Program on hospital readmission for HF, AMI, and pneumonia as the targeted conditions among disadvantaged and high-risk patients and found a substantial decrease in 30-day readmission overall (94). Notably, hospital readmissions were reduced more for high-risk patients than low-risk patients, especially for those with AMI in hospitals with the greatest share of disadvantaged patients.
Separately, a quasi-experimental study of 797 safety-net hospitals and 2,457 non-safety-net hospitals examined the extent to which HRRP implementation was associated with decreases in 30-day readmission rates among safety-net and non-safety- net hospitals (100). Their findings indicated that 30-day risk-adjusted readmission rates decreased among both safety-net hospitals and non-safety-net-hospitals. They also found that safety-net hospitals experienced more rapid decreases in readmissions which narrowed the gap in performance between the two hospital groups.
Huckfeldt et al. investigated whether 30-day mortality rates rose among older Black and White hospitalized patients after the implementation of HRRP, based on an interrupted time-series analysis of a cohort of 3,263 acute care hospitals (96). They concluded that the VBP policy was not associated with an increase in mortality among Black populations. Specifically, they found that 30-day post-discharge mortality for all conditions did not worsen in older Black patients, relative to their White counterparts, after the initiation of HRRP. They further found that mortality rates for heart conditions improved among Black patients compared to White patients (96). Similarly, Sheingold et al. obtained information on hospital readmission rates from the Medicare Hospital Claims data for FYs 2009 and 2012 and calculated the penalties for FY 2013 of the risk-adjusted readmission rates for the target conditions of AMI, HF, and pneumonia (101). The primary aim of the study was to compare safety-net hospitals (high DSH value hospitals) to other categories of hospitals (lower DSH value hospitals) in terms of the risk-adjusted 30-day readmission rates for the three initial target conditions. The findings portrayed that, at least in the first 3 years of the HRRP, safety-net hospitals did not have disproportionately high penalties, compared to other categories of hospitals.
Together, available evidence suggests varied impacts of CMS's Medicare hospital VBP programs on health care disparities. Many of the reviewed studies found that these VBP programs have a great potential to exacerbate the already existing health care disparities in the U.S. while others found evidence of moderating impacts of hospital VBPs on disparities. Interestingly, albeit inconclusive and inconsistent, we observed that many of the studies that found evidence of worsening disparities were those based on the less stringent, non-experimental observational study designs, while the studies that were based on quasi-experimental designs showed varying results. Further research is needed to produce more conclusive and consistent evidence and to explore the extent to which study design affects the conflicting conclusions from the evaluations of Medicare hospital VBP programs.
Discussion and future research
Many direct and specific modifications and adjustments to the existing VBP Programs have been suggested to address the observed disparities in access and outcomes associated with this otherwise promising hospital innovation experiment. For example, Damberg and collaborators have proposed a post-adjustment payment approach to decrease the unfair burden of performance-based payment models for physicians and their practices that treat a predominantly poor patient base in California (103). To reduce disparities in the receipt of hospital care, similarly, the remedy of stratifying hospitals into, for example, safety-net and non-safety-net subgroups so as to take into account the measurable differences in the underlying costs of treatment when paying for hospital care has been suggested (100). Further, the peer group-based payment adjustment approach was introduced to the HRRP and implemented beginning in 2019. Early evidence shows that peer grouping resulted in relatively lessening the burden of financial penalties serving more socially disadvantaged patients (104–107). However, the current modification has limitations where it merely reflects on its readmission outcomes and not the social risk factors of its patients, which is the fundamental goal, and it might not be an perfect approach to address health care inequities in the current form (107). In other efforts to address health care disparities in hospital VBP programs, objective and data-driven quality assessment or evaluation can be carried out by adjusting for the respective groups' average quality scores instead of the overall scores for all hospitals. To reduce penalties frequently paid by safety-net hospitals, the stratification of acute care hospitals by the DSH Index (i.e., top 20% vs. the rest) has been suggested as a payment adjustment mechanism for reducing disparities of hospital care reimbursement (100).
Disparities could be potentially reduced through the designs of new incentive payment methods and mechanisms. Originally designed for improving the quality and efficiency of health services delivery, for example, alternative payment models (APMs) are suggested as having the additional effects of alleviating health care disparities attributed to the various hospital VBP contracts (4). Further, there has been an effort to urge alignment in payment models or approaches in the U.S. health care system. In 2015, for instance, the Health Care Payment Learning and Action Network (LAN) was created by the CMS as a collaborative private and public partnership among patients, providers, health plans, government agencies, and other stakeholders to enhance the quality of care and the outcomes, including cost containment. Essentially, by transiting to value-based care away from FFS, it conceives a care delivery system that provides person-centered care, which relies on three pillars: quality, cost-effectiveness, and patient engagement (108). Meanwhile, researchers have recommended long-term interventions that address upstream causes of disparities. For instance, higher reimbursements for primary prevention and disease management services are recommended as a long-run strategy for improving population health and reducing persistent health and health care disparities (109, 110). Further, at the organization and delivery systems level, incentives could be offered to health care institutions and organizations that both improve quality and address racial disparities (111). Equally important, new and innovative payment schemes that can help improve health equity should be studied, tested and promoted by involving clinicians experienced in caring for disadvantaged patient populations and by offering funding opportunities to community health workers, especially those who provide care directly to disadvantaged patients (4, 112).
Another promising research opportunity that has not drawn sufficient attention lies in the development and construction of a more solid conceptual and theoretical foundation for the understanding, and design, of effective VBP programs. Recently, Link, Phelan and Tehranifar have recommended that policy strategies should be based on the insights of, for example, a “theory of fundamental causes,” which postulates that the causes of observed disparities originate from the fundamental differences in population-level access to essential economic and social resources (67). Their insightful observation has led to policy emphasis on programs that support medical progress and new interventions that have the potential of lessening or moderating differences in the allocation of socioeconomic resources such as housing for the poor and homeless, social security and disability benefits, minimum wage laws, and the Head-Start programs for pre-K children.
Recently, the progresses from the field of behavioral economics have led researchers to believe that it is feasible and practical to achieve better health outcomes for socioeconomically disadvantaged by providing them with more and targeted support through creative service contracting with health care providers (113). For example, a reallocation of funds from VBP bonus programs that serve low-risk populations to reward providers serving high-risk groups might be effective in reducing disparities. This resource-allocation approach could help address the issue of disparities attributable to VBP programs without having financial disadvantages. Similarly, the field of health economics, with its emphasis on the unique economic characteristics of health care, suggests that physicians, who play a dual role of diagnosis and treatment, can considerably influence patients' demand for health services (114).
Equally promising, a valuable lesson from the field of information economics, the concept of information asymmetry (or imbalance) between patients and their providers, has been credited for the promotion of health care transparency as a path and mechanism to address disparities. The VBP programs can be modified to provide patients, especially those with higher risks of chronic and life-threatening diseases, with effective and meaningful access to, and utilization of, medical information. This and other information economics inspired innovations may in the near future bring about the addition of patients' electronic access to health records, health education opportunities, and health literacy programs as adjunct interventions alongside the main quality and payment interventions under the overall VBP programs.
Conclusion
VBP is a complicated program that was initiated for improving health care quality and containing costs. It has the potential to improve equity and reduce disparities in health and health care, but little is presently known about the effects of VBP on access to health care and health disparities. Even less is known about the effects of hospital based VBP programs in general and their impacts on disparities in particular. This review examined relevant literature published between 2012 (the year in which HVBP and HRRP were implemented) and 2022 and found mixed results on the impacts of CMS's Medicare hospital VBP programs on health care disparities. Our results suggest three important implications. First, left to the status quo, CMS's hospital VBP is unlikely to reduce health care disparities and might even exacerbate them. Second, focused evaluation and research are needed to ascertain a congruent and conclusive result on the effects of VBP on health care disparities. Third and most importantly, researchers and policy makers need to work together to explore how VBP can be modified based on the latest evidence to improve equity and reduce disparities while at the same time maintaining the momentum already gained in quality improvement and cost containment.
Author contributions
HK: writing—original draft. AM, NH, and CC: writing—review & editing. All authors contributed to the article and approved the submitted version.
Funding
This study was supported by the University of Southern Mississippi for the research project assessing value-based payment programs.
Conflict of interest
The authors declare that the research was conducted in the absence of any commercial or financial relationships that could be construed as a potential conflict of interest.
Publisher's note
All claims expressed in this article are solely those of the authors and do not necessarily represent those of their affiliated organizations, or those of the publisher, the editors and the reviewers. Any product that may be evaluated in this article, or claim that may be made by its manufacturer, is not guaranteed or endorsed by the publisher.
References
1. Conrad DA. The theory of value-based payment incentives and their application to health care. Health Serv Res. (2015) 50:2057–89. doi: 10.1111/1475-6773.12408
2. Lyu H, Xu T, Brotman D, Mayer-Blackwell B, Cooper M, Daniel M, et al. Overtreatment in the united states. PLoS ONE. (2017) 12:e0181970. doi: 10.1371/journal.pone.0181970
3. Dowd BE, Laugesen MJ. Fee-for-service payment is not the (main) problem. Health Serv Res. (2020) 55:491. doi: 10.1111/1475-6773.13316
4. Werner RM, Emanuel EJ, Pham HH, Navathe AS. The Future of Value-Based Payment: A Road Map to 2030. Leonard Davis Institute of Health Economics (LDI) (2021). Available online at: https://ldi.upenn.edu/wpcontent/uploads/archive/pdf/PennLDI-Future-of-Value-Based-Payment-WhitePaper.pdf (accessed August 7, 2022).
5. Centers for Medicare & Medicaid Services. National Health Expenditure Data. Centers for Medicare & Medicaid Services. Available online at: https://www.cms.gov/Research-Statistics-Data-and-Systems/Statistics-Trends-and-Reports/NationalHealthExpendData (accessed January 8, 2022).
6. Artiga S, Orgera K, Pham O. Disparities in health and health care: Five key questions and answers. Kais Fam Found. (2020). Available online at: https://files.kff.org/attachment/Issue-Brief-Disparities-in-Health-and-Health-Care-Five-Key-Questions-and-Answers (accessed August 16, 2022).
7. HHS. HHS Action Plan to Reduce Racial and Ethnic Health Disparities: A Nation Free of Disparities in Health and Health Care. HHS (2011). Available online at: https://www.minorityhealth.hhs.gov/assets/pdf/hhs/HHS_Plan_complete.pdf (accessed August 17, 2022).
8. Schardt K, Hutzler L, Bosco J, Humbyrd C, DeCamp M. Increase in healthcare disparities: the unintended consequences of value-based medicine, lessons from the total joint bundled payments for care improvement. Bull Hosp Jt Dis. (2020) 78:93–97.
9. Grumbach K, Bodenheimer T. Understanding Health Policy: A Clinical Approach. New York, NY: McGraw-Hill Companies, Incorporated (2009).
10. Chee TT, Ryan AM, Wasfy JH, Borden WB. Current state of value-based purchasing programs. Circulation. (2016) 133:2197–205. doi: 10.1161/CIRCULATIONAHA.115.010268
11. Damberg CL, Sorbero ME, Lovejoy SL, Martsolf GR, Raaen L, Mandel D. Measuring success in health care value-based purchasing programs: Findings from an environmental scan, literature review, and expert panel discussions. Santa Monica, CA: RAND Corporation (2014). Available online at: https://www.rand.org/pubs/research_reports/RR306.html.
12. Hong YR, Nguyen O, Yadav S, Etzold E, Song J, Duncan RP, et al. Early performance of hospital value-based purchasing program in medicare: a systematic review. Med Care. (2020) 58:734–43. doi: 10.1097/MLR.0000000000001354
13. Burwell SM. Setting value-based payment goals—HHS efforts to improve US health care. N Engl J Med. (2015) 372:897–9. doi: 10.1056/NEJMp1500445
14. Centers for Medicare & Medicaid Services. The Hospital Value-Based Purchasing (VBP) Program. Centers for Medicare & Medicaid Services. Available online at: https://www.cms.gov/Medicare/Quality-Initiatives-Patient-Assessment-Instruments/Value-Based-Programs/HVBP/Hospital-Value-Based-Purchasing (accessed April 27, 2021).
15. U.S. Department of Health & Human Services. Hospital Value-Based Purchasing. Department of Health & Human Services (2020). Available online at: https://www.hhs.gov/guidance/sites/default/files/hhs-guidance-documents/Hospital_VBPurchasing_Fact_Sheet_ICN907664.pdf (accessed January 20, 2022).
16. Centers for Medicare & Medicaid Services. Hospital-Acquired Condition Reduction Program. Centers for Medicare & Medicaid Services. Available online at: https://www.cms.gov/Medicare/Quality-Initiatives-Patient-Assessment-Instruments/Value-Based-Programs/HAC/Hospital-Acquired-Conditions (accessed April 27, 2021).
17. Centers for Medicare & Medicaid Services. Hospital-Acquired Condition Reduction Program : Fiscal Year 2020 Fact Sheet. Centers for Medicare & Medicaid Services (2019). Available online at: https://www.cms.gov/Medicare/Medicare-Fee-for-Service-Payment/AcuteInpatientPPS/Downloads/HAC-Reduction-Program-Fact-Sheet.pdf (accessed January 20, 2022).
18. Centers for Medicare & Medicaid Services. Hospital Readmissions Reduction Program (HRRP). Centers for Medicare & Medicaid Services. Available online at: https://www.cms.gov/Medicare/Quality-Initiatives-Patient-Assessment-Instruments/Value-Based-Programs/HRRP/Hospital-Readmission-Reduction-Program (accessed April 27, 2021).
19. th Congress. 21st Century Cures Act. H.R. 34. 114th Congress (2016). Available online at: https://www.congress.gov/bill/114th-congress/house-bill/34 (accessed August 22, 2022).
20. Peltz A, Davidoff AJ, Gross CP, Rosenthal MS. Low-income children with chronic conditions face increased costs if shifted from CHIP to marketplace plans. Health Aff. (2017) 36:616–25. doi: 10.1377/hlthaff.2016.1280
21. Centers for Medicare & Medicaid Services. New Stratified Methodology Hospital-Level Impact File User Guide: Hospital Readmissions Reduction Program. Centers for Medicare & Medicaid Services (2017). Available online at: https://www.hhs.gov/guidance/sites/default/files/hhs-guidance-documents/HRRP_StratMethod_ImpctFile_UG.PDF (accessed August 22, 2022).
22. Joynt KE, Zuckerman R, Epstein AM. Social risk factors and performance under Medicare's value-based purchasing programs. Circ Cardiovasc Qual Outcomes. (2017) 10:e003587. doi: 10.1161/CIRCOUTCOMES.117.003587
23. Waters TM, Burns N, Kaplan CM, Graetz I, Benitez J, Cardarelli R, et al. Combined impact of Medicare's hospital pay for performance programs on quality and safety outcomes is mixed. BMC Health Serv Res. (2022) 22:958. doi: 10.1186/s12913-022-08348-w
24. Aggarwal R, Hammond JG, Maddox KEJ, Yeh RW, Wadhera RK. Association between the proportion of black patients cared for at hospitals and financial penalties under value-based payment programs. JAMA. (2021) 325:1219–21. doi: 10.1001/jama.2021.0026
25. Chukmaitov A, Harless DW, Bazzoli GJ, Carretta HJ, Siangphoe U. Delivery system characteristics and their association with quality and costs of care: implications for accountable care organizations. Health Care Manage Rev. (2015) 40:92–103. doi: 10.1097/HMR.0000000000000014
26. Colla CH, Lewis VA, Kao LS, O'Malley AJ, Chang CH, Fisher ES. Association between Medicare accountable care organization implementation and spending among clinically vulnerable beneficiaries. JAMA Intern Med. (2016) 176:1167–75. doi: 10.1001/jamainternmed.2016.2827
27. Hsu HE, Wang R, Broadwell C, Horan K, Jin R, Rhee C, et al. Association between federal value-based incentive programs and health care–associated infection rates in safety-net and non–safety-net hospitals. JAMA Netw Open. (2020) 3:e209700. doi: 10.1001/jamanetworkopen.2020.9700
28. Rocque GB, Lennes IT, Rhoads KF, Yu PP. Quality improvement at the health system level: measurement, risk stratification, disparity populations, and governance. Am Soc Clin Oncol Educ Book. (2019) 39:388–98. doi: 10.1200/EDBK_244941
29. Khazanie P, Ho PM. Leveraging value-based payment models to reduce sex differences in care. Circ Cardiovasc Qual Outcomes. (2019) 12:e006038. doi: 10.1161/CIRCOUTCOMES.119.006038
30. Gilman M, Hockenberry JM, Adams EK, Milstein AS, Wilson IB, Becker ER. The financial effect of value-based purchasing and the hospital readmissions reduction program on safety-net hospitals in 2014: a cohort study. Ann Intern Med. (2015) 163:427–36. doi: 10.7326/M14-2813
31. Himmelstein G, Himmelstein KE. Inequality set in concrete: physical resources available for care at hospitals serving people of color and other US hospitals. Int J Health Serv. (2020) 50:363–70. doi: 10.1177/0020731420937632
32. Gilman M, Adams EK, Hockenberry JM, Milstein AS, Wilson IB, Becker ER. Safety-net hospitals more likely than other hospitals to fare poorly under Medicare's value-based purchasing. Health Aff. (2015) 34:398–405. doi: 10.1377/hlthaff.2014.1059
33. AHRQ. 2021 National Healthcare Quality and Disparities Report. Rockville, MD: Agency for Healthcare Research and Quality (2021).
34. Fiscella K, Sanders MR. Racial and ethnic disparities in the quality of health care. Annu Rev Public Health. (2016) 37:375–94. doi: 10.1146/annurev-publhealth-032315-021439
35. Simon S, Ho PM. Ethnic and racial disparities in acute myocardial infarction. Curr Cardiol Rep. (2020) 22:1–9. doi: 10.1007/s11886-020-01351-9
36. Institute of Medicine. Unequal Treatment: Confronting Racial and Ethnic Disparities in Health Care. Washington, DC: The National Academies Press (2003), p. 780.
37. Riley WJ. Health disparities: gaps in access, quality and affordability of medical care. Trans Am Clin Climatol Assoc. (2012) 123:167–72; discussion 172–4.
38. Rush B, Gerhardt W, Dhar A, Bhatt J, Batra N, Davis A. US Health Care Can't Afford Health Inequities. (2022). Available online at: https://www2.deloitte.com/us/en/insights/industry/health-care/economic-cost-of-health-disparities.html (accessed August 17, 2022).
39. Centers for Disease Control Prevention. Health Disparities. Centers for Disease Control and Prevention (2017). Available online at: https://www.cdc.gov/aging/disparities/index.htm (accessed August 17, 2022).
40. Levine RL. Healthy people 2030: a beacon for addressing health disparities and health equity. J Public Health Manag Pract. (2021) 27:S220–1. doi: 10.1097/PHH.0000000000001409
41. National Academies of Sciences, Engineering, and Medicine. Communities in Action: Pathways to Health Equity. Washington, DC: The National Academies Press (2017). doi: 10.17226/24624
42. Maddox KEJ, Orav EJ, Zheng J, Epstein AM. Characteristics of hospitals that did and did not join the bundled payments for care improvement–advanced program. JAMA. (2019) 322:362–4. doi: 10.1001/jama.2019.7992
43. Medicare Payment Advisory Commission. Report to the Congress: Medicare Payment Policy. Washington, DC: Medicare Payment Advisory Commission (2020). Available online at: https://www.medpac.gov/wp-content/uploads/import_data/scrape_files/docs/default-source/reports/mar20_entirereport_sec.pdf (accessed January 10, 2022).
44. Office of the Assistant Secretary for Planning Evaluation (ASPE). Second Report to Congress on Social Risk Factors Performance in Medicare's Value-Based Purchasing Program. Washington, DC: U.S. Department of Health & Human Services (2020). Available online at: https://aspe.hhs.gov/sites/default/files/migrated_legacy_files/195191/Second-IMPACT-SES-Report-to-Congress.pdf (accessed January 10, 2022).
45. Roberts ET, Zaslavsky AM, McWilliams JM. The value-based payment modifier: program outcomes and implications for disparities. Ann Intern Med. (2018) 168:255–65. doi: 10.7326/M17-1740
46. Crook HL, Saunders RS, Roiland R, Higgins A, McClellan MB. A decade of value-based payment: lessons learned and implications for the Center for Medicare and Medicaid Innovation, part 2. Health Aff Blog. (2021). doi: 10.1377/hblog20210607.656313
47. Phillips RL, Ostrovsky A, Bazemore AW. Adjusting medicare payments for social risk to better support social needs. Health Aff Blog. (2021) doi: 10.1377/hblog20210526.933567
48. Ryan AM. Will value-based purchasing increase disparities in care. N Engl J Med. (2013) 369:2472–4. doi: 10.1056/NEJMp1312654
49. Tobin-Tyler E, Ahmad B. Marrying Value-Based Payment and the Social Determinants of Health through Medicaid ACO's. New York, NY: Milbank Memorial Fund (2020).
50. Werner RM. Does pay-for-performance steal from the poor and give to the rich? Ann Intern Med. (2010) 153:340–1. doi: 10.7326/0003-4819-153-5-201009070-00010
51. Buntin MB, Ayanian JZ. Social risk factors and equity in Medicare payment. N Engl J Med. (2017) 376:507–10. doi: 10.1056/NEJMp1700081
52. Joynt Maddox KE. Financial incentives and vulnerable populations—will alternative payment models help or hurt? N Engl J Med. (2018) 378:977–9. doi: 10.1056/NEJMp1715455
53. McWilliams JM. MACRA: big fix or big problem? Ann Intern Med. (2017) 167:122–4. doi: 10.7326/M17-0230
54. Meyers DJ, Rahman M, Mor V, Wilson IB, Trivedi AN. Association of medicare advantage star ratings with racial, ethnic, and socioeconomic disparities in quality of care. JAMA Health Forum. (2021) 2:e210793. doi: 10.1001/jamahealthforum.2021.0793
55. Rubin R. How value-based Medicare payments exacerbate health care disparities. Jama. (2018) 319:968–70. doi: 10.1001/jama.2018.0240
56. Institute of Medicine (US) Committee on Quality of Health Care in America. Crossing the Quality Chasm: A New Health System for the 21st Century. Washington, DC: National Academies Press (US) (2001). Available online at: http://www.ncbi.nlm.nih.gov/books/NBK222274/ (accessed August 10, 2018).
57. Damberg CL, Elliott MN. Opportunities to address health disparities in performance-based accountability and payment programs. JAMA Health Forum. (2021) 2:e211143. doi: 10.1001/jamahealthforum.2021.1143
58. Epstein AM, Stern RS, Weissman JS. Do the poor cost more? A multihospital study of patients' socioeconomic status and use of hospital resources. N Engl J Med. (1990) 322:1122–8. doi: 10.1056/NEJM199004193221606
59. Frakt AB, Jha AK. Face the facts: we need to change the way we do pay for performance. Ann Intern Med. (2018) 168:291–2. doi: 10.7326/M17-3005
60. Sandhu S, Saunders RS, McClellan MB, Wong CA. Health equity should be a key value in value-based payment and delivery reform. Health Aff Blog. (2020). doi: 10.1377/hblog20201119.836369
61. Arrow KJ. Uncertainty and the welfare economics of medical care. Am Econ Rev. (1963) 53:941–73. doi: 10.2105/AJPH.53.6.941
62. Akerlof GA. The market for ‘lemons': quality uncertainty and the market mechanism. In: Diamond P, Rothschild M, editors. Uncertainty in Economics. Elsevier (1978). p. 235–51 doi: 10.1016/B978-0-12-214850-7.50022-X
64. Buchanan A. Principal/agent theory and decision making in health care. Bioethics. (1988) 2:317–33. doi: 10.1111/j.1467-8519.1988.tb00057.x
65. Jensen MC, Meckling WH. Theory of the firm: managerial behavior, agency costs and ownership structure. J Financ Econ. (1976) 3:305–60. doi: 10.1016/0304-405X(76)90026-X
66. Link BG, Phelan J. Social conditions as fundamental causes of disease. J Health Soc Behav. (1995) 35:80–94. doi: 10.2307/2626958
67. Phelan JC, Link BG, Tehranifar P. Social conditions as fundamental causes of health inequalities: theory, evidence, and policy implications. J Health Soc Behav. (2010) 51:S28–40. doi: 10.1177/0022146510383498
68. Turner RJ, Wheaton B, Lloyd DA. The epidemiology of social stress. Am Sociol Rev. (1995) 60:104–125. doi: 10.2307/2096348
69. Williams DR, Collins C. Racial residential segregation: a fundamental cause of racial disparities in health. Public Health Rep. (2016) 116:404–416. doi: 10.1093/phr/116.5.404
70. National Collaborating Centre for Determinants of Health. Let's Talk: Moving Upstream. National Collaborating Centre for Determinants of Health (2014). Available online at: https://nccdh.ca/images/uploads/Moving_Upstream_Final_En.pdf (accessed August 22, 2022).
71. National Academies of Sciences, Engineering, and Medicine. Accounting for Social Risk Factors in Medicare Payment: Criteria, Factors, and Methods. Washington, DC: The National Academies Press (2016). doi: 10.17226/23513
72. National Academies of Sciences, Engineering, and Medicine. Accounting for Social Risk Factors in Medicare Payment: Identifying Social Risk Factors. Washington, DC: The National Academies Press (2016).
73. Al Mohajer M, Joiner KA, Nix DE. Are teaching hospitals treated fairly in the hospital-acquired condition reduction program? Acad Med. (2018) 93:1827–32. doi: 10.1097/ACM.0000000000002399
74. Banerjee S, Paasche-Orlow MK, McCormick D, Lin M-Y, Hanchate AD. Readmissions performance and penalty experience of safety-net hospitals under medicare's hospital readmissions reduction program. BMC Health Serv Res. (2022) 22:338. doi: 10.1186/s12913-022-07741-9
75. Bazzoli GJ, Thompson MP, Waters TM. Medicare payment penalties and safety net hospital profitability: minimal impact on these vulnerable hospitals. Health Serv Res. (2018) 53:3495–506. doi: 10.1111/1475-6773.12833
76. Carey K, Lin M-Y. Hospital readmissions reduction program: safety-net hospitals show improvement, modifications to penalty formula still needed. Health Aff. (2016) 35:1918–23. doi: 10.1377/hlthaff.2016.0537
77. Chaiyachati KH, Qi M, Werner RM. Changes to racial disparities in readmission rates after Medicare's hospital readmissions reduction program within safety-net and non–safety-net hospitals. JAMA Netw Open. (2018) 1:e184154. doi: 10.1001/jamanetworkopen.2018.4154
78. Chen HF, Nevola A, Bird TM, Karim SA, Morris ME, Wan F, et al. Understanding factors associated with readmission disparities among Delta region, Delta state, and other hospitals. Am J Manag Care. (2018) 24:e150–6.
79. de Lancer Julnes P, Choi SW. Equity-Efficiency tradeoff: the hospital readmissions reduction program and disparities in outcomes among vulnerable medicare heart failure patients in Pennsylvania. J Health Hum Serv Adm. (2020) 43:23–48. doi: 10.37808/jhhsa.43.1.3
80. Dupree JM, Neimeyer J, McHugh M. An advanced look at surgical performance under Medicare's hospital-inpatient value-based purchasing program: who is winning and who is losing? J Am Coll Surg. (2014) 218:1–7. doi: 10.1016/j.jamcollsurg.2013.09.017
81. Favini N, Hockenberry JM, Gilman M, Jain S, Ong MK, Adams EK, et al. Comparative trends in payment adjustments between safety-net and other hospitals since the introduction of the hospital readmission reduction program and value-based purchasing. JAMA. (2017) 317:1578–80. doi: 10.1001/jama.2017.1469
82. Figueroa JF, Wang DE, Jha AK. Characteristics of hospitals receiving the largest penalties by US pay-for-performance programmes. BMJ Qual Saf. (2016) 25:898–900. doi: 10.1136/bmjqs-2015-005040
83. Gilman M, Adams EK, Hockenberry JM, Wilson IB, Milstein AS, Becker ER. California safety-net hospitals likely to be penalized by ACA value, readmission, and meaningful-use programs. Health Aff. (2014) 33:1314–22. doi: 10.1377/hlthaff.2014.0138
84. Gu Q, Koenig L, Faerberg J, Steinberg CR, Vaz C, Wheatley MP. The Medicare hospital readmissions reduction program: potential unintended consequences for hospitals serving vulnerable populations. Health Serv Res. (2014) 49:818–37. doi: 10.1111/1475-6773.12150
85. Herrin J, St Andre J, Kenward K, Joshi MS, Audet AMJ, Hines SC. Community factors and hospital readmission rates. Health Serv Res. (2015) 50:20. doi: 10.1111/1475-6773.12177
86. Joynt KE, Jha AK. Characteristics of hospitals receiving penalties under the hospital readmissions reduction program. JAMA. (2013) 309:342–3. doi: 10.1001/jama.2012.94856
87. Nagasako EM, Reidhead M, Waterman B, Claiborne Dunagan W. Adding socioeconomic data to hospital readmissions calculations may produce more useful results. Health Aff. (2014) 33:786–91. doi: 10.1377/hlthaff.2013.1148
88. Rajaram R, Chung JW, Kinnier CV, Barnard C, Mohanty S, Pavey ES, et al. Hospital characteristics associated with penalties in the centers for medicare & medicaid services hospital-acquired condition reduction program. JAMA. (2015) 314:375–83. doi: 10.1001/jama.2015.8609
89. Sankaran R, Sukul D, Nuliyalu U, Gulseren B, Engler TA, Arntson E, et al. Changes in hospital safety following penalties in the US hospital acquired condition reduction program: retrospective cohort study. BMJ. (2019) 366:14109. doi: 10.1136/bmj.l4109
90. Shih T, Ryan AM, Gonzalez AA, Dimick JB. Medicare's hospital readmission reduction program in surgery may disproportionately affect minority-serving hospitals. Ann Surg. (2015) 261:1027. doi: 10.1097/SLA.0000000000000778
91. Thompson MP, Waters TM, Kaplan CM, Cao Y, Bazzoli GJ. Most hospitals received annual penalties for excess readmissions, but some fared better than others. Health Aff. (2017) 36:893–901. doi: 10.1377/hlthaff.2016.1204
92. Zogg CK, Thumma JR, Ryan AM, Dimick JB. Medicare's hospital acquired condition reduction program disproportionately affects minority-serving hospitals: variation by race, socioeconomic status, and disproportionate share hospital payment receipt. Ann Surg. (2020) 271:985. doi: 10.1097/SLA.0000000000003564
93. Figueroa JF, Zheng J, Orav EJ, Epstein AM, Jha AK. Medicare program associated with narrowing hospital readmission disparities between black and white patients. Health Aff. (2018) 37:654–61. doi: 10.1377/hlthaff.2017.1034
94. Gai Y, Pachamanova D. Impact of the medicare hospital readmissions reduction program on vulnerable populations. BMC Health Serv Res. (2019) 19:837. doi: 10.1186/s12913-019-4645-5
95. Gaskin DJ, Zare H, Delarmente BA. The supply of hospital care to minority and low-income communities and the hospital readmission reduction program. Med Care Res Rev. (2021) 78:77–84. doi: 10.1177/1077558719861242
96. Huckfeldt P, Escarce J, Sood N, Yang Z, Popescu I, Nuckols T. Thirty-day postdischarge mortality among black and white patients 65 years and older in the medicare hospital readmissions reduction program. JAMA Netw Open. (2019) 2:e190634. doi: 10.1001/jamanetworkopen.2019.0634
97. Kaplan CM, Thompson MP, Waters TM. How have 30-day readmission penalties affected racial disparities in readmissions?: an analysis from 2007 to 2014 in five US States. J Gen Intern Med. (2019) 34:878–83. doi: 10.1007/s11606-019-04841-x
98. Mellor J, Daly M, Smith M. Does it pay to penalize hospitals for excess readmissions? Intended and unintended consequences of medicare's hospital readmissions reductions program. Health Econ. (2017) 26:1037–51. doi: 10.1002/hec.3382
99. Pandey A, Keshvani N, Khera R, Lu DI, Vaduganathan M, Maddox KEJ, et al. Temporal trends in racial differences in 30-day readmission and mortality rates after acute myocardial infarction among medicare beneficiaries. JAMA Cardiol. (2020) 5:136–45. doi: 10.1001/jamacardio.2019.4845
100. Salerno AM, Horwitz LI, Kwon JY, Herrin J, Grady JN, Lin Z, et al. Trends in readmission rates for safety net hospitals and non-safety net hospitals in the era of the US hospital readmission reduction program: a retrospective time series analysis using medicare administrative claims data from 2008 to 2015. BMJ Open. (2017) 7:e016149. doi: 10.1136/bmjopen-2017-016149
101. Sheingold SH, Zuckerman R, Shartzer A. Understanding medicare hospital readmission rates and differing penalties between safety-net and other hospitals. Health Aff. (2016) 35:124–31. doi: 10.1377/hlthaff.2015.0534
102. Wasfy JH, Bhambhani V, Healy EW, Choirat C, Dominici F, Wadhera RK, et al. Relative effects of the hospital readmissions reduction program on hospitals that serve poorer patients. Med Care. (2019) 57:968. doi: 10.1097/MLR.0000000000001207
103. Damberg CL, Elliott MN, Ewing BA. Pay-for-performance schemes that use patient and provider categories would reduce payment disparities. Health Aff. (2015) 34:134–42. doi: 10.1377/hlthaff.2014.0386
104. Chen H-F, Schuldt RF, Brown C, Tilford JM. How have hospitals in the mississippi delta fared under the 2019 revised hospital readmissions reduction program? Inquiry. (2020) 57:0046958020972309. doi: 10.1177/0046958020972309
105. McCarthy CP, Vaduganathan M, Patel KV, Lalani HS, Ayers C, Bhatt DL, et al. Association of the new peer group–stratified method with the reclassification of penalty status in the hospital readmission reduction program. JAMA Netw Open. (2019) 2:e192987. doi: 10.1001/jamanetworkopen.2019.2987
106. Hsuan C, Braun TM, Ponce NA, Hoffman GJ. Are improvements still needed to the modified hospital readmissions reduction program: a health and retirement study (2000–2014)? J Gen Intern Med. (2020) 35:3564–71. doi: 10.1007/s11606-020-06222-1
107. Aswani MS, Roberts ET. Social risk adjustment in the hospital readmission reduction program: pitfalls of peer grouping, measurement challenges, and potential solutions. Health Serv Res. (2022). doi: 10.1111/1475-6773.13969. [Epub ahead of print].
108. Alternative Payment Model Framework Progress Tracking (APM FPT) Work Group. Alternative Payment Model (APM) Framework: Final White Paper. (2016). Available online at: https://hcp-lan.org/workproducts/apm-whitepaper.pdf (accessed August 20, 2022).
109. Casalino LP, Elster A, Eisenberg A, Lewis E, Montgomery J, Ramos D. Will pay-for-performance and quality reporting affect health care disparities? These rapidly proliferating programs do not appear to be devoting much attention to the possible impact on disparities in health care. Health Aff. (2007) 26:w405–14. doi: 10.1377/hlthaff.26.3.w405
110. Shi L, Starfield B, Politzer R, Regan J. Primary care, self-rated health, and reductions in social disparities in health. Health Serv Res. (2002) 37:529–50. doi: 10.1111/1475-6773.t01-1-00036
111. DeMeester RH, Xu LJ, Nocon RS, Cook SC, Ducas AM, Chin MH. Solving disparities through payment and delivery system reform: a program to achieve health equity. Health Aff. (2017) 36:1133–9. doi: 10.1377/hlthaff.2016.0979
112. Liao JM, Lavizzo-Mourey RJ, Navathe AS. A national goal to advance health equity through value-based payment. JAMA. (2021) 325:2439–440. doi: 10.1001/jama.2021.8562
113. Office of the Assistant Secretary for Planning Evaluation (ASPE). Social Risk Factors Performance Under Medicare's Value-Based Purchasing Programs. [Report to Congress]. Washington, DC: U.S. Department of Health & Human Services (2016). Available online at: https://www.aspe.hhs.gov/sites/default/files/private/pdf/253971/ASPESESRTCfull.pdf (accessed April 22, 2021).
Keywords: Value-Based Purchasing, Medicare, health equity, payment reform, upstream approach, hospital VBP, health care disparity, social determinant of health
Citation: Kim H, Mahmood A, Hammarlund NE and Chang CF (2022) Hospital value-based payment programs and disparity in the United States: A review of current evidence and future perspectives. Front. Public Health 10:882715. doi: 10.3389/fpubh.2022.882715
Received: 24 February 2022; Accepted: 12 September 2022;
Published: 10 October 2022.
Edited by:
Jason Scott Turner, Rush University Medical Center, United StatesReviewed by:
Michael E. Morris, The University of Texas Health Science Center at Tyler, United StatesConnie J. Evashwick, George Washington University, United States
Copyright © 2022 Kim, Mahmood, Hammarlund and Chang. This is an open-access article distributed under the terms of the Creative Commons Attribution License (CC BY). The use, distribution or reproduction in other forums is permitted, provided the original author(s) and the copyright owner(s) are credited and that the original publication in this journal is cited, in accordance with accepted academic practice. No use, distribution or reproduction is permitted which does not comply with these terms.
*Correspondence: Hyunmin Kim, SHl1bm1pbi5LaW1AdXNtLmVkdQ==
†ORCID: Hyunmin Kim orcid.org/0000-0001-7005-2568