 Yanbao Sun1†
 Wenyu Chen
- 1Department of Radiology, Affiliated Hospital of Jiaxing University, Jiaxing, China
- 2Department of Respiration in Affiliated Hospital of Jiaxing University/The First Hospital of Jiaxing, Jiaxing, China
- 3Center for Pain Medicine in Affiliated Hospital of Jiaxing University/The First Hospital of Jiaxing, Jiaxing, China
- 4The Xiuzhou Kang'an Hospital of Jiaxing, Jiaxing, China
Since the first report of SARS-CoV-2 virus in Wuhan, China in December 2019, a global outbreak of Corona Virus Disease 2019 (COVID-19) pandemic has been aroused. In the prevention of this disease, accurate diagnosis of COVID-19 is the center of the problem. However, due to the limitation of detection technology, the test results are impossible to be totally free from pseudo-positive or -negative. Improving the precision of the test results asks for the identification of more biomarkers for COVID-19. On the basis of the expression data of COVID-19 positive and negative samples, we first screened the feature genes through ReliefF, minimal-redundancy-maximum-relevancy, and Boruta_MCFS methods. Thereafter, 36 optimal feature genes were selected through incremental feature selection method based on the random forest classifier, and the enriched biological functions and signaling pathways were revealed by Gene Ontology and Kyoto Encyclopedia of Genes and Genomes. Also, protein-protein interaction network analysis was performed on these feature genes, and the enriched biological functions and signaling pathways of main submodules were analyzed. In addition, whether these 36 feature genes could effectively distinguish positive samples from the negative ones was verified by dimensionality reduction analysis. According to the results, we inferred that the 36 feature genes selected via Boruta_MCFS could be deemed as biomarkers in COVID-19.
Introduction
Since the first report of severe acute respiratory syndrome coronavirus type 2 (SARS-CoV-2) in Wuhan in December 2019, the pandemic of the Coronavirus Disease 2019 (COVID-19) has swept the whole world. As of March 1, 2021, according to data published by the World Health Organization, SARS-CoV-2 has caused 113,820,168 infected cases and 2,527,891 deaths (https://www.who.int/en/). SARS-CoV-2 infection is mainly characterized by high viral load and high infectivity in patients at (or before) the onset of COVID-19 symptoms, while a proportion of infected individuals are asymptomatic (1–4). Therefore, the precise diagnosis for COVID-19 is of great importance. Presently, assistance of COVID-19 diagnosis broadly covers the following ways: detecting the viral RNA through qPCR; detecting antigens or corresponding antibodies in serum by colloidal gold or chemiluminescence; lung images via computed tomography (CT). However, none of these methods could avoid missed diagnosis or misdiagnosis of COVID-19 (5). To improve the diagnostic precision of COVID-19, it is urgent to discover new biomarkers.
ReliefF, minimal-redundancy-maximum-relevancy (mRMR) and BorutaMCFS were adopted to screen feature genes from expression data. RelieF is an algorithmic process for assessing the weight ratio percentage of multiple attributes in a system, and is often used in practical applications to preprocess data to obtain a feature subset (6). mRMR is an algorithm that measures the relevance and redundancy of features, and selects the one with maximum relevance and minimum redundancy. This approach focuses on preprocessing data to improve prediction accuracy (7). Tao Li et al. proved that ReliefF, mRMR, and the combination of the two could select feature genes from different tumor samples based on gene expression data. However, after being validated by support vector machine (SVM) and Naïve Bayes Classifier (NB), the optimal feature genes were selected through the combination of ReliefF and Mrmr (6). Boruta is a random forest-based screening approach. It iteratively removes features that have been proven to be less correlated with random probes, which in turn reduces signal noise (8). Degenhardtet al. (9) used Boruta to screen feature genes of breast cancer patients and classified ER-positive and -negative samples by a random forest classifier, which was indicated to have a stable classification effect. However, the importance of the features identified through this approach could not be determined. Hence, we further performed MCFS feature selection based on Boruta. MCFS is a feature selection method based on random sampling and constructing multiple decision trees (10). In a study by Yu-DongCai et al. (10) MCFS was adopted to preprocess peptide chain profiling data, which in turn led to the selection of peptide chains that could effectively classify different cancers. The combination of Boruta and MCFS was adopted in this study.
In this study, we selected 36 effective feature genes as biomarkers for COVID-19 on the basis of their expression data in COVID-19 positive and negative samples with the combination of Boruta and MCFS methods. Through enrichment analysis, literature review, and principal component analysis (PCA), these feature genes were evaluated for their qualification as COVID-19 biomarkers. Based on the analysis results, we concluded that the identified 36 feature genes were expected to be novel biomarkers for COVID-19.
Materials and Methods
Study Design and Acquirement of Expression Data of Genes and MRNAs Related to COVID-19
COVID-19-related data were acquired by following steps mentioned in literature (11). Specifically, the gene expression data contained upper respiratory tract mRNA expression data (GSE156063) from 93 COVID-19 patients with acute respiratory disease and 141 uninfected patients with acute respiratory disease. The expression data were downloaded from the Gene Expression Omnibus (GEO) database (https://www.ncbi.nlm.nih.gov/geo/). Clinical characteristics of 234 samples were manifested in Supplementary Table 1. The mRNA expression data were obtained through RNA metagenomic sequencing with GPL24676 Illumina NovaSeq 6000 (Homosapiens). In the expression matrix, genes with mean values <1 and maximum values >5 were removed. The remaining data were subsequently normalized by the edgR package (12). Based on the dataset, the flowchart of the study is displayed in Figure 1.
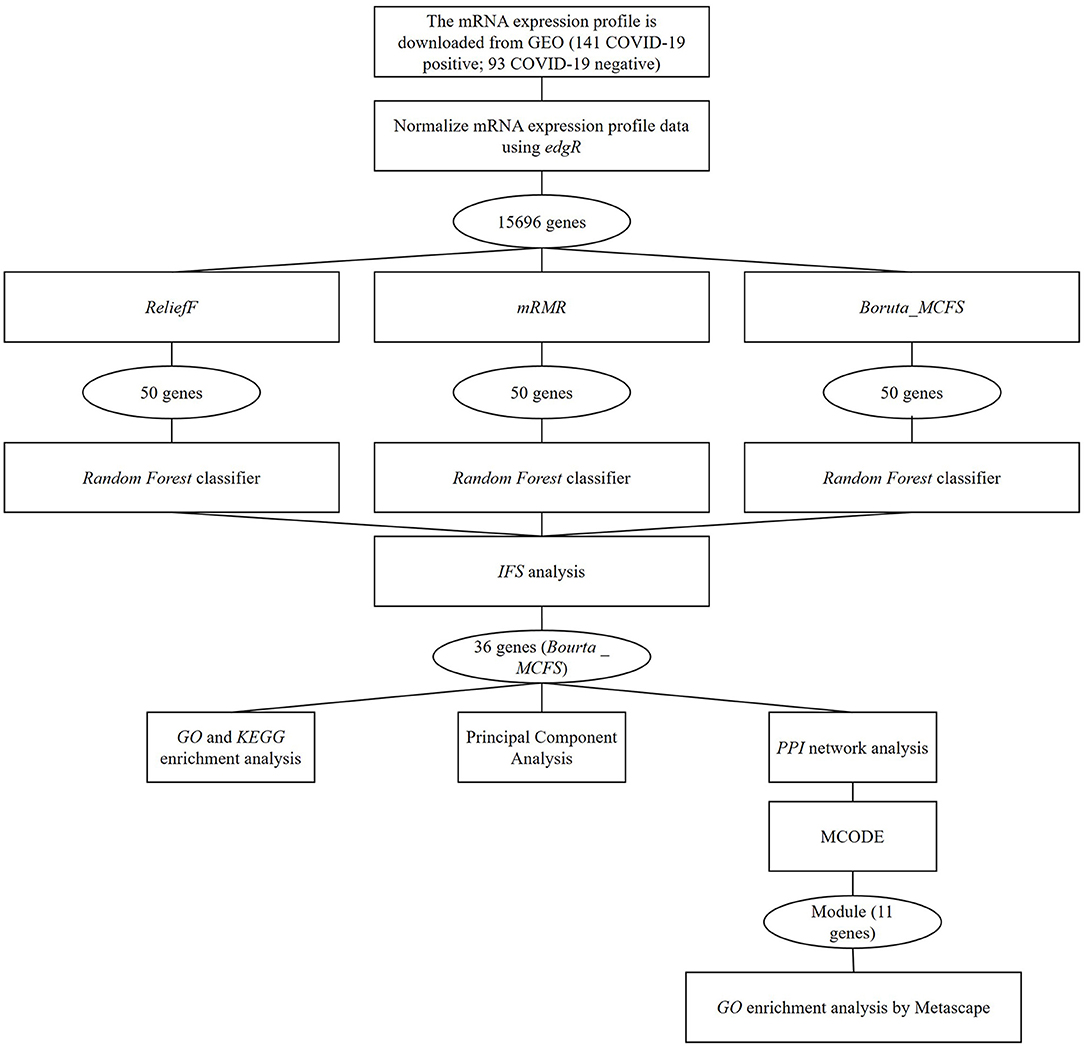
Figure 1. The flowchart of the study.
Feature Genes Screening
The data were classified by ReliefF (13) and the feature genes were ranked by the mRMR method (11). Algorithm 1 is a novel algorithm based on Relief (14). Relief is an algorithm that assigns features different weights based on the relevance of each feature and category, and features with weights less than a specific threshold will be removed. Since Relief can only process two categories of data, ReliefF, which can process multiple categories of sample data, was later developed based on Relief algorithm. This algorithm is used to deal with regression problems where the targets are continuous values. The processes of ReliefF algorithm were as follows: Sample Ri is randomly taken from the dataset W[A] each time, and then k nearest neighbor samples Hj (nearest hits) are found from the set of Ri similar samples, while k nearest neighbor samples Mj (nearest misses) are found from the set of Ri non-similar samples. The weight of each feature is updated according to the Ri, Hj, Mj values, and ranked according to each feature weight.
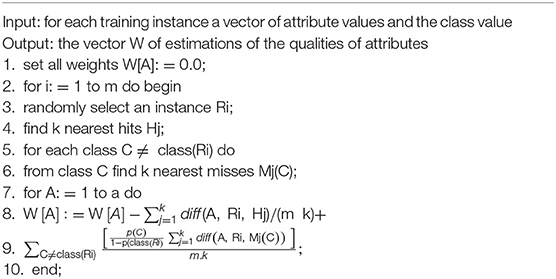
Algorithm 1. ReliefF.
The mRMR is an algorithm (7) that measures the relevance and redundancy of features and picks those with the maximum relevance (Max-Relevance) and the minimum redundancy (Minimal-Redundancy). Max-Relevance was calculated with the following formula:
Features selected on the basis of Max-Relevance can be redundant and have large interdependencies. Therefore, removing one feature from these mutually highly dependent features did not hugely change the classification results. To select independent features, Minimal-Redundancy was introduced:
In the above formula, S represents the feature set, x represents the feature, and c represents the classification. The algorithm mRMR combined Max-relevance and Minimal-Redundancy and is defined as:
Boruta is a random forest-based screening approach. It iteratively removes features that have been shown to have low correlation with random probes, which in turn reduces signal noise (15). The algorithm for Boruta is listed below:
1. Enlarge the information system by adding sample data.
2. Disrupt the added attributes.
3. Run random forest classifier in the expanded information system, where Z scores were calculated.
4. Find the maximum Z-score in the shadow attribute (MZSA), and then assign a hit to each feature with scores higher than MZSA.
5. Perform a two-sided test equivalent to MZSA on attributes with undetermined significance.
6. Remove features significantly less important than MZSA from the information system.
7. Delete all the MZSA.
8. Repeat the algorithm until importance was assigned to all attributes.
However, the importance of features selected by this method could not be determined. Therefore, we further performed MCFS to select features based on Boruta results.
MCFS builds multiple decision trees based on random sampling in multiple characteristics and then infers relative importance (RI) of each feature through the repeated bootstrap tests (16). The MCFS algorithm is defined as:
In the formula, wACC was the weighted accuracy; ng(τ) was the node of the characteristic in the decision tree; the information acquisition of ng(τ) was expressed as IG(ng(τ)); no.in ng(τ) represents the number of training samples in ng(τ); u and v represent different weight factors, whose default value was 1.
Feature genes were screened through ReliefF, mRMR, and Boruta_MCFS. The ReliefF algorithm was based on the python package “sklearn.” The mRMR algorithm-related program (http://home.penglab.com/proj/mRMR/) was downloaded, by which the features were ranked. The Boruta feature selection method was constructed on the basis of the python package “Borutapy” for removing less correlated feature genes. Subsequently, the MCFS feature selection method was constructed based on the python package “skfeature” (17) to further identify important feature genes.
The Construction of Classifier and the Selection of Optimal Feature Genes
Three sets of top 50 feature genes were selected by the three feature selection methods. Thereafter, we set up a classifier to filter optimal feature genes by methods described previously (18). A random forest classifier was constructed based on the python package “skfeature” (17). Owing to the unbalanced samples, model training was conducted on the basis of python package “imblearn” and upsampling method. An incremental feature selection (IFS) curve (19) was drawn based on the Matthews correlation coefficient (MCC) obtained based on the 10-fold cross-validation of random forest classification. MCC is the Pearson correlation coefficient of the actual and predicted values calculated by the confusion matrix method. MCC values range from −1 to +1, with values approaching +1 indicating a more precise prediction, values approaching 0 indicating the prediction is not better than random one, and values approaching −1 indicating the opposite relationship between predicted and actual observations (20). The feature gene selection method with the highest MCC value in the IFS curve and the corresponding top feature genes were selected as feature genes with good prediction performance.
Enrichment Analyses
Optimal feature genes were subjected to pathway enrichment analyses by Gene Ontology (GO) and Kyoto Encyclopedia of Genes and Genomes (KEGG) (11). GO and KEGG enrichment analyses were performed by adopting the R package “clusterProfiler” (21) (pValue < 0.05, qValue < 0.05). GO enrichment analysis revealed the biological process (BP) and molecular function (MF) were mainly enriched by the feature genes. KEGG unveiled the relevant signaling pathways with major enrichment of feature genes. The protein-protein interaction (PPI) network subset analysis was carried out at Metascape (http://metascape.org/) (pValue <0 .05) for GO enrichment analysis (http://metascape.org/).
PPI Network Analysis
Interactions between proteins were analyzed by PPI networks by ways described before (22). Through String database (https://www.string-db.org/), a PPI network analysis (with default parameters) was performed on the feature genes (with all parameters as default), major PPI network subsets were selected by using MCODE in Cytoscape. Meanwhile, we performed a topological analysis of the PPI network. GO enrichment analysis was performed on the subsets selected by Metascape.
Principal Component Analysis (PCA)
Validity of the feature genes was verified by PCA method according to a previous report (11). PCA is a dimensionality reduction analysis for high latitude data. The R package “FactoMineR” was adopted to extract the first and second principal components of optimal feature genes (23). Through the dimensionality reduction analysis of high-latitude feature genes, the expression profile dataset is mapped to two dimensions to obtain sample scatter plots with different distances.
Results
Different Feature Selection Methods Including ReliefF, MRMR, and Boruta_MCFS Were Compared
Based on the 15,696 genes obtained, we further used the ReliefF, mRMR, and BorutaMCFS algorithms for feature gene selection after data normalization by the package “edgeR.” We selected the top 50 feature genes using the above 3 methods (Supplementary Table 2). The obtained feature genes were classified through the random forest classifier and then subjected to the 10-fold cross-validation. Optimal feature gene set checked by IFS curve was used as biomarkers for COVID-19. The IFS curve revealed the highest MCC value, with a sensitivity of 0.892, a specificity of 0.923 and MCC of 0.839 (Figure 2) in the random forest classification model constructed with the 36 top feature genes (Table 1) selected by the Boruta_MCFS method.
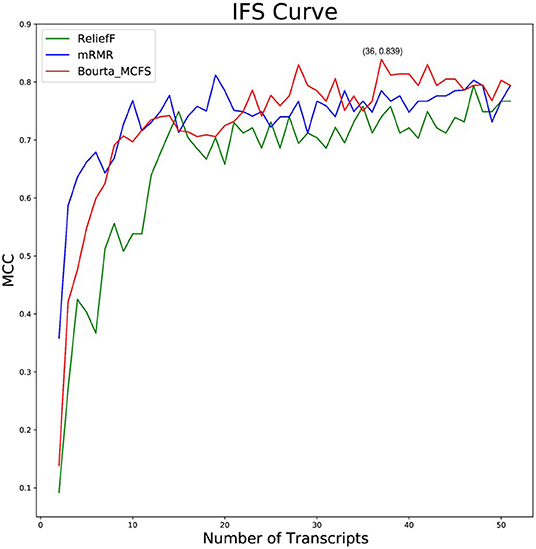
Figure 2. Different feature selection methods including ReliefF, mRMR, and Boruta_MCFS were compared. The IFS curves of ReliefF, mRMR, and Boruta_MCFS methods based on the random forest classifier. The abscissa represents the number of feature genes, and the ordinate represents the MCC value.
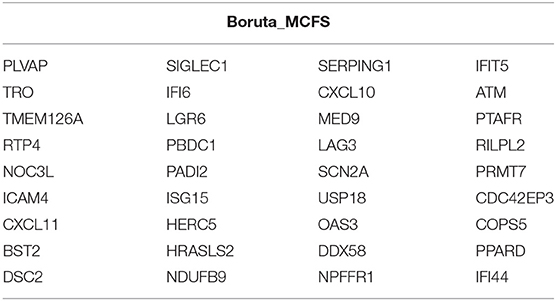
Table 1. 36 feature genes screened by Boruta_MCFS feature selection method.
Enrichment Analyses
In order to explore the biological functions and signaling pathways involved by the feature genes, we performed GO and KEGG enrichment analyses on these 36 feature genes. These genes were mainly enriched in biological functions including response to virus, defense response to virus, regulation of multi-organism process, type I interferon signaling pathway, and negative regulation of viral genome replication (Figure 3A). KEGG revealed that these genes were largely enriched in signaling pathways including Epstein-Barr virus infection and Coronavirus-COVID-19 (Figure 3B). Besides, it could be predicted from the results that the signaling pathway of coronavirus infection may be similar to that of Epstein-Barr virus. Also, this assumption has also been pointed out in previous works through proteomic and transcriptomic analyses (24).
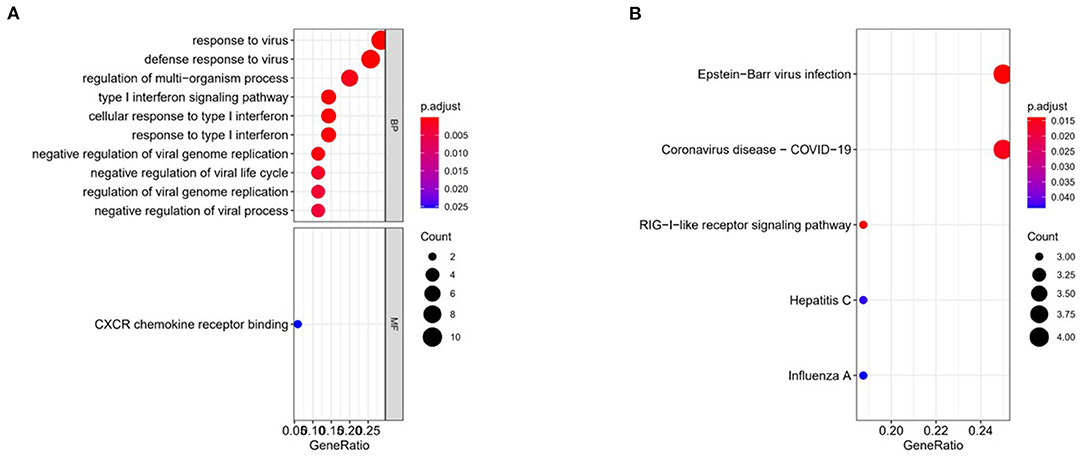
Figure 3. Functional enrichment analyses. (A) GO was performed on 36 feature genes. (B) KEGG was performed on 36 feature genes.
PPI Network Analysis
To further validate the relationship of the 36 feature genes, we performed PPI network analysis through the String database, where 73 interactions and 22 nodes were contained in the network (Figure 4A). Eleven out of 22 feature genes in the PPI network had more nodes: CXCL10, ISG15, IFI44, OAS3, BST2, DDX58, USP18, HERC5, IFI6, RTP4, and IFIT5 (Figure 4B). Then, based on the PPI network, the largest subset containing 11 nodes was selected through MCODE (Figure 4C). GO functional enrichment analysis was performed on the main subset on the Metascape website (Figures 4D–F). These genes were mainly enriched in biological functions including response to virus, interferon signaling, antiviral mechanism by IFN-stimulated genes, and type II interferon signaling.
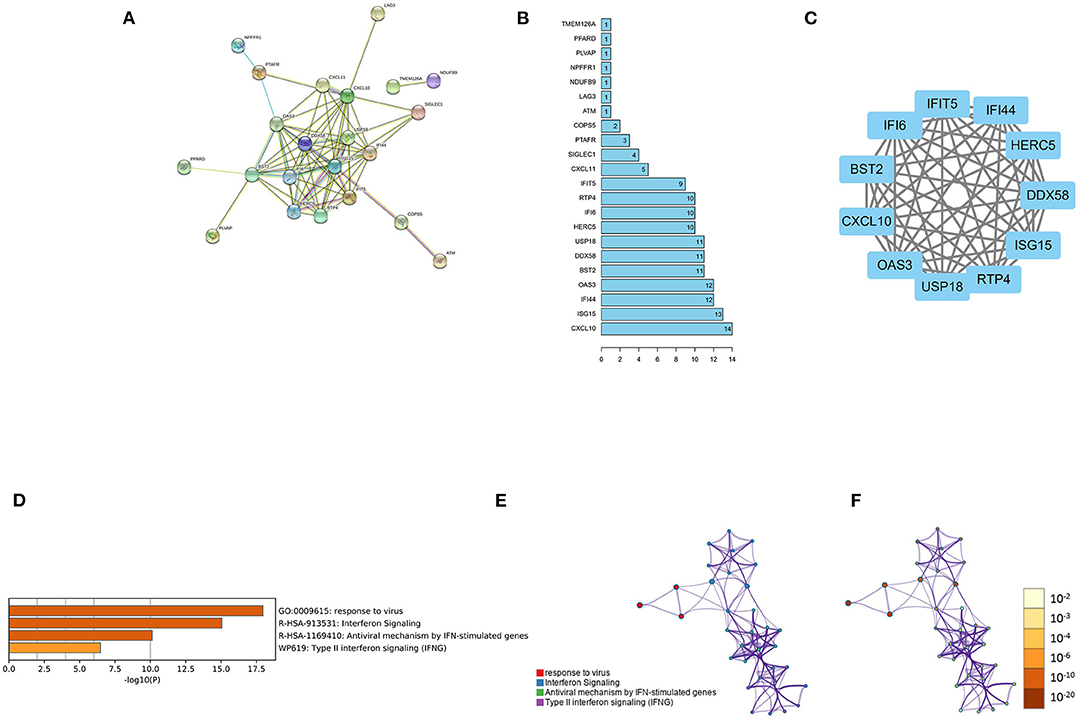
Figure 4. PPI network analysis. (A) The PPI network based on 36 feature genes. (B) The number of nodes of the 22 feature genes in the PPI network. (C) Major subsets identified using MCODE; (D) The heat map of the enriched module (the smaller the p-value, the darker the color). (E) The network of the enriched module (the same cluster with the same color). (F) Enriched module network (the smaller the p-value, the darker the color).
PCA
In order to verify whether the above 36 feature genes could effectively distinguish the positive cases from the negative ones, we performed PCA on these genes (Figure 5). The results suggested that positive and negative COVID-19 samples could be separated in PC1 and PC2. Therefore, we inferred that the above 36 feature genes could be used to judge whether the sample was COVID-19 positive or negative.
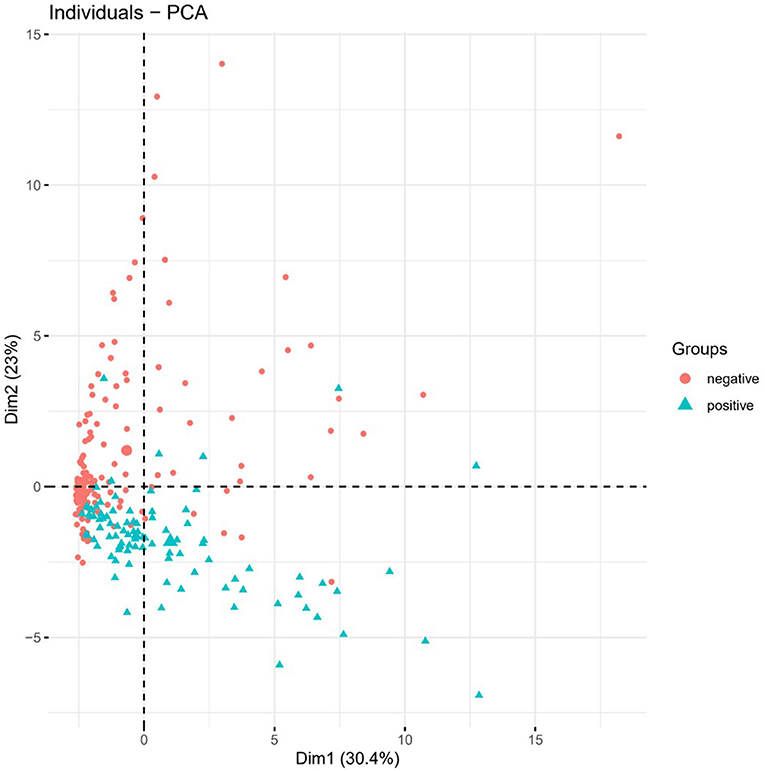
Figure 5. PCA. PCA was performed on the 36 feature genes. Green represents positive samples and red represents negative ones.
Discussion
In this study, in order to find new biomarkers for COVID-19, we screened effective feature genes based on the expression data of COVID-19 positive and negative samples. Enrichment analysis, literature review, and PCA were performed to verify whether these feature genes could be COVID-19 biomarkers. First, 3 methods of ReliefF, mRMR, and Boruta_MCFS were adopted to screen feature genes from the expression data. Then, the optimal feature genes were confirmed by the random forest classifier based on IFS. Compared with ReliefF and mRMR, Boruta_MCFS can screen feature genes that are more reliable. We performed GO and KEGG enrichment analyses on the optimal feature genes and found that these genes were mainly enriched in biological functions and signaling pathways relating to SARS-CoV-2 and antiviral functions, as well as immune regulation. At the same time, PPI network analysis was also performed on the feature genes to confirm the main subsets in the network. GO and KEGG were performed on the subsets on the Metascape website. The results revealed that the main subset was enriched in the above-mentioned biological functions and signaling pathways. Finally, the PCA analysis verified that COVID-19 positive and negative samples could be distinguished by PC1 and PC2 based on the selected feature genes. Combining the results of all bioinformatics analyses, a COVID-19 classifier based on 36 feature genes was built. At the same time, we inferred that these 36 feature genes were expected to be novel biomarkers for COVID-19.
Based on the 36 selected feature genes, we performed further analysis in combination with literature review and found 13 genes (CXCL11, BST2, CXCL10, MED9, LAG3, USP18, OAS3, DDX58, IFI6, PADI2, ISG15, PTAFR, IFI44) were reported in articles relating to SARS-CoV-2 (25–35). According to the study reports, CXCL10, CXCL11, LAG3, OAS3, PADI2 and other genes are significantly upregulated in the blood or lung tissue in patients with severe COVID-19 (25, 27, 29, 31, 33, 36). The expression of BST2 and DDX58 is associated with antiviral functions (26, 30, 37). In addition, LAG3 and USP18 are involved in inhibiting the cytotoxicity of CD8+T cells and inhibiting IFN-I signaling pathway, respectively (29, 38, 39). Some existing studies also demonstrated that some genes are associated with COVID-19.
The functional enrichment analysis of 36 feature genes showed that these genes were mainly enriched in functions and pathways relating to SARS-CoV-2 and antivirus, as well as immune regulation (especially in the functions related to interferon regulation). BST2 protein can be activated by interferon and inhibit the synthesis of viral coat protein when cells are infected, thus playing an antiviral role (37). DDX58 can edit RIG-I protein, while RIG-I protein can detect viral nucleoprotein, and then activate interferon-stimulated genes (ISGs) (30). The above genes are all involved in the antiviral function. Some of the feature genes are also associated with negative immune regulation. For example, USP18k negatively regulates the interferon signaling pathway and dissociates ISG15 from binding to proteins of interest to inhibit the ubiquitination process (38). LAG3 acts as an immune checkpoint molecule to inhibit the activity of CD8+T cells (40). In addition, an article stated that ISG15 as a ubiquitin-like protein can be recognized and degraded by SARS-CoV-2, thereby repressing the ubiquitination activity (34). Since the process of protein ubiquitination modification is crucial to the regulation of the human immune system, the above process is possible to be involved in immune regulation (41). Therefore, we inferred that the 36 feature genes were highly correlated with SARS-CoV-2 infection. Further, we also performed GO enrichment analysis on the main subset of the PPI network of 36 feature genes, indicating the genes in the subset were largely enriched in the biological functions relating to response to virus and interferon signaling. From the results of enrichment analysis, it is deduced that the function of these feature genes was closely related to the immune regulatory response after SARS-CoV-2 infection.
Taken together with the above discussion, the 36 feature genes we selected were unique biomarkers in COVID-19 that could effectively distinguish the positive cases from the negative ones. Nevertheless, there were some limitations. We only predicted the candidate biomarkers for COVID-19, but did not study further mechanisms of them. Therefore, we plan to explore the role of some of these genes in the infected cells through a series of molecular as well as in vitro cellular functional experiments. For example, after SARS-CoV-2 infection, what would change in the LAG3 level; whether LAG3 inhibits the activity of CD8+T cells; if LAG3 affects the activity of CD8+T cells, which pathways would be affected and what is the significance of these effects.
Data Availability Statement
The datasets presented in this study can be found in online repositories. The names of the repository/repositories and accession number(s) can be found in the article/Supplementary Material.
Author Contributions
WC designed the study and reviewed and edited the manuscript. FX contributed to the literature research. YS and QZ collected the data. QY and MY analyzed and interpreted the data. YS wrote the initial draft of the manuscript. All authors read and approved the manuscript.
Funding
The work was funded by Jiaxing Fight Novel Coronavirus Pneumonia Emergency Technology Attack Special Project in 2020 (No. 2020GZ30001), the Key Discipline of Jiaxing Respiratory Medicine Construction Project (No. 2019-zc-04), General Scientific Research Project of Education Department of Zhejiang Province (No. Y202043729), and Jiaxing Key Laboratory of Precision Treatment for Lung Cancer.
Conflict of Interest
The authors declare that the research was conducted in the absence of any commercial or financial relationships that could be construed as a potential conflict of interest.
Publisher's Note
All claims expressed in this article are solely those of the authors and do not necessarily represent those of their affiliated organizations, or those of the publisher, the editors and the reviewers. Any product that may be evaluated in this article, or claim that may be made by its manufacturer, is not guaranteed or endorsed by the publisher.
Supplementary Material
The Supplementary Material for this article can be found online at: https://www.frontiersin.org/articles/10.3389/fpubh.2022.901602/full#supplementary-material
Supplementary Table 1. Clinical characteristics of 234 samples downloaded from GEO database.
Supplementary Table 2. Top 50 feature genes selected via ReliefF, mRMR, and BorutaMCFS algorithm.
References
1. He X, Lau EHY, Wu P, Deng X, Wang J, Hao X, et al. Temporal dynamics in viral shedding and transmissibility of COVID-19. Nat Med. (2020) 26:672–5. doi: 10.1038/s41591-020-0869-5
2. Lavezzo E, Franchin E, Ciavarella C, Cuomo-Dannenburg G, Barzon L, Del Vecchio C, et al. Suppression of a SARS-CoV-2 outbreak in the Italian municipality of Vo'. Nature. (2020) 584:425–9. doi: 10.1038/s41586-020-2488-1
3. Arons MM, Hatfield KM, Reddy SC, Kimball A, James A, Jacobs JR, et al. Presymptomatic SARS-CoV-2 infections and transmission in a skilled nursing facility. N Engl J Med. (2020) 382:2081–90. doi: 10.1056/NEJMoa2008457
4. Wu C, Chen X, Cai Y, Xia J, Zhou X, Xu S, et al. Risk factors associated with acute respiratory distress syndrome and death in patients with coronavirus disease 2019 pneumonia in Wuhan, China. JAMA Intern Med. (2020) 180:934–43. doi: 10.1001/jamainternmed.2020.0994
5. Gao J, Quan L. Current status of diagnostic testing for SARS-CoV-2 infection and future developments: a review. Med Sci Monit. (2020) 26:e928552. doi: 10.12659/MSM.928552
6. Zhang Y, Ding C, Li T. Gene selection algorithm by combining reliefF and mRMR. BMC Genomics. (2008) 9 Suppl 2:S27. doi: 10.1186/1471-2164-9-S2-S27
7. Peng H, Long F, Ding C. Feature selection based on mutual information: criteria of max-dependency, max-relevance, and min-redundancy. IEEE Trans Pattern Anal Mach Intell. (2005) 27:1226–38. doi: 10.1109/TPAMI.2005.159
8. Sanchez-Pinto LN, Venable LR, Fahrenbach J, Churpek MM. Comparison of variable selection methods for clinical predictive modeling. Int J Med Inform. (2018) 116:10–7. doi: 10.1016/j.ijmedinf.2018.05.006
9. Degenhardt F, Seifert S, Szymczak S. Evaluation of variable selection methods for random forests and omics data sets. Brief Bioinform. (2019) 20:492–503. doi: 10.1093/bib/bbx124
10. Chen L, Pan X, Zeng T, Zhang YH, Zhang Y, Huang T, et al. Immunosignature screening for multiple cancer subtypes based on expression rule. Front Bioeng Biotechnol. (2019) 7:370. doi: 10.3389/fbioe.2019.00370
11. Zhang S, Qu R, Wang P, Wang S. Identification of novel COVID-19 biomarkers by multiple feature selection strategies. Comput Math Methods Med. (2021) 2021:2203636. doi: 10.1155/2021/2203636
12. Robinson MD, McCarthy DJ, Smyth GK. edgeR: a Bioconductor package for differential expression analysis of digital gene expression data. Bioinformatics. (2010) 26:139–40. doi: 10.1093/bioinformatics/btp616
13. Sun L, Kong X, Xu J, Xue Z, Zhai R, Zhang S, et al. Hybrid gene selection method based on relieff and ant colony optimization algorithm for tumor classification. Sci Rep. (2019) 9:8978. doi: 10.1038/s41598-019-45223-x
14. Robnik-Ikonja M, Kononenko I. Theoretical and Empirical Analysis of ReliefF and RReliefF. Mach Learn. (2003) 53:23–69. doi: 10.1023/A:1025667309714
15. Kursa MB. Rudnicki WR. Feature selection with boruta package. J Stat Softw. (2010) 36:1–13. doi: 10.18637/jss.v036.i11
16. Draminski M, Rada-Iglesias A, Enroth S, Wadelius C, Koronacki J, Komorowski J. Monte Carlo feature selection for supervised classification. Bioinformatics. (2008) 24:110–7. doi: 10.1093/bioinformatics/btm486
17. Shin B, Park S, Hong JH, An HJ, Chun SH, Kang K, et al. Cascaded Wx: A Novel Prognosis-Related Feature Selection Framework In Human Lung Adenocarcinoma Transcriptomes. Front Genet. (2019) 10:662. doi: 10.3389/fgene.2019.00662
18. Chen L, Li Z, Zeng T, Zhang YH, Feng K, Huang T, et al. Identifying COVID-19-specific transcriptomic biomarkers with machine learning methods. Biomed Res Int. (2021) 2021:9939134. doi: 10.1155/2021/9939134
19. Tan JX, Dao FY, Lv H, Feng PM, Ding H. Identifying phage virion proteins by using two-step feature selection methods. Molecules. (2018) 23:2000. doi: 10.3390/molecules23082000
20. Chicco D, Jurman G. The advantages of the Matthews correlation coefficient (MCC) over F1 score and accuracy in binary classification evaluation. BMC Genomics. (2020) 21:6. doi: 10.1186/s12864-019-6413-7
21. Yu G, Wang LG, Han Y, He QY. clusterProfiler: an R package for comparing biological themes among gene clusters. OMICS. (2012) 16:284–7. doi: 10.1089/omi.2011.0118
22. Fan L, Feng S, Wang T, Ding X, An X, Wang Z, et al. Chemical composition and therapeutic mechanism of Xuanbai Chengqi Decoction in the treatment of COVID-19 by network pharmacology, molecular docking and molecular dynamic analysis. Mol Divers. (2022). doi: 10.1007/s11030-022-10415-7
23. Garcia-Rudolph A, Garcia-Molina A, Opisso E, Tormos Munoz J. Personalized web-based cognitive rehabilitation treatments for patients with traumatic brain injury: cluster analysis. JMIR Med Inform. (2020) 8:e16077. doi: 10.2196/16077
24. Barh D, Tiwari S, Weener ME, Azevedo V, Goes-Neto A, Gromiha MM, et al. Multi-omics-based identification of SARS-CoV-2 infection biology and candidate drugs against COVID-19. Comput Biol Med. (2020) 126:104051. doi: 10.1016/j.compbiomed.2020.104051
25. Haljasmagi L, Salumets A, Rumm AP, Jurgenson M, Krassohhina E, Remm A, et al. Longitudinal proteomic profiling reveals increased early inflammation and sustained apoptosis proteins in severe COVID-19. Sci Rep. (2020) 10:20533. doi: 10.1038/s41598-020-77525-w
26. Morante S, La Penna G, Rossi G, Stellato F. SARS-CoV-2 virion stabilization by Zn binding. Front Mol Biosci. (2020) 7:222. doi: 10.3389/fmolb.2020.00222
27. Xiong Y, Liu Y, Cao L, Wang D, Guo M, Jiang A, et al. Transcriptomic characteristics of bronchoalveolar lavage fluid and peripheral blood mononuclear cells in COVID-19 patients. Emerg Microbes Infect. (2020) 9:761–70. doi: 10.1080/22221751.2020.1747363
28. Sacar Demirci MD, Adan A. Computational analysis of microRNA-mediated interactions in SARS-CoV-2 infection. PeerJ. (2020) 8:e9369. doi: 10.7717/peerj.9369
29. Saheb Sharif-Askari N, Saheb Sharif-Askari F, Mdkhana B, Al Heialy S, Alsafar HS, Hamoudi R, et al. Enhanced expression of immune checkpoint receptors during SARS-CoV-2 viral infection. Mol Ther Methods Clin Dev. (2021) 20:109–21. doi: 10.1016/j.omtm.2020.11.002
30. Arora S, Singh P, Dohare R, Jha R, Ali Syed M. Unravelling host-pathogen interactions: ceRNA network in SARS-CoV-2 infection (COVID-19). Gene. (2020) 762:145057. doi: 10.1016/j.gene.2020.145057
31. Vishnubalaji R, Shaath H, Alajez NM. Protein coding and long noncoding RNA (lncRNA) transcriptional landscape in SARS-CoV-2 infected bronchial epithelial cells highlight a role for interferon and inflammatory response. Genes (Basel). (2020) 11:760. doi: 10.3390/genes11070760
32. Shaath H, Vishnubalaji R, Elkord E, Alajez NM. Single-cell transcriptome analysis highlights a role for neutrophils and inflammatory macrophages in the pathogenesis of severe COVID-19. Cells. (2020) 9:2374. doi: 10.3390/cells9112374
33. Arisan ED, Uysal-Onganer P, Lange S. Putative roles for peptidylarginine deiminases in COVID-19. Int J Mol Sci. (2020) 21:4662. doi: 10.3390/ijms21134662
34. Klemm T, Ebert G, Calleja DJ, Allison CC, Richardson LW, Bernardini JP, et al. Mechanism and inhibition of the papain-like protease, PLpro, of SARS-CoV-2. EMBO J. (2020) 39:e106275. doi: 10.15252/embj.2020106275
35. Ge C, He Y. In silico prediction of molecular targets of astragaloside IV for alleviation of COVID-19 hyperinflammation by systems network pharmacology and bioinformatic gene expression analysis. Front Pharmacol. (2020) 11:556984. doi: 10.3389/fphar.2020.556984
36. Cheng LC, Kao TJ, Phan NN, Chiao CC, Yen MC, Chen CF, et al. Novel signaling pathways regulate SARS-CoV and SARS-CoV-2 infectious disease. Medicine (Baltimore). (2021) 100:e24321. doi: 10.1097/MD.0000000000024321
37. Le Tortorec A, Willey S, Neil SJ. Antiviral inhibition of enveloped virus release by tetherin/BST-2: action and counteraction. Viruses. (2011) 3:520–40. doi: 10.3390/v3050520
38. Kang JA, Jeon YJ. Emerging roles of USP18: from biology to pathophysiology. Int J Mol Sci. (2020) 21:6825. doi: 10.3390/ijms21186825
39. Kurachi M. CD8(+) T cell exhaustion. Semin Immunopathol. (2019) 41:327–37. doi: 10.1007/s00281-019-00744-5
40. Ruffo E, Wu RC, Bruno TC, Workman CJ, Vignali DAA. Lymphocyte-activation gene 3 (LAG3): the next immune checkpoint receptor. Semin Immunol. (2019) 42:101305. doi: 10.1016/j.smim.2019.101305
Keywords: COVID-19, feature selection, random forest classifier, gene expression markers, bioinformatics
Citation: Sun Y, Zhang Q, Yang Q, Yao M, Xu F and Chen W (2022) Screening of Gene Expression Markers for Corona Virus Disease 2019 Through Boruta_MCFS Feature Selection. Front. Public Health 10:901602. doi: 10.3389/fpubh.2022.901602
Received: 22 March 2022; Accepted: 17 May 2022;
Published: 22 June 2022.
Edited by:
Yuanpeng Zhang, Nantong University, ChinaReviewed by:
Zhang Zhenyu, First Affiliated Hospital of Jinzhou Medical University, ChinaDawen Guo, First Affiliated Hospital of Harbin Medical University, China
Qie Fan, People's Hospital of Guangxi Zhuang Autonomous Region, China
Copyright © 2022 Sun, Zhang, Yang, Yao, Xu and Chen. This is an open-access article distributed under the terms of the Creative Commons Attribution License (CC BY). The use, distribution or reproduction in other forums is permitted, provided the original author(s) and the copyright owner(s) are credited and that the original publication in this journal is cited, in accordance with accepted academic practice. No use, distribution or reproduction is permitted which does not comply with these terms.
*Correspondence: Wenyu Chen, MDAxMzUxMTZAemp4dS5lZHUuY24=
†These authors have contributed equally to this work