 Fahra Rajabali1*
 Kate Turcotte1
 Alex Zheng1Nick Pauls2Tony Nguyen2Evelyn Kalman2Vedrana Covic2
 Ian Pike1,3
- 1BC Injury Research and Prevention Unit, BC Children's Hospital, Vancouver, BC, Canada
- 2Public Safety and Police Services Unit, Policing and Security Branch, Ministry of Public Safety and Solicitor General, Victoria, BC, Canada
- 3Department of Pediatrics, University of British Columbia, Vancouver, BC, Canada
Introduction: This study aimed to quantify the total cost of violent firearm-related offenses in British Columbia in 2016 Canadian dollars over a five-year period, 2012 to 2016. The purposes of this study were to estimate the direct costs to the health care system and indirect costs to society for violent firearm injuries and deaths; and to estimate criminal justice system costs pertaining to firearm incidents.
Methods: Human and economic costs to the health care system and productivity losses were calculated using health administrative datasets such as B.C. Vital Statistics and Discharge Abstract Database. Criminal justice system costs pertaining to firearm incidents were estimated by applying weighted average costs to aggregate expenditures using methodology consistent with that used by Statistics Canada.
Results: There was a total of 108 deaths and 245 hospitalizations resulting from violent firearm injuries. The total estimated cost of all violent firearm crime averaged $294,378,985 per year; human costs averaged $188,416,841 per year, where health care costs averaged $3,910,317 per year, productivity losses from workforce and household averaged $17,299,054 and $4,559,470 per year, respectively, and loss of life averaged $162,648,000; and $105,021,145 in criminal justice system costs, and $941,000 in programming costs.
Conclusion: This study clearly demonstrates the significant cost of violent firearm injury in British Columbia and the impacts on the health care system, criminal justice system, and to society at large, particularly within the criminal justice system where the costs were significantly higher than health care.
Introduction
Firearms are a lethal means to homicide, suicide, and unintentional injuries, highlighting an important worldwide public health issue with social and economic costs that extend beyond life lost. Firearm injuries are a major concern in the United States (US), with assaults being the most common overall mechanism (1). Canada ranks 9 out of 36 peer Organization for Economic Co-operation and Development countries in firearm mortality rates (2). Nearly one-in-three homicides in Canada are firearm-related, reflecting a significant uptrend where shootings have consistently exceeded stabbings and beatings as the most common method of homicide (3, 4). The rate of firearm-related crime in Canada increased from 2018 to 2019 by 7% (5). Ontario, one of the major provinces in Canada, has estimated the occurrence of firearm-related injury to one per day (6). Firearm-related crime comprises a very small proportion (0.5%) of all violent crime in British Columbia (B.C.) (4), but is responsible for a disproportionate level of harm to individuals, families, and communities. Improved public safety for all British Columbians is one of the objectives of the government (7). To understand and identify the magnitude of investments toward public safety and crime prevention, it is important to quantify the dollar value and social impact of firearm violent crime.
The impact of firearm violent crime can be wide reaching and long lasting, requiring considerable societal resources to address the problem. Estimating the cost of firearm incidents is complicated and challenging, with the outcomes and consequences varying widely from case to case. Individuals, families, and communities bear hefty costs due to firearm injury, and these incidents have the potential to devastate lives, to incite fear, and to impose heavy social, psychological, and financial burden (8). In addition, health care costs such as physician, procedure, facility, radiology, and medication costs from firearm injury have shown to increase 3 to 20 times six-months post injury, indicating greater post injury care needs for physical therapy and rehabilitation (9). The highest rates of firearm homicide occur in the US (10), hence the many US-based studies that have quantified the financial burden of the treatment of firearm deaths (11), and injuries in hospitals and emergency departments (ED) (12–15). However, firearms control and firearms-related incidences in Canada is unlike the US. In Canada, one national study estimated the police cost per firearm incident for 8,885 police-reported incidents at $23,609, and the cost per victim for 9,469 firearm victims at $287,000 in 2008 (16). These estimates included personal costs and intangible costs, as well as third-party costs such as loss of affection/enjoyment to family members, social service operating costs, as well as costs to other persons harmed or threatened (16).
To our knowledge, this study is the first to estimate the total cost of violent firearm injury in B.C. This study aimed to quantify the total cost of violent firearm-related offenses in B.C., with the objectives to: i) estimate the direct human costs to the health care system (treatment and care), as well as indirect costs to society (productivity losses) for violent firearm injuries and deaths; and, ii) estimate criminal justice system costs related to firearm incidents. This study was undertaken with a societal, or population, perspective. It included costs that have an impact on society as a whole, including individuals, families, employers, and the government. The application of a societal perspective supports a public health viewpoint and supports policies aimed at minimizing losses or maximizing gains to society.
Methods
Firearm incidents, including those that result in injury or death, are reported by B.C. police forces as crimes against the person. Data for the five-year period January 1, 2012 to December 31, 2016, inclusive, were used to determine firearm-related incident information, associated injuries and deaths, and population statistics. These years were selected as 2016 was the most recent year with available hospitalization data at the time of this study, and five years of data were aggregated to allow for adequate case counts, and to “smooth” higher- and lower-than-average annual counts. Estimated average costs across the five-year period were applied to calculate costs in 2016 Canadian (CAN) dollars. All datasets used to calculate costs were not linked and therefore the incidents were not mutually exclusive and chances of double counting remain.
The categorization of firearm violent crime incident costs is illustrated in Figure 1.
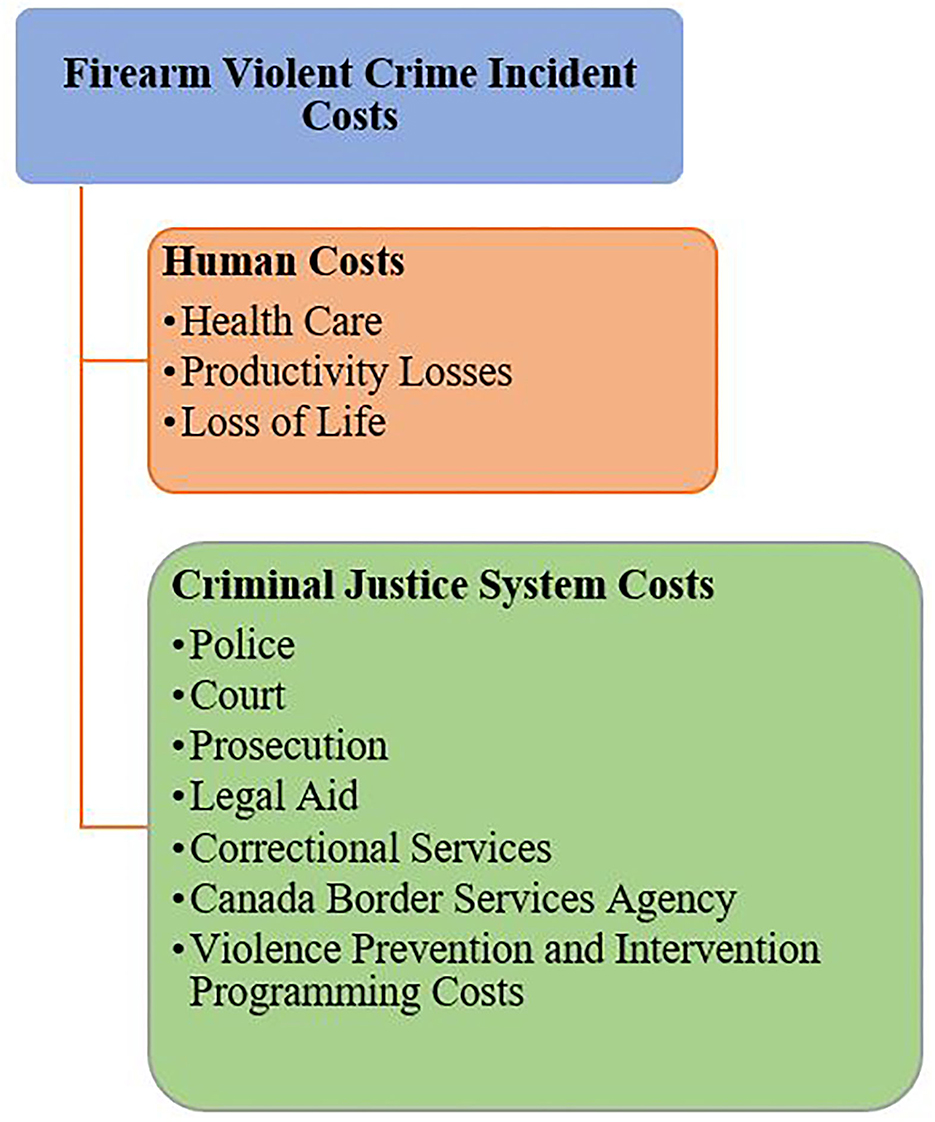
Figure 1. Categorization of firearm violent crime incident costs.
Human costs
Human costs were calculated using an incidence costing, human capital approach covering the lifetime of the injured individual. Human costs were primarily calculated using the ERAT—Electronic Resource Allocation Tool (17), a spreadsheet tool with the purpose to calculate the incidence costs of injury, which provides a classification and costing framework based on existing injury data and data available from the published injury costing literature (18) and/or credible sources, such as Statistics Canada and the Canadian Institute for Health Information. Data sources used to calculate human costs are listed in Table 1.
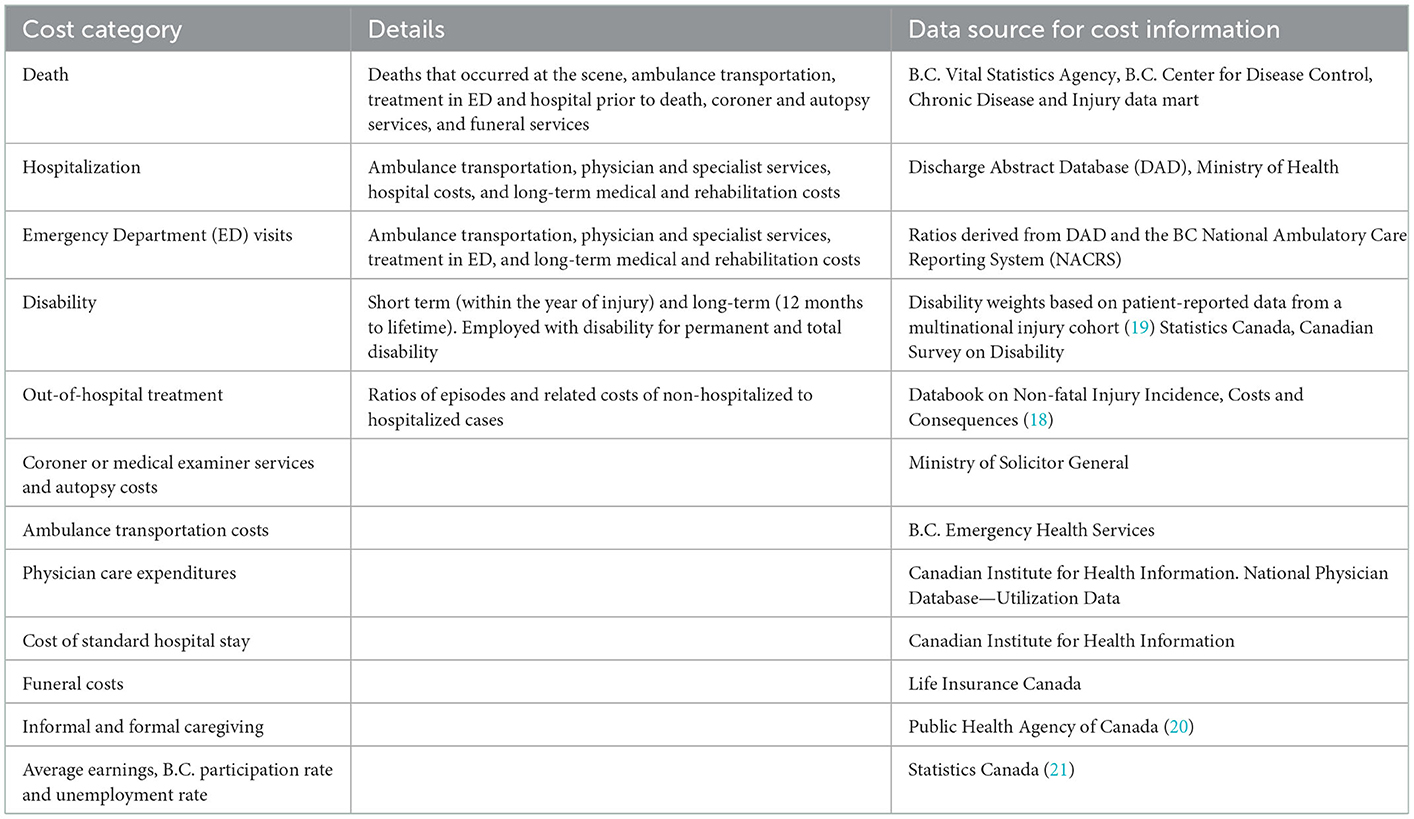
Table 1. Data sources for human costs.
Direct (health care) costs comprise all goods and services used for the diagnosis, treatment, and care of people experiencing injury. Indirect costs (productivity losses), derived using the human capital approach, represent the injured individual's inability to perform their normal activities of daily living and are defined as lost resources resulting from inability to work, premature death, and costs of informal care (22). For deaths, this is the forgone future income, and for morbidity, these are time away from work and years of disability resulting in forgone income, measured for permanent partial and permanent total disability. Permanent partial disability is one “from which partial recovery is anticipated, along with a return to some form of employment. Complete loss of earning power is expected prior to recovery, after which the worker is expected to return to employment with wages below preinjury wages” (18). Permanent total disability is “a condition equivalent to complete and permanent loss of earning power” (18). This approach was taken with the assumption that permanent total and partial disabilities apply for both work-related and other injuries (23).
Indirect costs are affected by age, the base year wage rate, the probability of participating in the labor market, and having participated, the probability of being employed, the real wage growth rate, and the discount rate. The value of time lost from work due to morbidity, disability, and premature death was measured using B.C. earnings data. Both direct and indirect costs were discounted to a present value in 2016 at 1.5% per annum (24). The effective annual discount rate affects all costs beyond the 1st year. These include all indirect costs associated with the loss of income, excluding the indirect costs of a hospital stay, which are assumed to occur in the current year, and includes the long-term direct costs associated with disability. Indirect costs reflect lost earning, discounted and adjusted for labor market participation and unemployment, of all future income over the relevant period within the working life of an individual from ages 15 to 64 years, inclusive. A real wage growth rate of 1% per year was assumed (17). The annual real wage growth rate affects future wage levels for the indirect costs.
Death and hospitalization data were extracted from the BC Vital Statistics and the Discharge Abstract Database (DAD), respectively (Table 1), using the 10th revision of the International Statistical Classification of Diseases and Related Health Problems, Canadian Adaptation (ICD-10 CA), codes for homicide, injuries inflicted by another person with intent to injure or kill, those due to legal intervention, and those that are undetermined. The codes included were, X93–X95: assault by handgun, rifle, shotgun, and larger firearm discharge, as well as other and unspecified discharge; Y22–Y24: handgun, rifle, shotgun, and larger firearm discharge, as well as other and unspecified discharge with undetermined intent; Y35: legal intervention involving firearm discharge (with machine gun, revolver, fire pellet, or rubber bullet). In-hospital deaths were excluded from the total hospital count and included in the calculation of the costs of firearm deaths. Similarly, ED costs were excluded from the hospitalization costs to avoid double counting. The BC National Ambulatory Care Reporting System (NACRS) data, source for ED visit data, do not include the external cause nor mechanism of injury, and are underreported and incomplete. To obtain an estimate of the ED visits, a ratio of ED visits to hospitalizations for firearm injury was applied using the ratio from the health region that had all its hospitals reporting to NACRS as a reference (25). US ratios were used to calculate direct morbidity costs for out-of-hospital episodes and related costs of non-hospitalized to hospitalized cases, which were assumed to be similar for B.C. (18).
The incidence of deaths, hospitalizations, ED visits, and disability; values for population and length of stay; resource intensity weights for resources allocated to the hospital stay; the average cost of hospital stay; and the unemployment rate, participation rate, and average weekly earnings were all entered into ERAT to obtain the corresponding direct and indirect costs. As the physician costs and ambulance costs for hospitalizations and ED visits were not included, they were appended to the hospitalization and ED costs derived from ERAT.
Direct death costs were estimated on a complete episode of events due to a firearm death. These events range from costs incurred as a result of deaths occurring at the scene, ambulance transportation costs, treatment occurring in the ED and hospital prior to the death, coroner and autopsy costs, and funeral costs. As ERAT only included indirect death costs, total death costs were calculated by appending direct death costs to the indirect death costs from ERAT.
Unpaid labor includes caregiving, volunteer work, household activities, or any other activity that occurs outside of the standard labor market. ERAT only included estimates of production losses of paid work as a result of morbidity and premature death. The value of lost production was estimated for the working-age population comprising individuals aged 15–64 years. For this study, it was assumed that all individuals contribute to society. Caregiving, defined as care received by the injured individual within the year of injury and the main condition for which the injured individual sought help, can be classified as either a direct cost or an indirect cost depending on whether a formal, or direct, payment was made (20). Informal caregiving provided by family, friends, and neighbors are considered indirect costs, and formal caregiving provided by paid workers and organizations are considered direct costs. The 0.02% of formal and 0.47% of informal caregiving for injury was applied to the direct and indirect costs (20). Primarily based on Canada's 2009 General Social Survey, Zhang and Qin found that the ratio of household work lost to wage work lost by victims of violence was 0.35855 for women and 0.24472 for men (16). For gunshot victims under age 65, those ratios were applied to the earnings losses to estimate the household work losses. Gunshot victims over age 65 were assumed to lose the same amount of household work per year as younger victims.
There is significant quality of life lost due to deaths, or a Value of a Statistical Life (VSL), the additional cost that individuals would be willing to bear for improvements in health and safety. As recommended by the Government of Canada, VSL was calculated for violent firearm deaths by applying an average VSL value of $6.5 million in 2007 Canadian dollars, converted using the Statistics Canada consumer price index (26, 27), which is equivalent to $7.53 million in 2016 Canadian dollars. It should be noted that the VSL is not fixed, as individuals' risk-money trade-offs vary across the population and over time as age and economic circumstances of the individual changes.
Vision care and prescription drug expenditures outside of hospital care were excluded as data were not available. Previous studies included personal costs, such as economic dependence and social isolation; intangible costs, such as pain and suffering; and third-party costs such as loss of affection to, or enjoyment of, family members, as well as social services operating costs (16). The current study did not include these costs due to a lack of available data. These study methods therefore represent a conservative approach and are considered to be an underestimate of the true costs related to violent firearm incidents in B.C.
Criminal justice system costs
Criminal justice system costs were estimated by applying weighted average costs to aggregate expenditures using methodology consistent with that used by Zhang and Qin and Statistics Canada (16, 28). Data calculations for criminal justice system costs are outlined in Table 2 (descriptions and data sources available in Supplementary material). Further information on the methodology applied can be obtained from Zhang and Qin (16) or Statistics Canada (28).
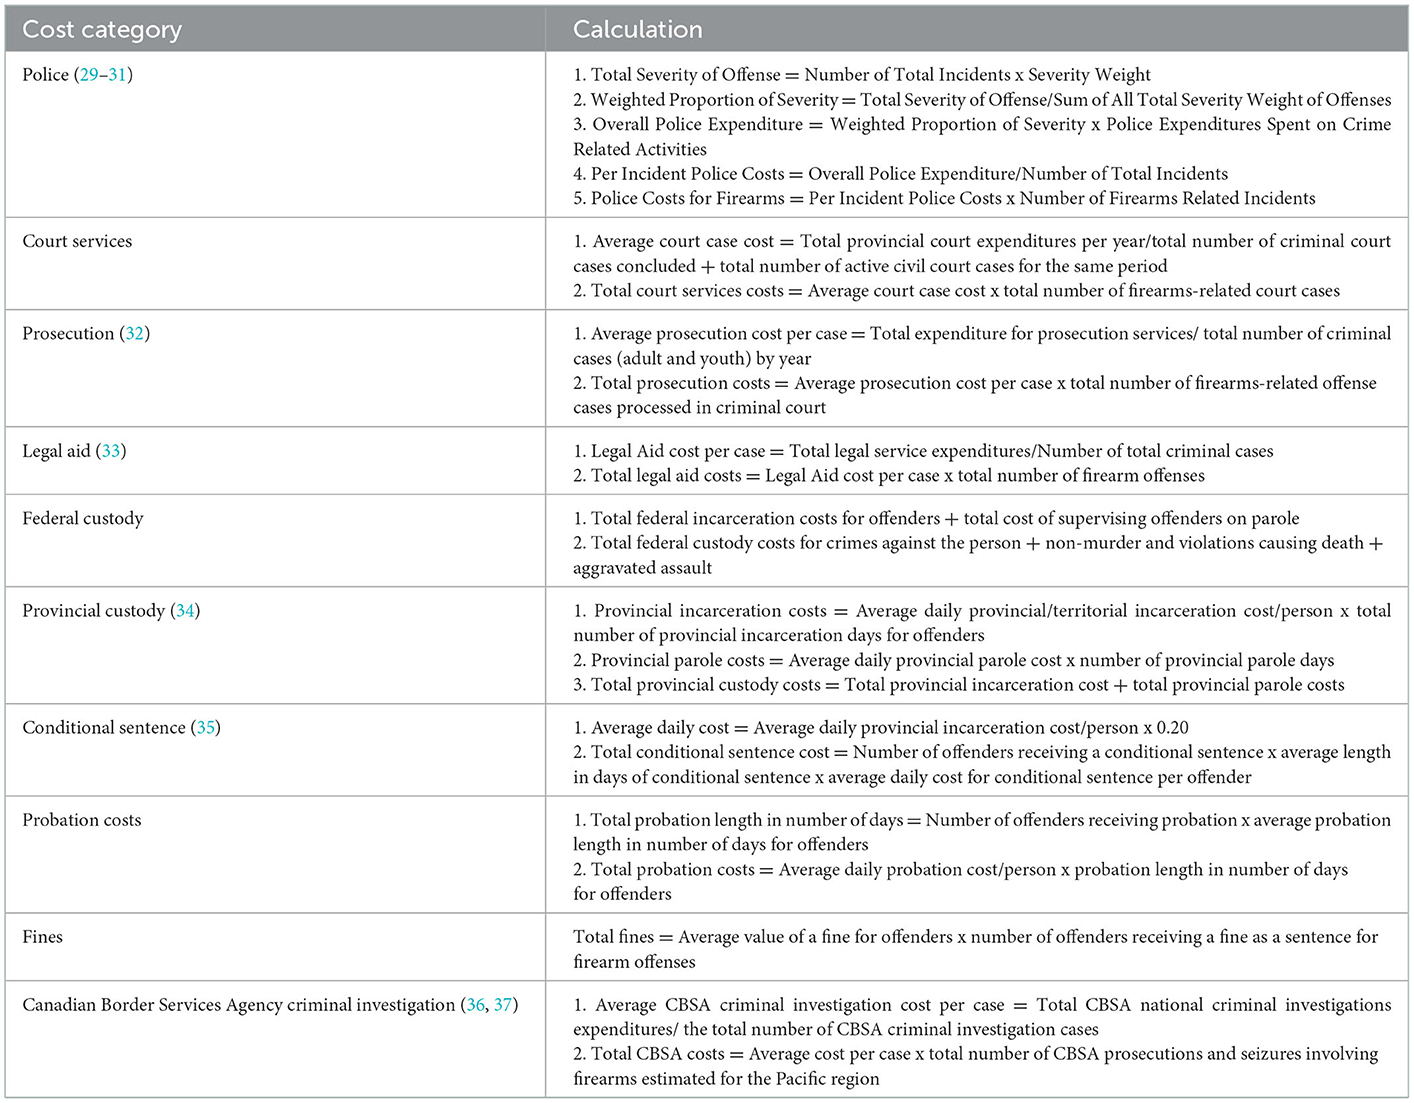
Table 2. Data calculations for criminal justice system costs.
Police and court costs were calculated using aggregate costs available from federal government official sources (Table 2, Supplementary material), however, the cost per crime was not always available. The cost also varied considerably according to the seriousness of each incident. This difficulty also applied when estimating the costs of prosecution and legal aid. While the aggregate expenditures on criminal matters were available, there was no information to indicate the actual number of cases of firearm-related crimes that involved prosecution and/or legal aid, or the associated cost per case.
In estimating the police costs for firearm incidents reported to police as crimes against the person, total costs of police expenditures were assigned to the various crimes according to their severity weights using methodology developed by Statistics Canada (28), with serious crimes assigned higher weights (Table 2, Supplementary material). Average costs per case were estimated for court, prosecution, and legal aid. With respect to correctional service costs, the average daily cost of provincial and federal incarceration was applied, and this average cost did not vary dramatically by offense type (Table 2, Supplementary material).
Violence prevention and intervention programming costs were internally retrieved from the B.C. Ministry of Public Safety and Solicitor General.
For the purposes of this study, violent crime included all person-related offenses processed within the judicial system that may or may not have resulted in injury. Incidents classified as undetermined were included with violent crime.
Human, criminal, and justice costs, and violence prevention and intervention programming costs were summed to obtain the total firearm violent crime costs.
Data limitations
The data sources used in this study are largely reliant on existing administrative data, where the quality of the data is reliant on the expertise of professional data coders and thus may exhibit inherent biases and inaccuracies. Injuries treated in doctor's offices or walk-in clinics are not accounted for as data were unavailable. There is a large data gap for hospitalized injuries requiring ongoing care outside of the hospital setting, ranging from short periods to long-term permanent disability.
Unpaid labor was not included, such as volunteer work, or any other activity that is outside of the standard labor market. Indirect costs did not include transfer payments made by government or social services, as they are a reallocation of resources and the net effect of the transfer to society is zero. Furthermore, indirect costs for those aged 65 years and over were not included under the assumption that 65 is the age at which people stop working. This approach is not reflective of the continuing participation of older adults in the workforce, where the proportion of adults aged 65 and over continues to grow. The human capital approach uses lost past and future earnings and household work as a lower bound on the value of a human life. Because of labor market distortions and this article's omission of earnings after age 64, it undervalues women and minorities and places minimal value on the injury and death of people age 65 and older.
The violence prevention and intervention programming costs were restricted to costs internally retrieved from the B.C. Ministry of Public Safety and Solicitor General and are not a comprehensive picture of the existing firearms programming landscape. City-funded programs or funding from other ministries or branches of government were not included.
Results
There was a total of 108 deaths and 245 hospitalizations resulting from violent firearm injuries in B.C. between 2012 and 2016. The incidence counts for injuries, deaths, offense cases, and offenders during this time period are presented in Table 3. The costs of firearm injuries and deaths in B.C. are detailed in Tables 4, 5.
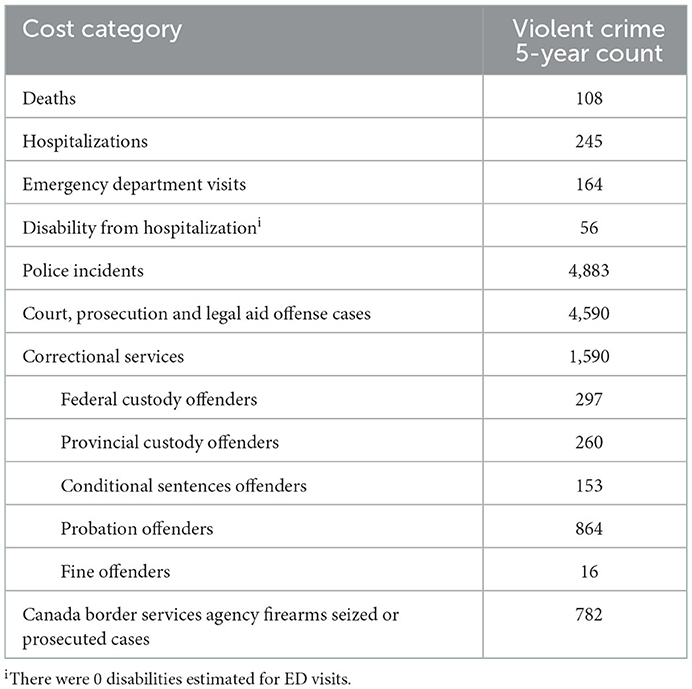
Table 3. Incidence of firearm violent crime deaths, injuries, offense cases, and offenders, B.C. 2012–2016.
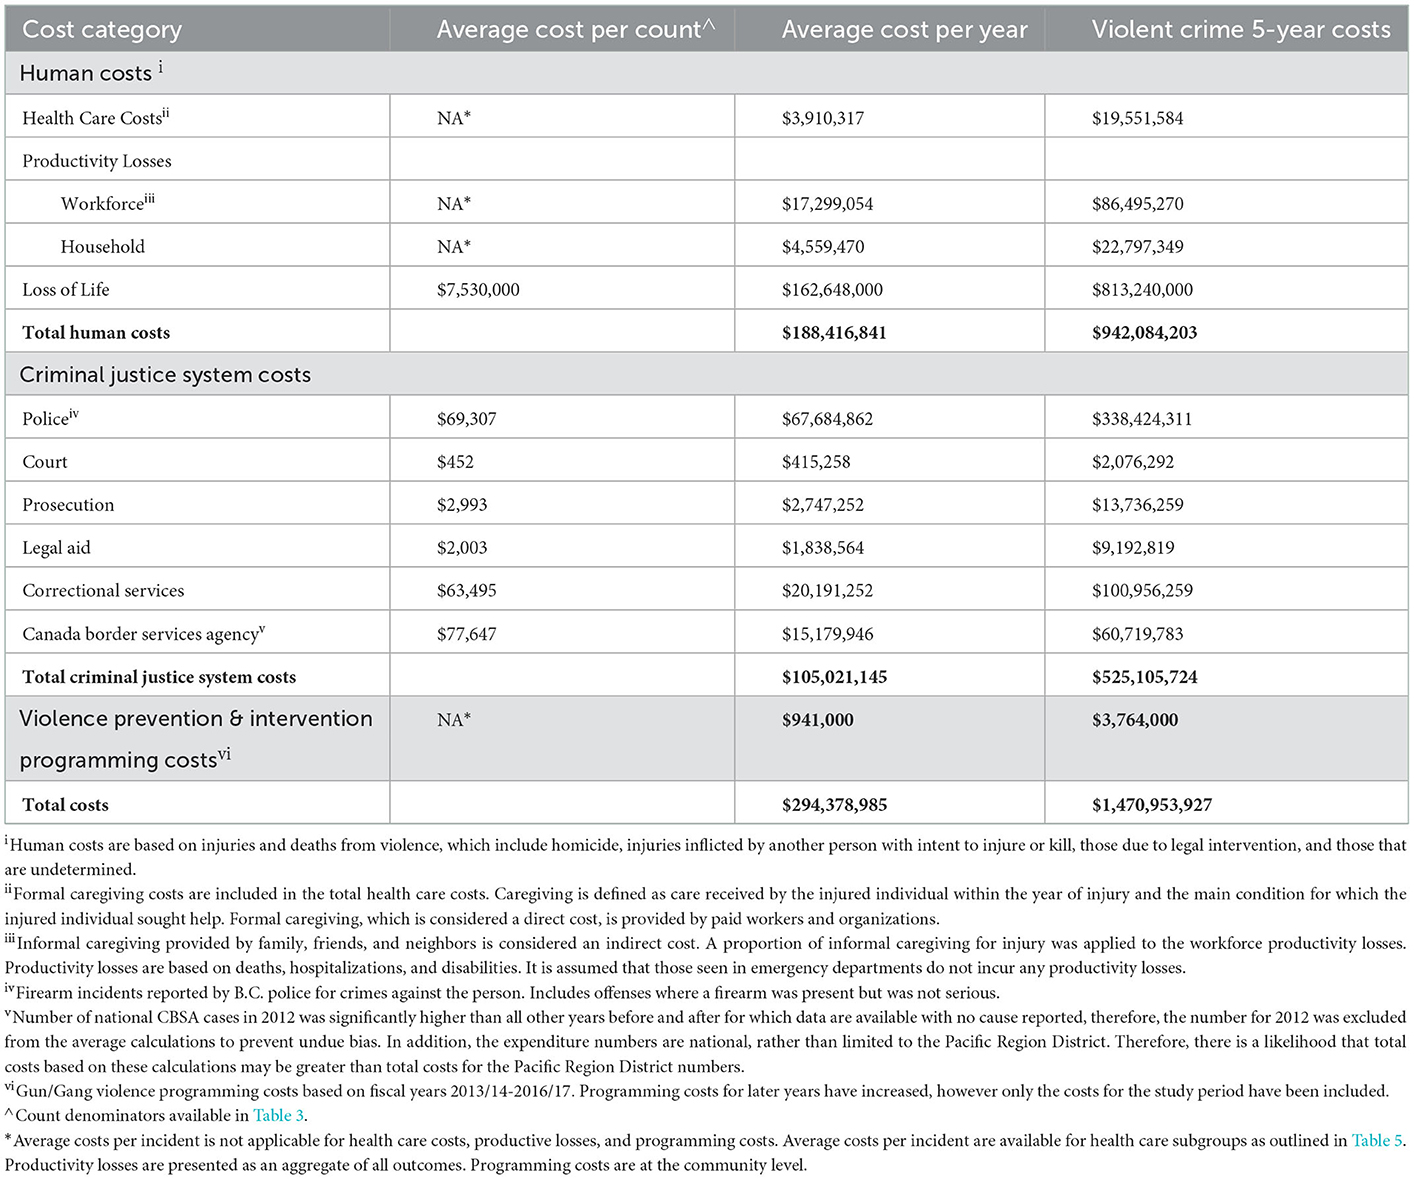
Table 4. Overall average and total costs for firearm violent crime in 2016 CAN Dollars, B.C. 2012–2016.
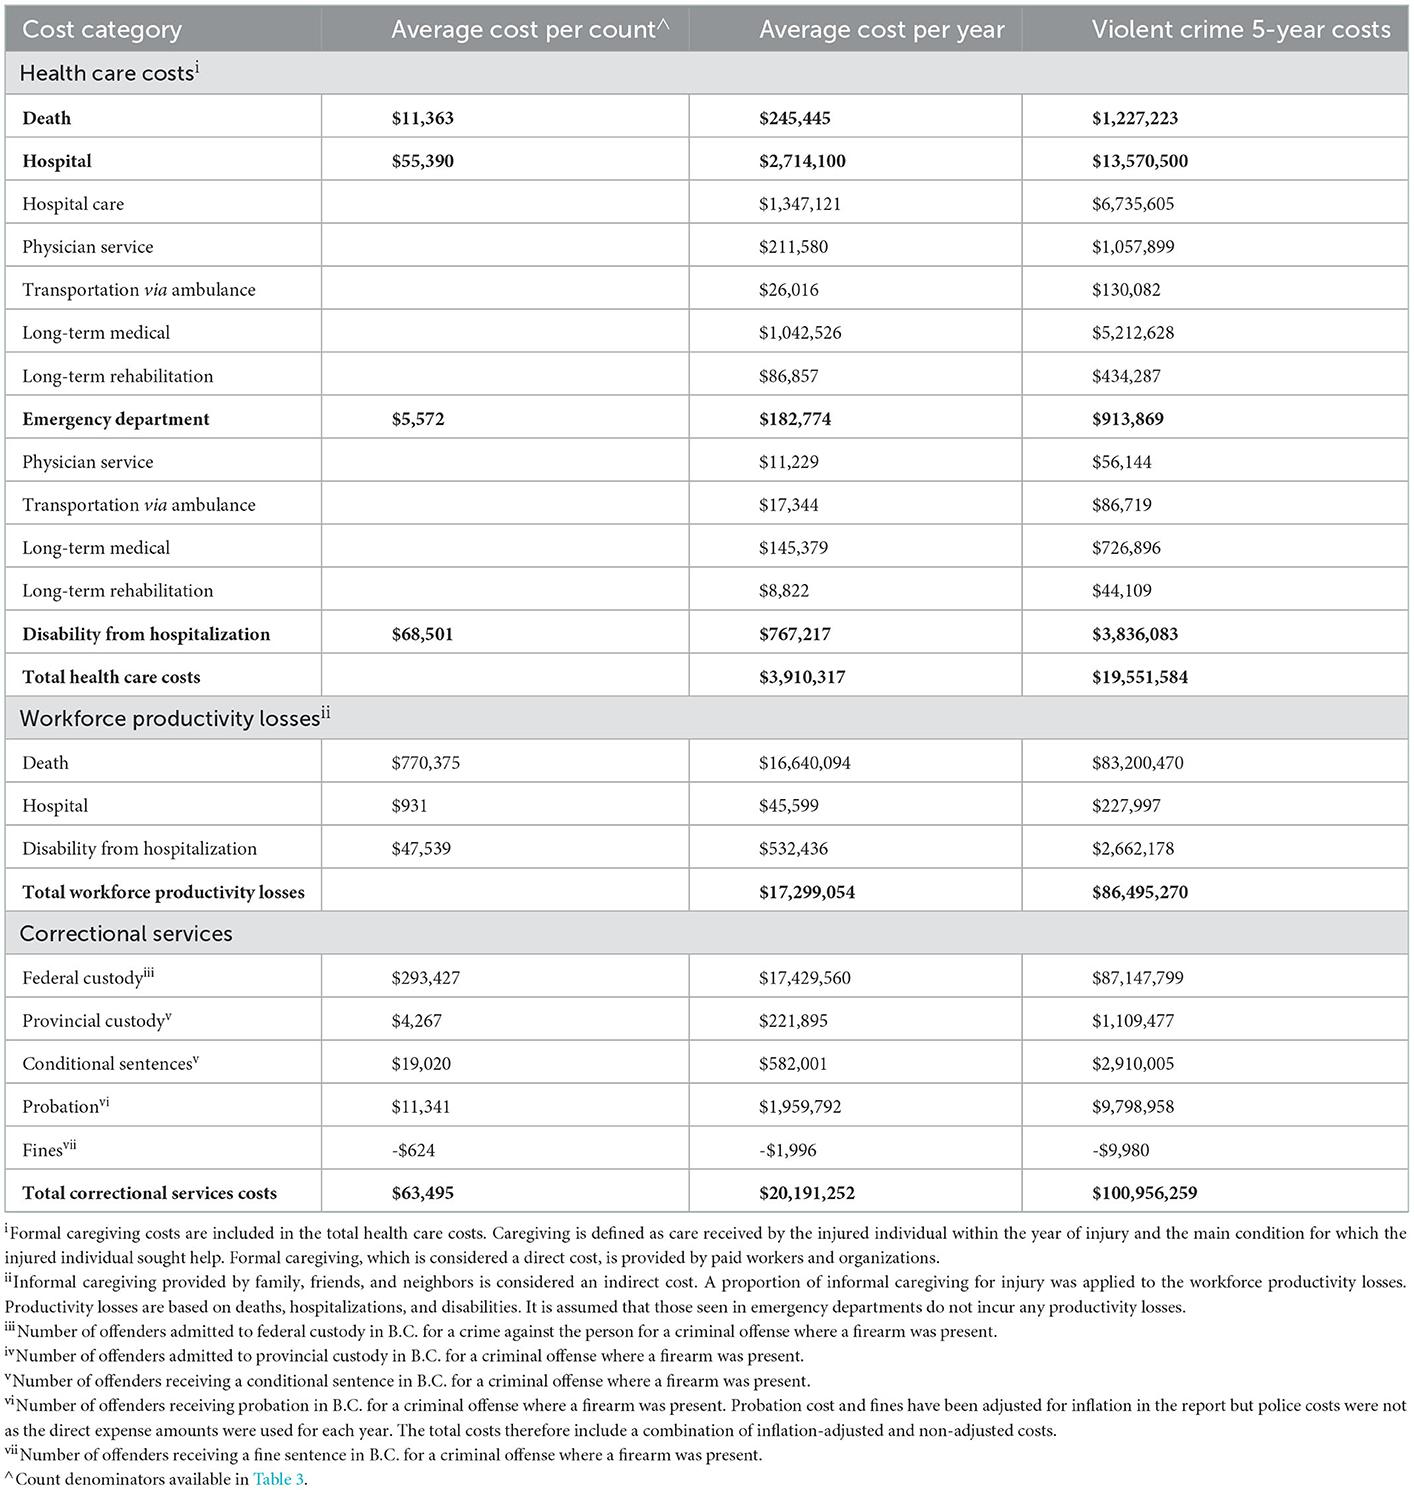
Table 5. Breakdown of average and total costs for health care, productivity losses and correctional services in 2016 CAN Dollars, B.C. 2012–2016.
The total estimated cost of all violent firearm injuries and deaths averaged $294,378,985 per year, with a per capita cost of $67 for an average population of 4,404,917; human costs averaged $188,416,841 per year, where health care costs averaged $3,910,317 per year, productivity losses from workforce and household averaged $17,299,054 and $4,559,470 per year, respectively, and loss of life averaged $162,648,000 (Table 4). Hospitalization costs were highest within health care, accounting 69% of health care costs and averaging $2,714,100 per year (Table 5). Criminal justice system costs averaged $105,021,145 per year; policing costs comprised of 64% of the total criminal justice system costs and averaged $67,684,862 per year (Table 4). The cost of firearm violent crime in B.C. per police incident was $301,309, based on an average of 977 incidents per year between 2012 and 2016.
Discussion
This study clearly demonstrates the significant cost of firearm injury in B.C. and the impacts on the health care and criminal justice systems, and to society at large. This is particularly noted within the criminal justice system, where costs were significantly higher than within the health care system. These conservative1 estimates indicate that firearms not only pose a threat to public safety, but also a threat to public resources and the broader B.C. economy. The consequences of violent firearm injuries resulted in average costs to society of over $294 million per year, underscoring the value to individuals, families, and society of efforts to prevent firearm violent crime.
There have been a number of studies conducted in other jurisdictions that have identified the costs of firearm injuries (14, 15, 38–43), most of which were conducted in the US and focused primarily on health care costs such as hospitalization and medical costs (14, 38, 40, 41, 43). By comparison, there are a very limited number of firearm injury cost studies that have been conducted in Canada (16, 39). Zhang and Qin (16) investigated the economic and social impacts of firearm crime in Canada and reported total costs of over $3.1 billion per year with a per capita cost of $93. Approximately 80% of these costs were attributed to intangible and third-party costs. Including the costs that were similar to those in our study, the per capita cost in the Canadian study is $63, when the increased costs due to inflation are considered, which is close to our study finding of $67, indicating that firearm-related costs in B.C. are similar to the rest of Canada.
Similar to the findings of Zhang and Qin (16), who reported that $302 million in criminal justice system costs were accounted for by policing services costs (69.5%), corrections (29.7%), courts and prosecution (0.6%), and legal aid (0.2%), this study determined that these proportionate expenditures were 64% for policing services, 19% corrections, 3% courts and prosecution, and 1.8% legal aid costs. In an earlier study by Miller and Cohen (39), the total cost of gunshot wounds in Canada was estimated to be $6.6 billion per year ($235 per capita), including costs for medical care, mental health services, police investigations, productivity losses, funeral expenses, pain and suffering, as well as lost quality of life.
Effective action to prevent firearm incidents can alleviate the human and economic costs that British Columbians currently bear. The B.C. government is addressing firearm violence through a new firearm violence prevention act that was received in 2021 and is anticipated to be regulated in 2022 (44). This act is targeted to regulate the use of firearms, establish new offenses for the unsafe use of firearms as well as prohibit use of firearms in designated places. It is known that with deliberate investment and intervention, rates of firearm violence can decrease. However, these investments must be supported by evidence and closely monitored to ensure anticipated impacts are achieved. The firearm environment is fluid and fast-changing. Initiatives aimed at preventing or mitigating firearm injury must be equally malleable. By ensuring appropriate oversight to these investments and assessing their impacts through research findings provided by this study and others, stakeholders will be better situated to respond to emerging threats in a coordinated and effective manner. These efforts, working together with other broad reaching social support programs (e.g., mental health, housing, food security, income support), have the potential to produce a positive return on investment for society, and more importantly, to save lives (45).
In specifying the multiple cost centers related to firearm injury and death in B.C., this study highlights the scope of opportunities available to policy makers and government for investment in prevention programs to reduce the rate of the firearm injuries and deaths, and decrease costs. Previous research indicates that almost all injuries and injury-related deaths can be prevented (46), and investment in evidence-based prevention policies, programs and initiatives makes a difference. Other primary injury prevention programming has demonstrated significant average return on investment, ranging between $15 and $64 for each dollar invested in initiatives such as the implementation of poison control centers to bicycle helmets and child safety seats (47).
While the prevention of firearm violence may represent a wicked problem—a social/cultural issue difficult to solve—(48), prevention programs are demonstrating success. Cure Violence Global, originated in Chicago, is addressing the issue across the US and in 15 other countries via strong community partnerships, collaboration with public health and health care systems, and an approach encompassing three core and two implementing components (49). It has produced dramatic results: 56% reduction in killings in Baltimore; 63% reduction in shootings in the South Bronx; and 100% reduction in retaliatory homicides in five of eight Chicago communities. According to Cure Violence Global program calculations, the program is not only saving lives, it is also reducing medical and criminal costs by nearly $16 for each dollar invested (49). The Federal Government of Canada is addressing firearm violence through strengthened firearm laws, including licensing, enhanced record keeping, expanded background checks, and authorization for transportation (50). It is also working to limit access to assault-style firearms, prevent firearms from being smuggled into Canada via the Canadian Border Services Agency, and is addressing firearm and gang violence at the provincial/territorial level.
Conclusions
As the complexity of policing and public health issues increases over time, it is anticipated that the costs associated with firearm injury will continue to rise in parallel. Police and emergency responders continue to experience heightened demands for service and are often inadequately equipped or resourced to respond to these demands. This is particularly evident for cases that require significant investigative resources, man hours, and specialized expertise. In order to effectively respond to and prevent these incidents, it is critical that initiatives to combat firearm violence and injury are appropriately funded, and grounded in evidence-based approaches.
Data availability statement
The original contributions presented in the study are included in the article/Supplementary material, further inquiries can be directed to the corresponding author.
Author contributions
Conceptualization: VC. Data curation: FR, TN, and EK. Writing—original draft preparation and visualization: FR. Writing—review and editing: FR, KT, AZ, NP, TN, EK, VC, and IP. Supervision: IP. All authors have read and agreed to the published version of the manuscript.
Conflict of interest
The authors declare that the research was conducted in the absence of any commercial or financial relationships that could be construed as a potential conflict of interest.
Publisher's note
All claims expressed in this article are solely those of the authors and do not necessarily represent those of their affiliated organizations, or those of the publisher, the editors and the reviewers. Any product that may be evaluated in this article, or claim that may be made by its manufacturer, is not guaranteed or endorsed by the publisher.
Supplementary material
The Supplementary Material for this article can be found online at: https://www.frontiersin.org/articles/10.3389/fpubh.2022.938091/full#supplementary-material
Footnotes
1. ^Estimates do not include numerous intangible costs associated with firearm injury.
References
1. Kaufman EJ, Wiebe DJ, Xiong RA, Morrison CN, Seamon MJ, Delgado MK. Epidemiologic trends in fatal and non-fatal firearm injuries in the US, 2009–2017. JAMA Intern Med. (2021) 181:237–44. doi: 10.1001/jamainternmed.2020.6696
2. Naghavi M, Marczak LB, Kutz M, Shackelford KA, Arora M, Miller-Petrie M, et al. Global mortality from firearms, 1990–2016. JAMA. (2018) 320:792–814. doi: 10.1000/jama.2018.10060
3. Number of homicide victims, by method used to commit the homicide. Table 35-10-0069-01 Statistics Canada. Available online at: https://www150.statcan.gc.ca/t1/tbl1/en/tv.action?pid=3510006901 (accessed April 9, 2021).
4. Crime statistics in British Columbia. Ministry of Public Safety Solicitor General. (2019). Available online at: https://www2.gov.bc.ca/assets/gov/law-crime-and-justice/criminal-justice/police/publications/statistics/bc-crime-statistics-2020.pdf (accessed January 3, 2023).
5. Police reported crime for selected offences, Canada 2018 and 2019. Statistics Canada, Canadian Centre for Justice and Community Safety Statistics, Uniform Crime Reporting Survey. Available online at: https://www150.statcan.gc.ca/n1/pub/85-002-x/2020001/article/00010/tbl/tbl01-eng.htm (accessed March 10, 2022).
6. Gomez D, Saunders N, Greene B, Santiago R, Ahmed N, Baxter NN. Firearm-related injuries and deaths in Ontario, Canada, 2002–2016: a population-based study. CMAJ Oct. (2020) 192:E1253–63. doi: 10.1503/cmaj.200722
7. Ministry of Public Safety and Solicitor General (2020). 2020/21–2022/23 Service Plan, February 2020. Available online at: https://www2.gov.bc.ca/assets/gov/government/ministries-organizations/ministries/attorney-general-and-public-safety-solicitor-general/ag_pssg_sp_2020.pdf (accessed March 2, 2021).
8. Forum on Global Violence Prevention; Board on Global Health; Institute of Medicine; National Research Council. Social and Economic Costs of Violence: Workshop Summary. Washington (DC): National Academies Press (US) (2011).
9. Ranney ML, Herges C, Metcalfe L, Schuur JD, Hain P, Rowhani-Rahbar A. Increases in actual health care costs and claims after firearm injury. Ann Internal Med. (2020) 173:949–55. doi: 10.7326/M20-0323
10. Grinshteyn E, Hemenway D. Violent death rates in the US compared to those of the other high-income countries, 2015. Prevent Med. (2019) 123:20–6. doi: 10.1016/j.ypmed.2019.02.026
11. Lemaire J. The cost of firearm deaths in the United States: reduced life expectancies and increased insurance costs. J Risk Insurance. (2005) 72:359–74. doi: 10.1111/j.1539-6975.2005.00128.x
12. Kalesan B, Siracuse JJ, Cook A, Prosperi M, Fagan J, Galea S. Prevalence and hospital charges from firearm injuries treated in US emergency departments from 2006 to 2016. Surgery. (2021) 169:1188–98. doi: 10.1016/j.surg.2020.11.009
13. Spitzer SA, Vail D, Tennakoon L, Rajasingh C, Spain DA, Weiser TG. Readmission risk and costs of firearm injuries in the United States, 2010–2015. PLoS ONE. (2019) 14:e0209896. doi: 10.1371/journal.pone.0209896
14. Spitzer SA, Staudenmayer KL, Tennakoon L, Spain DA, Weiser TG. Costs and financial burden of initial hospitalizations for firearm injuries in the United States, 2006–2014. Am J Public Health. (2017) 107:770–4. doi: 10.2105/AJPH.2017.303684
15. Lee J, Quraishi SA, Bhatnagar S, Zafonte RD, Masiakos PT. The economic cost of firearm-related injuries in the United States from 2006 to 2010. Surgery. (2014) 155:894–8. doi: 10.1016/j.surg.2014.02.011
16. Zhang T, Qin Y. The Economic Impact of Firearm-related Crime in Canada, 2008. Department of Justice Canada. (2012). Available online at: https://www.justice.gc.ca/eng/rp-pr/csj-sjc/crime/rr13_7/rr13_7.pdf (accessed March 2, 2021).
17. Parachute. The Cost of Injury in Canada 2021. Parachute: Toronto, ON. Available online at: https://parachute.ca/en/professional-resource/cost-of-injury-in-canada/ (accessed March 10, 2022).
18. Miller T, Pindus N, Douglass J, Rossman S. Databook on Non-fatal Injury Incidence, Costs and Consequences. Washington, DC: The Urban Institute Press (1995).
19. Gabbe BJ, Lyons RA, Simpson PM, Rivara FP, Ameratunga S, Polinder S, Derrett S, Harrison JE. Disability weights based on patient-reported data from a multinational injury cohort. Bull World Health Organiz. (2016) 94:806–816C. doi: 10.2471/BLT.16.172155
20. Public Health Agency of Canada. Economic Burden of Illness in Canada. (2010). Available online at: https://www.canada.ca/en/public-health/services/publications/science-research-data/economic-burden-illness-canada-2010.html (accessed March 10, 2022).
21. Labour force characteristics by sex and detailed age group and average weekly earnings by industry Statistics Canada. Available online at: https://www150.statcan.gc.ca/t1/tbl1/en/tv.action?pid=1410002301 (accessed March 10, 2022).
22. Drummond MF, Sculpher MJ, Claxton K, Stoddart GL, Torrance GW. Methods for the economic evaluation of health care programmes. 4th ed. Oxford: Oxford University Press. (2015).
23. Finkelstein EA, Corso PS, Miller TR. The Incidence and Economic Burden of Injuries in the United States. Oxford: Oxford University Press. (2006). doi: 10.1093/acprof:oso/9780195179484.001.0001
24. Guidelines for the Economic Evaluation of Health Technologies: Canada 4th Edition. Ottawa. (2017). Available online at: https://www.cadth.ca/sites/default/files/pdf/guidelines_for_the_economic_evaluation_of_health_technologies_canada_4th_ed.pdf (accessed March 10, 2022).
25. Pawer S, Rajabali F, Zheng A, Pike I, Purssell R, Zargaran A, Babul S. Socioeconomic factors and substances involved in poisoning-related emergency department visits in British Columbia, Canada. Health Promot Chronic Dis Prev Can. (2021) 41:211–21. doi: 10.24095/hpcdp.41.7/8.02
26. Canada's Cost-Benefit Analysis Guide for Regulatory Proposals Government Government of Canada. Available online at: https://www.canada.ca/en/government/system/laws/developing-improving-federal-regulations/requirements-developing-managing-reviewing-regulations/guidelines-tools/cost-benefit-analysis-guide-regulatory-proposals.html (accessed November 15, 2022).
27. Chestnut LG, De Civita P. Economic Valuation of Mortality Risk Reduction: Review and Recommendations for Policy and Regulatory Analysis. Ottawa: Policy Research Initiative. (2009).
28. The Economic Impact of Firearm-related Crime in Canada 2008 Statistics Canada. Available online at: https://www.justice.gc.ca/eng/rp-pr/csj-sjc/crime/rr13_7/a.html#seca1 (accessed March 1, 2022).
29. Zhang T, Hoddenbagh J, McDonald S, Scrim K. An Estimation of the Economic Impact of Spousal Violence in Canada, 2009. Department of Justice Canada. (2012). Available online at: https://www.justice.gc.ca/eng/rp-pr/cj-jp/fv-vf/rr12_7/rr12_7.pdf. (accessed April 1, 2021).
30. Uniform crime-reporting incident-based survey: User manual 2013 Canadian Centre for Justice Statistics Statistics Canada.
31. Police resources in Canada, Statistics, Canada. (2013–2017). Available online at: https://www150.statcan.gc.ca/n1/pub/85-002-x/2014001/article/11914/tbl/tbl12-eng.htm (accessed January 3, 2022).
32. Attorney general annual report (2013–2017). Ministry of Attorney General, Government of B.C. Available online at: https://www2.gov.bc.ca/gov/content/governments/organizational-structure/ministries-organizations/ministries/justice-attorney-general/annual-report (accessed February 15, 2022).
33. Annual service plan report (2011/2012-2014/2015) Legal Aid BC. Available online at: https://legalaid.bc.ca/about/annualReports (accessed November 21, 2021).
34. Parole Board of Canada. (2012/2013-2016/2017). Performance Monitoring Report. Government of Canada.
35. The John Howard Society of Ontario, Fact Sheet, Reconsidering Community Corrections in Ontario. January 1997. Available online: https://johnhoward.on.ca/wp-content/uploads/2014/09/facts-9-reconsidering-community-corrections-in-ontario-january-1997.pdf (accessed November 21, 2021).
36. Departmental Performance Reports (2012/2013-2016/2017) Canada Border Services Agency Government Government of Canada. Available online at: https://www.cbsa-asfc.gc.ca/agency-agence/reports-rapports/menu-eng.html (accessed November 21, 2021).
37. An evaluation of the Criminal Investigations Program 2015—Archived. Canada Border Services Agency, Government of Canada. Available online at: https://www.cbsa-asfc.gc.ca/agency-agence/reports-rapports/ae-ve/2015/cip-pec-eng.html (accessed November 21, 2021).
38. Ordog GJ, Wasserberger J, Ackroyd G. Hospital costs of firearm injuries. J Trauma. (1995) 38:291–8. doi: 10.1097/00005373-199502000-00029
39. Miller TR, Cohen MA. Costs of gunshot and cut/stab wounds in the United States, with some Canadian comparisons. Accident Anal Prevent. (1997) 3:329–41. doi: 10.1016/S0001-4575(97)00007-9
40. Cook PJ, Lawrence BA, Ludwig J, Miller TR. The medical costs of gunshot injuries in the United States. JAMA. (1999) 282:447–54. doi: 10.1001/jama.282.5.447
41. Allard D, Burch VC. The cost of treating serious abdominal firearm related injuries in South Africa. South African Med J. (2005) 95:591–4.
42. Scott WG, Scott HM. The economic costs of firearms accidents in New Zealand. Int Rev Business. (2006) 2:47–59.
43. Peek-Asa C, Butcher B, Cavanaugh JE. Cost of hospitalization for firearm injuries by firearm type, intent, and payer in the United States. Injury Epidemiol. (2017) 4:20. doi: 10.1186/s40621-017-0120-0
44. Firearm Violence Prevention Act Government Government of British Columbia. Available online at: https://www.bclaws.gov.bc.ca/civix/document/id/bills/billsprevious/1st42nd:gov04-3 (accessed March 6, 2022).
45. Christeson W, Newman S. Caught in the Crossfire: Arresting Gang Violence by Investing in Kids. Washington, DC: Research Report from Fight Crime: Invest in Kids. (2004).
46. Doll L, Bonzo S, Mercy JA, Sleet DA. Handbook of Injury and Violence Prevention. New York: Springer. (2007). doi: 10.1007/b136518
47. Injury Injury prevention: what works? A summary of cost-outcome analysis for injury prevention programs (2022 update) Children's Safety Network. Available online at: https://www.childrenssafetynetwork.org/sites/default/files/InjuryPrevention-WhatWorks.pdf (accessed September 21, 2022).
48. Australian Public Service Commission. Tackling Wicked Problems: A Public Policy Perspective. (2007).
49. Cure Violence Global. Available online at: www.cvg.org & https://cvg.org/wp-content/uploads/2019/12/2019.12.12-Cure-Violence-Criteria.pdf (accessed March 6, 2022).
50. Taking action to reduce gun violence. Government of Canada. Available online at: https://www.canada.ca/en/public-safety-canada/campaigns/firearms.html?utm_campaign=not-applicable&utm_medium=vanity-url&utm_source=canada-ca_firearms (accessed March 6, 2022).
Keywords: firearm injury, costs, criminal justice system costs, health care costs, violent crime
Citation: Rajabali F, Turcotte K, Zheng A, Pauls N, Nguyen T, Kalman E, Covic V and Pike I (2023) The cost of firearm violent crime in British Columbia, Canada. Front. Public Health 10:938091. doi: 10.3389/fpubh.2022.938091
Received: 06 July 2022; Accepted: 28 December 2022;
Published: 13 January 2023.
Edited by:
Stefano Orlando, University of Rome Tor Vergata, ItalyReviewed by:
Ted Miller, Pacific Institute for Research and Evaluation, United StatesAlexandre Nunes, University of Lisbon, Portugal
Copyright © 2023 Rajabali, Turcotte, Zheng, Pauls, Nguyen, Kalman, Covic and Pike. This is an open-access article distributed under the terms of the Creative Commons Attribution License (CC BY). The use, distribution or reproduction in other forums is permitted, provided the original author(s) and the copyright owner(s) are credited and that the original publication in this journal is cited, in accordance with accepted academic practice. No use, distribution or reproduction is permitted which does not comply with these terms.
*Correspondence: Fahra Rajabali,  ZnJhamFiYWxpQGJjY2hyLmNh