 Shihong Du
 Xiuqin Hong
 Yi Yang1,2,3
 Zihao Ding
- 1Clinical Epidemiology Research Office, The First Affiliated Hospital of Hunan Normal University, Changsha, China
- 2Key Laboratory of Molecular Epidemiology, Hunan Normal University, Changsha, China
- 3Department of Epidemiology and Statistics, College of Medicine, Hunan Normal University, Changsha, China
- 4Research Department, The First Affiliated Hospital of Hunan Normal University, Changsha, China
Background: Previous studies have explored the relationship between body fat percentage (BFP) and hypertension or homocysteine. However, evidence on the constancy of the association remains inconclusive in postmenopausal women. The aim of this study was to investigate the association between BFP and H-type hypertension in postmenopausal women.
Methods: This cross-sectional study included 1,597 eligible female patients with hypertension. Homocysteine levels ≥10 mmol/L were defined as H-type hypertension. BFP was calculated by measuring patients' physical parameters. Subjects were divided into 4 groups according to quartiles of BFP (Q1: 33.4% or lower, Q2: 33.4–36.1%, Q3: 36.1–39.1%, Q4: >39.1%). We used restricted cubic spline regression models and logistic regression analysis to assess the relationship between BFP and H-type hypertension. Additional subgroup analysis was performed for this study.
Results: Among 1,597 hypertensive patients, 955 (59.8%) participants had H-type hypertension. There were significant differences between the two groups in age, BMI, educational background, marital status, exercise status, drinking history, WC, TG, LDL, Scr, BUN, and eGFR (P < 0.05). The prevalence of H-type hypertension in the Q1 to Q4 groups was 24.9, 25.1, 24.9, and 25.1%, respectively. After adjusting for relevant factors, we found that the risk of H-type hypertension in the Q4 group had a significantly higher than the Q1 group (OR = 3.2, 95% CI: 1.3–7.5).
Conclusion: BFP was positively associated with the risk of H-type hypertension in postmenopausal women. Postmenopausal women should control body fat to prevent hypertension.
Introduction
H-type hypertension is essential hypertension associated with serum homocysteine (Hcy) levels >10 umol/L (1). H-type hypertension is found in 80.3% of hypertensive patients in China. Epidemiological studies have indicated that when hypertension and hyperhomocysteinemia (HHcy) coexist, the risk of cardiovascular and cerebrovascular illness increase (2). As a result, early intervention is critical in H-type hypertension patients.
In recent years, obesity has increasingly become one of the most prominent global health problems (3). A million-person epidemiological survey in China reported that more than 50% of the adult residents are overweight or obese (4). Recent evidence has examined the relationship between obesity and H-type hypertension, and being obese or overweight is associated with an increased risk of H-type hypertension (5). Body mass index (BMI) has been the most frequent indicator of obesity due to its simplicity of measurement and low cost, but whether BMI can explain obesity remains controversial (6). A possible explanation is that BMI only takes into account height and weight, not fat mass and lean body mass (7). Body fat percentage (BFP) is a more accurate indicator of body fat composition than BMI.BFP is defined as the ratio of body fat weight to total body weight and offers a more precise view of body fat composition (8). There is growing evidence that increased BFP is associated with an increased risk of developing hypertension, even in individuals with normal BMI (9). These findings suggest the possibility of BFP being a risk factor for hypertension.
Postmenopausal women are more exposed to cardiovascular diseases like hypertension and HHcy due to decreased estrogen (10). Previous studies suggested that postmenopausal women have a higher prevalence of H-type hypertension than both premenopausal women and men of the same age (11, 12). Furthermore, several studies have revealed that estrogen deficiency significantly increases BFP, resulting in an increased risk of hypertension in postmenopausal women (13). Although previous researchers have investigated the relationship between BFP and hypertension, this association remains unexplained in postmenopausal women (14). Therefore, this cross-sectional study aimed to investigate the relationship between BFP and the risk of H-type hypertension in postmenopausal as well as to provide the groundwork for protecting postmenopausal women from H-type hypertension.
Materials and methods
Material
Study population
This cross-sectional study was conducted at Hunan Provincial People's Hospital, China, from December 2018 to December 2020. Inclusion criteria:(1) postmenopausal women (menstruation stopped for more than 1 year); (2) subjects diagnosed with essential hypertension (5). Exclusion criteria: (1) subjects who had recently taken medications that may affect blood pressure and Hcy; (2) secondary hypertension caused by pheochromocytoma, sleep apnea syndrome, and so on; (3) subjects with language impairment, mental illness, etc. who could not reflect the situation or did not cooperate with the questionnaire.
The project plan got accredited by the medical ethics committee of Hunan Normal University (No. 034/2017). All participants signed informed consent before participating in this study.
Data collection and anthropometric
The demographic characteristics of each individual were collected by trained researchers through questionnaires. The questionnaires included age, education level, marital status, smoking history, alcohol consumption history, and exercise status.
Blood pressure was measured by professionally trained nurses. Patients were prohibited from strenuous exercise, smoking and coffee half an hour prior to blood pressure measurement, and 3 measurements were taken using an electronic sphygmomanometer with at least 5 min of rest each time. The average of the 3 values was calculated and documented. Five milliliter of fasting venous blood were collected from all study subjects using an anticoagulation tube. Triglycerides (TG), total cholesterol (TC), low-density lipoprotein cholesterol (LDL), high-density lipoprotein cholesterol (HDL), alanine aminotransferase (ALT), creatinine (Scr), blood urea nitrogen (BUN), and glomerular filtration rate (eGFR) were measured by using an automatic biochemical analyzer at the Laboratory Department of Hunan Provincial People's Hospital.
Assessment of potential covariates
Education level was divided into four groups: elementary school and below, middle school, high school, and college and above. Marital status was classified as single married. Patients were judged to be exercising regularly based on the number of times they exercised in a week: 0 as no exercise, 1–3 as irregular exercise, and >3 as regular exercise. We defined current smoking as smoking one or more cigarettes per day consecutively or cumulatively for a period of 6 months; Alcohol consumption was currently defined as at least 2 drinks per week.
Body composition assessment
The height, weight and waist circumference (WC) of the study subjects were measured by speziell researchers using a height-weight scale while the patients wore light clothing and were barefoot. The average readings after three measurements were used for analysis. BMI = weight (kg)/height (m2).
BFP = −44.988+ (0.503 × age) + (10.689 × sex) + (3.172 × BMI) - (0.026 × BMI2) + (0.181 × BMI × sex) - (0.02 × BMI × age) - (0.005 × BMI2 × sex) + (0.00021 × BMI2 × age), where sex represented 1 for women (8).
We divided the study population into four groups based on the quartiles of BFP: 33.4% or lower (Q1), 33.4–36.1% (Q2), 36.1–39.1% (Q3), and >39.1% (Q4).
Definition of H-type hypertension
Patients with H-type hypertension were defined as having a diagnosis of essential hypertension with Hcy≥10 umol/L.
Statistical methods
Categorical variables were expressed as numbers and percentages (%), and the χ2 test was used to compare differences between groups. Data for continuous variables were expressed as means ± standard deviations (SD), and t-test was used to compare differences between groups. A restricted cubic spline was used to examine the relationship between continuous BFP levels and H-type hypertension in postmenopausal women. Multivariate logistic regression models were used to assess the association between BFP quartile subgroups and the risk of H-type hypertension. The logistic regression models included known potential confounders between BFP and H-type hypertension, as well as covariates with P < 0.05 in univariate analysis. We constructed three models: model 1 was unadjusted; in model 2, we adjusted for age, BMI, WC, educational background, marital status, exercise, smoking history, and drinking history. Model 3: TG, LDL, Scr, BUN, and eGFR was added to model 2. Stratified analysis was performed for BMI, smoking and drinking history, and exercise.
All statistical analyses were performed using SPSS 26.0 and R 4.2.1, and P-values <0.05 were considered statistically significant.
Results
Basic information
This study pooled 1,597 postmenopausal women with essential hypertension. The average age of all subjects was 63.1 ± 9.5 years. A total of 955 (59.8%) H-type hypertensive patients were identified in this research. The average BFP of all individuals was 36.3 ± 4.2%, with 397 (24.9%), 401 (25.1%), 399 (24.9%), and 400 (25.1%) in each group following quartile grouping (Table 1). We discovered that the prevalence of H-type hypertension was also highest in the fourth quartile group of BFP (P < 0.05). Table 1 also showed a comparison of baseline information between postmenopausal women with and without H-type hypertension events. Obesity, low education, marriage, less exercise, smoking, and drinking were all associated with an increased risk of H-type hypertension compared to the control group. In addition, WC, TG, LDL, Scr, and BUN increased significantly in HHcy patients, while eGFR decreased significantly (P < 0.05).
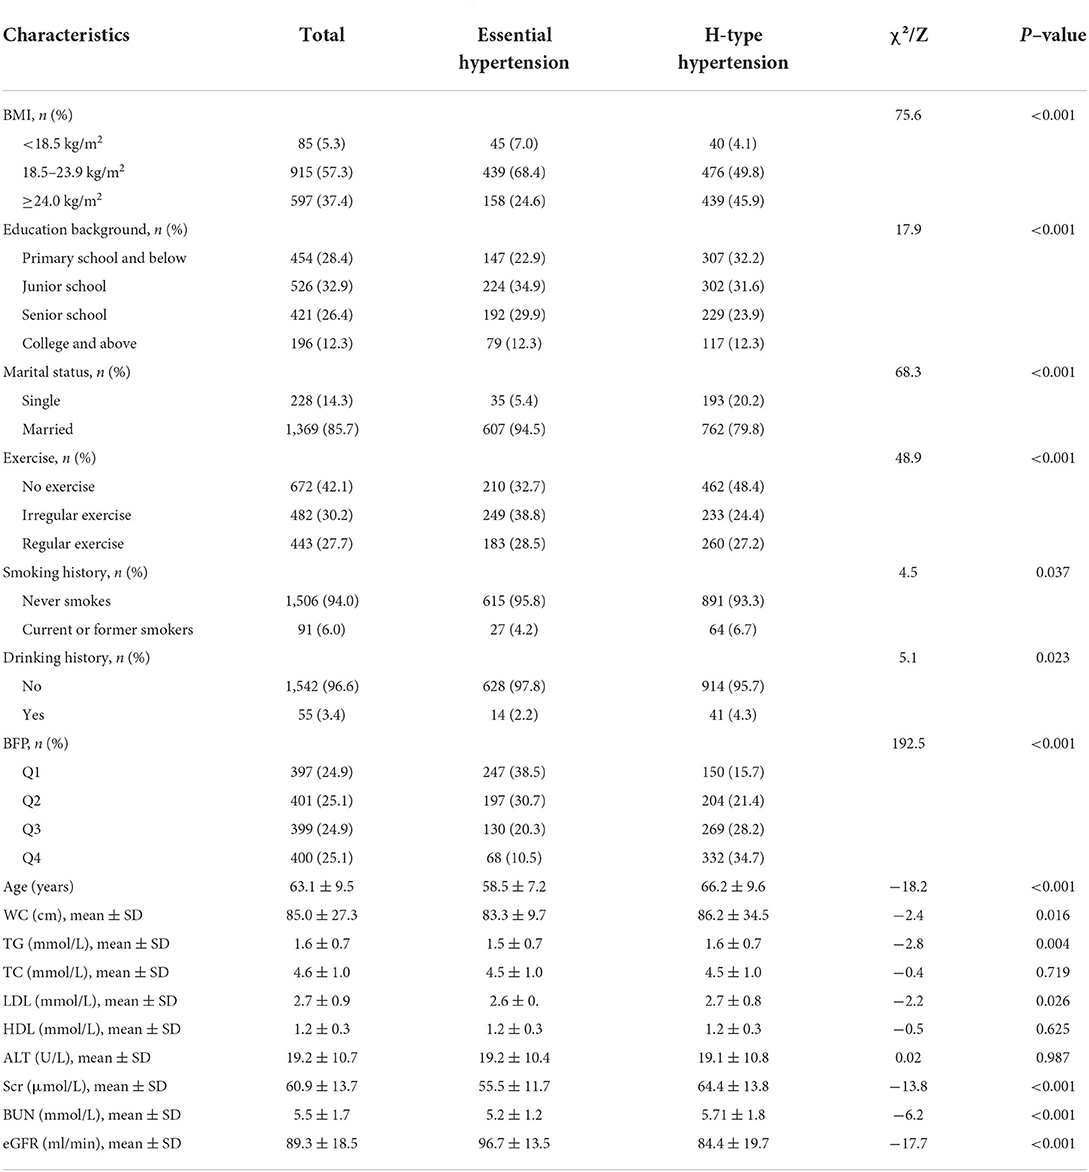
Table 1. Baseline characteristics of study participants according to H-type hypertension status.
Dose-response relationship between BFP and H-type hypertension
Figure 1 displays a restricted cubic spline model with knots placed at the 5th, 50th, and 90th percentiles to examine the relationship between continuous BFP and the risk of H-type hypertension. The results indicate a significant non-linear dose-response association between BFP and the risk of H-type hypertension after adjusting for confounders. The risk of H-type hypertension in postmenopausal women increased with a continuous increase in BFP.
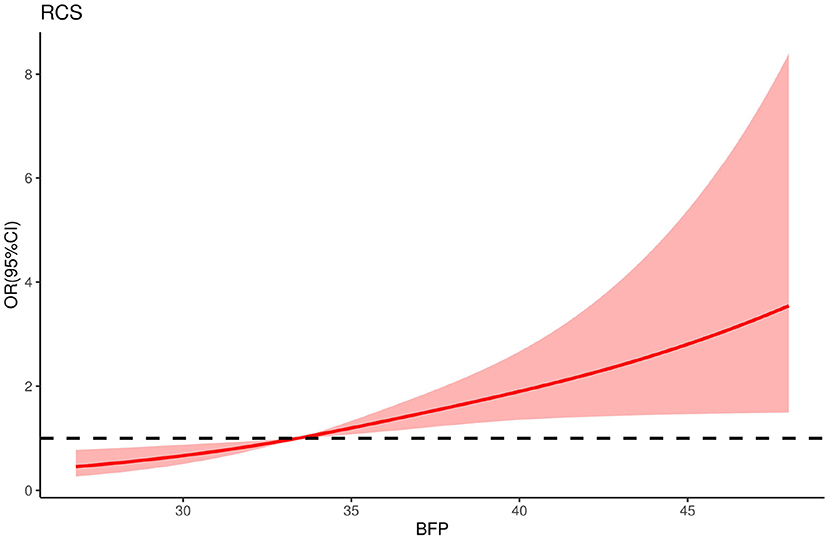
Figure 1. The restricted cubic spline for the relationship between BFP and H-type hypertension in postmenopausal women. The reference value for BFP was set as a cut-off value for the first quartile. Three nodes were selected for the model and adjusted for age, BMI, WC, educational background, marital status, exercise, smoking history and drinking history, TG, LDL, Scr, BUN, and eGFR.
Association between BFP and H-type hypertension
Table 2 shows the results of the association between BFP and the risk of H-type hypertension. In the univariate analysis, the OR of BFP and H-type hypertension increased significantly with increasing quartiles of BFP. The OR of quartile 4 was significantly higher than quartile 1 (OR = 7.8, 95% CI: 5.5–11.0; P < 0.001). After correction for some confounders in model 3 (age, BMI, WC, educational background, marital status, exercise, history of smoking, history of alcohol consumption, TG, LDL, Scr, BUN, eGFR), the multivariate corrected dominance ratios (95% CI) for the association between BFP and H-type hypertension in the other three groups compared with quartile 1 were 1.2 (0.8–1.7), 1.8 (1.1–3.2), and 3.2 (1.3–7.5), respectively. We also analyzed BFP as a continuous variable. In model 1, each unit increase in BFP was associated with a 0.2-fold increase in the risk of H-type hypertension in postmenopausal women (95% CI: 1.1–1.2; P < 0.001). Adjusting for confounders had no effect on this relationship.
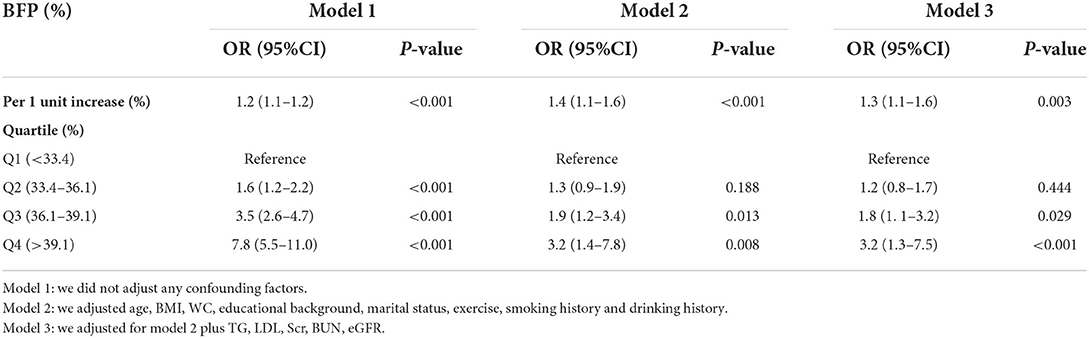
Table 2. Association between BFP and H-type hypertension in different models.
Subgroup analysis
The association between BFP and H-type hypertension was analyzed in a predetermined manner according to the following factors: age, BMI, smoking, drinking, and exercise. Table 3 showed that the positive association between BFP and H-type hypertension was maintained across all stratified subgroups (P > 0.05 for all interactions).
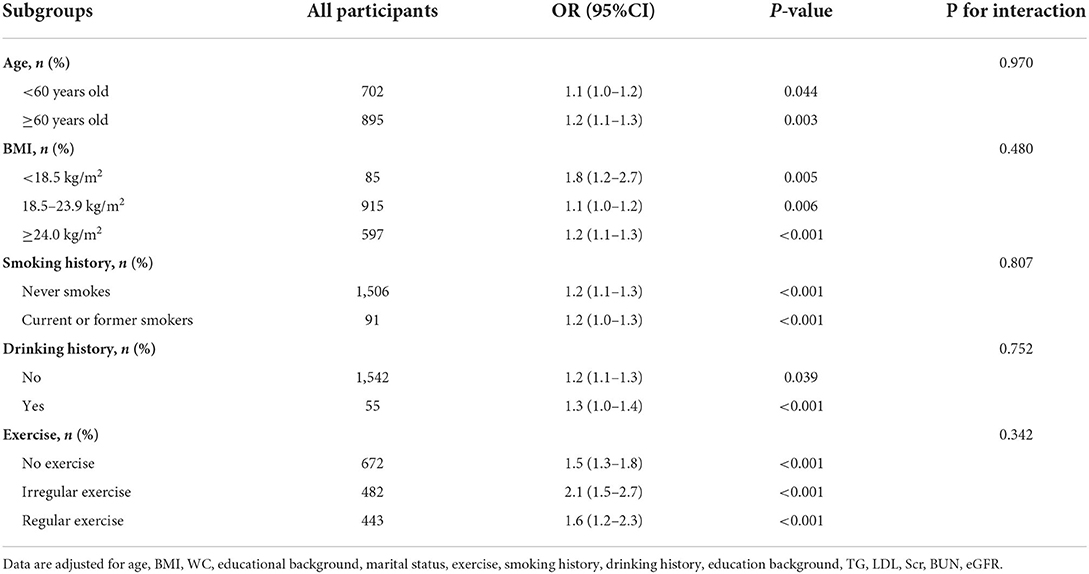
Table 3. Association between BFP and H-type hypertension in different subgroups.
Discussion
The association between BFP and H-type hypertension in postmenopausal women was investigated in this cross-sectional study. The hazard of H-type hypertension in postmenopausal women was found to be associated with BFP by logistic regression, and higher BFP was more closely associated with H-type hypertension. After reconciling possible confounding factors, we obtained the same results. The positive correlation between BFP and H-type hypertension was constant across all stratified groupings.
H-type hypertension has become a common chronic condition in China in recent years, and it plays a pivotal role in cardiovascular, brain, and renal problems. Patients with H-type hypertension had a 5-fold increase in cardiovascular events compared to hypertension alone (15). A considerable amount of literature has been demonstrated that HHcy and hypertension have a synergistic impact that raises the risk of cardiovascular events (2, 16). Therefore, early prevention is extremely necessary for H-type hypertension. Obesity has been identified as an independent risk factor for H-type hypertension in previous investigations. It has been proposed that the association between hcy and hypertension was influenced by BMI from a meta-analysis (17). However, in another cross-sectional study, a significant association was only observed between BMI and Hcy, but not with hypertension (18). Some researchers speculated that this discrepancy may be since BMI is not accurate as a measure of obesity (19). In Asian populations, BMI may underestimate the role of body fat content BMI (20). Therefore, it may be more reliable to use BFP as an indicator of obesity (21). Takase has demonstrated that it is BFP rather than BMI that affects blood pressure (22). A Korean cohort study similarly showed that increased body fat was a predictor of hypertension (23). Furthermore, BFP played an paramount role in the identification of hypertension in women (24).
Menopause is a life process that every woman must go through, when ovarian function declines and estrogen in the body decreases, resulting in a series of pathophysiological changes in the organism (25). In addition to menopausal-related symptoms, psychiatric and neurological symptoms, postmenopausal women also experience significant changes in the cardiovascular system, especially hypertension (26). Menopause has become an independent risk factor for increased morbidity and mortality of hypertension in women (14). Current studies have also found elevated Hcy in postmenopausal women compared to premenopausal women (27). Relevant epidemiological surveys have indicated that the prevalence of H-type hypertension in postmenopausal women is higher than that in men of the same age and in non-menopausal women, and it tends to increase with age (28). Therefore, H-type hypertension can seriously affect the amount of life dwelling and health level of menopausal women. Also, BFP in women increased at a similar annual rate with age (29). Similar findings were reported in our investigation, demonstrating that BFP is a risk factor for H-type hypertension in postmenopausal women.
The pathogenesis of obesity and H-type hypertension in postmenopausal women is still unclear. A decrease in E2 levels may also cause an increase in Hcy levels, leading to endothelial dysfunction in postmenopausal women and increasing the risk of hypertension (30). Furthermore, leptin levels have been observed to be higher in postmenopausal women with hypertension, and obesity has been attributed to alterations in the leptin-activated melano cortical pathway. Meanwhile, bioactive substances secreted by adipose tissue, such as angiotensinogen, IL-6 and TNF-α, are associated with changes in vascular inflammation and arteriosclerosis, leading to increased blood pressure (31, 32).
However, some limitations should be noted. First, the cross-sectional design was not able to accurately assess the causality between BFP and H-type hypertension, and some recall bias possibly existed. Second, we merely evaluated at postmenopausal women, and the findings of our work cannot be extended to other populations. Finally, although we performed multivariate adjustment, we did not exclude other potential confounders.
Data availability statement
The raw data supporting the conclusions of this article will be made available by the authors, without undue reservation.
Ethics statement
The studies involving human participants were reviewed and approved by the Medical Ethics Committee of Hunan Normal University (No. 034/2017). The patients/participants provided their written informed consent to participate in this study. Written informed consent was obtained from the individual(s) for the publication of any potentially identifiable images or data included in this article.
Author contributions
SD: research design, data analysis, and manuscript writing. XH: funding acquisition, conceptualization, and writing—review and editing. YY: data collection and research design. ZD: data collection and comments. TY: data collection and investigation. All authors contributed to the article and approved the submitted version.
Funding
This study was funded by the National Natural Science Foundation of China (8177120863), Hunan Provincial Science and Technology Department (2020JJ4047), and Changsha Science and Technology Bureau (kq1801096). The funders had no role in the study design, data collection, and analysis, decision to publish, or preparation of the manuscript.
Conflict of interest
The authors declare that the research was conducted in the absence of any commercial or financial relationships that could be construed as a potential conflict of interest.
Publisher's note
All claims expressed in this article are solely those of the authors and do not necessarily represent those of their affiliated organizations, or those of the publisher, the editors and the reviewers. Any product that may be evaluated in this article, or claim that may be made by its manufacturer, is not guaranteed or endorsed by the publisher.
References
1. Huo Y, Li J, Qin X, Huang Y, Wang X, Gottesman R, et al. Efficacy of folic acid therapy in primary prevention of stroke among adults with hypertension in China: the CSPPT randomized clinical trial. JAMA. (2015) 313:1325–35. doi: 10.1001/jama.2015.2274
2. Pang H, Han B, Fu Q, Zong Z. Association of high homocysteine levels with the risk stratification in hypertensive patients at risk of stroke. Clin Ther. (2016) 38:1184–92. doi: 10.1016/j.clinthera.2016.03.007
3. Wang W, Ji P, Wang Y, Guo H, Bian R, Xu J, et al. Prevalence of hyperhomocysteinemia and its associated factors in patients with primary hypertension in Chinese urban communities: a cross-sectional study from Nanjing. Clin Exp Hypertens. (2018) 40:495–500. doi: 10.1080/10641963.2017.1403621
4. Mu L, Liu J, Zhou G, Wu C, Chen B, Lu Y, et al. Obesity prevalence and risks among chinese adults: findings from the China PEACE million persons project, 2014-2018. Circ Cardiovasc Qual Outcomes. (2021) 14:e007292. doi: 10.1161/CIRCOUTCOMES.120.007292
5. Wang J, Du J, Fan R. Exploration of the risk factors of essential hypertension with hyperhomocysteinemia: a hospital-based study and nomogram analysis. Clinics. (2021) 76:e2233. doi: 10.6061/clinics/2021/e2233
6. Peng X, Huang J, Liu Y, Cheng M, Li B, Li R, et al. Influence of changes in obesity indicators on the risk of hypertension: a cohort study in southern China. Ann Nutr Metab. (2021) 77:100–8. doi: 10.1159/000515059
7. Hanyuda A, Lee DH, Ogino S, Wu K, Giovannucci EL. Long-term status of predicted body fat percentage, body mass index and other anthropometric factors with risk of colorectal carcinoma: two large prospective cohort studies in the US. Int J Cancer. (2020) 146:2383–93. doi: 10.1002/ijc.32553
8. Xiong Y, Wangsheng F, Wang S, Zhou W, Huang X, Bao H, et al. Positive association between body fat percentage and hyperuricemia in patients with hypertension: the China H-type hypertension registry study. Nutr Metab Cardiovasc Dis. (2021) 31:3076–84. doi: 10.1016/j.numecd.2021.07.002
9. Park S, Ryoo J, Oh C, Choi J, Chung P, Jung J. Body fat percentage, obesity, and their relation to the incidental risk of hypertension. J Clin Hypertens. (2019) 21:1496–504. doi: 10.1111/jch.13667
10. Yeasmin N, Akhter Q, Mahmuda S, Banu N, Yeasmin S, Akhter S, et al. Association of hypertension with serum estrogen level in postmenopausal women. Mymensingh Med J. (2017) 26:635–41. doi: 10.3329/jdmc.v26i1.33992
11. Zhu Z, Jiang S, Li C, Liu J, Tao M. Relationship between serum homocysteine and different menopausal stage. Climacteric. (2020) 23:59–64. doi: 10.1080/13697137.2019.1634045
12. Hodis H, Mack W, Henderson V, Shoupe D, Budoff M, Hwang-Levine J, et al. Vascular effects of early versus late postmenopausal treatment with estradiol. N Engl J Med. (2016) 374:1221–31. doi: 10.1056/NEJMoa1505241
13. Schnurr T, Gjesing A, Sandholt C, Jonsson A, Mahendran Y, Have C, et al. Genetic correlation between body fat percentage and cardiorespiratory fitness suggests common genetic etiology. PloS ONE. (2016) 11:e0166738. doi: 10.1371/journal.pone.0166738
14. Chou C, Chien L, Lin M, Wang C. Cognitive function and associated factors among postmenopausal women with hypertension and natural menopause in Taiwan. Geriatr Nurs. (2021) 42:110–6. doi: 10.1016/j.gerinurse.2020.12.007
15. Kovalska M, Baranovicova E, Kalenska D, Tomascova A, Adamkov M, Kovalska L, et al. Methionine diet evoked hyperhomocysteinemia causes hippocampal alterations, metabolomics plasma changes and behavioral pattern in wild type rats. Int J Mol Sci. (2021) 22:4961. doi: 10.3390/ijms22094961
16. Zhou F, Hou D, Wang Y, Yu D. Evaluation of H-type hypertension prevalence and its influence on the risk of increased carotid intima-media thickness among a high-risk stroke population in Hainan Province, China. Medicine. (2020) 99:e21953. doi: 10.1097/MD.0000000000021953
17. Zhong F, Zhuang L, Wang Y, Ma Y. Homocysteine levels and risk of essential hypertension: a meta-analysis of published epidemiological studies. Clin Exp Hypertens. (2017) 39:160–7. doi: 10.1080/10641963.2016.1226888
18. Han L, Liu Y, Wang C, Tang L, Feng X, Astell-Burt T, et al. Determinants of hyperhomocysteinemia in healthy and hypertensive subjects: a population-based study and systematic review. Clin Nutr. (2017) 36:1215–30. doi: 10.1016/j.clnu.2016.11.011
19. Lu S, Su J, Xiang Q, Zhou J, Wu M. Accuracy of self-reported height, weight, and waist circumference in a general adult Chinese population. Popul Health Metr. (2016) 14:30. doi: 10.1186/s12963-016-0099-8
20. Wulan S, Westerterp K, Plasqui G. Ethnic differences in body composition and the associated metabolic profile: a comparative study between Asians and Caucasians. Maturitas. (2010) 65:315–9. doi: 10.1016/j.maturitas.2009.12.012
21. Aizuddin A, Chan C, Anwar A, Ong Y, Chin K. Performance of body mass index in identifying obesity defined by body fat percentage and hypertension among Malaysian population: a retrospective study. Int J Gen Med. (2021) 14:3251–7. doi: 10.2147/IJGM.S316360
22. Takase M, Nakamura T, Tsuchiya N, Kogure M, Itabashi F, Narita A, et al. Association between the combined fat mass and fat-free mass index and hypertension: the Tohoku Medical Megabank Community-based Cohort Study. Clin Exp Hypertens. (2021) 43:610–21. doi: 10.1080/10641963.2021.1925681
23. Lee S, Cho A, Kwon Y, Jung D. Body fat change and 8-year incidence of hypertension: Korean Genome and Epidemiology Study. J Clin Hypertens. (2019) 21:1849–57. doi: 10.1111/jch.13723
24. Jiang J, Deng S, Chen Y, Liang S, Ma N, Xu Y, et al. Comparison of visceral and body fat indices and anthropometric measures in relation to untreated hypertension by age and gender among Chinese. Int J Cardiol. (2016) 219:204–11. doi: 10.1016/j.ijcard.2016.06.032
25. Sharma S, Adhikari L, Karmacharya I, Kaphle M. Menopausal symptoms among postmenopausal women of a selected municipality: a cross-sectional survey. JNMA. (2021) 59:1155–60. doi: 10.31729/jnma.7052
26. El Khoudary S. Age at menopause onset and risk of cardiovascular disease around the world. Maturitas. (2020) 141:33–8. doi: 10.1016/j.maturitas.2020.06.007
27. Wang Y, Zhao L, Gao L, Pan A, Xue H. Health policy and public health implications of obesity in China. Lancet Diabetes Endocrinol. (2021) 9:446–61. doi: 10.1016/S2213-8587(21)00118-2
28. Yang B, Fan S, Zhi X, He J, Ma P, Yu L, et al. Interactions of homocysteine and conventional predisposing factors on hypertension in Chinese adults. J Clin Hypertens. (2017) 19:1162–70. doi: 10.1111/jch.13075
29. Campisi J, Finn K, Bravo Y, Arnold J, Benjamin M, Sukiennik M, et al. Sex and age-related differences in perceived, desired and measured percentage body fat among adults. J Hum Nutr Diet. (2015) 28:486–92. doi: 10.1111/jhn.12252
30. Pabbidi M, Kuppusamy M, Didion S, Sanapureddy P, Reed J, Sontakke S. Sex differences in the vascular function and related mechanisms: role of 17β-estradiol. Am J Physiol Heart Circ Physiol. (2018) 315:H1499–518. doi: 10.1152/ajpheart.00194.2018
31. Ben Ali S, Belfki-Benali H, Ahmed D, Haddad N, Jmal A, Abdennebi M, et al. Postmenopausal hypertension, abdominal obesity, apolipoprotein and insulin resistance. Clin Exp Hypertens. (2016) 38:370–4. doi: 10.3109/10641963.2015.1131286
Keywords: H-type hypertension, body fat percentage, obesity, postmenopausal women, cross-sectional study
Citation: Du S, Hong X, Yang Y, Ding Z and Yu T (2022) Association between body fat percentage and H-type hypertension in postmenopausal women. Front. Public Health 10:950805. doi: 10.3389/fpubh.2022.950805
Received: 23 May 2022; Accepted: 30 June 2022;
Published: 22 July 2022.
Edited by:
Qinghua Li, Guilin Medical University, ChinaReviewed by:
Diana Nur Afifah, Diponegoro University, IndonesiaJunnan Wang, Jilin University, China
Copyright © 2022 Du, Hong, Yang, Ding and Yu. This is an open-access article distributed under the terms of the Creative Commons Attribution License (CC BY). The use, distribution or reproduction in other forums is permitted, provided the original author(s) and the copyright owner(s) are credited and that the original publication in this journal is cited, in accordance with accepted academic practice. No use, distribution or reproduction is permitted which does not comply with these terms.
*Correspondence: Xiuqin Hong, eGl1cWluaG9uZzA1MjhAaHVubnUuZWR1LmNu