 Gao-Xiang Wang1,2†
 Bao-Li Huang3†
 Jun-Tong Li1,2
 Ze-Bin Fang3
 Le-Yi Feng3Heng-Xia Zhao2
 Shu-Fang Chu2*
 De-Liang Liu2*
 Hui-Lin Li2*
- 1Shenzhen Traditional Chinese Medicine Hospital Affiliated to Nanjing University of Chinese Medicine, Shenzhen, Guangdong, China
- 2Department of Endocrinology, Shenzhen Traditional Chinese Medicine Hospital, Shenzhen, Guangdong, China
- 3The Fourth Clinical Medical College of Guangzhou University of Chinese Medicine, Shenzhen, Guangdong, China
Objectives: The prevalence of obesity is on the rise and is connected to numerous factors. However, the relationship between obesity and nickel has never been investigated. Our study aimed to explore the association between urinary nickel and obesity Status in adults.
Methods: From the 2017–2018 National Health and Nutrition Examination Surveys (NHANES), 1,705 participants ≥18 years of age were enrolled. To explore further the relationship among urinary nickel, body mass index (BMI), and waist circumference(WC), Weighted multivariate linear regression analyses and further subgroup analyzes were conducted.
Results: Urinary nickel does not correlate with BMI level but positively correlates with WC. In the subgroup analyzed according to sex, Urinary nickel has a positive correlation with BMI and WC in males but has a negative correlation in females. Secondary stratification analysis according to sex and race, Urinary nickel positively correlates with BMI in White males. It also positively correlates with WC in both White and Black males.
Conclusions: A correlation was found between urinary nickel levels and BMI and WC in adult males. Adult men, especially those already obese, may need to reduce nickel exposure.
Introduction
Nickel occupies the 28th spot in the periodic table. It is a brutal metal found naturally in air, water, and soil (1). Nickel is vital for microorganisms, plants, animals, and humans (2). Nickel deficiency can cause growth retardation and fecundity decline, impairment of specific senses, reduced iron absorption, and alteration of essential enzymes in animal tissues and organs, leading to various clinical changes (3–5). However, specific toxicity and carcinogenic properties are connected with excessive nickel. In humans, numerous health issues, including contact dermatitis, cardiovascular conditions, and lung and nasal cancer, can result from prolonged exposure to nickel (6). Nickel exposure most commonly occurs through respiratory inhalation (7), food and water intake (8), and skin absorption (9). With the extensive use of nickel-containing products in daily life (10), especially in medical devices (11), great attention is paid to nickel-related health issues.
Globally, obesity has become a severe public health issue (12). Research shows that 70% of American and 50% of Chinese adults are overweight or obese (13, 14). There are several diseases associated with obesity, such as hypertension (15), malignant tumors (16), and diabetes (17). Several investigations conducted during the COVID-19 pandemic also revealed that obese people with COVID-19 infection had much greater rates of severe illness and fatality than normal persons (18, 19). Since obesity constitutes a significant threat to health, a more profound knowledge of relevant factors of obesity is necessary. Recent studies have confirmed a correlation between urinary nickel and the prevalence of diabetes and high blood pressure (20, 21). As everyone knows, diabetes and high blood pressure are closely related to obesity, but the relationship between urinary nickel and obesity status is unclear (22).
Body mass index (BMI) can effectively assess the state of health, has the characteristics of simple, feasible, and non-invasive (23, 24), and is an essential indicator for the diagnosis of obesity. Waist circumference (WC) has become increasingly crucial in predicting death and morbidity in recent years, and the combination of WC and BMI has been emphasized in diagnosing obesity (25, 26). In this study, we conducted a cross-sectional study to explore the relationship between urinary nickel and obesity index (BMI and WC). To our knowledge, this is the first study to examine the relationship between obesity status and nickel exposure, which is of great significance to this field.
Materials and methods
Study population
In this study, our subjects included adults (≥18 years) from NHANES during 2017–2018. Study participants had 1,705 people after eliminating those with missing data regarding urinary nickel, BMI, or WC. The selection process is depicted in Figure 1.
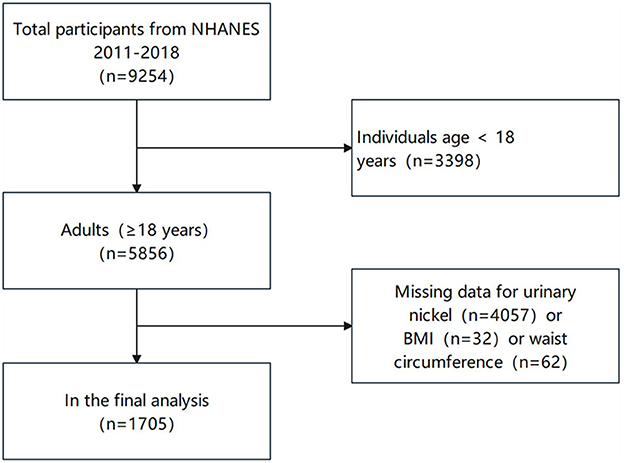
Figure 1. Flow chart for selecting participants.
Ethics statement
Participation in the study was voluntary, and the National Center for Health Statistics Research Ethics Review Board approved this study's conduct. To protect everyone's privacy, NHANES will anonymize collected data before making it public as public data. We agree to follow all guidelines for using NHANES data for research purposes and comply with all applicable standards and laws.
Urinary nickel, BMI, and WC
It was decided to collect a single spot urine sample and store it at ≤-20°C for long-term or short-term analysis stored at 2–8°C before analysis. Inductively coupled plasma mass spectrometry (ICP-MS) was employed to determine nickel levels in urine, which is a susceptible technique that can measure multiple elements at low concentrations. To be brief, ICPs operate with argon flows passing through an atomizer and spray chamber to process urine samples. The sample vaporizes at a high temperature, dissociates the ionized gas, and then the ions reach the ion detector. Finally, the isotope ratio of the elements is measured. A urinary nickel concentration of 0.31 mg/L is considered a detection limit of detection. More detailed laboratory procedure manuals are shown on the NHANES's website (27).
This study measured the weight, height, and WC of adults 18 and older using standardized methods. Physical examination measured BMI and WC. BMI is calculated by dividing the square of a person's weight (in kilograms) by their height (in meters), and precise measurements could well be acquired using standard digital scales and rulers. Medical professionals measured the subjects' WC with a flexible ruler. According to the WHO-recommended measurement method, the subject's feet were separated by 25–30 cm. The measurer placed the measuring tape around the abdomen in a circle at the midpoint of the line connecting the anterior superior iliac crest and the lower border of the 12th rib, close to the soft tissue, but without compression, and measured at the end of exhalation and before inspiration. When the WC and BMI are both normal, it is not obesity; when the BMI is normal, but the WC of men is ≥94 cm, and that of women is ≥80 cm, it is central obesity; when the WC is standard, but the BMI is ≥30 kg/m2, it is defined as peripheral obesity; when the BMI and WC are both above normal, it is defined as mixed obesity (28, 29).
Covariates
The information on age, race, the ratio of family income to poverty, and the educational level of the participants was obtained through the questionnaire. To ensure the quality of the questionnaire and data collection, questionnaires are developed in advance by professional surveyors and released. Data is received by trained medical staff at a mobile medical examination center. Qualified laboratory specialists collected and processed blood samples at the mobile medical examination center. The following parameters will be evaluated: total cholesterol, triglycerides, glycohemoglobin, blood urea nitrogen, serum creatinine, serum uric acid, and total protein. Hispanic, Mexican American, Non-Hispanic White, Non-Hispanic Black, and Other Race were classified. Education levels below high school, high school, and higher education were ranked based on their education level. The NHANES website (www.cdc.gov/nchs/nhanes/) provides public access to the data from this survey.
Statistical analysis
This study used statistical software R (version 3.4.4) to conduct all statistical analyzes. Per National Center for Health Statistic (NCHS) recommendations, samples were weighted according to NHANES (30). An analysis of the associations between urinary nickel, BMI, and WC was conducted using weighted linear regression. In this study, we built three regression models. No adjustments had been made to Model 1: race, gender, and age adjustment were made in Model 2. A complete adjustment was made to Model 3 for all Covariates. To further explore the relationship between urinary nickel, BMI, and WC, Weighted multivariate linear regression analyses and subgroup analyzes were conducted. A p-value of <0.05 determined statistical significance.
Results
Description of participant characteristics
The statistical characteristics of the study population are displayed in Table 1. A total of 1,705 adults participated in this study. In different groups of urinary nickel (quartiles, Q1-Q4), gender, age, triglycerides, serum creatinine, and BMI were not statistically significant. In contrast, race/ethnicity, education level, the ratio of family income to poverty, total cholesterol, glycohemoglobin, blood urea nitrogen, serum uric acid, total protein, WC, and obesity status were statistically significant. The main types of obese people are mixed and central obesity.
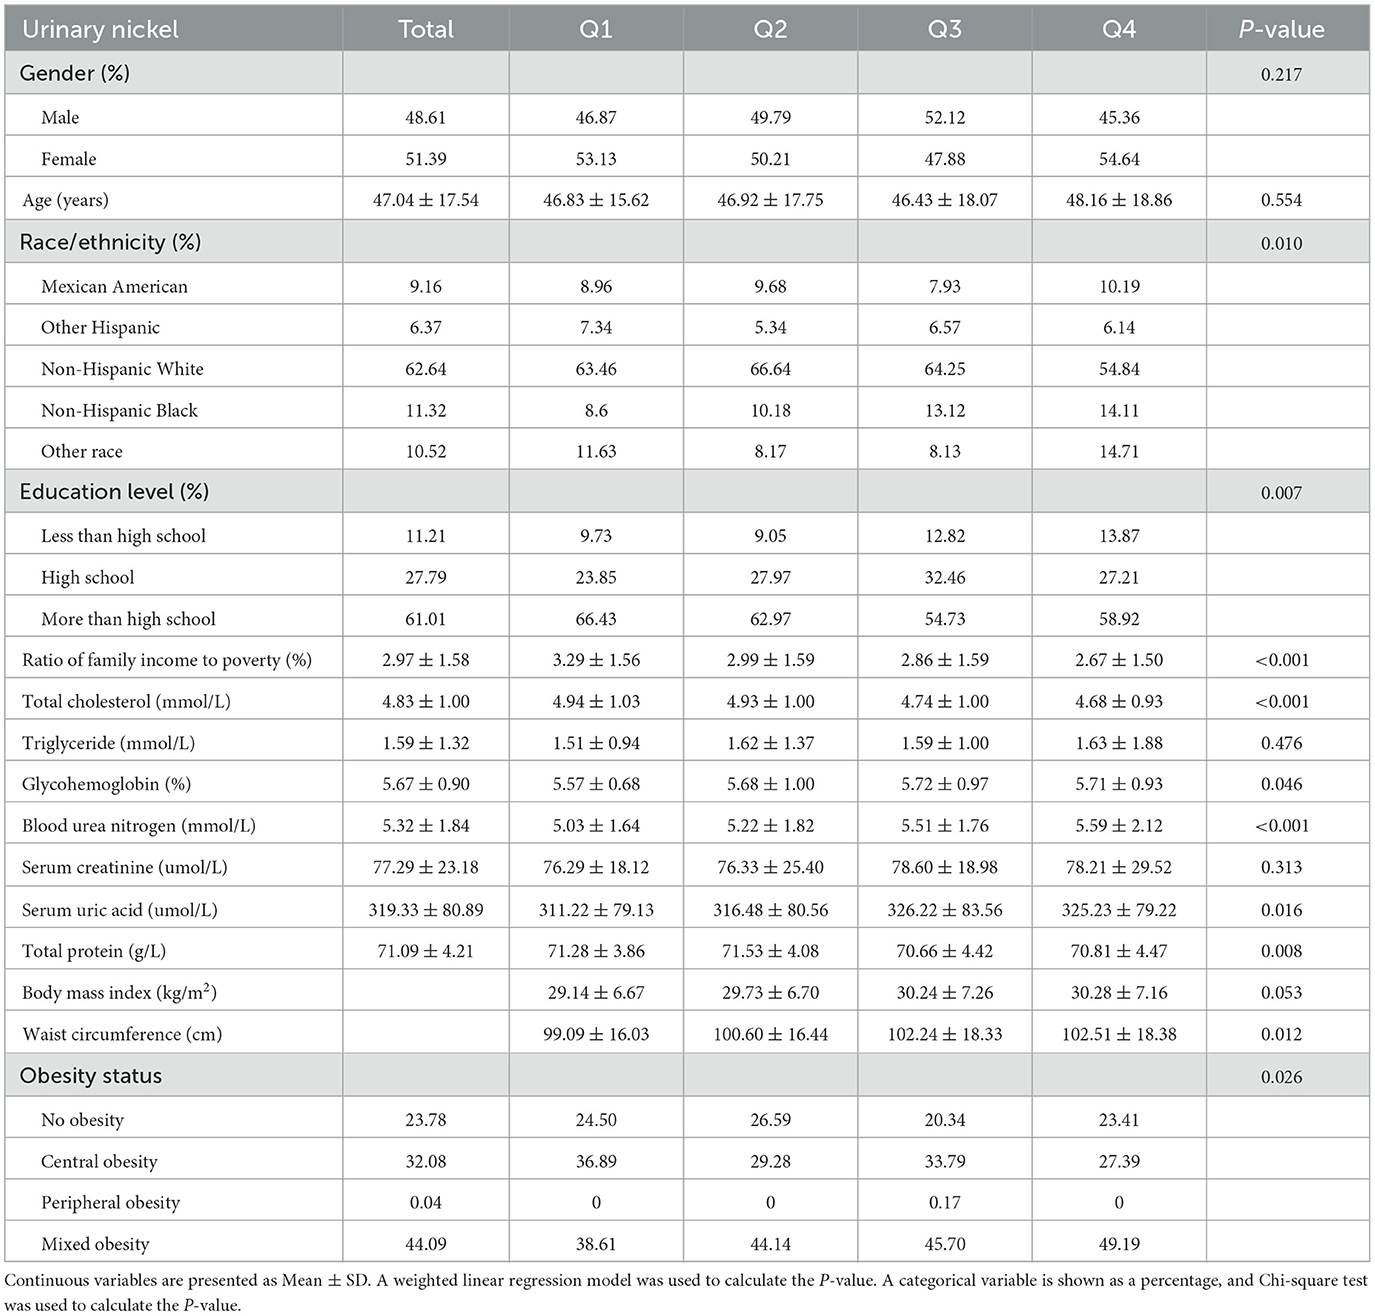
Table 1. Weighted characteristics of the study sample.
Covariable selection
As shown in Table 2, we select covariates by univariate analysis. When the outcome index is BMI, the age, race/ethnicity, education level, ratio of family income to poverty, total cholesterol, triglyceride, glycohemoglobin, and serum uric acid were select as covariable. When the outcome index is WC, the age, gender, race/ethnicity, education level, blood urea nitrogen, serum creatinine, total cholesterol, triglyceride, glycohemoglobin, serum uric acid, and total protein were select as covariable.
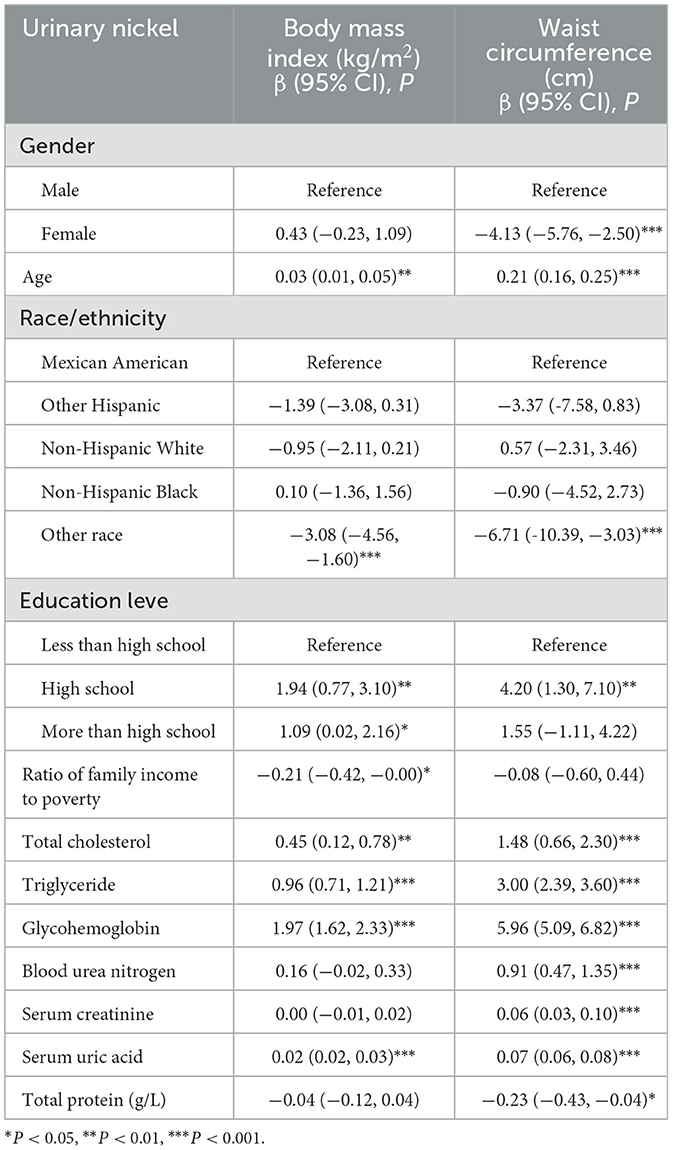
Table 2. Univariate analysis to select covariates.
Association between urinary nickel and BMI
Table 3 shows the association between urinary nickel and BMI based on multivariate regression analysis. In all three models, no significant associations were found. However, stratified by sex, all three models (model 1: 0.3520, 0.0604–0.6436; model 2: 0.3278, 0.0398–0.6159; model 3: 0.2965, 0.0302–0.5628) revealed a positive association for males, P for trend of three models was, respectively, 0.001, 0.003, and 0.010. As a result of secondary stratification based on sex and race, urinary nickel had a positive correlation with BMI in White males (Table 4).

Table 3. Association between urinary nickel (ug/L) and body mass index (kg/m2).
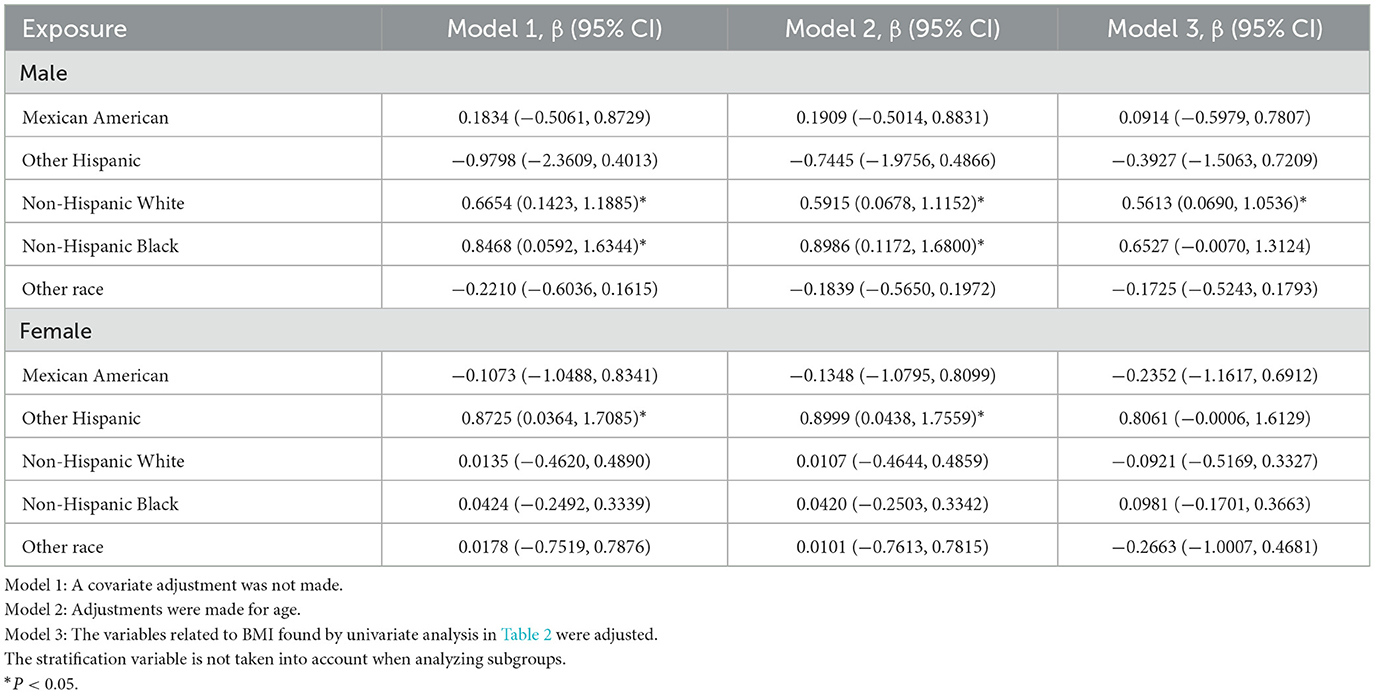
Table 4. Association between urinary nickel (ug/L) and body mass index (kg/m2) stratified by sex and race.
Association between urinary nickel and WC
When exploring the association between urinary nickel and WC, we found a positive association in all their models(model 1:0.4894,0.0486–0.9302; model 2:0.4938,0.0679–0.9197; model 3: 0.4110 0.0221–0.7999). However, stratified by sex, the positive association was only found in three male models (model 1: 1.3408, 0.5525–2.1290; model 2: 1.2004, 0.4511–1.9498; model 3:1.1111, 0.4156–1.8066), with a significant P for trend of three models (P < 0.001, P < 0.001, P = 0.001) (Table 5). Secondary stratification analysis according to sex and race, urinary nickel has a positive correlation with WC in both White and Black males (Table 6).
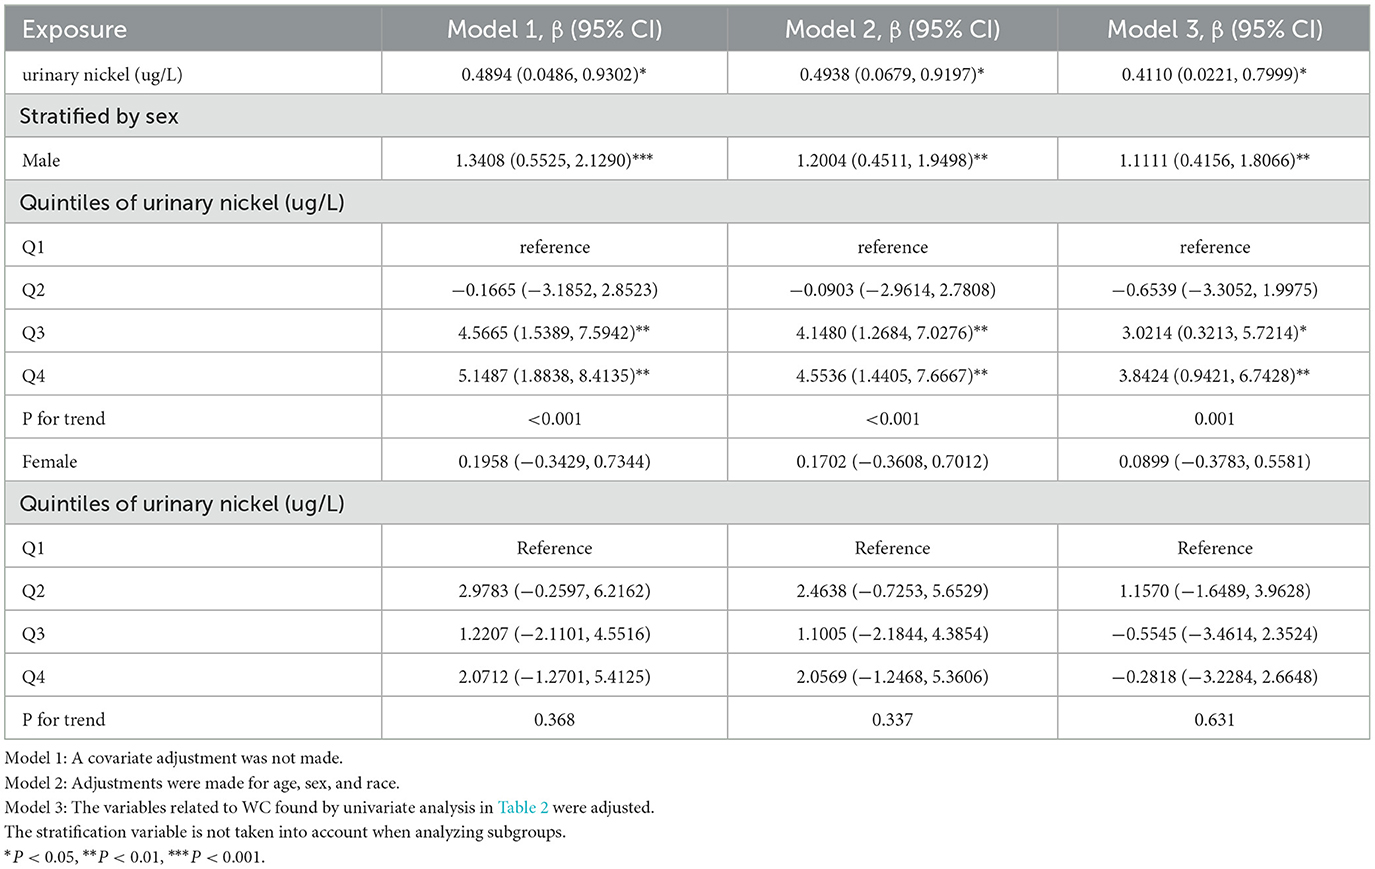
Table 5. Association between urinary nickel (ug/L) and waist circumference (cm).
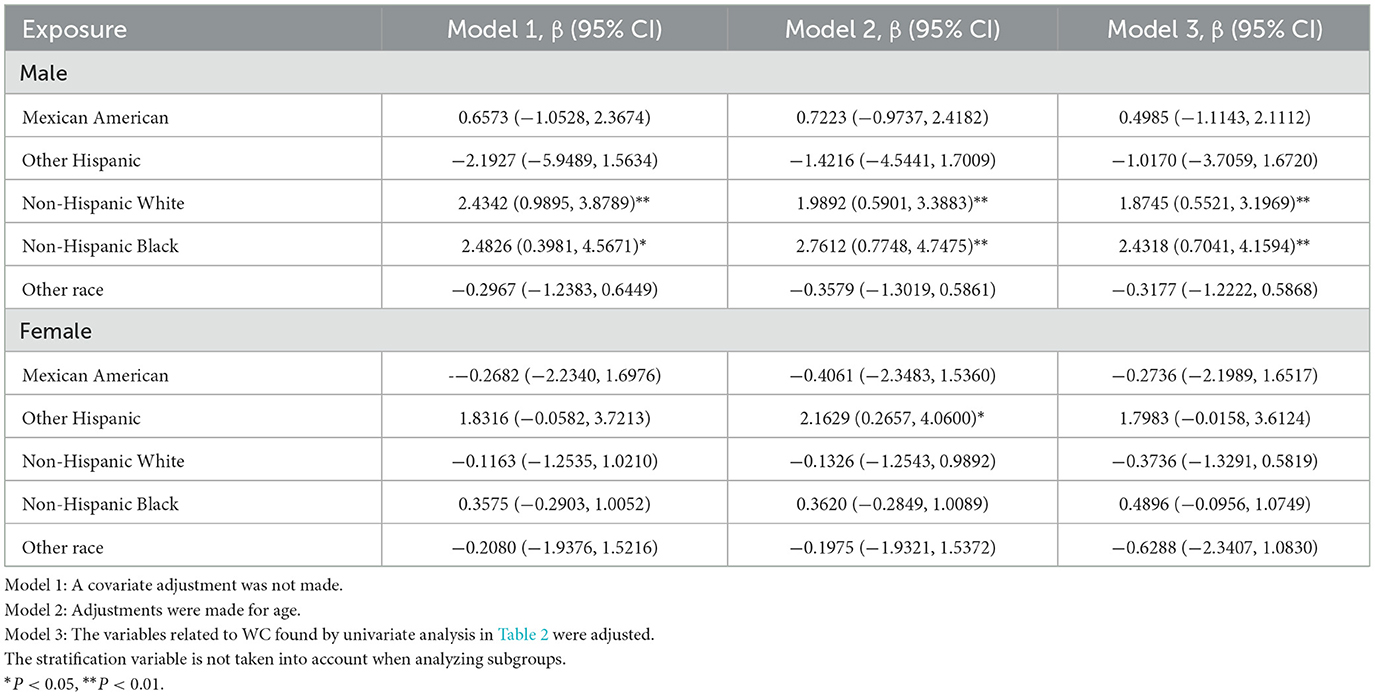
Table 6. Association between urinary nickel (ug/L) and waist circumference (cm) stratified by sex and race.
Association among BMI, WC, and urinary nickel stratified simultaneously by gender and obesity status
As shown in Table 7, when stratified simultaneously according to gender and obesity status, BMI was positively correlated with no obesity in women (0.2161, 0.0325–0.3998), while WC was positively correlated with mixed obesity in Men(1.2598, 0.4131–2.1065).
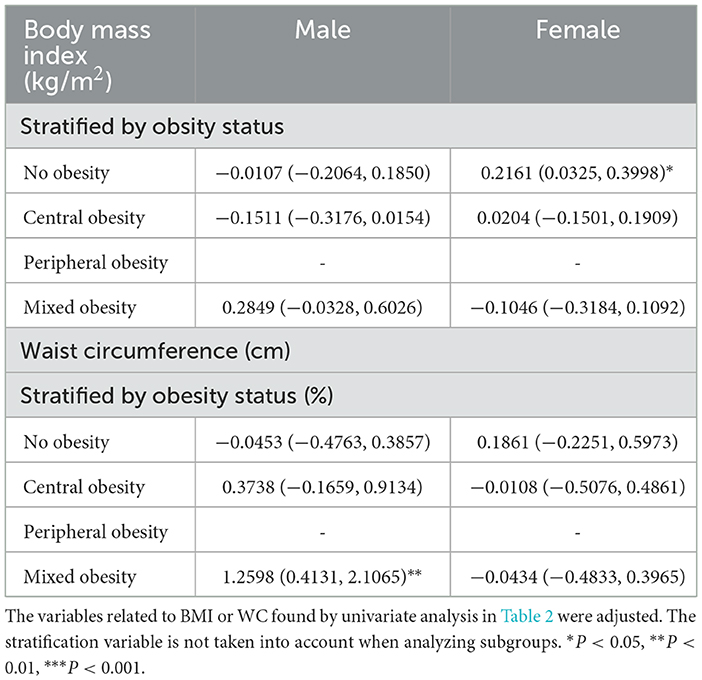
Table 7. Association among body mass index (kg/m2), waist circumference (cm), and urinary nickel (ug/L) stratified simultaneously by gender and obesity status.
Discussion
In this study, urinary nickel was evaluated concerning obesity status in the general population. Our results prove that urinary nickel positively correlates with BMI and WC among adult males but not females. In previous studies, heavy metal pollution is a significant cause of chronic inflammation and oxidative stress, of which nickel occupies a large part (31). Chronic inflammation and oxidative stress can destroy the normal function of cells by interacting. The effects lead to symptoms such as weight gain or loss, decreased libido, physical pain, and emotional disorder, which pose a significant threat to health and lead to chronic inflammatory diseases, including obesity, diabetes, and cancer (32).
Several studies support our findings. Pokorska-Niewiada et al. showed that trace element disturbances, including nickel, can increase body mass index and contribute to endocrine disorders (33). A study from Spain found that the trace element nickel in fat is the highest, highlighting the potential role of nickel in obesity and obesity-related diseases (34). Another study from Turkey directly shows a positive correlation between BMI and nickel (35). The results of Yang et al. proved that men exposed to nickel were more prone to dyslipidemia and BMI ≥ 25 (36). In addition, when Cortés et al. studied the relationship between heavy metal exposure and chronic disease development in Chile, introducing BMI as a variable would confuse the relationship between IL-6 and nickel and increase the impact on individual inflammatory states by 40% at the same time. This study indirectly proves that nickel levels in the urine will affect BMI (37), it indirectly proves that nickel levels in the urine will affect BMI.
When subgroup analyzes were performed, we found that urinary nickel was independently and positively associated with BMI and WC in adult men. Numerous prior research had shown that nickel exposure damages male reproductive organs, which is strongly connected to oxidative stress, DNA damage, and hormonal imbalance (38–40). One study found gender differences in the inflammatory response of mice to the lung after nickel exposure, with the male being more susceptible to acute pneumonia and subchronic lung inflammation than females by a mechanism that induces increased neutrophil by CXCL1 and IL-6/STAT3 signaling pathways and enhanced monocyte infiltration by CXCL1 and CCL2 in male (41). At present, we have not found any other strong evidence for the reason for gender difference related to this study, and we suspect that the reason for the difference may be related to the differences in hormone levels, eating habits, and work stress between men and women. Large-sample prospective studies may be needed to explore this problem.
The precise mechanism of nickel exposure in BMI and WC is still unclear, but we try to clarify it from the following aspects. Firstly, in the hypothalamus, nickel exposure harms neurological function. As a result, hypothalamic neurons degenerate, paraventricular and supraoptic nuclei are reduced, and myeloperoxidase activity, nitric oxide increase, tumor necrosis factor-α and interleukin-1β of factors that promote inflammation ascend, which will affect the endocrine axis and might lead to hormonal imbalances (42, 43); Secondly, there is the possibility that nickel can affect the hypothalamic-pituitary-thyroid axis, causing abnormal thyroid activity (44). Finally, nickel disrupts the function of insulin β cells, resulting in abnormal glucose and lipid metabolism and affecting body weight (45, 46). Nickel exposure has also been linked to diabetes in some studies (20, 47).
Heavy metal contamination is everywhere—vegetables, seafood, meat and poultry, water sources, and household products are all at risk of exceeding heavy metal levels. Long-term nickel exposure causes irreparable harm to human system functioning, yet using nickel-related items in the medical, commercial, and industrial sectors continues to grow fast. The national legislature should reinforce and enhance the pertinent laws and regulations to minimize heavy metal contamination. Our study demonstrated a significant association between nickel exposure and BMI and WC in males, and men with long-term nickel exposure must pay particular attention to this health risk. In addition, the mechanism through which nickel exposure lowers male sperm quality is conclusive, and men with reproductive needs should avoid nickel-related industries. We appeal to the public to reduce exposure to heavy metals, especially nickel.
As a result of the large sample size, valid subgroup analyses were possible. However, some limitations need attention. In terms of screening for overweight and obesity, BMI and WC are highly specific, but they are less sensitive when used to identify adiposity due to their inability to discern fat distribution accurately; higher visceral fat is far more harmful than more fat in areas such as the thighs, and therefore may incorrectly classify a person as unhealthy or at a high-risk category for disease (48). Likewise, a higher BMI may also be induced by increased muscle mass, which may not always indicate obesity (49). Additionally, these two indicators do not account for a multiplicity of characteristics like gender and age. It is well-known that men and women have varying quantities of muscle, which might alter the final indicator findings. Individuals with a high percentage of body fat may create more angiotensin and aldosterone, while muscle does not (50).
Conclusions
In adult males, both BMI and WC were positively associated with urinary nickel. It is essential for adult men, especially those who are already obese, to reduce their nickel exposure. With the continued growth of nickel applications, nickel-related research will be expanded in the future, and our study may give suggestions for future studies in some specific aspects. Meanwhile, there is a need for further research to understand how urinary nickel might influence BMI and WC.
Data availability statement
The original contributions presented in the study are publicly available. This data can be found here: www.cdc.gov/nchs/nhanes/.
Ethics statement
Participation in the study was voluntary, and National Center for Health Statistics Research Ethics Review Board approved the study's conduct. To protect everyone's privacy, NHANES will anonymize collected data before making it public as public data. It is our agreement to follow all guidelines for using NHANES data for research purposes, as well as comply with all applicable standards and laws. The patients/participants provided their written informed consent to participate in this study.
Author contributions
Conceptualization: H-LL, D-LL, and S-FC. Methodology and Writing—review and editing: G-XW. Software: B-LH. Formal analysis: G-XW and B-LH. Writing—original draft preparation: B-LH. Visualization: J-TL and Z-BF. Supervision: L-YF, H-XZ, H-LL, D-LL, and S-FC. Funding acquisition: S-FC. All authors have read and agreed to the published version of the manuscript.
Funding
This study was funded by the National Natural Science Foundation of China (No. 82104759) and the Natural Science Foundation of Guangdong Provincial (No. 2019A1515110108).
Acknowledgments
The author acknowledges the Department of Endocrinology, Shenzhen Traditional Chinese Medicine Hospital, Shenzhen, Guangdong, China.
Conflict of interest
The authors declare that the research was conducted in the absence of any commercial or financial relationships that could be construed as a potential conflict of interest.
Publisher's note
All claims expressed in this article are solely those of the authors and do not necessarily represent those of their affiliated organizations, or those of the publisher, the editors and the reviewers. Any product that may be evaluated in this article, or claim that may be made by its manufacturer, is not guaranteed or endorsed by the publisher.
References
1. Yap CK, Al-Mutairi KA. Comparative study of potentially toxic nickel and their potential human health risks in seafood (fish and mollusks) from peninsular Malaysia. Biology. (2022) 11:376. doi: 10.3390/biology11030376
2. Qiao S, Sun Y, Jiang Y, Chen X, Cai J, Liu Q, et al. Melatonin relieves liver fibrosis induced by Txnrd3 knockdown and nickel exposure via IRE1/NF-kB/NLRP3 and PERK/TGF-β1 axis activation. Life Sci. (2022) 301:120622. doi: 10.1016/j.lfs.2022.120622
3. Yokoi K, Uthus EO, Penland JG, Nielsen FH. Effect of dietary nickel deprivation on vision, olfaction, and taste in rats. J Trace Elem Med Biol. (2014) 28:436–40. doi: 10.1016/j.jtemb.2014.07.014
4. Pieczyńska J, Płaczkowska S, Sozański R, Skórska K, Sołtysik M. Effect of nickel on red blood cell parameters and on serum vitamin B12, folate and homocysteine concentrations during pregnancy with and without anemia. J Trace Elem Med Biol. (2021) 68:126839. doi: 10.1016/j.jtemb.2021.126839
5. Alfano M, Cavazza C. Structure, function, and biosynthesis of nickel-dependent enzymes. Protein Sci. (2020) 29:1071–89. doi: 10.1002/pro.3836
6. Genchi G, Carocci A, Lauria G, Sinicropi MS, Catalano A. Nickel: human health and environmental toxicology. IJERPH. (2020) 17:679. doi: 10.3390/ijerph17030679
7. Li H, Wan Y, Chen X, Cheng L, Yang X, Xia W, et al. multiregional survey of nickel in outdoor air particulate matter in China: Implication for human exposure. Chemosphere. (2018) 199:702–8. doi: 10.1016/j.chemosphere.2018.01.114
8. Cubadda F, Iacoponi F, Ferraris F, D'Amato M, Aureli F, Raggi A, et al. Dietary exposure of the Italian population to nickel: The national Total Diet Study. Food Chem Toxicol. (2020) 146:111813. doi: 10.1016/j.fct.2020.111813
9. Ahlström MG, Thyssen JP, Wennervaldt M, Menné T, Johansen JD. Nickel allergy and allergic contact dermatitis: A clinical review of immunology, epidemiology, exposure, and treatment. Contact Dermatitis. (2019) 81:227–41. doi: 10.1111/cod.13327
10. Pavesi T, Moreira JC. A comprehensive study of nickel levels in everyday items in Brazil. Contact Dermatitis. (2020) 83:88–93. doi: 10.1111/cod.13534
11. Saylor DM, Craven BA, Chandrasekar V, Simon DD, Brown RP, Sussman EM. Predicting patient exposure to nickel released from cardiovascular devices using multi-scale modeling. Acta Biomater. (2018) 70:304–14. doi: 10.1016/j.actbio.2018.01.024
12. Shi Q, Wang Y, Hao Q, Vandvik PO, Guyatt G, Li J, et al. Pharmacotherapy for adults with overweight and obesity: a systematic review and network meta-analysis of randomised controlled trials. Lancet. (2022) 399:259–69. doi: 10.1016/S0140-6736(21)01640-8
13. Sun X, Yan AF, Shi Z, Zhao B, Yan N, Li K, et al. Health consequences of obesity and projected future obesity health burden in China. Obesity (Silver Spring). (2022) 30:1724–51. doi: 10.1002/oby.23472
14. Nunan E, Wright CL, Semola OA, Subramanian M, Balasubramanian P, Lovern PC, et al. Obesity as a premature aging phenotype—implications for sarcopenic obesity. GeroScience. (2022) 44:1393–405. doi: 10.1007/s11357-022-00567-7
15. Foti K, Hardy ST, Chang AR, Selvin E, Coresh J, Muntner P, et al. and blood pressure control among United States adults with hypertension. J Hypertens. (2022) 40:741–8. doi: 10.1097/HJH.0000000000003072
16. Gallagher EJ, LeRoith D. Obesity and cancer. Cancer Metastasis Rev. (2022) 41:463–4. doi: 10.1007/s10555-022-10049-z
17. Ferrara-Cook C, Geyer SM, Evans-Molina C, Libman IM, Becker DJ, Gitelman SE, et al. the Type 1 Diabetes TrialNet Study Group. Excess BMI accelerates islet autoimmunity in older children and adolescents. Diabetes Care. (2020) 43:580–7. doi: 10.2337/dc19-1167
18. Stefan N, Birkenfeld AL, Schulze MB. Global pandemics interconnected — obesity, impaired metabolic health and COVID-19. Nat Rev Endocrinol. (2021) 17:135–49. doi: 10.1038/s41574-020-00462-1
19. Cai Z, Yang Y, Zhang J. Obesity is associated with severe disease and mortality in patients with coronavirus disease 2019 (COVID-19): a meta-analysis. BMC Public Health. (2021) 21:1505. doi: 10.1186/s12889-021-11546-6
20. Shan S, Wang K, Hu C, Dai L. Urinary Nickel Was Associated with the Prevalence of Diabetes: Results from NHANES. Biol Trace Elem Res. (2022) 201:611–6. doi: 10.1007/s12011-022-03190-x
21. Liu Y, Wu M, Xu B, Kang L. Association between the urinary nickel and the diastolic blood pressure in general population. Chemosphere. (2022) 286:131900. doi: 10.1016/j.chemosphere.2021.131900
22. Rohm TV, Meier DT, Olefsky JM, Donath MY. Inflammation in obesity, diabetes, and related disorders. Immunity. (2022) 55:31–55. doi: 10.1016/j.immuni.2021.12.013
23. Ng CD, Elliott MR, Riosmena F, Cunningham SA. Beyond recent BMI: BMI exposure metrics and their relationship to health. SSM Popul Health. (2020) 11:100547. doi: 10.1016/j.ssmph.2020.100547
24. Moltrer M, Pala L, Cosentino C, Mannucci E, Rotella CM, Cresci B. Body mass index (BMI), waist circumference (WC), waist-to-height ratio (WHtR) e waist body mass index (wBMI): Which is better? Endocrine. (2022) 76:578–83. doi: 10.1007/s12020-022-03030-x
25. Liu B, Du Y, Wu Y, Snetselaar LG, Wallace RB, Bao W. Trends in obesity and adiposity measures by race or ethnicity among adults in the United States 2011-18: population based study. BMJ. (2021) 2021:n365. doi: 10.1136/bmj.n365
26. Ross R, Neeland IJ, Yamashita S, Shai I, Seidell J, Magni P., Cuevas A, Hu FB, et al. Waist circumference as a vital sign in clinical practice: a Consensus Statement from the IAS and ICCR Working Group on Visceral Obesity. Nat Rev Endocrinol. (2020) 16:177–89. doi: 10.1038/s41574-019-0310-7
27. National Center for Health Statistics. UTAS-J-UCM-J-UNI-J-MET-508. (2018). Available online at: https://wwwn.cdc.gov/nchs/data/nhanes/2017-2018/labmethods/UTAS-J-UCM-J-UNI-J-MET-508.pdf (accessed September 15, 2022).
28. Owolabi EO, Ter Goon D, Adeniyi OV. Central obesity and normal-weight central obesity among adults attending healthcare facilities in Buffalo City Metropolitan Municipality, South Africa: a cross-sectional study. J Health Popul Nutr. (2017) 36:54. doi: 10.1186/s41043-017-0133-x
29. World Health Organization. Waist circumference and waist-hip ratio: report of a WHO expert consultation, Geneva. (2011) (accessed on December 8–11, 2008).
30. National Center for Health Statistics (U.S.) ed. National health and nutrition examination survey: analytic guidelines, 1999-2010. Hyattsville, Maryland: U.S. Department of Health and HumanServices, Centers for Disease Control and Prevention, National Center for Health Statistics (2013). 16 p.
31. Nassan FL, Wang C, Kelly RS, Lasky-Su JA, Vokonas PS, Koutrakis P. Schwartz JD. Ambient PM25 species and ultrafine particle exposure and their differential metabolomic signatures. Environ Int. (2021) 151:106447. doi: 10.1016/j.envint.2021.106447
32. Furman D, Campisi J, Verdin E, Carrera-Bastos P, Targ S, Franceschi C, et al. Chronic inflammation in the etiology of disease across the life span. Nat Med. (2019) 25:1822–32. doi: 10.1038/s41591-019-0675-0
33. Pokorska-Niewiada K, Brodowska A, Brodowski J, Szczuko M. Levels of trace elements in erythrocytes as endocrine disruptors in obese and nonobese women with polycystic ovary syndrome. IJERPH. (2022) 19:976. doi: 10.3390/ijerph19020976
34. Freire C, Vrhovnik P, Fiket Ž, Salcedo-Bellido I, Echeverría R, Martín-Olmedo P, et al. Adipose tissue concentrations of arsenic, nickel, lead, tin, and titanium in adults from GraMo cohort in Southern Spain: An exploratory study. Sci Total Environ. (2020) 719:137458. doi: 10.1016/j.scitotenv.2020.137458
35. Cetin I, Nalbantcilar MT, Tosun K, Nazik A. How trace element levels of public drinking water affect body composition in Turkey. Biol Trace Elem Res. (2017) 175:263–70. doi: 10.1007/s12011-016-0779-z
36. Yang AM, Bai YN, Pu HQ, Zheng TZ, Cheng N, Li JS Li HY, et al. Prevalence of metabolic syndrome in Chinese nickel-exposed workers. Biomed Environ Sci. (2014) 27:475–7. doi: 10.3967/bes2014.077
37. Singh M, Verma Y, Rana SVS. Attributes of oxidative stress in the reproductive toxicity of nickel oxide nanoparticles in male rats. Environ Sci Pollut Res. (2022) 29:5703–17. doi: 10.1007/s11356-021-15657-w
38. Sun H, Wu W, Guo J, Xiao R, Jiang F, Zheng L, et al. Effects of nickel exposure on testicular function, oxidative stress, and male reproductive dysfunction in Spodoptera litura Fabricius. Chemosphere. (2016) 148:178–87. doi: 10.1016/j.chemosphere.2015.10.068
39. Rizvi A, Parveen S, Khan S, Naseem I. Nickel toxicology with reference to male molecular reproductive physiology. Reprod Biol. (2020) 20:3–8. doi: 10.1016/j.repbio.2019.11.005
40. You DJ, Lee HY, Taylor-Just AJ, Linder KE, Bonner JC. Sex differences in the acute and subchronic lung inflammatory responses of mice to nickel nanoparticles. Nanotoxicology. (2020) 14:1058–81. doi: 10.1080/17435390.2020.1808105
41. Cortés S, Zúñiga-Venegas L, Pancetti F, Covarrubias A, Ramírez-Santana M, Adaros H, et al. Positive relationship between exposure to heavy metals and development of chronic diseases: a case study from Chile. IJERPH. (2021) 18:1419. doi: 10.3390/ijerph18041419
42. Adedara IA, Abiola MA, Adegbosin AN, Odunewu AA. Farombi EO. Impact of binary waterborne mixtures of nickel and zinc on hypothalamic-pituitary-testicular axis in rats. Chemosphere. (2019) 237:124501. doi: 10.1016/j.chemosphere.2019.124501
43. Risi R, Masieri S, Poggiogalle E, Watanabe M, Caputi A, Tozzi R, et al. Nickel Sensitivity Is Associated with GH-IGF1 Axis Impairment and Pituitary Abnormalities on MRI in Overweight and Obese Subjects. IJMS. (2020) 21:9733. doi: 10.3390/ijms21249733
44. Yang J, Ma Z. Research progress on the effects of nickel on hormone secretion in the endocrine axis and on target organs. Ecotoxicol Environ Saf. (2021) 213:112034. doi: 10.1016/j.ecoenv.2021.112034
45. Chen YW, Yang CY, Huang CF, Hung DZ, Leung YM, Liu SH. Heavy metals, islet function and diabetes development. Islets. (2009) 1:169–76. doi: 10.4161/isl.1.3.9262
46. Xu X, Rao X, Wang T-Y, Jiang SY, Ying Z, Liu C, Maiseyeu A, et al. Effect of co-exposure to nickel and particulate matter on insulin resistance and mitochondrial dysfunction in a mouse model. Part Fibre Toxicol. (2012) 9:40. doi: 10.1186/1743-8977-9-40
47. Titcomb TJ, Liu B, Lehmler H, Snetselaar LG, Bao W. Environmental nickel exposure and diabetes in a nationally representative sample of US adults. Expo Health. (2021) 13:697–704. doi: 10.1007/s12403-021-00413-9
48. Pyo JY, Ahn SS, Lee LE, Song JJ, Park Y, Lee S. New body mass index for predicting prognosis in patients with antineutrophil cytoplasmic antibody-associated vasculitis. Clin Labor Anal. (2022) 36:e24357. doi: 10.1002/jcla.24357
49. Anyzewska A, Lakomy R, Lepionka T, Szarska E, Maculewicz E, Bolczyk I. Tomczak A, Bertrandt J. Nutritional status assessment of the Polish Border Guards officers—Body Mass Index or Fat Mass Index? Proc Nutr Soc. (2020) 79:E385. doi: 10.1017/S002966512000333X
Keywords: urinary nickel, obesity, body mass index, waist circumference, NHANES
Citation: Wang G-X, Huang B-L, Li J-T, Fang Z-B, Feng L-Y, Zhao H-X, Chu S-F, Liu D-L and Li H-L (2023) Association between urinary nickel with obesity status in adults: A cross-sectional study. Front. Public Health 11:1094062. doi: 10.3389/fpubh.2023.1094062
Received: 09 November 2022; Accepted: 31 January 2023;
Published: 17 February 2023.
Edited by:
Gangqiang Ding, National Institute for Nutrition and Health, ChinaReviewed by:
Pengkun Song, National Institute for Nutrition and Health, ChinaJinjian Chen, The Chinese University of Hong Kong, China
Copyright © 2023 Wang, Huang, Li, Fang, Feng, Zhao, Chu, Liu and Li. This is an open-access article distributed under the terms of the Creative Commons Attribution License (CC BY). The use, distribution or reproduction in other forums is permitted, provided the original author(s) and the copyright owner(s) are credited and that the original publication in this journal is cited, in accordance with accepted academic practice. No use, distribution or reproduction is permitted which does not comply with these terms.
*Correspondence: Hui-Lin Li,  c3p0Y21saGxAMTYzLmNvbQ==; De-Liang Liu, ZGwyNTgwQGd6dWNtLmVkdS5jbg==; Shu-Fang Chu, Y2h1c2h1ZmFuZ2d6aHRlbUAxNjMuY29t
†These authors have contributed equally to this work and share first authorship