 Xiyan Zhang1,2
 Genming Zhao3
 Jun Ma4
 Fangbiao Tao5
 Chen-Wei Pan6Fengyun Zhang1Yan Wang1Wenyi Yang1Yao Xiang1Xin Wang1Yunfan Tian7Jie Yang1,2*
 Wei Du8*Yonglin Zhou1*ES-SCI Work Group
- 1Department of Child and Adolescent Health Promotion, Jiangsu Provincial Center for Disease Control and Prevention, Nanjing, China
- 2School of Public Health, Nanjing Medical University, Nanjing, China
- 3Department of Epidemiology, School of Public Health, Fudan University, Key Laboratory of Public Health Safety, Ministry of Education, Shanghai, China
- 4Institute of Child and Adolescent Health, School of Public Health, Peking University, Beijing, China
- 5Department of Maternal, Child and Adolescent Health, School of Public Health, Anhui Medical University, Hefei, China
- 6School of Public Health, Medical College of Soochow University, Suzhou, China
- 7Department of Cardiology, The First Affiliated Hospital of Nanjing Medical University, Nanjing, China
- 8School of Public Health, Southeast University, Nanjing, China
Purpose: To describe the study design, methodology, and cohort profile of the Eastern China Student Health and Wellbeing Cohort Study. The cohort baseline includes (1) targeted disease (myopia, obesity, elevated blood pressure, and mental health) and (2) exposures (individual behaviors, environment, metabolomics, and gene and epigenetics).
Participants: Annual physical examination, questionnaire-based survey, and bio-sampling have been carried out in the study population. In the first stage (2019–2021), a total of 6,506 students in primary schools are enrolled in the cohort study.
Findings to date: Of all the cohort participants, the ratio of male to female is 1.16 among a total of 6,506 student participants, of which 2,728 (41.9%) students are from developed regions and 3,778 (58.1%) students are from developing regions. The initial age of observation is 6–10 years, and they will be observed until they graduate from high school (>18 years of age). (1) Targeted diseases: The growth rates of myopia, obesity, and high blood pressure vary by regions, and for developed regions, the prevalence of myopia, obesity, and elevated blood pressure is 29.2%, 17.4%, and 12.6% in the first year, respectively. For developing regions, the prevalence of myopia, obesity, and elevated blood pressure is 22.3%, 20.7%, and 17.1% in the first year, respectively. The average score of CES-D is 12.9 ± 9.8 in developing regions/11.6 ± 9.0 in developed regions. (2) Exposures: ① The first aspect of individual behaviors: the questionnaire topics include diet, physical exercise, bullying, and family. ② The second aspect of environment and metabolomics: the average desk illumination is 430.78 (355.84–611.56) LX, and the average blackboard illumination is 365.33 (286.83–516.84) LX. Metabolomics like bisphenol A in the urine is 0.734 ng/ml. ③ The third aspect of gene and epigenetics: SNPs (rs524952, rs524952, rs2969180, rs2908972, rs10880855, rs1939008, rs9928731, rs72621438, rs9939609, rs8050136 and so on) are detected.
Future plans: Eastern China Student Health and Wellbeing Cohort Study is aiming to focus on the development of student-targeted diseases. For children with student common diseases, this study will focus on targeted disease-related indicators. For children without targeted disease, this study aims to explore the longitudinal relationship between exposure factors and outcomes, excluding baseline confounding factors. Exposure factors include three aspects: (1) individual behaviors, (2) environment and metabolomics, and (3) gene and epigenetics. The cohort study will continue until 2035.
Introduction
The newly established WHO–UNICEF–Lancet Commission has raised the concern of urgent investment in children to achieve the Sustainable Development Goals (SDGs) (1, 2). Previous studies reported that the burden of chronic diseases among children and adolescents is rising remarkably in recent decades in China (3–10). In 2019, the central government released the Healthy China action (2019–2030), with outlines specifically addressing student myopia, obesity, blood pressure, and psychological indicators for evaluation (11).
The Eastern-Chinese Students common disease Surveillance, Cohort, and Intervention study (ES-SCI study) cohort section (Eastern China Student Health and Wellbeing Cohort Study) is launched to investigate how the health and wellbeing of students would be impaired or improved via the cohort approaches. We focus on targeted diseases concerning student common diseases (myopia, obesity, elevated blood pressure, and mental health). First, myopia is one of the most commonly observed diseases among eastern Chinese children and adolescents, and the occurrence of myopia in childhood is highly indicative of myopia in adulthood (12–14). While childhood diseases such as myopia are often irreversible (7), early identification and intervention on modifiable risk factors would potentially reduce the healthcare burden in their adulthood. Therefore, a prospective cohort has been established, similar to previous studies tracking the study population to quantify a range of exposure-outcome associations (15, 16). Meanwhile, the screening and prevention strategies for myopia and the intervention approaches based on follow-up observations of the cohort will also be proposed. A similar school-based cohort study of myopia (cycloplegia) is rare in China. The Tianjin group conducted a non-cycloplegic photo screening study aiming to monitor the progression of refractive error for the same non-cycloplegic population (17). The Anyang Childhood Eye Study is designed to explore the clinical treatment of children’s ophthalmopathy (18). Adding to the literature, the current ES-SCI study focuses on the course of myopia development, taking into account other potentially concurrent common diseases in students. In 2018, the central government issued an implementation plan for comprehensive prevention and control of myopia among children and adolescents (19). The document highlights that, by 2030, the incidence rate of myopia among children and adolescents in China should be significantly reduced, as well as the overall level of vision health of children and adolescents should be significantly improved (20). Second, childhood obesity has become an increasing concern in many countries including China (21). Located in eastern China, Jiangsu Province is one of the developed regions in China and is also facing this problem. The prevalence of combined overweight and obesity was still maintained at a high level from the previous study in Eastern China. Previously, we found that the prevalence of overweight, obesity, and combined overweight and obesity was 15.6% [95% CI 15.1–16.0%], 11.1% (95% CI 10.7–11.4%), and 26.6% (95% CI 26.1–27.2%), respectively, for female students; and 20.3% (95% CI 19.8–20.8%), 18.8% (95% CI 18.3–19.2%), and 39.1% (95% CI 38.5–39.7%), respectively, for male students. Cohort studies focusing on childhood overweight and obesity should be highlighted in eastern China. Third, China is one of the world’s largest developing countries with a population of 1.37 billion, and while the prevalence of elevated blood pressure has been stable among Chinese children, this has become an increasing concern recently (22). Previously, we found that the burden of elevated blood pressure for both female and male students in eastern China was substantially heavy (above the average level among Chinese adolescents). The prevalence of overweight and obesity among primary school children was 15.2% (18.7% for male students and 11.0% for female students) and 11.7% (14.5% for male students and 8.2% for female students), respectively. Potential risk factors can be body status, behaviors and environment. Further cohort study should be taken on (23). Fourth, China Youth Development Statistics Report (2020) shows that about 30 million children and adolescents aged 17 years and under are troubled by various mental health problems. Primary and secondary school students are in the period of physical and mental development, and their mental sub-health status is particularly noteworthy.
Based on targeted diseases (myopia, obesity, blood pressure, and mental health), this study is designed to observe three major aspects of common diseases in the student participants. Measures for both outcomes and exposures will be carried out at baseline and during the follow-up period for quantifying their associations in children and adolescents. The first aspect of individual behaviors and physical growth: Physical growth in children and adolescents and corresponding behaviors, such as diet, physical fitness, and psychological status, all have a substantial association with students’ health. Students are vulnerable and deserve special attention on diets because adult health can be affected by nutrition during adolescence (24). Physical growth assessment is a good approach to evaluating students’ health, and perhaps indirectly reflects the socioeconomic status of the family, the social wellbeing of the community, and the efficiency of the healthcare system (25, 26). We are intending to explore the correlation between behaviors and targeted disease-related indicators through long-term observation. The second aspect of Environment and metabolomics: Environment factors, such as family type/structure, parental education, and the economic level can have an impact on children and adolescents (27–29). Metabolomics could be a powerful approach to childhood health, measuring the exact functioning of individual metabolic responses to environmental changes, diseases, and other epigenetic factors (30). For example, Biphenyl A (BPA) is suspected to be associated with obesity in students, with a 1-ng/ml increase in BPA can increase the risk of obesity by 11% (31, 32). In this study, we are aiming to collect biological samples to explore the relationship between metabolites and targeted diseases and related indicators. The third aspect of gene and epigenetics: Nature versus nurture has been a frequently debated topic in recent decades. Epigenetics or gene–environment interactions are used to identify candidate biomarkers to assess determinants of common student diseases (33, 34). However, we still know limited about gene–environment interactions in genetic and biological systems concerning students’ common diseases. ES-SCI studies are planning to explore the association between targeted gene–environment interaction-related SNPs and disease.
The overarching aim of the Eastern China Student Health and Wellbeing Cohort Study is, first, to describe the fundamental methodology and to summarize the baseline findings for the cohort (targeted diseases such as myopia, obesity, overweight, elevated blood pressure, mental health, and related indicators). Second, to quantify associations between targeted diseases as well as related indicators and three exposure aspects referred earlier and to develop a suite of multidimensional risk assessment tools for diseases commonly seen in children. Third, to provide evidence for intervention strategies to reduce disease burden in students, as well as to improve the health and wellbeing of school-aged children in Jiangsu, China.
Methods and analysis
Cohort participants
(1) Sample size calculation
Considering the expected prevalence of targeted disease, expected risk ratio (RR) of exposures from three aspects (individual behaviors, environment and metabolomics, and gene and epigenetics), and students clustered in schools, we assumed parameters for sample size estimation. Based on previous surveillance results in Jiangsu Province in 2018, the expected prevalences of the targeted diseases are as follows: (1) myopia = 18.2%; (2) obesity = 8.15%; (3) elevated blood pressure = 8.0%; and (4) screening mental health (depression) = 8.05%; the expected RRs of three aspects are above 1.5, α = 0.05 (significance level of 0.05, μα = 1.96), β = 0.10 (minimum power of 90%), and design effect is 1.5, allowing for a possible 15% loss to follow-up for reasons such as moving out of the study locations, and therefore, we derived a conservative total sample of 4,154 students from grade 1 to grade 3. We have recruited around 6,506 students for the ES-SCI study eventually.
(2) Inclusion and exclusion criteria: ① Chinese Han Nationality students, aged 6 to 10 years from grades 1 to 3; ② without any other severe diseases, such as hepatitis, nephritis, and eye disease; ③ provision of informed consent from parents/guardians; and ④ school-based participant to prevent loss of visit.
Study design and area
We employed a longitudinal design in the Eastern China Student Health and Wellbeing Cohort Study, which randomly selected multiple schools from Peicounty, Yizheng, and Changshu. All these municipalities are located in geographically clustered Jiangsu Province of eastern China, which covers approximately 10% of China’s total land area, comprises 30% of China’s population, and contributes to 40% of China’s GDP. Each of these municipalities represents a distinctive level of socioeconomic development, i.e., developed region (34): Public budget revenue>5 billion RMB, such as Changshu (advanced-developed city) and Dongtai (steady-developed city); and developing region: Public budget revenue<5 billion RMB, such as Peicounty (rapid-developing city) and Yizheng (steady-developing city) (Figures 1 and 2).
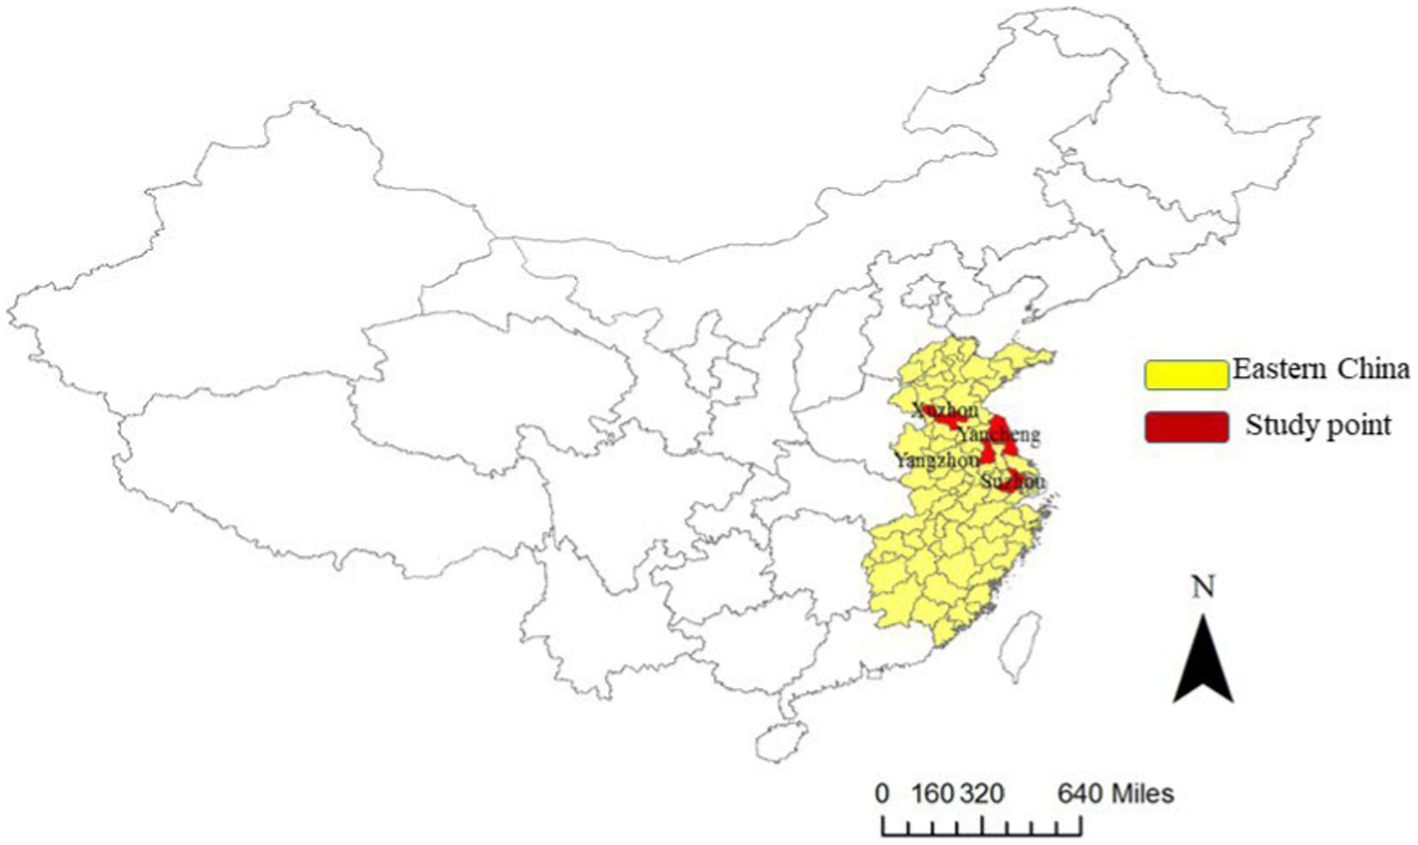
Figure 1. Map of China and the location of the Eastern China Student Health and Wellbeing Cohort Study, including Pei county, Yizheng city, Changshu city, and Dongtai city.
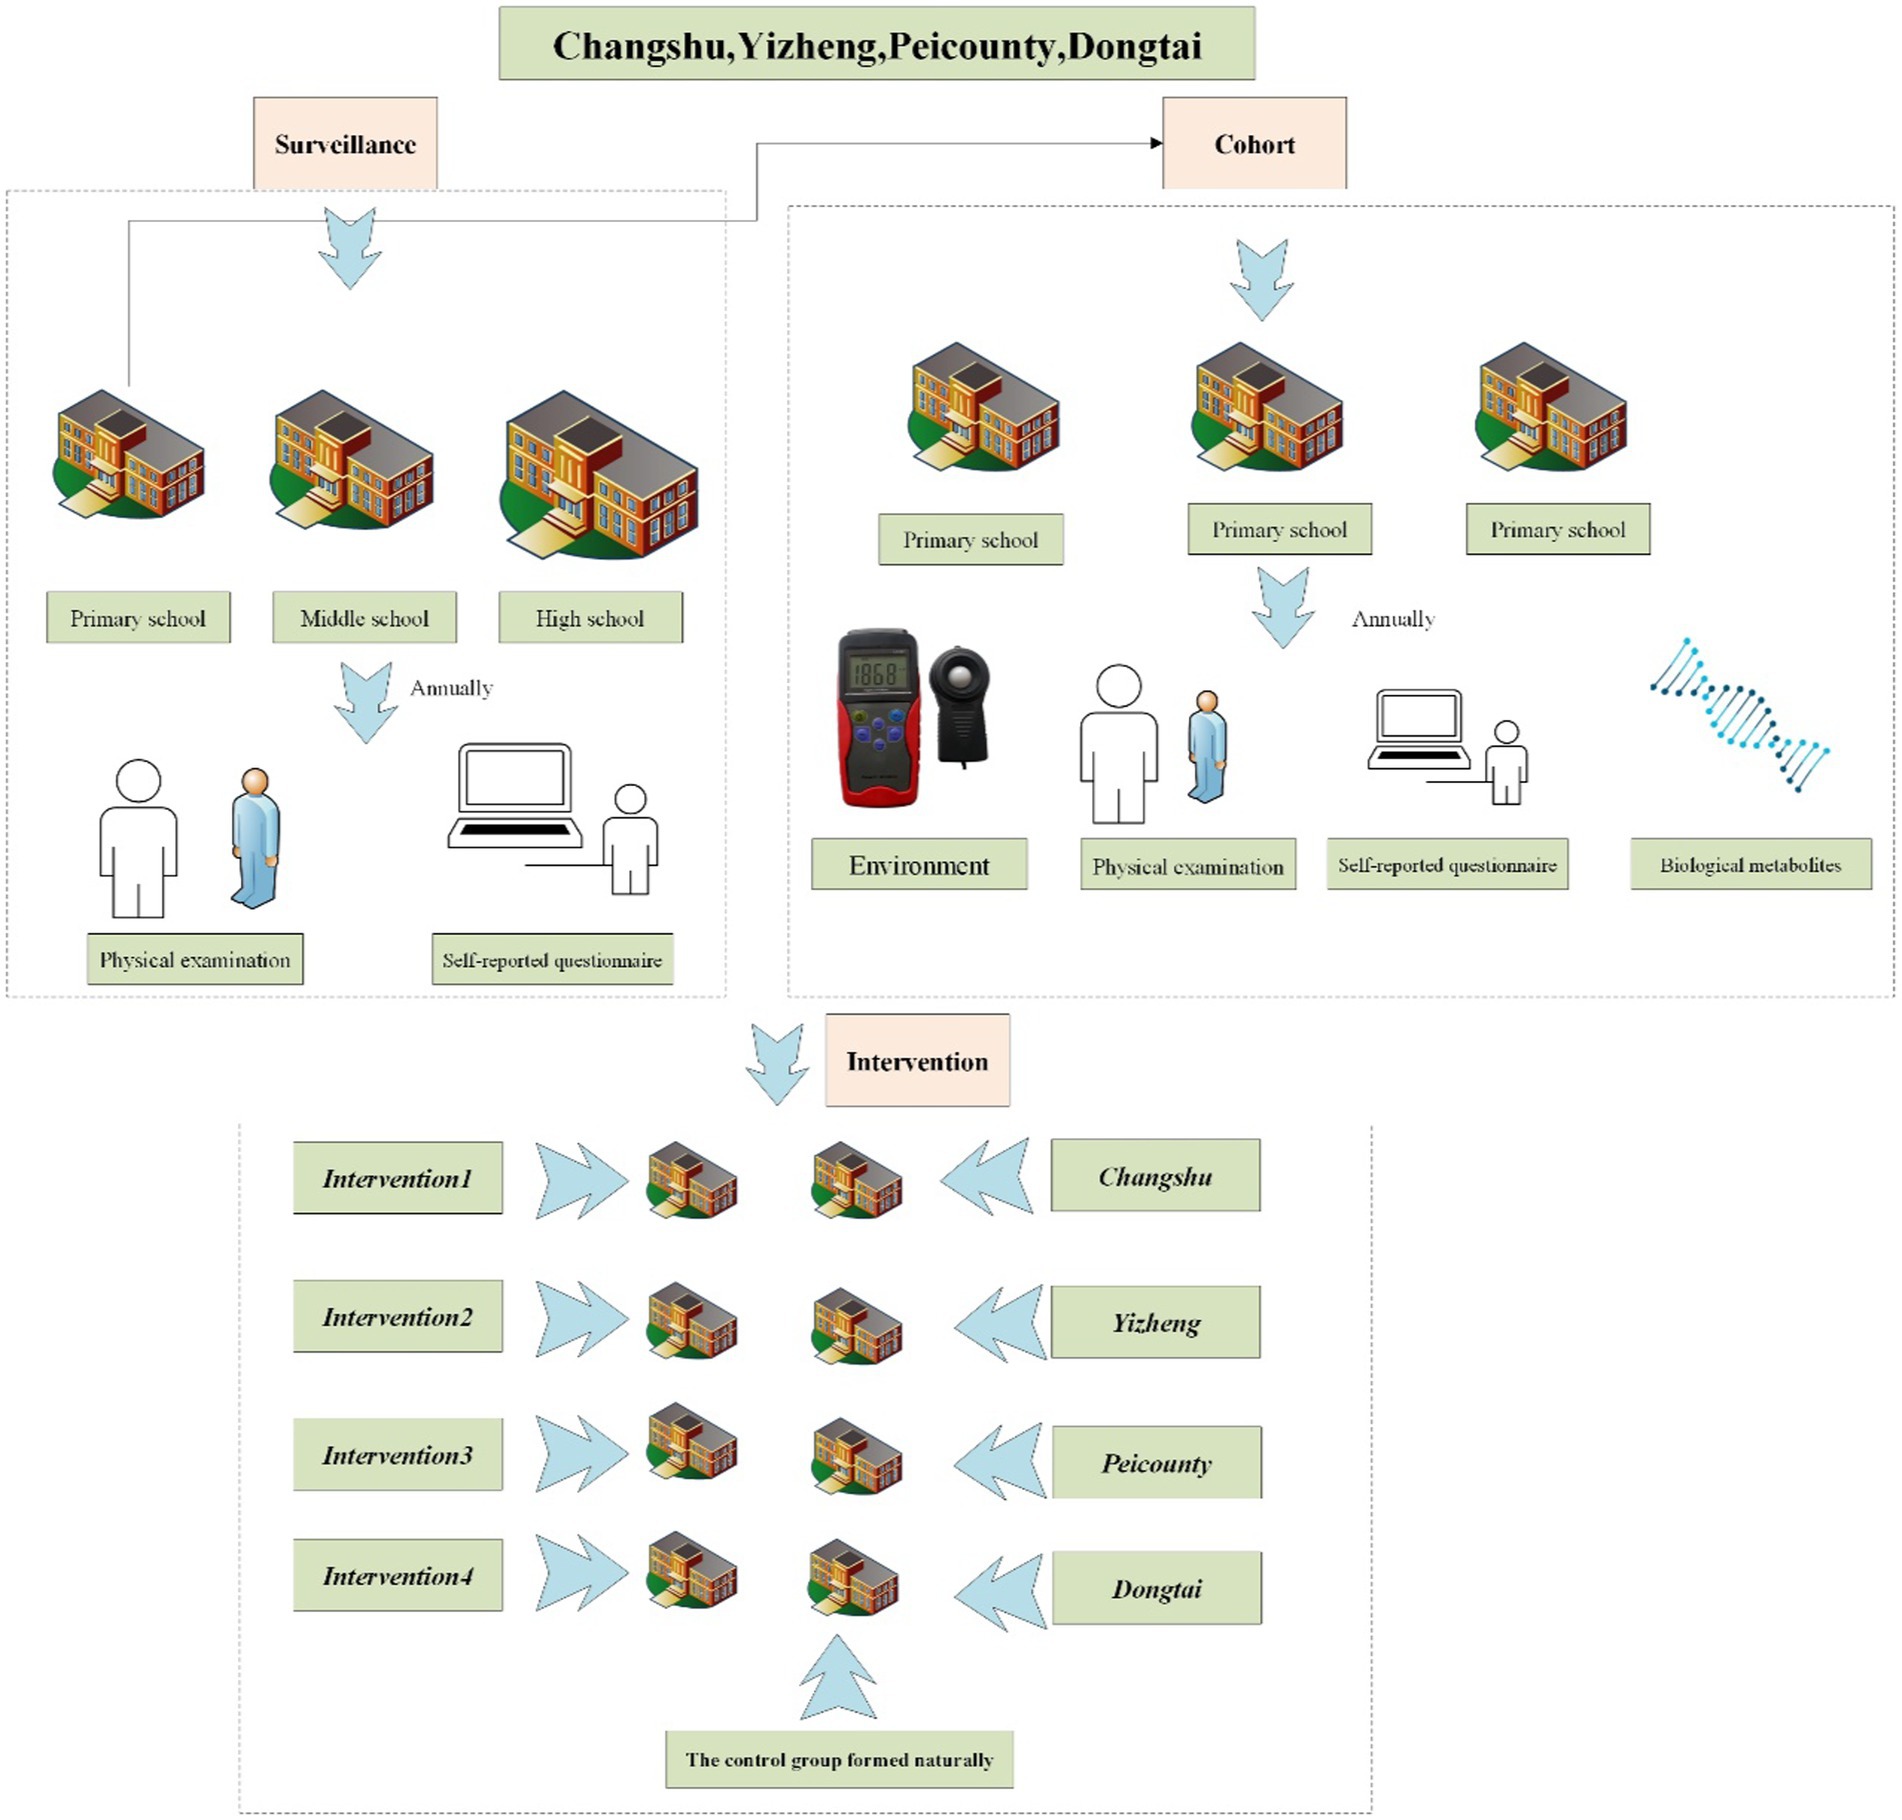
Figure 2. The flowchart of the organization, management, and implementation in the ES-SCI Study (Eastern Chinese Students common disease Surveillance, Cohort, and Intervention study).
How often have they been followed Up?
Eastern China Student Health and Wellbeing Cohort Study was launched in 2019 and will be followed up once a year. This is a dynamic cohort study conducted by Jiangsu Provincial Center for Disease Control and Prevention focusing on public health applications. Every 3 years is a stage, and an assessment will be made. The first stage is 2019–2021 and the next stage is 2022–2024. While 9-year-olds may exit the cohort in 3 years when most of them will graduate from primary school, new batches of students will enter the cohort after graduation from pre-school. We collected cohort information every year and integrated it into routine CDC work.
What Has been measured?
(1) Outcomes-targeted disease:
① Definitions: Myopia was defined as −0.50 diopters (D) in the worse eye, which was defined as the eye with worse eye (35). Significant anisometropia was defined as a spherical equivalent, an interocular difference of ≥1.00 D. Astigmatism was reported as negative cylinder refraction of ≥1.00 DC (36). Pre-myopia was defined according to a combination of baseline refraction (a refractive state of an eye of 0.75 D and > −0.50 D in children), age, and other quantifiable risk factors demonstrating a sufficient likelihood of the future development of myopia to merit preventative interventions (37). Overweight and obesity were defined by the Screening for overweight and obesity among school-age children and adolescents (WST586-2018) and BMI is specified as weight in kilograms divided by height in meters squared (38). Malnutrition was defined by the value of BMI, and a specific definition can be referred to Screening standard for malnutrition of school-age children and adolescents (WS/T 456–2014) (39). Elevated blood pressure was defined using the National Blood Pressure Reference for Chinese Han Children and Adolescents (CCBP) thresholds, i.e., ≥95th percentile as elevated BP (40). The Center for Epidemiologic Studies Depression (CES-D) Scale contains 20 items about symptoms that occurred in the week before the interview with response options from 0 to 3 that refer to the frequency of the symptoms. The score ranges between 0 (best possible) and 60 (worst) and the cutoff point that has been typically recommended for depression is 16 (41).
② Annual physical examination: Doctors in local hospitals are responsible for the physical examination of students. (1) Ophthalmic measurement: Students have participated in an ophthalmic examination with an auto-refractor (Topcon KR-800) applied with cycloplegia. The cycloplegic refraction is measured using tropicamide phenylephrine eye drops (mydrin) every 5 min, three times. Then, refractive error is measured 30 min after the first drop of tropicamide by autorefractor with five repeated measurements. (2) Height, weight, and blood pressure: Anthropometric measurements were taken to obtain data on height, weight, and blood pressure according to standard techniques (42, 43). The model of the sphygmomanometer is Omron HBP-1300. Mental health questionnaire surveys: We have employed validated survey instruments. Individuals with a score of 16 or more must have had either at least 6 of the 20 symptoms in the CES-D with persistence for most of the previous week, or a majority of the symptoms on the scale for shorter periods. CES-D literacy level has been defined as easy, and it takes between 2 and 5 min to complete (44, 45).
(2) Exposures: Individual behaviors, environment and metabolomics, and gene and epigenetics
① Questionnaire surveys: Standardized myopia questionnaire (46) and National Questionnaire on Students’ health status and Influencing factors (47) collect health-related data once a year since baseline in addition to sociodemographic data such as family type, delivery mode, house area, parental education level, and lifestyle data, such as smoking, alcohol consumption, sleep time, exposure to sunlight, exercise, and diet.
② Biological sample collection: We collect biological samples per annum including urine, saliva, and feces from 1,200 participants in the school.
③ Environment measurement: We have also measured the classroom environment indicators annually including classroom area per capita (per m2), blackboard illumination (Lx), blackboard size (m2), blackboard reflectance, uniformity of blackboard, desk illumination (lx), uniformity of class table, and level of noise (dB).
(3) Quality management and data analysis
Strict quality measures were in place including regular review of all questionnaires to enhance completion and call-back where appropriate to minimize missingness in all data fields by research assistants. Sensitive records are strictly kept confidential with restricted access to non-investigators (Supplementary Figure 1). Data mining in-depth would be conducted in subsequent research, such as crosstab analysis, regression analysis, and mediation analysis.
Findings to date
Cohort profile of the eastern China student health and wellbeing cohort study
The first follow-up was conducted in 2019 with 3,257 students from developing regions. The second follow-up was arranged in 2020 with 1 year duration with the original 3,257 students from developing regions as well as 1,643 newly added students from developed regions. The third-year follow-up was arranged in 2021 with the 1-year duration with a total of 6,506 students from the study sites (Peicounty, Yizheng, Changshu, and Dongtai). The ratio of male to female is 1.16 among a total of 6,506 student participants, of which 1,643 (25.3%) students are from Changshu, 1,762 (27.1%) students from Peicounty, 966 (14.8%) students from Yizheng, and 2,135 (32.8%) students from Dongtai. There are 464 (7.1%) 6-year-olds, 1,169 (18.0%) 7-year-olds, 1,461 (22.5%) 8-year-olds, 1,675 (25.7%) 9-year-olds, 1,120 (17.2%) 10-year-olds, 599 (9.2%) 11-year-olds, and 18 (0.3%) 12-year-olds (Table 1).
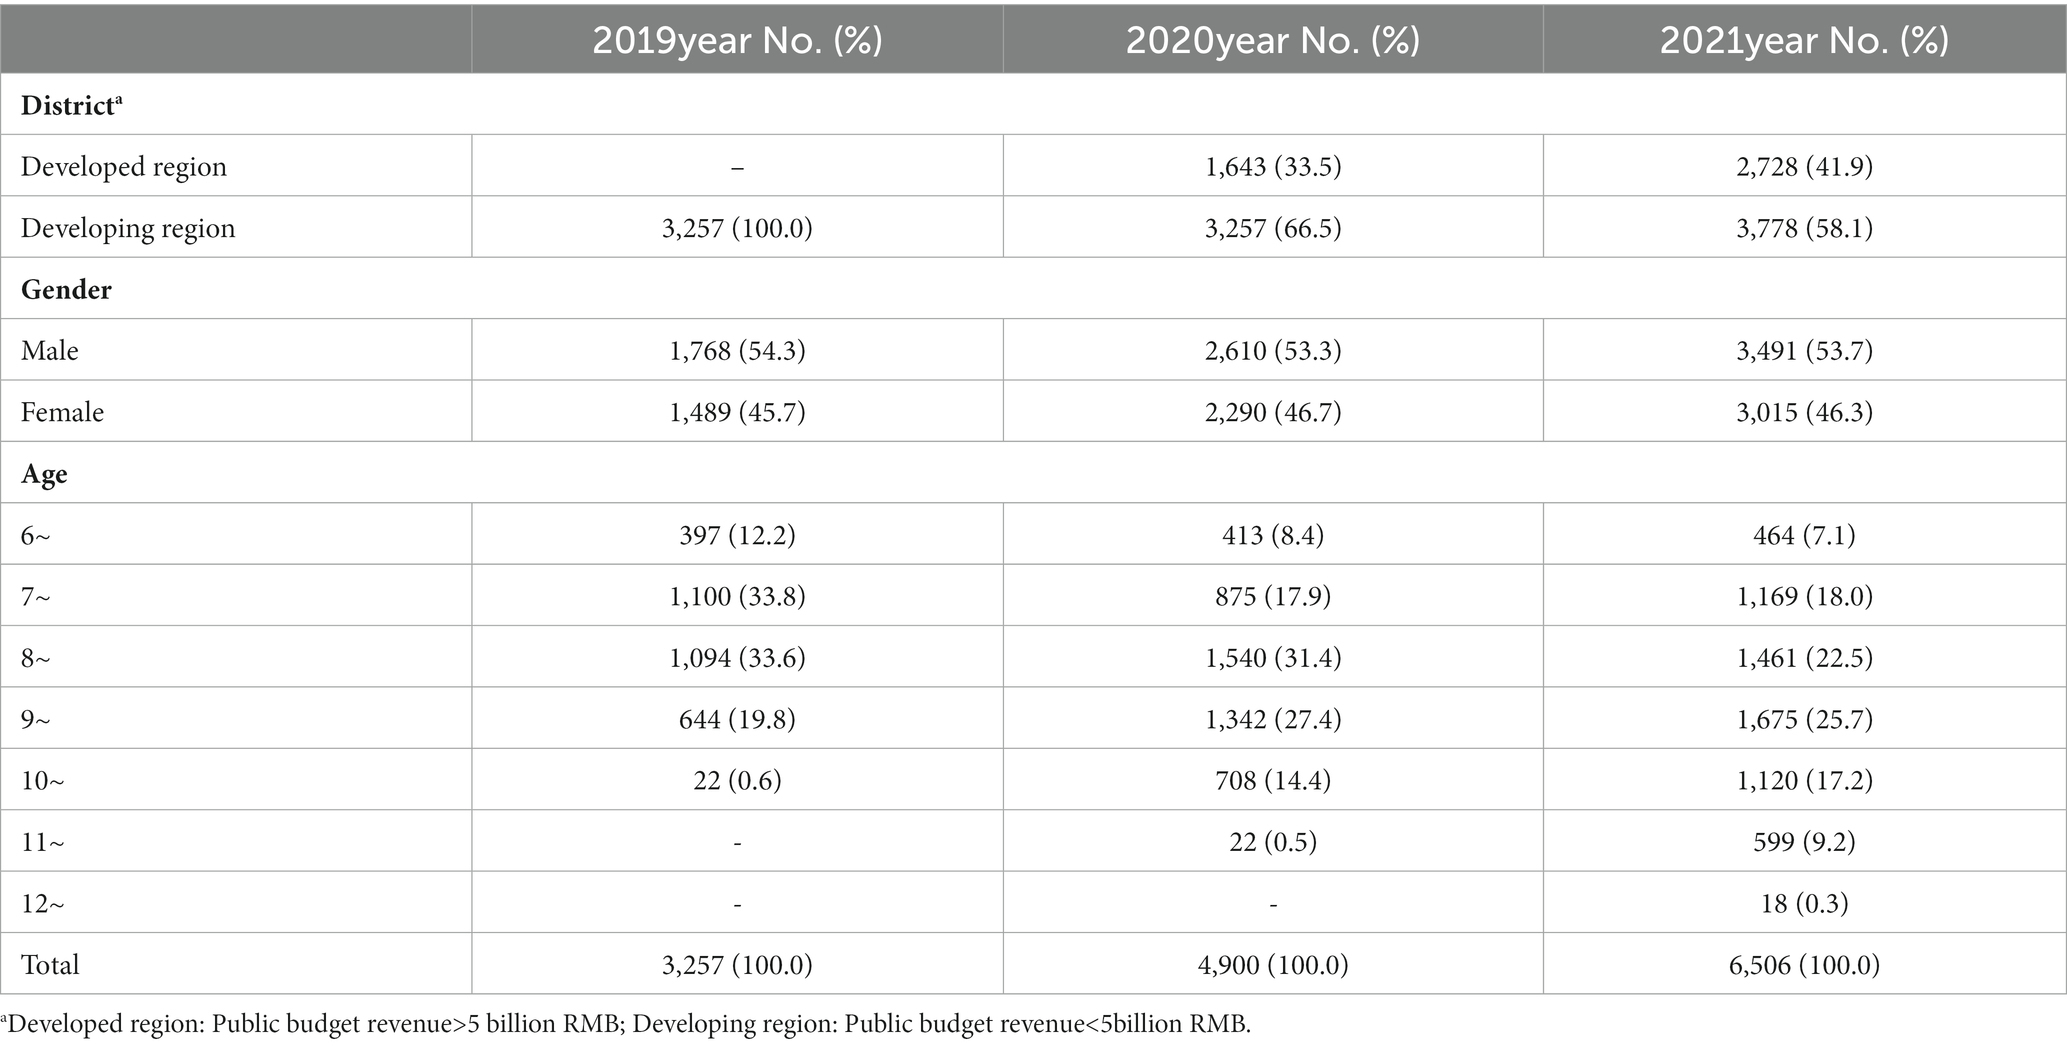
Table 1. Cohort profiles of students in the Eastern China Student Health and Wellbeing Cohort Study.
Results are summarized as annual physical examination, questionnaire surveys, bio-sampling completion status, and environmental measurements
(1) Annual physical examination: Of all the cohort participants, the prevalence of myopia, obesity, and elevated blood pressure is 21.8%–29.2%, 17.4%–29.7%, and 12.6%–32.5% in the first year, respectively, and 48.4%–50.4%, 3.0%–5.0%, and 4.2%–18.3% in the third year, respectively. The average axial length R/L with standard deviation (SD) is (23.1 ~ 23.3)/(23.1 ~ 23.2) mm in the first year and 23.8/(23.7 ~ 23.8) mm in the third year. The average spherical equivalent R/L is (0.00–0.35)/(0.09–0.39) D in the first year and (−0.69–0.65)/(−0.35–0.55) D in the third year. The average height is (127.5–132.3) cm in the first year and (139.3–144.0) cm in the third year. The average weight is (28.7–31.4) kg in the first year and (38.5–40.9) kg in the third year (Table 2).
(2) Questionnaire surveys: The questionnaire topics include diet (such as the habit of brushing your teeth every day morning and night accounted for 68.7%, Never consumption of sugary drinks accounted for 30.1%), physical exercise (such as high-intensity exercise 0 day per week accounted for 33.7%), bullying (such as parents never criticize children accounting for 90.8%), and family (housing area >200 m2 accounting for 11.8%). Parent symptom questionnaire (conners) (48) comprises 48 items and 6 subscales: conduct problems (4.0 ± 3.9), difficulties in learning (2.8 ± 2.1), psychosomatic disorders (0.3 ± 0.8), impulsivity/hyperactivity (2.0 ± 2.0), anxiety (1.1 ± 1.2), and hyperactivity index (4.7 ± 4.0) (Table 3).
(3) Bio-sampling completion status: Current progress or plan information of the cohort study concerning biological samples and other related surveys can be referred to in Table 4.
(4) Environment measurements: According to the national standards GB 50099–2011, the classroom area per capita is greater than and equal to 1.36 m2/person. The average desk illumination is 430.78 (355.84–611.56) LX and the average blackboard illumination is 365.33 (286.83–516.84) LX. Some details can be found in Table 5.
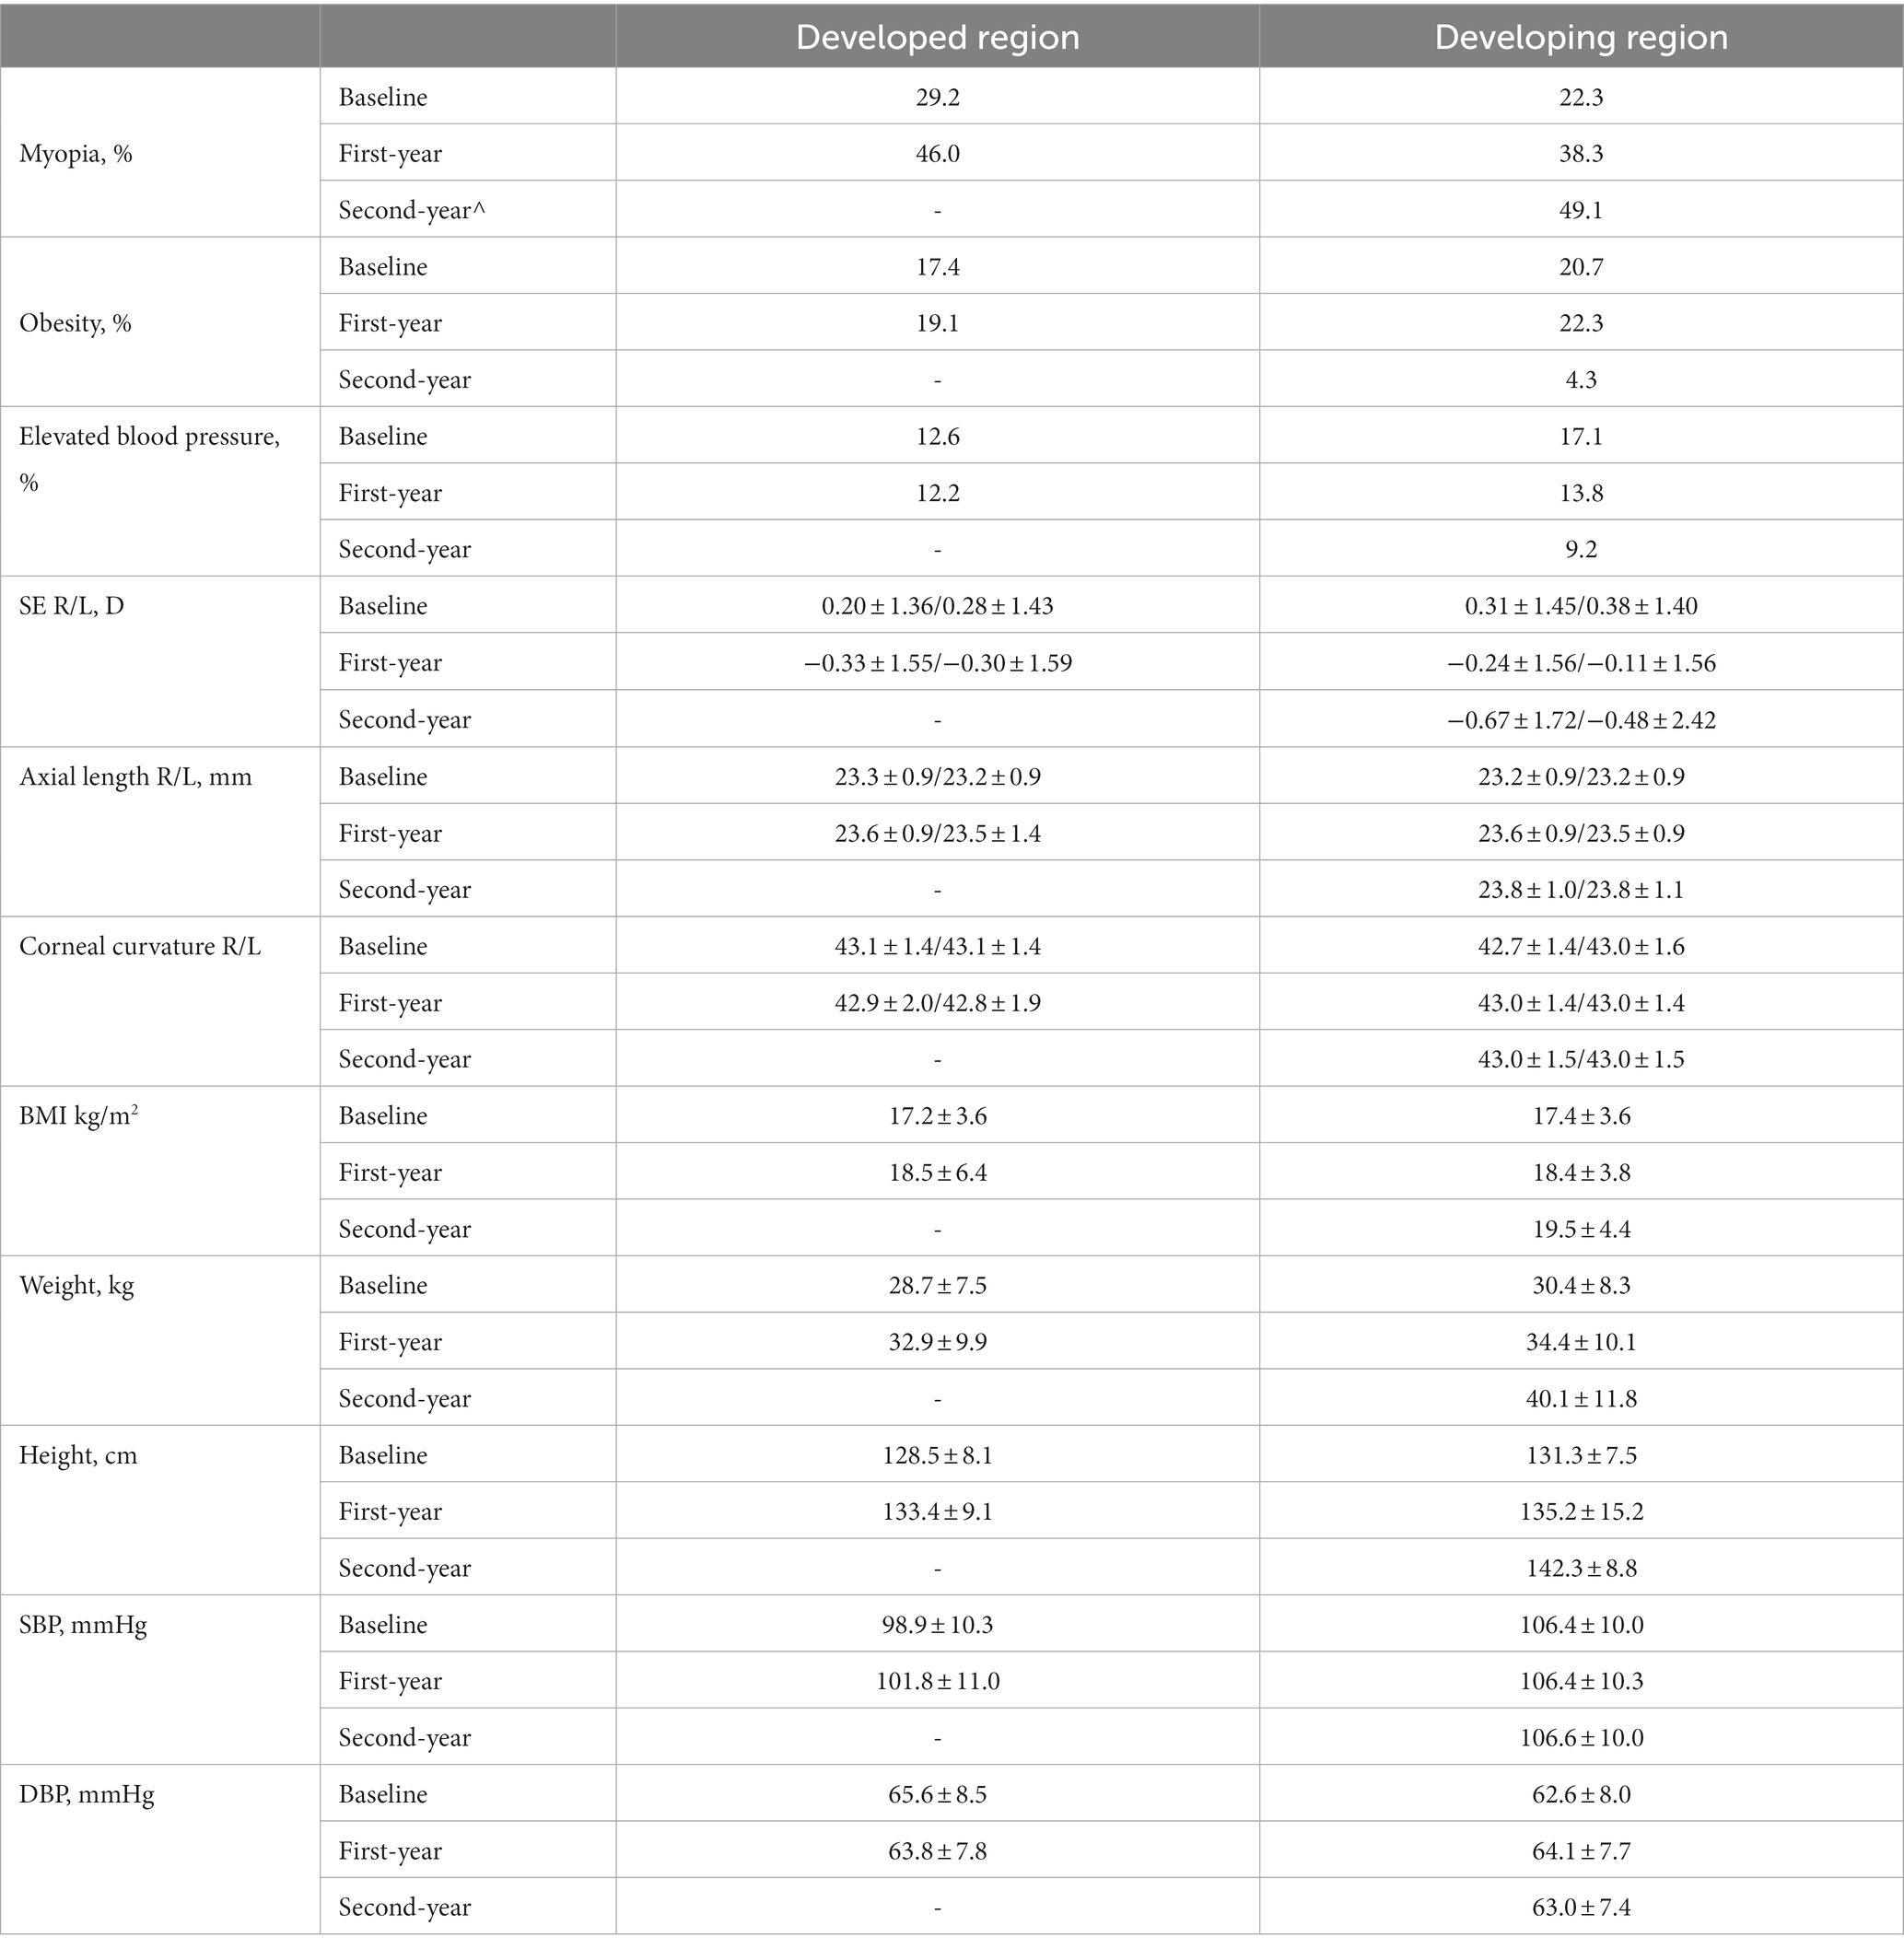
Table 2. Baseline and 2-year follow-up of annual physical examination of Eastern China Student Health and Wellbeing Cohort Study.
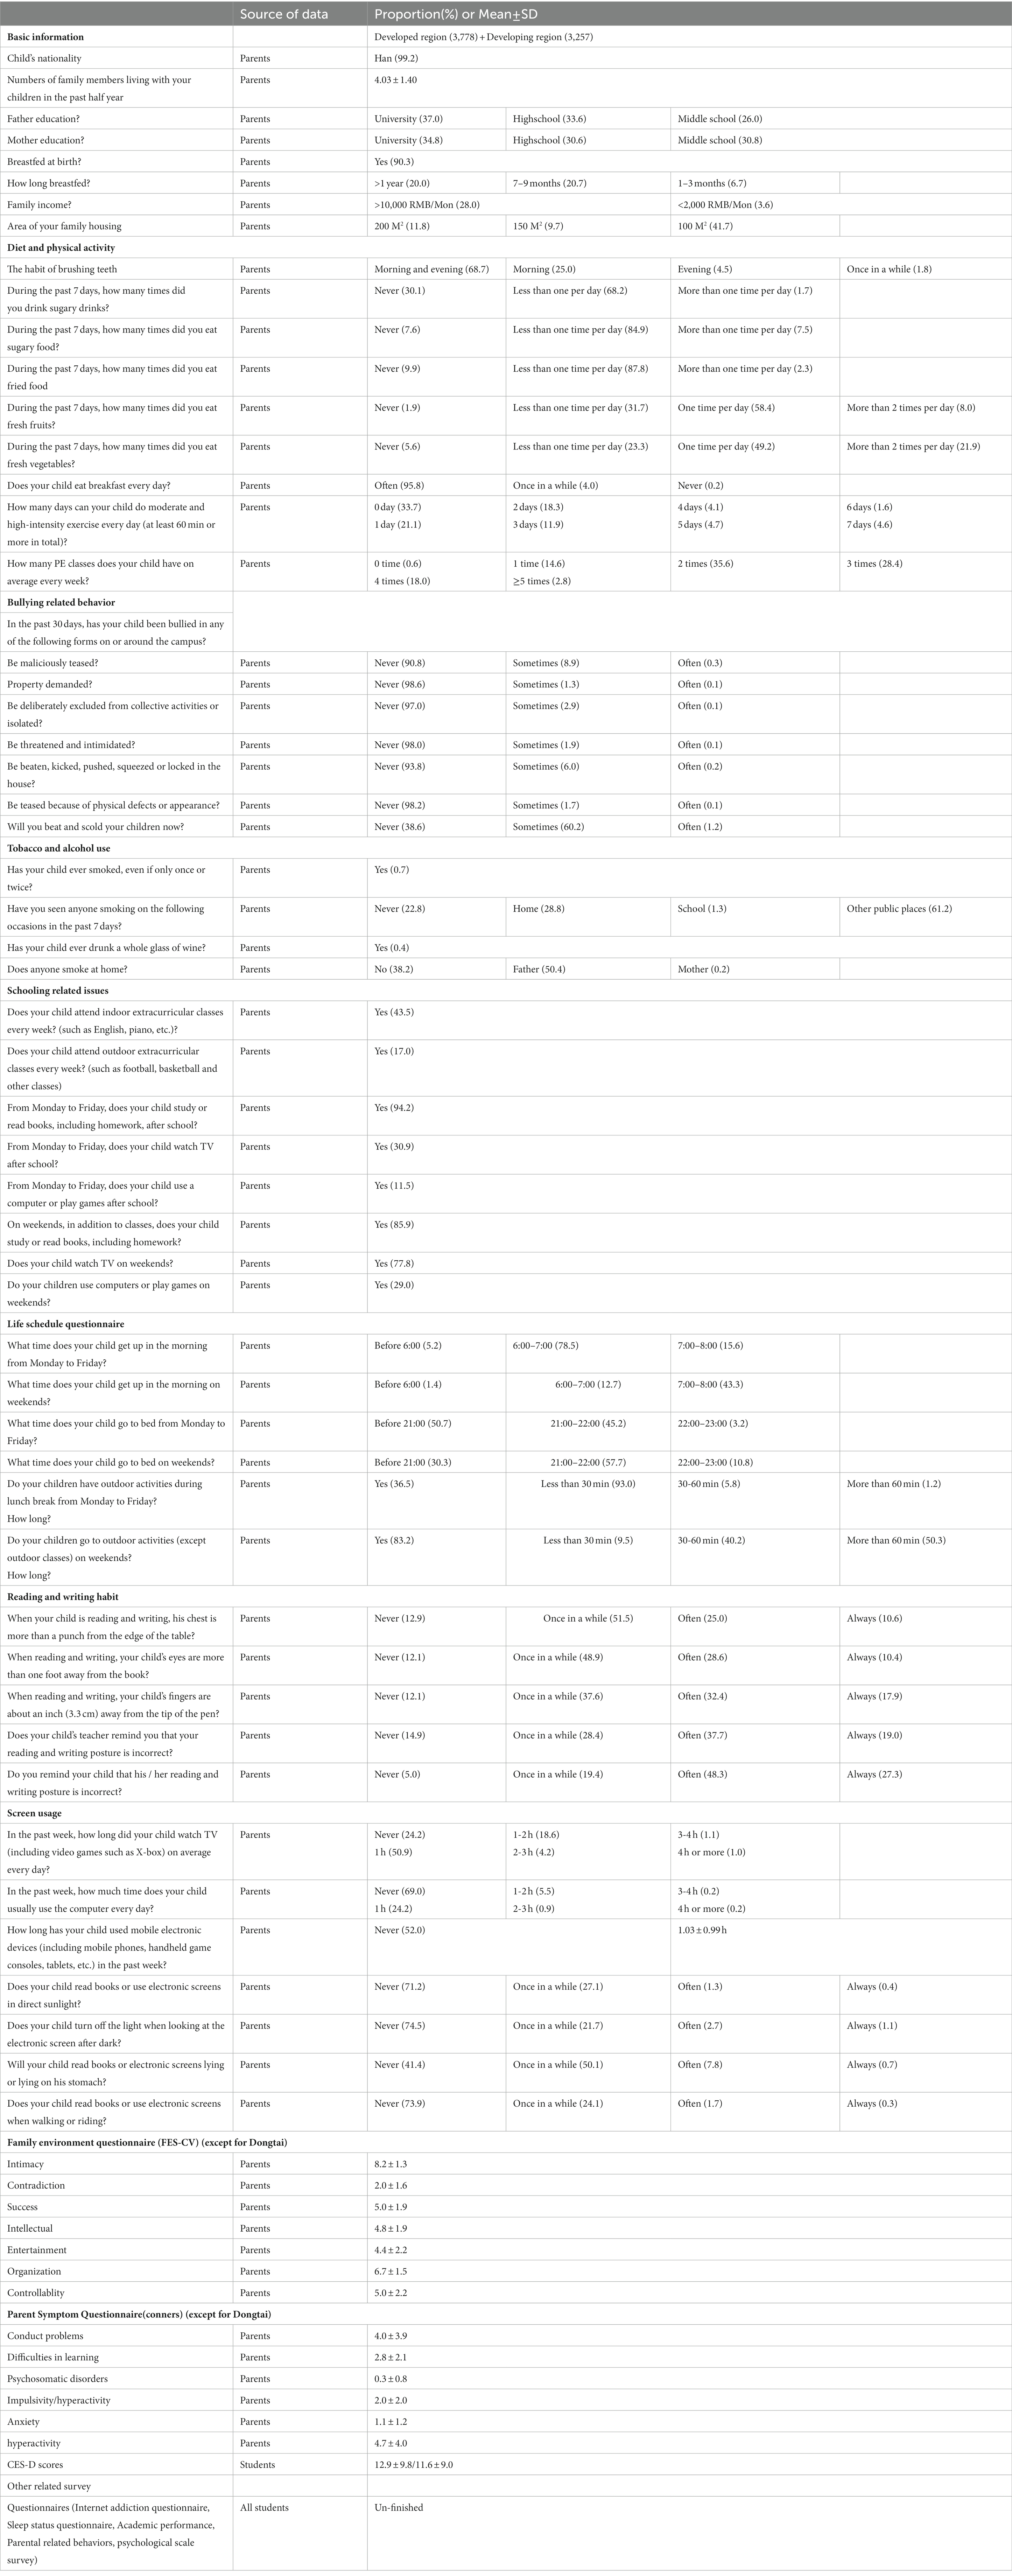
Table 3. Characteristics of school-based student health questionnaire surveys.
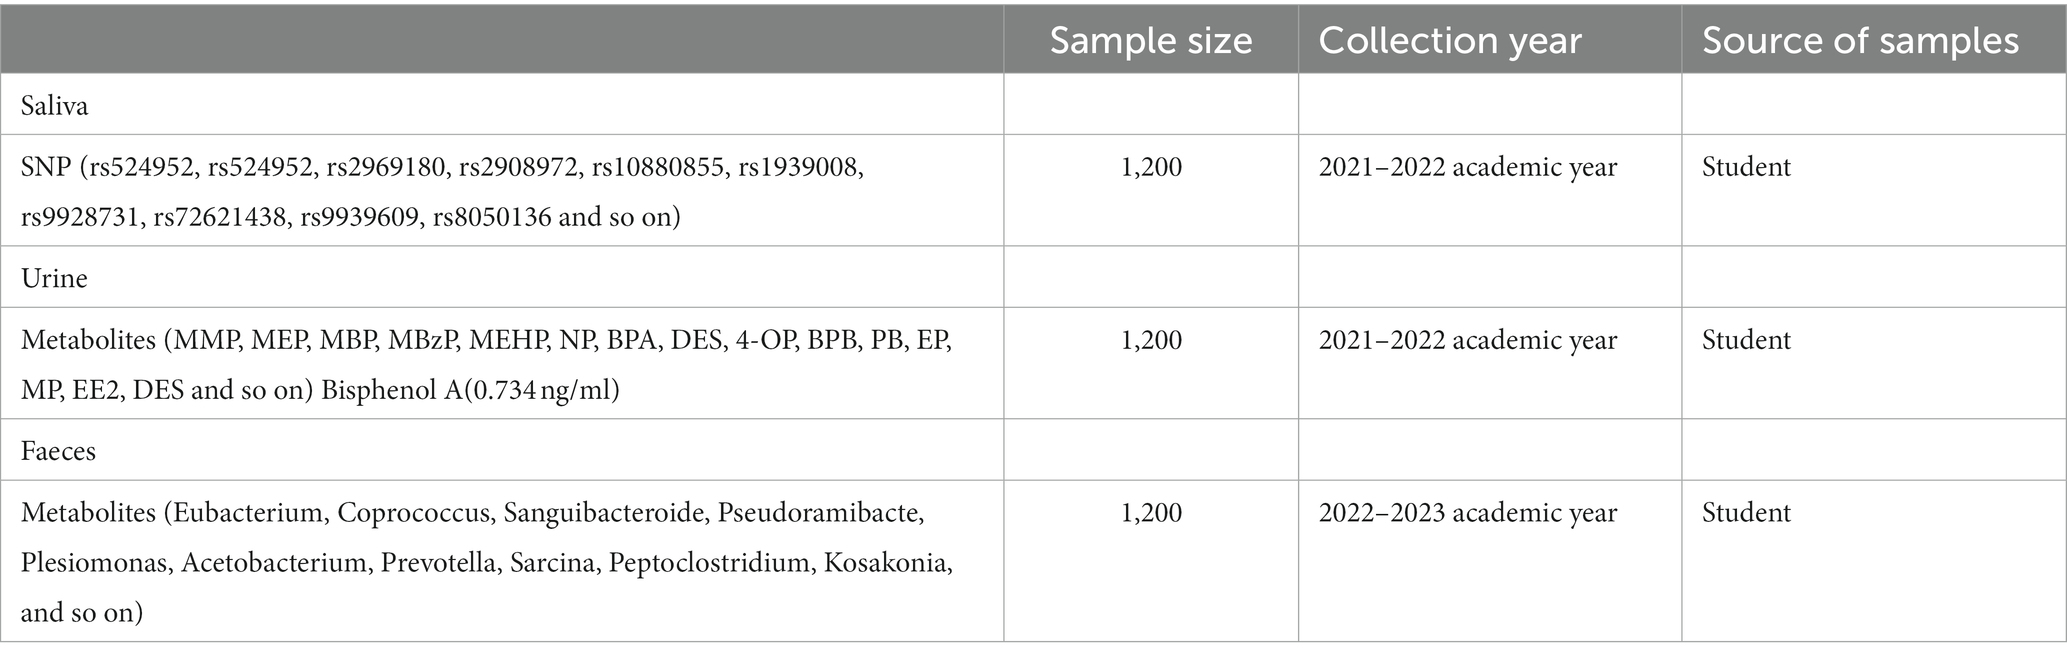
Table 4. Bio-sampling completion status (exposures).
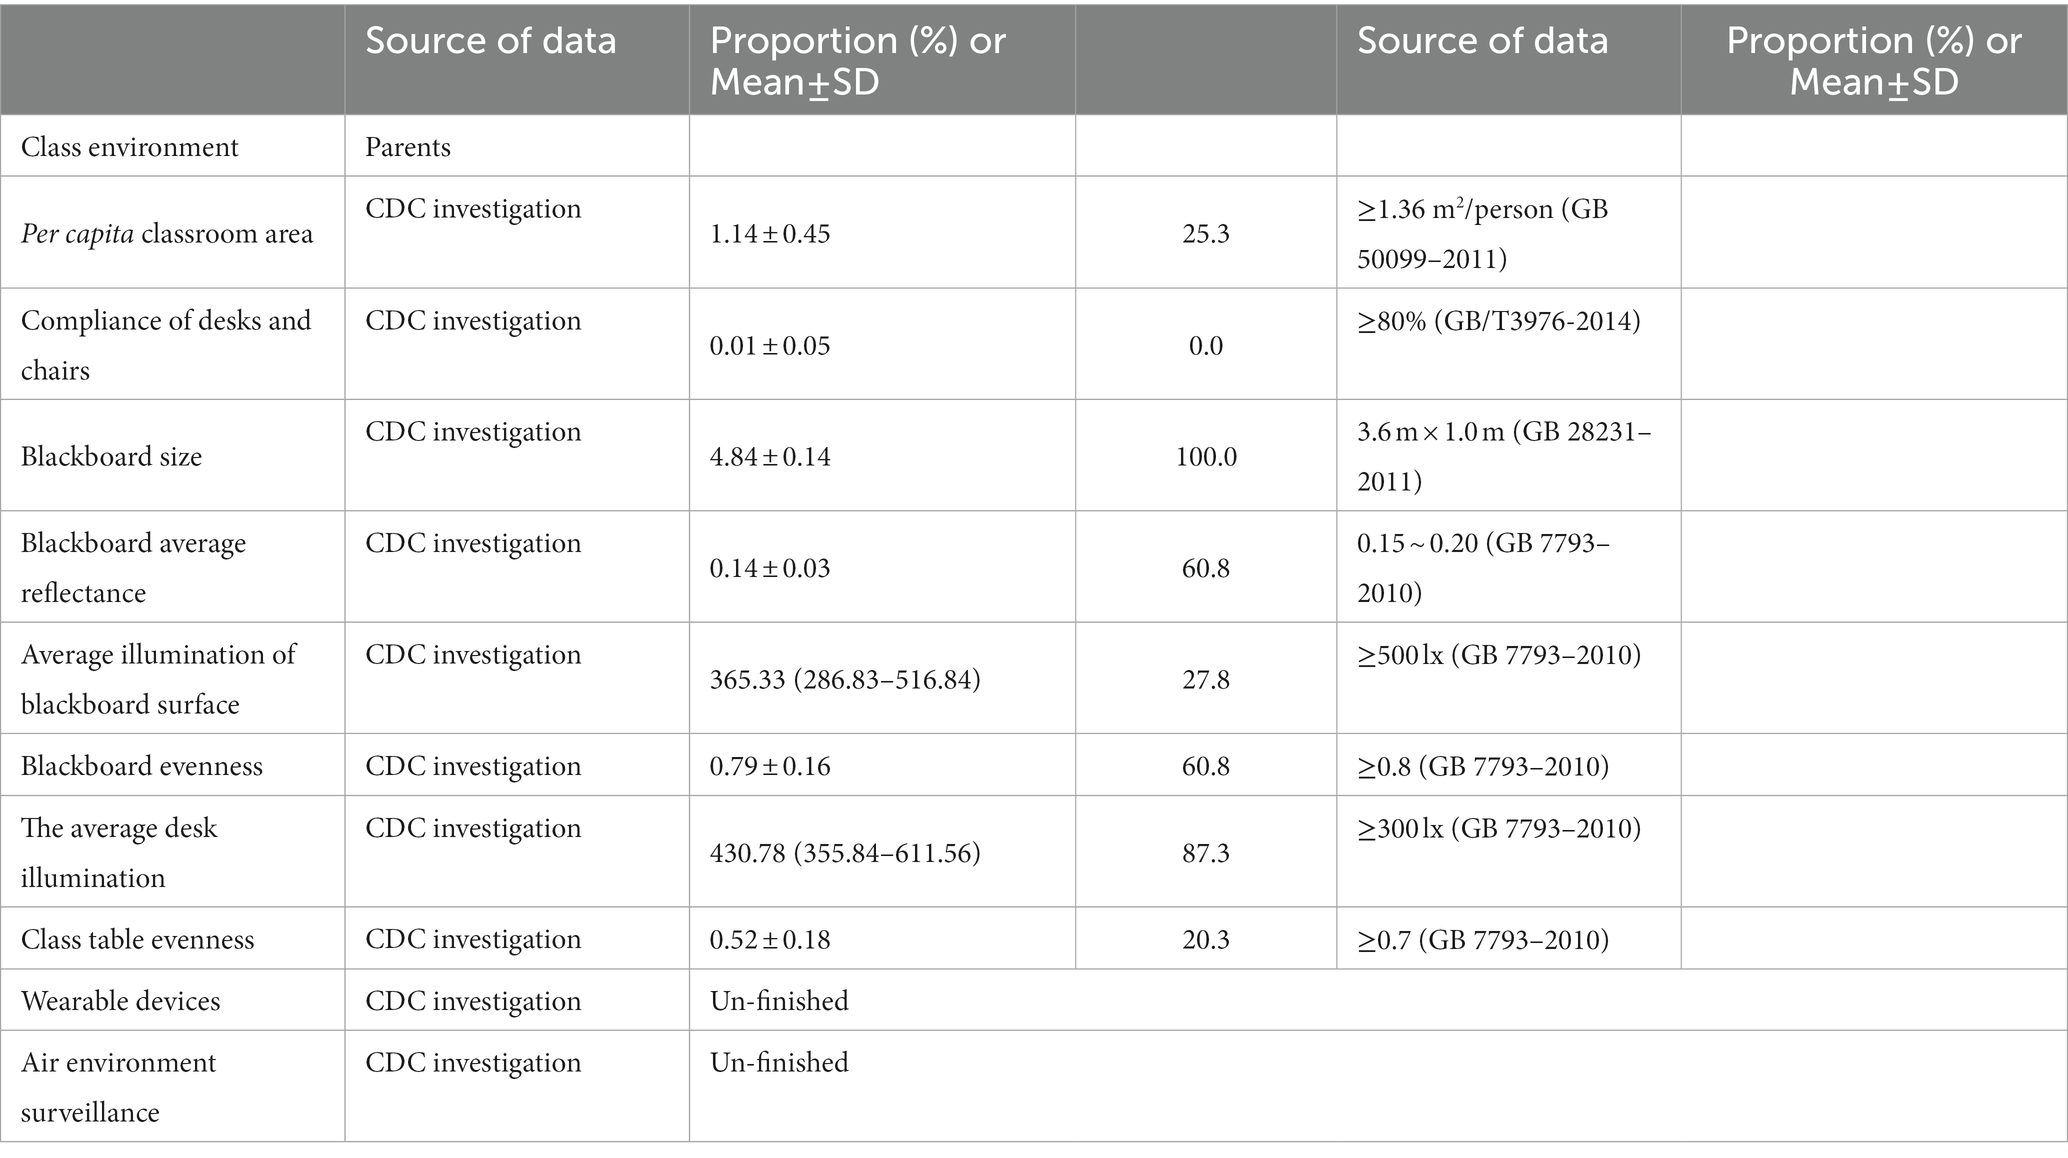
Table 5. Environment-related indicators measurements.
Discussion
The Eastern China Student Health and Wellbeing Cohort Study is aiming to focus on student common diseases. Health outcomes in relation to influencing factors will be quantified during the follow-up period. This is a dynamic cohort study conducted by Jiangsu Provincial Center for Disease Control and Prevention focusing on public health applications. Every 3 years is a stage, and an assessment will be made. For children with targeted diseases, we will continuously observe the relationship between the related indicators of common diseases and exposure factors in students in the future, e.g., for myopes, to quantify associations between myopic-related indicators such as axial length or spherical equivalent values and individual behaviors. For children without targeted diseases, we will explore the mechanism and onset of diseases. A longitudinal study design looking into the onset or development of targeted diseases in children and adolescents may identify potential interventional strategies to reduce the disease burden of relevance (49, 50). This unique platform generates evidence for policy and practice translation to improve health and wellbeing in school-aged children and adolescents.
The Eastern China Student Health and Wellbeing Cohort Study has the following strengths. First, the establishment of this student cohort in one of the most affluent regions in China. Study findings will provide evidence to the public and authorities of targeted disease burden among children and its impact on school-aged child health. Second, the employment of a classic epidemiological study design using unified diagnostic criteria to measure obesity, elevated blood pressure, myopia, and mental health will provide the best available estimate of the disease burden in school-aged children and adolescents. Third, with the comprehensive use of public health and clinical indicators, the study would further establish early warning models of common diseases in students. Fourth, the innovative epigenetic analysis will be carried out to complement what we have done previously in regard to joint effects of gene–environment on the development of targeted disease (51, 52). Fifth, the provision of a robust longitudinal cohort platform with breadth and depth of data for innovative research as well as evidence translation into health policies and practices to improve health and service in school-aged children. Sixth, the eastern student cohort study tends to provide evidence for intervention studies.
Data information
All relevant data are shown within the manuscript, but original datasets cannot be shared because of students’ privacy. However, possible collaborators are invited to contact the ES-SCI work group primary investigator Xiyan Zhang (xyzhang0220@foxmail.com).
Ethics statement
The studies involving human participants were reviewed and approved by Institutional Review Board of Ethics committee of Jiangsu Provincial Center for Disease Control and Prevention. Written informed consent to participate in this study was provided by the participants’ legal guardian/next of kin.
Author contributions
XZ, WY, and YZ: data curation. YX and XW: investigation. YW: methodology. FZ and WD: project administration. GZ, FT, JM, YT, and CP: design and advice. WD and YW: article modification. YZ, JY, and WD: supervision. XZ, WY, FZ, and WD: writing the original draft. All authors contributed to the article and approved the submitted version.
Funding
Annually basic public health of the child and adolescent health (student common disease intervention) funding was covered by the Jiangsu Provincial Department of Finance and Jiangsu Provincial Health Committee for 2019–2020 [2019 64], 2020–2021 [2020 124] [2020 52], 2021–2026 (un-issued), respectively. The role of the funder(s) is not applicable in this study. This research was supported by a demonstration project of comprehensive prevention and control of emerging infectious diseases (BE2015714), http://www.jshealth.com/xxgk/sewcjz/xmzl/sbjkt/201708/t20170830_59379.html (FZ).
Acknowledgments
The author would like to thank members of the ES-SCI team for their constructive suggestions and help with the manuscript.
Conflict of interest
The authors declare that the research was conducted in the absence of any commercial or financial relationships that could be construed as a potential conflict of interest.
Publisher’s note
All claims expressed in this article are solely those of the authors and do not necessarily represent those of their affiliated organizations, or those of the publisher, the editors and the reviewers. Any product that may be evaluated in this article, or claim that may be made by its manufacturer, is not guaranteed or endorsed by the publisher.
ES-SCI work group (Eastern Chinese Students common disease Surveillance, Cohort and Intervention study)
Hui Shen, Jia Hu, Suzhou Center for Disease Control and Prevention; Dongyue Wang, Mingzhu Shen, Yingni Sun, ChangsShu Center for Disease Control and Prevention; Yueqian Zhu,Weiwei Zhu, Yangzhou Center for Disease Control and Prevention; Zilin Li, Limin Huang, Yindi Xu, Shaochun Chen, Zaiping Mao, Yizheng Center for Disease Control and Prevention; Jimin Xu, Shenghao Miao, Juan Zhang, Xuzhou Center for Disease Control and Prevention; Wei Wang, Qiang Liu, Ping Li, Qiankun Zhang, Ping Feng, Ying Wang, Qingting Bian, Juan Lu, Peicounty Center for Disease Control and Prevention; Zhongyou Sun, Xiaohong Xu, Zhongyou Sun, Xiaohong Xu; Xiaomeng Huang, Kang Wu, Dongtai Center for Disease Control and Prevention; Sunan Chen, Yiwen Hua, Feng Huang, Southeast University.
Supplementary material
The Supplementary material for this article can be found online at: https://www.frontiersin.org/articles/10.3389/fpubh.2023.1100227/full#supplementary-material
References
1. Guthold, R, Stevens, GA, Riley, LM, and Bull, FC. Global trends in insufficient physical activity among adolescents: a pooled analysis of 298 population-based surveys with 1·6 million participants. Lancet Child Adolesc Health. (2020) 4:23–35. doi: 10.1016/S2352-4642(19)30323-2
2. Lund, C, Brooke-Sumner, C, Baingana, F, Baron, EC, Breuer, E, Chandra, P, et al. Social determinants of mental disorders and the sustainable development goals: a systematic review of reviews. Lancet Psychiat. (2018) 5:357–69. doi: 10.1016/S2215-0366(18)30060-9
3. Ng, M, Fleming, T, Robinson, M, Thomson, B, Graetz, N, Margono, C, et al. Global, regional, and national prevalence of overweight and obesity in children and adults during 1980-2013: a systematic analysis for the global burden of disease study 2013. Lancet. (2014) 384:766–81. doi: 10.1016/S0140-6736(14)60460-8
4. Wang, Y, Xue, H, Sun, M, Zhu, X, Zhao, L, and Yang, Y. Prevention and control of obesity in China. Lancet Glob Health. (2019) 7:e1166–7. doi: 10.1016/S2214-109X(19)30276-1
5. Kieling, C, Baker-Henningham, H, Belfer, M, Conti, G, Ertem, I, Omigbodun, O, et al. Child and adolescent mental health worldwide: evidence for action. Lancet. (2011) 378:1515–25. doi: 10.1016/S0140-6736(11)60827-1
6. Zhang, X, Yang, J, Wang, Y, Liu, W, Yang, W, Gao, L, et al. Epidemiological characteristics of elevated blood pressure among middle and high school students aged 12-17 years: a cross-sectional study in Jiangsu Province, China, 2017-2018. BMJ Open. (2019) 9:e027215. doi: 10.1136/bmjopen-2018-027215
7. Wu, PC, Huang, HM, Yu, HJ, Fang, PC, and Chen, CT. Epidemiology of myopia. Asia Pac J Ophthalmol (Phila). (2016) 5:386–93. doi: 10.1097/APO.0000000000000236
8. Jan, C, Li, L, Keay, L, Stafford, RS, Congdon, N, and Morgan, I. Prevention of myopia, China. Bull World Health Organ. (2020) 98:435–7. doi: 10.2471/BLT.19.240903
9. O'Reilly, M, Svirydzenka, N, Adams, S, and Dogra, N. Review of mental health promotion interventions in schools. Soc Psychiatry Psychiatr Epidemiol. (2018) 53:647–62. doi: 10.1007/s00127-018-1530-1
10. Chen, S, Zhang, X, Du, W, Fan, L, and Zhang, F. Association of insufficient sleep and skipping breakfast with overweight/obesity in children and adolescents: findings from a cross-sectional provincial surveillance project in Jiangsu. Pediatr Obes. (2022) 17:e12950. doi: 10.1111/ijpo.12950
12. Goss, DA. Variables related to the rate of childhood myopia progression. Optom Vis Sci. (1990) 67:631–6. doi: 10.1097/00006324-199008000-00014
13. Lin, LL, Shih, YF, Hsiao, CK, and Chen, CJ. Prevalence of myopia in Taiwanese schoolchildren: 1983 to 2000. Ann Acad Med Singap. (2004) 33:27–33.
14. Zadnik, K, Sinnott, LT, Cotter, SA, Jones-Jordan, LA, Kleinstein, RN, Manny, RE, et al. Prediction of juvenile-onset myopia. JAMA Ophthalmol. (2015) 133:683–9. doi: 10.1001/jamaophthalmol.2015.0471
15. Euser, AM, Zoccali, C, Jager, KJ, and Dekker, FW. Cohort studies: prospective versus retrospective. Nephron Clin Pract. (2009) 113:c214–7. doi: 10.1159/000235241
16. Grimes, DA, and Schulz, KF. Cohort studies: marching towards outcomes. Lancet. (2002) 359:341–5. doi: 10.1016/S0140-6736(02)07500-1
17. Wang, J, Li, Y, Zhao, Z, Wei, N, Qi, X, Ding, G, et al. School-based epidemiology study of myopia in Tianjin, China. Int Ophthalmol. (2020) 40:2213–22. doi: 10.1007/s10792-020-01400-w
18. Hong, J, Fu, J, Wang, YD, Zhao, BW, and Li, L. Prevalence of heterophoria in a population of school children in Central China: the Anyang childhood eye study. Int J Ophthalmol. (2020) 13:801–5. doi: 10.18240/ijo.2020.05.16
19. National Health Commission. The implementation plan for comprehensive prevention and control of myopia among children and adolescents, (2018).
20. Ministry Of Education, National Health Commission (2018). The implementation plan for comprehensive prevention and control of myopia among children and adolescents.
21. Worldwide trends in body-mass index. Underweight, overweight, and obesity from 1975 to 2016: a pooled analysis of 2416 population-based measurement studies in 128·9 million children, adolescents, and adults. Lancet. (2017) 390:2627–42. doi: 10.1016/S0140-6736(17)32129-3
22. Chen, X, and Wang, Y. Tracking of blood pressure from childhood to adulthood: a systematic review and meta-regression analysis. Circulation. (2008) 117:3171–80. doi: 10.1161/CIRCULATIONAHA.107.730366
23. Zhang, X, Zhang, F, Yang, J, Yang, W, Liu, W, Gao, L, et al. Prevalence of overweight and obesity among primary school-aged children in Jiangsu Province, China, 2014–2017. PLoS One. (2018) 13:e0202681. doi: 10.1371/journal.pone.0202681
24. Das, JK, Salam, RA, Thornburg, KL, Prentice, AM, Campisi, S, Lassi, ZS, et al. Nutrition in adolescents: physiology, metabolism, and nutritional needs. Ann N Y Acad Sci. (2017) 1393:21–33. doi: 10.1111/nyas.13330
25. Physical status: the use and interpretation of anthropometry. Report of a WHO expert committee. World Health Organ Tech Rep Ser. (1995) 854:1–452.
26. Tran, TD, Holton, S, Nguyen, H, and Fisher, J. Physical growth: is it a good indicator of development in early childhood in low- and middle-income countries? BMC Pediatr. (2019) 19:276. doi: 10.1186/s12887-019-1654-9
27. Bzostek, SH, and Berger, LM. Family structure experiences and child socioemotional development during the first nine years of life: examining heterogeneity by family structure at birth. Demography. (2017) 54:513–40. doi: 10.1007/s13524-017-0563-5
28. Khan, JR, and Biswas, RK. Influence of parental education on child mortality in Bangladesh: repeated cross-sectional surveys. Biodemography Soc Biol. (2020) 65:214–26. doi: 10.1080/19485565.2020.1734910
29. Peterson, C, Florence, C, and Klevens, J. The economic burden of child maltreatment in the United States, 2015. Child Abuse Negl. (2018) 86:178–83. doi: 10.1016/j.chiabu.2018.09.018
30. Bardanzellu, F, and Fanos, V. How could metabolomics change pediatric health? Ital J Pediatr. (2020) 46:37. doi: 10.1186/s13052-020-0807-7
31. Wu, W, Li, M, Liu, A, Wu, C, Li, D, Deng, Q, et al. Bisphenol a and the risk of obesity a systematic review with meta-analysis of the epidemiological evidence. Dose Response. (2020) 18:1559325820916949. doi: 10.1177/1559325820916949
32. Kim, KY, Lee, E, and Kim, Y. The association between bisphenol a exposure and obesity in children-a systematic review with meta-analysis. Int J Environ Res Public Health. (2019) 16:2521. doi: 10.3390/ijerph16142521
33. Moore, DS. Gene × environment interaction: what exactly are we talking about? Res Dev Disabil. (2018) 82:3–9. doi: 10.1016/j.ridd.2018.04.012
34. Lovely, C, Rampersad, M, Fernandes, Y, and Eberhart, J. Gene-environment interactions in development and disease. Wiley Interdiscip rev. Dev Biol. (2017) 6:6. doi: 10.1002/wdev.247
35. Robaei, D, Rose, K, Ojaimi, E, Kifley, A, Huynh, S, and Mitchell, P. Visual acuity and the causes of visual loss in a population-based sample of 6-year-old Australian children. Ophthalmology. (2005) 112:1275–82. doi: 10.1016/j.ophtha.2005.01.052
36. Hagen, LA, Gjelle, J, Arnegard, S, Pedersen, HR, Gilson, SJ, and Baraas, RC. Prevalence and possible factors of myopia in Norwegian adolescents. Sci Rep. (2018) 8:13479. doi: 10.1038/s41598-018-31790-y
37. Flitcroft, DI, He, M, Jonas, JB, Jong, M, Naidoo, K, Ohno-Matsui, K, et al. IMI—defining and classifying myopia: a proposed set of standards for clinical and epidemiologic studies. Invest Ophthalmol Vis Sci. (2019) 60:M20–30. doi: 10.1167/iovs.18-25957
38. National Health Commission. Screening for overweight and obesity among school-age childre and adolescents (WST 586-2018) (2018).
39. National Health Commission. Screening standard for malnutribution of school-age children and adolescents (WS/T 456-2014) (2014).
40. National Health Commission. Reference of screening for elevated blood pressure among children and adolescents aged 7~18 years (WST 610-2018) (2018).
41. Weissman, MM, Sholomskas, D, Pottenger, M, Prusoff, BA, and Locke, BZ. Assessing depressive symptoms in five psychiatric populations: a validation study. Am J Epidemiol. (1977) 106:203–14. doi: 10.1093/oxfordjournals.aje.a112455
42. Lawes, CM, Vander, HS, Law, MR, Elliott, P, MacMahon, S, Rodgers, A, et al. Part II: estimates of attributable burden. J Hypertens. (2000) 24:423–30. doi: 10.1097/01.hjh.0000209973.67746.f0
43. Ji, CY. Report on childhood obesity in China (1)--body mass index reference for screening overweight and obesity in Chinese school-age children. Biomed Environ Sci. (2005) 18:390–400. doi: 10.1097/01.hjh.0000209973.67746.f0
44. Vilagut, G, Forero, CG, Barbaglia, G, and Alonso, J. Screening for depression in the general population with the Center for Epidemiologic Studies Depression (CES-D): a systematic review with meta-analysis. PLoS One. (2016) 11:e0155431. doi: 10.1371/journal.pone.0155431
45. Arbona, C, Burridge, A, and Olvera, N. The Center for Epidemiological Studies Depression Scale (CES-D): measurement equivalence across gender groups in Hispanic college students. J Affect Disord. (2017) 219:112–8. doi: 10.1016/j.jad.2017.05.024
46. Zhang, X, Zhou, Y, Yang, J, Wang, Y, Yang, W, Gao, L, et al. The distribution of refraction by age and gender in a non-myopic Chinese children population aged 6-12 years. BMC Ophthalmol. (2020) 20:439. doi: 10.1186/s12886-020-01709-1
47. National Health Commission. National surveillance program of common diseases and health influencing factors among students. (2018).
48. Goyette, CH, Conners, CK, and Ulrich, RF. Normative data on revised Conners parent and teacher rating scales. J Abnorm Child Psychol. (1978) 6:221–36. doi: 10.1007/BF00919127
49. Soh, SE, and Saw, SM. Cohort studies: design and pitfalls. Am J Ophthalmol. (2010) 150:3–5. doi: 10.1016/j.ajo.2010.03.008
50. Li, SM, Liu, LR, Li, SY, Ji, YZ, Fu, J, Wang, Y, et al. Design, methodology and baseline data of a school-based cohort study in Central China: the Anyang childhood eye study. Ophthalmic Epidemiol. (2013) 20:348–59. doi: 10.3109/09286586.2013.842596
51. Pozarickij, A, Williams, C, Hysi, PG, Guggenheim, JA, Aslam, T, Barman, SA, et al. 5 quantile regression analysis reveals widespread evidence for gene-environment or gene-gene interactions in myopia development. Commun Biol. (2019) 2:2. doi: 10.1038/s42003-019-0387-5
52. Enthoven, CA, LodewijkTideman, JW, Polling, JR, Tedja, MS, Raat, H, Iglesias, AI, et al. 1 interaction between lifestyle and genetic susceptibility in myopia: the generation R study. Eur J Epidemiol. (2019) 34:777–84. doi: 10.1007/s10654-019-00512-7
Keywords: cohort, school aged, health, wellbeing, profile
Citation: Zhang X, Zhao G, Ma J, Tao F, Pan C-W, Zhang F, Wang Y, Yang W, Xiang Y, Wang X, Tian Y, Yang J, Du W, Zhou Y and ES-SCI Work Group (2023) Design, methodology, and baseline of eastern China student health and wellbeing cohort study. Front. Public Health 11:1100227. doi: 10.3389/fpubh.2023.1100227
Edited by:
María Luisa Zagalaz-Sánchez, University of Jaén, SpainReviewed by:
Dolors Cañabate, University of Girona, SpainZhanneta Kozina, H. S. Skovoroda Kharkiv National Pedagogical University, Ukraine
Copyright © 2023 Zhang, Zhao, Ma, Tao, Pan, Zhang, Wang, Yang, Xiang, Wang, Tian, Yang, Du, Zhou and ES-SCI Work Group. This is an open-access article distributed under the terms of the Creative Commons Attribution License (CC BY). The use, distribution or reproduction in other forums is permitted, provided the original author(s) and the copyright owner(s) are credited and that the original publication in this journal is cited, in accordance with accepted academic practice. No use, distribution or reproduction is permitted which does not comply with these terms.
*Correspondence: Wei Du, ZHV3ZWlAc2V1LmVkdS5jbg==; Jie Yang, NTE0Nzg1MzZAcXEuY29t; Yonglin Zhou, MTU4NTgyMDA5QHFxLmNvbQ==