 Sawsan AlMukdad1,2†
 Laith J. Abu-Raddad
- 1Infectious Disease Epidemiology Group, Weill Cornell Medicine-Qatar, Cornell University, Qatar Foundation – Education City, Doha, Qatar
- 2World Health Organization Collaborating Centre for Disease Epidemiology Analytics on HIV/AIDS, Sexually Transmitted Infections, and Viral Hepatitis, Weill Cornell Medicine-Qatar, Cornell University, Qatar Foundation – Education City, Doha, Qatar
- 3Department of Population Health Sciences, Weill Cornell Medicine, Cornell University, New York, NY, United States
- 4Department of Public Health, College of Health Sciences, Member of QU Health, Qatar University, Doha, Qatar
Background: The objective of this study was to characterize herpes simplex virus type 1 (HSV-1) epidemiology in Canada.
Methods: HSV-1 publications as recent as December 6, 2021 were systematically reviewed, synthesized, and reported following PRISMA guidelines. Meta-analyses and meta-regressions were conducted.
Results: HSV-1 measures were extracted from 22 studies and included 32 overall seroprevalence measures (79 stratified), 2 overall proportions of HSV-1 detection in clinically diagnosed genital ulcer disease (2 stratified), and 8 overall proportions of HSV-1 detection in laboratory-confirmed genital herpes (27 stratified). Pooled mean seroprevalence was 19.1% [95% confidence interval (CI): 12.6–26.4%] among healthy children and 51.4% (95% CI: 47.3–55.5%) among healthy adults. Pooled mean seroprevalence among healthy general populations increased with age, with the lowest being 35.7% (95% CI: 29.1–42.6%) among individuals <20 years of age, and the highest being 70.0% (95% CI: 54.8–83.2) among individuals ≥40 years. Seroprevalence increased by 1.02-fold (95% CI: 1.01–1.04) per year. Pooled mean proportion of HSV-1 detection in genital ulcer disease was 30.8% (95% CI: 12.6–52.8%). Pooled mean proportion of HSV-1 detection in genital herpes was 37.4% (95% CI: 29.5–45.6%) and was highest in women and in young persons. Proportion of HSV-1 detection in genital herpes increased by 1.04-fold (95% CI: 1.00–1.08) per year.
Conclusions: HSV-1 epidemiology in Canada appears to be shifting toward less oral acquisition in childhood and more genital acquisition in adulthood, particularly among youth. Both HSV-1 seroprevalence and proportion of HSV-1 detection in genital herpes are increasing with time.
Introduction
Herpes simplex virus type 1 (HSV-1) infection is typically acquired orally during childhood (1). HSV-1 infection is lifelong and predominantly asymptomatic (2, 3). Yet, the infection can lead to severe neurological, corneal, or mucocutaneous complications (1, 4). Evidence suggests a shift in the historical pattern of HSV-1 epidemiology in Western countries, with declining oral HSV-1 acquisition in childhood, but increasing genital acquisition among young persons, mostly through oral sex (5–10). Considering the disease burden and changing epidemiology of this infection, the World Health Organization (WHO) and global partners are leading initiatives to enhance our understanding of the epidemiology of this virus and to develop a vaccine that protects against its acquisition (9, 11, 12).
Despite HSV-1 epidemiology being well characterized in the United States (5, 7, 13) and Western Europe (14), the epidemiology of this infection remains inadequately understood in Canada. Accordingly, we conducted a comprehensive systematic review to characterize HSV-1 epidemiology in this country. The study aimed to characterize HSV-1 trends and patterns for the purpose of informing policy, programming, and resource allocation, as well as to address the disease burden of this infection, an infection for which there are at present no specific prevention and control strategies in place in Canada.
The study implemented an established analytical approach that has been developed, tested, and refined over years of investigation and applications for a range of infections (15–20). Meta-analytical methods were employed to estimate HSV-1 antibody prevalence (seroprevalence), and proportions of HSV-1 detection in clinically diagnosed genital ulcer disease (GUD) and in laboratory-confirmed genital herpes. Meta-regressions were conducted to investigate associations and overall temporal trends over the study timeframe for each of HSV-1 seroprevalence and proportion of HSV-1 detection in genital herpes. While ideally trends in seroprevalence are best established through repeated cross-sectional surveys on the same population over a long time horizon, such data do not exist for HSV-1 infection except in one country, the United States, through the NHANES surveys done for over four decades (7, 13). It is challenging to justify such costly surveys for HSV-1 infection worldwide. Therefore, our study addresses a gap in evidence for Canada that otherwise could not have been filled.
Materials and methods
The methodology used in this study was based on that developed in a series of published systematic reviews investigating HSV-1 and HSV-2 epidemiology in other regions and countries (14–17, 21–27). Therefore, no study protocol was registered in PROSPERO for this specific study. The methodology is described in Box 1 and is summarized below.
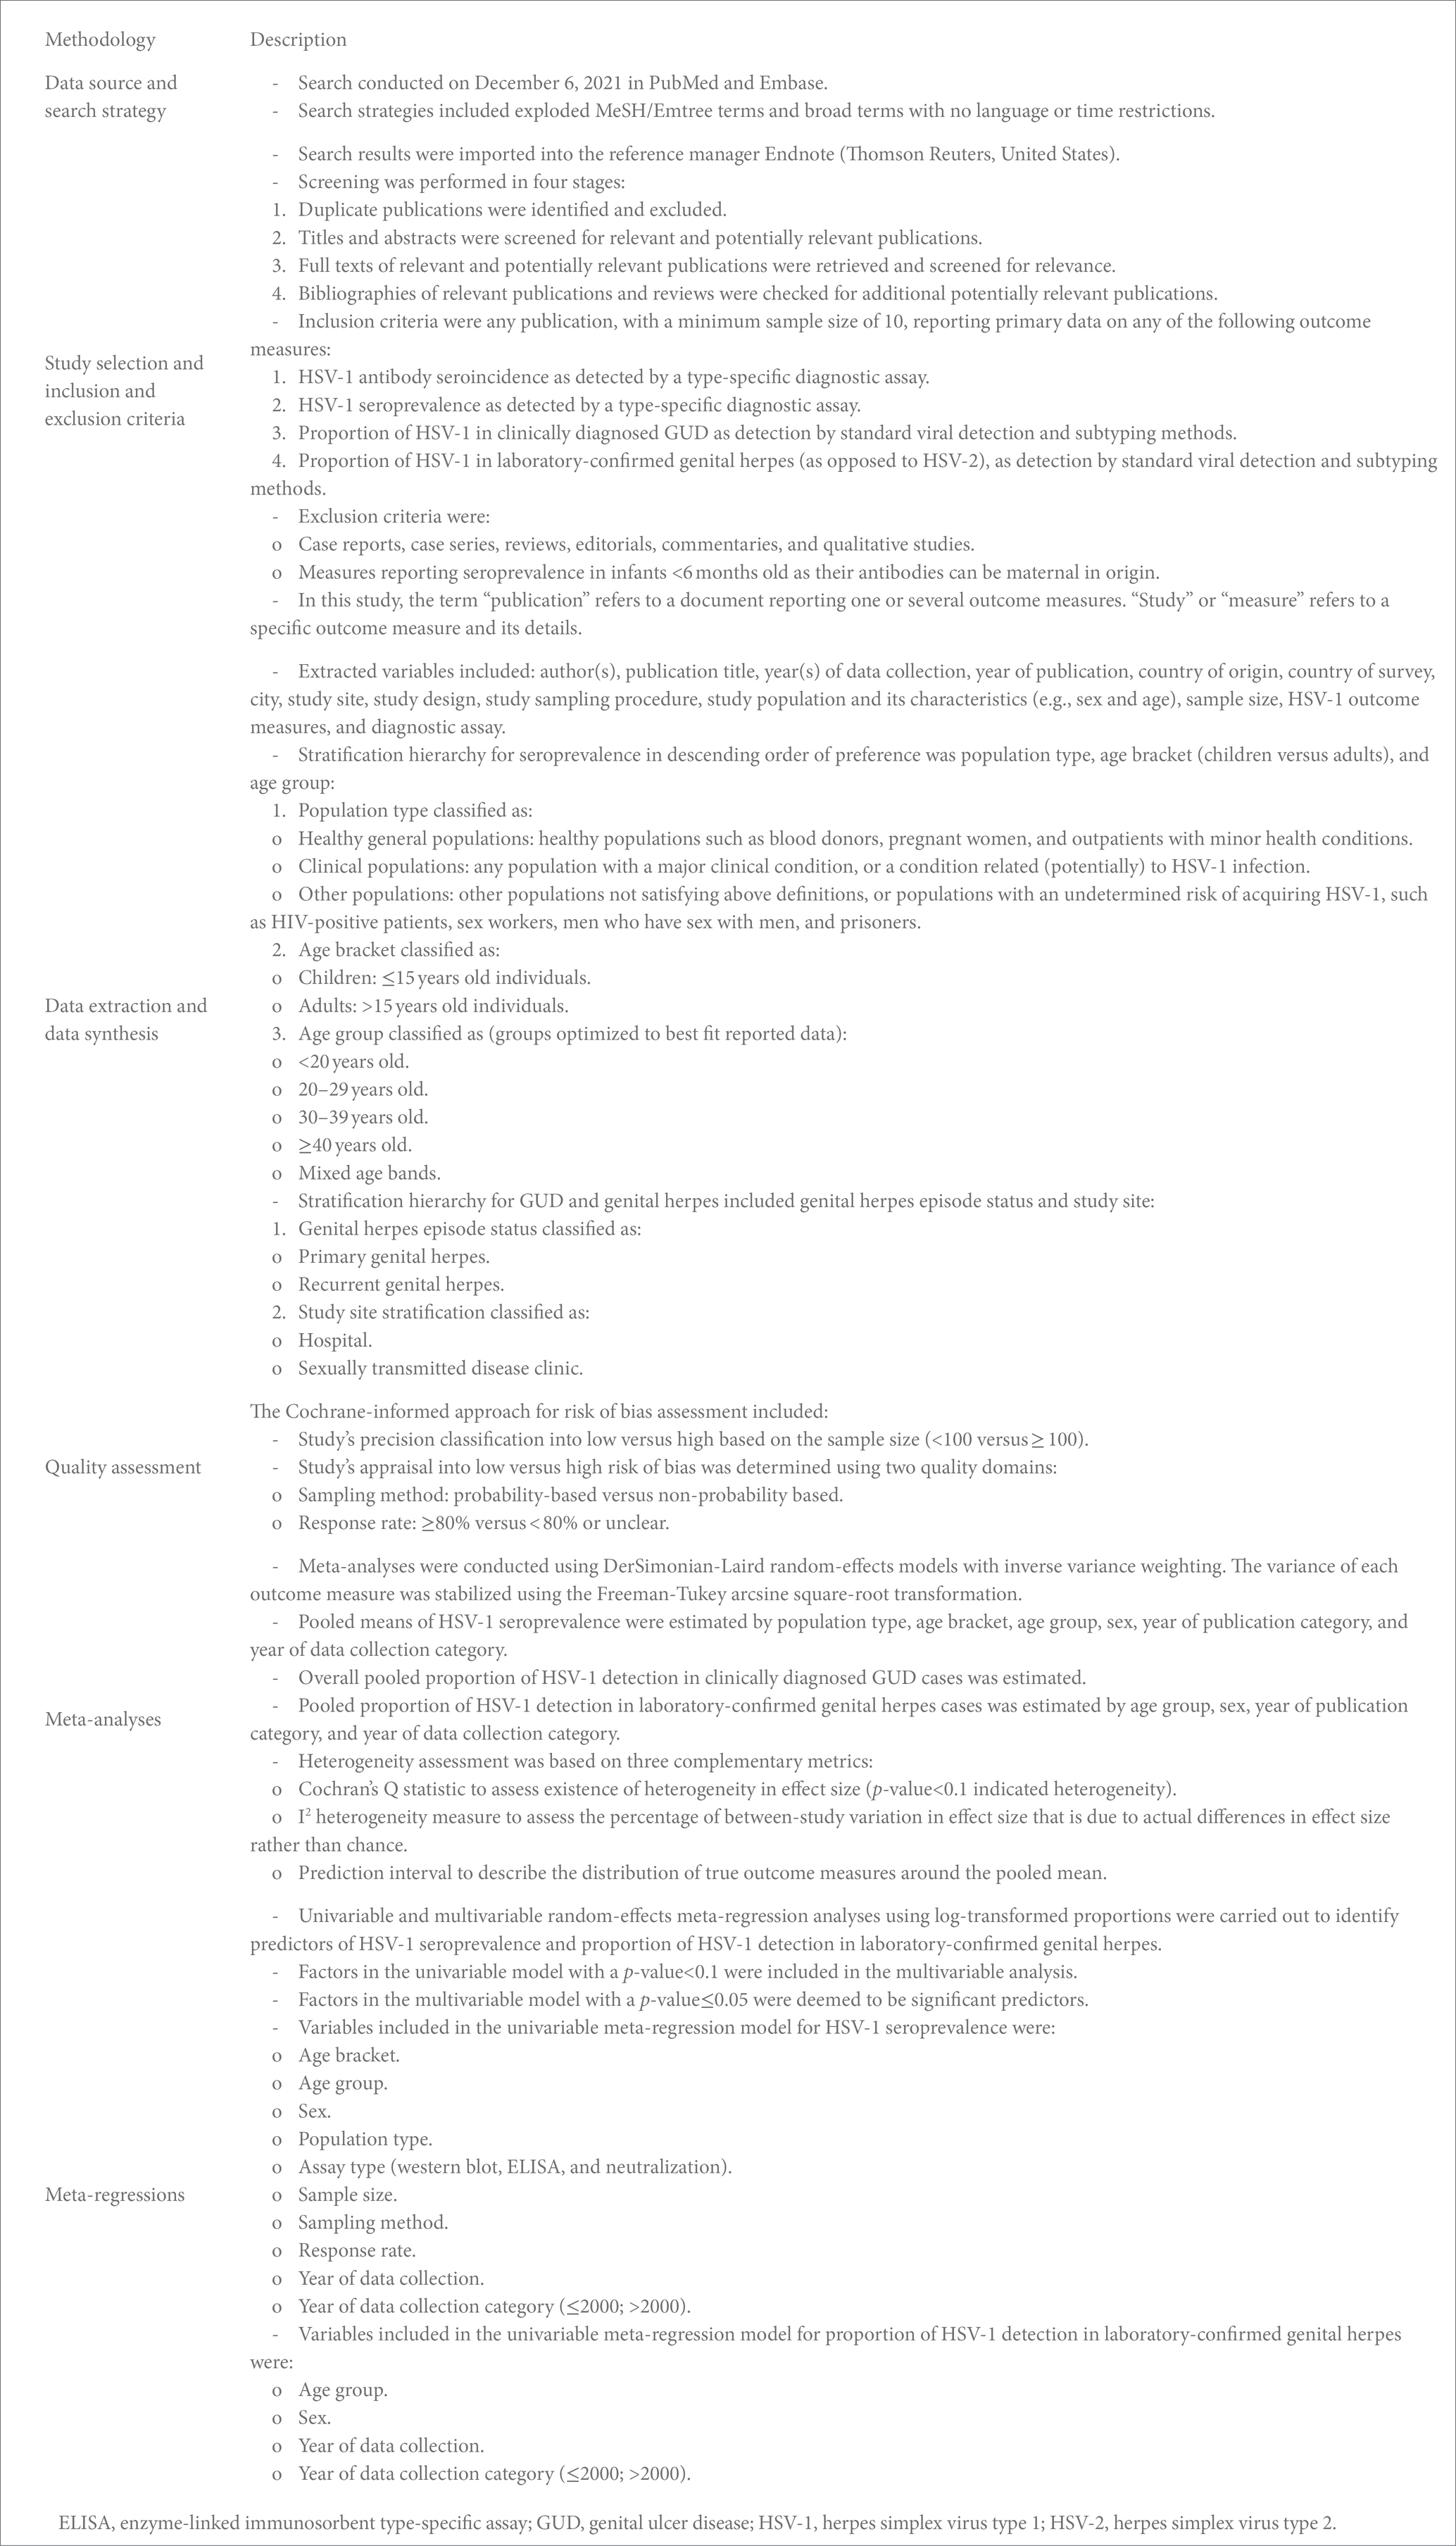
BOX 1. Description of the methodology for this study.
Data sources, search strategy, study selection, and eligibility criteria
HSV-1 publications were systematically reviewed as informed by the Cochrane Collaboration Handbook (28), and the results were reported following the Preferred Reporting Items for Systematic Reviews and Meta-analyses (PRISMA) guidelines (29, 30) (Supplementary Table S1). Search strategies are detailed in Supplementary Table S2 and were based on those developed in a series of published HSV-1 and HSV-2 systematic reviews (14–17, 21–27). The systematic literature search was conducted using PubMed and Embase databases, up until December 6, 2021. MeSH/Emtree terms, keywords, and broad search criteria were applied with no year or language restrictions to broaden the search scope and to ensure inclusivity (Supplementary Table S2). In addition, we searched institutional websites of Canadian public health authorities to identify potentially relevant reports including data not published in the scientific literature (Supplementary Table S2). Screening processes, inclusion criteria, and exclusion criteria are described in Box 1. Titles and abstracts of all citations were screened independently twice for relevant and potentially relevant publications, with the screening split among three reviewers (SM, UF, and LA).
Data extraction, synthesis, and quality assessment
Each of data extraction and double extraction from eligible studies were performed independently twice, with the extraction split among four reviewers (SM, MH, UF, and LA). Discrepancies in data extraction were settled by consensus, including also LJA, and, if needed, by contacting authors. A priori determined list of variables was used to extract data (Box 1). A quality assessment of the sensitivity and specificity of HSV-1 diagnostic assays was performed, given their known limitations, including the potential cross-reactivity with HSV-2 antibodies (31–35). This was done with the support of Professor Rhoda Ashley-Morrow of the University of Washington, an expert advisor in HSV-1 diagnostic methods. Only studies that utilized valid and reliable type-specific assays, with no potential for cross-reactivity with HSV-2, were included.
Included studies were evaluated for precision and risk of bias (ROB) as informed by the Cochrane approach (Box 1). Study precision was classified as either low or high, depending on whether the overall sample size was <100 or ≥ 100. Two quality domains were used to distinguish low versus high ROB: sampling method (probability-based versus non-probability-based) and response rate (≥80% versus < 80% or unclear) (Box 1).
Both overall measures and stratified measures were extracted from relevant studies (Box 1). Since our aim was to characterize the natural heterogeneity that exists in HSV-1 epidemiology, such as the variation in HSV-1 seroprevalence between children and adults, measures were extracted and stratified by key epidemiological factors known to affect the natural epidemiology of this infection (14, 17, 23, 24, 26, 27). Meta-regression analyses were further conducted on these stratified measures to estimate effects of these epidemiological factors on both HSV-1 seroprevalence and proportion of HSV-1 detection in genital herpes.
Meta-analyses
Meta-analyses were conducted using the DerSimonian-Laird random-effects model (36) with the Freeman-Tukey double arcsine transformation (37), after ensuring the transformation’s applicability given available data in this systematic review (38). The meta-analyses were used to obtain pooled mean estimates for HSV-1 seroprevalence and proportions of HSV-1 detection in GUD and in genital herpes (Box 1). These pooled estimates are meant to provide an average summary measure of the actual measures that exist in the population, as an overall measure and by specific factors or timeframes. The meta package (39) was used to perform these analyses in R version 4.0.4 (40).
Meta-regressions
Meta-regression analyses on log transformed outcome measures (seroprevalence and proportion of HSV-1 detection in genital herpes) were conducted in Stata/SE version 16 using the metareg package (41) to investigate between-study heterogeneity, potential associations, and overall temporal trends for HSV-1 seroprevalence and proportion of HSV-1 detection in genital herpes (Box 1). A linear relationship was assumed between the log transformed outcome measures and each of the independent variables . Back transformation was used to estimate the adjusted relative risks (aRR).
Results
Search results and scope of evidence
The study selection process per PRISMA guidelines is summarized in Figure 1. The search identified 684 publications (220 in PubMed and 464 in Embase), of which 20 proved relevant. Screening of bibliographies of relevant publications identified two additional relevant articles (42, 43). In total, 22 publications met the inclusion criteria. Extracted HSV-1 measures included 32 overall seroprevalence measures (79 stratified), 2 overall proportions of HSV-1 detection in clinically diagnosed GUD (2 stratified), and 8 overall proportions of HSV-1 detection in laboratory-confirmed genital herpes (27 stratified). No studies on HSV-1 seroincidence were identified. Publications and reports that were excluded after full-text screening from both databases and institutional websites of public health authorities in Canada are shown in Supplementary Table S7.
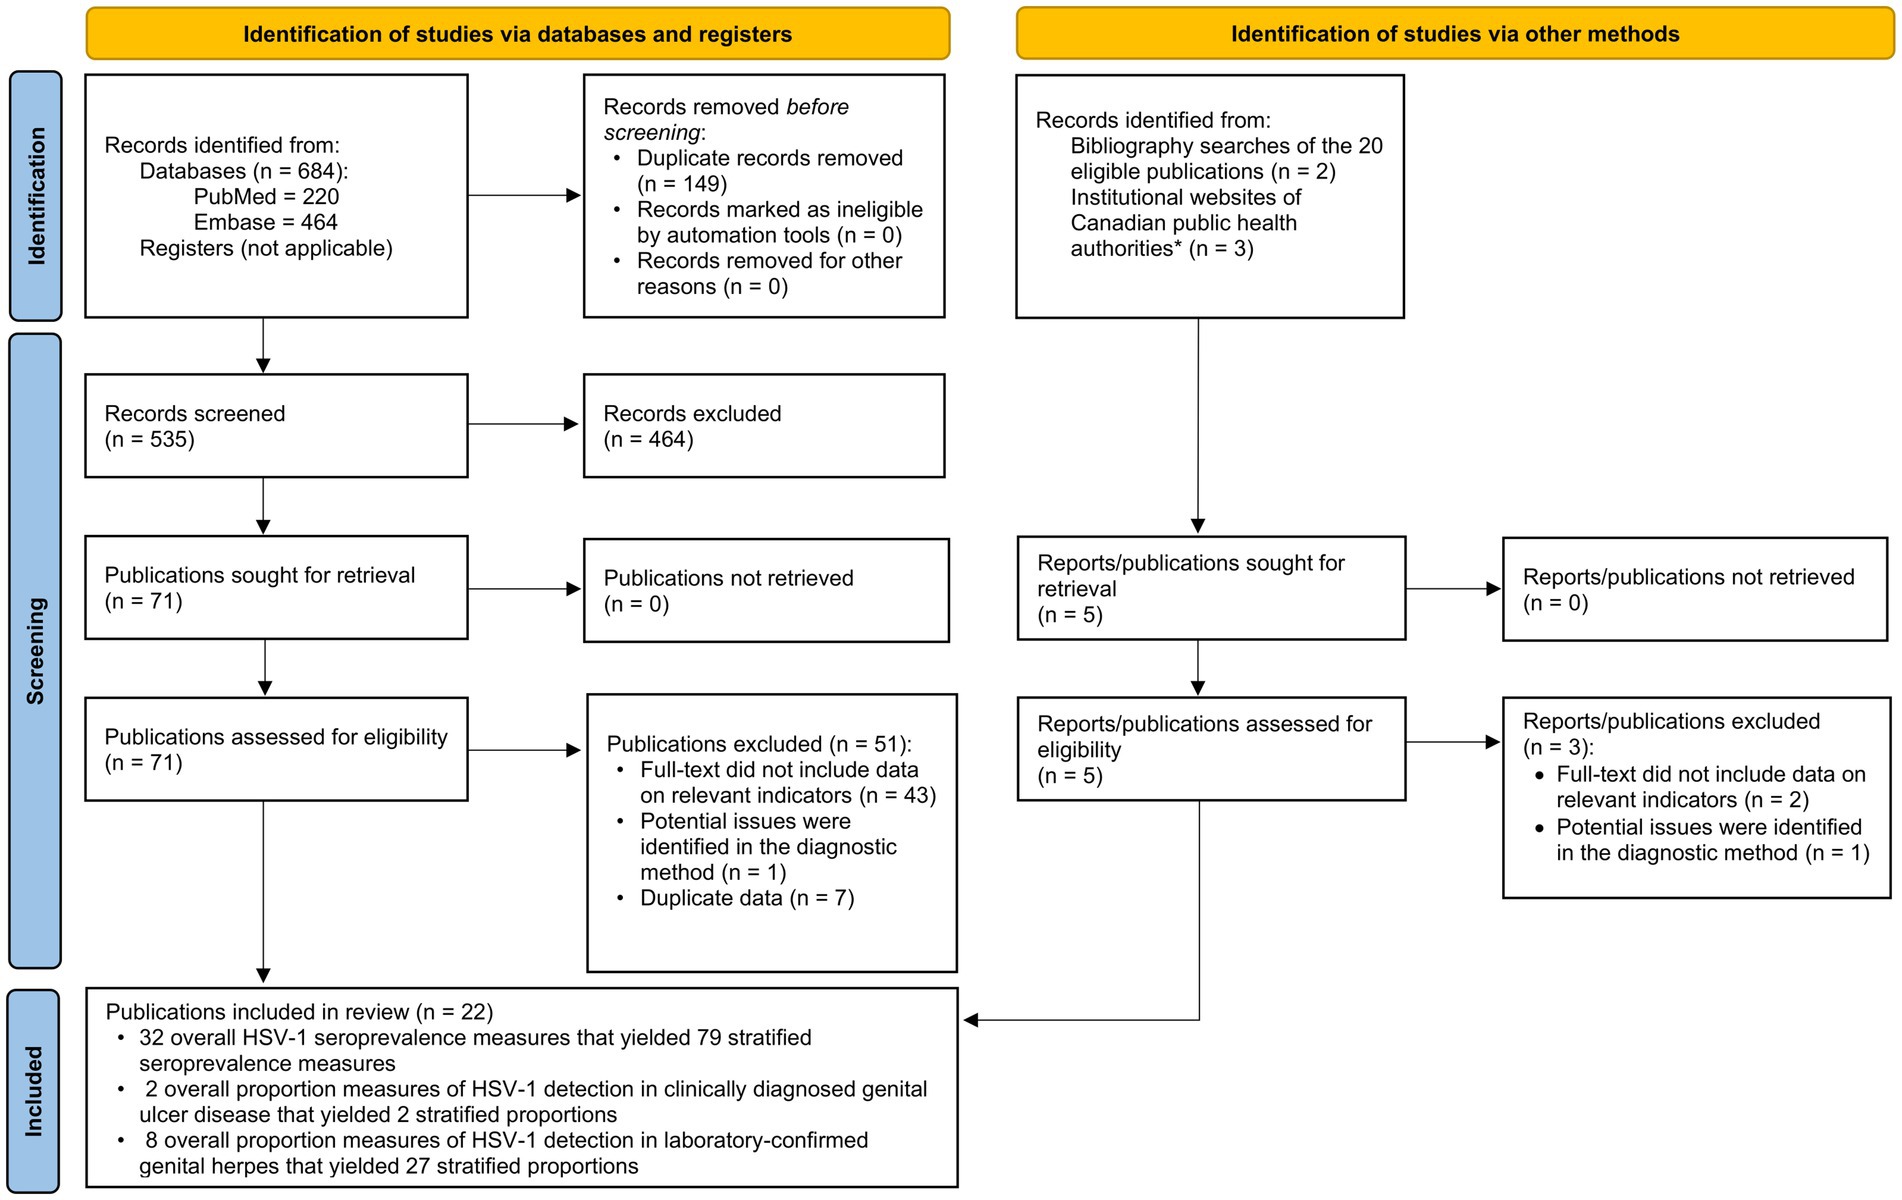
Figure 1. Flow diagram of article selection for the systematic review of HSV-1 infection in Canada, per PRISMA guidelines (30). *List of institutional websites of Canadian public health authorities are in Supplementary Table S2. HSV-1, Herpes simplex virus type 1.
Seroprevalence overview
Overall HSV-1 seroprevalence measures are listed in Supplementary Table S3. Most studies were published in 2005 or before (n = 19; 59.4%) and were conducted using convenience sampling (n = 23; 71.9%). Stratified HSV-1 seroprevalence measures for different populations and subpopulations are summarized in Table 1.
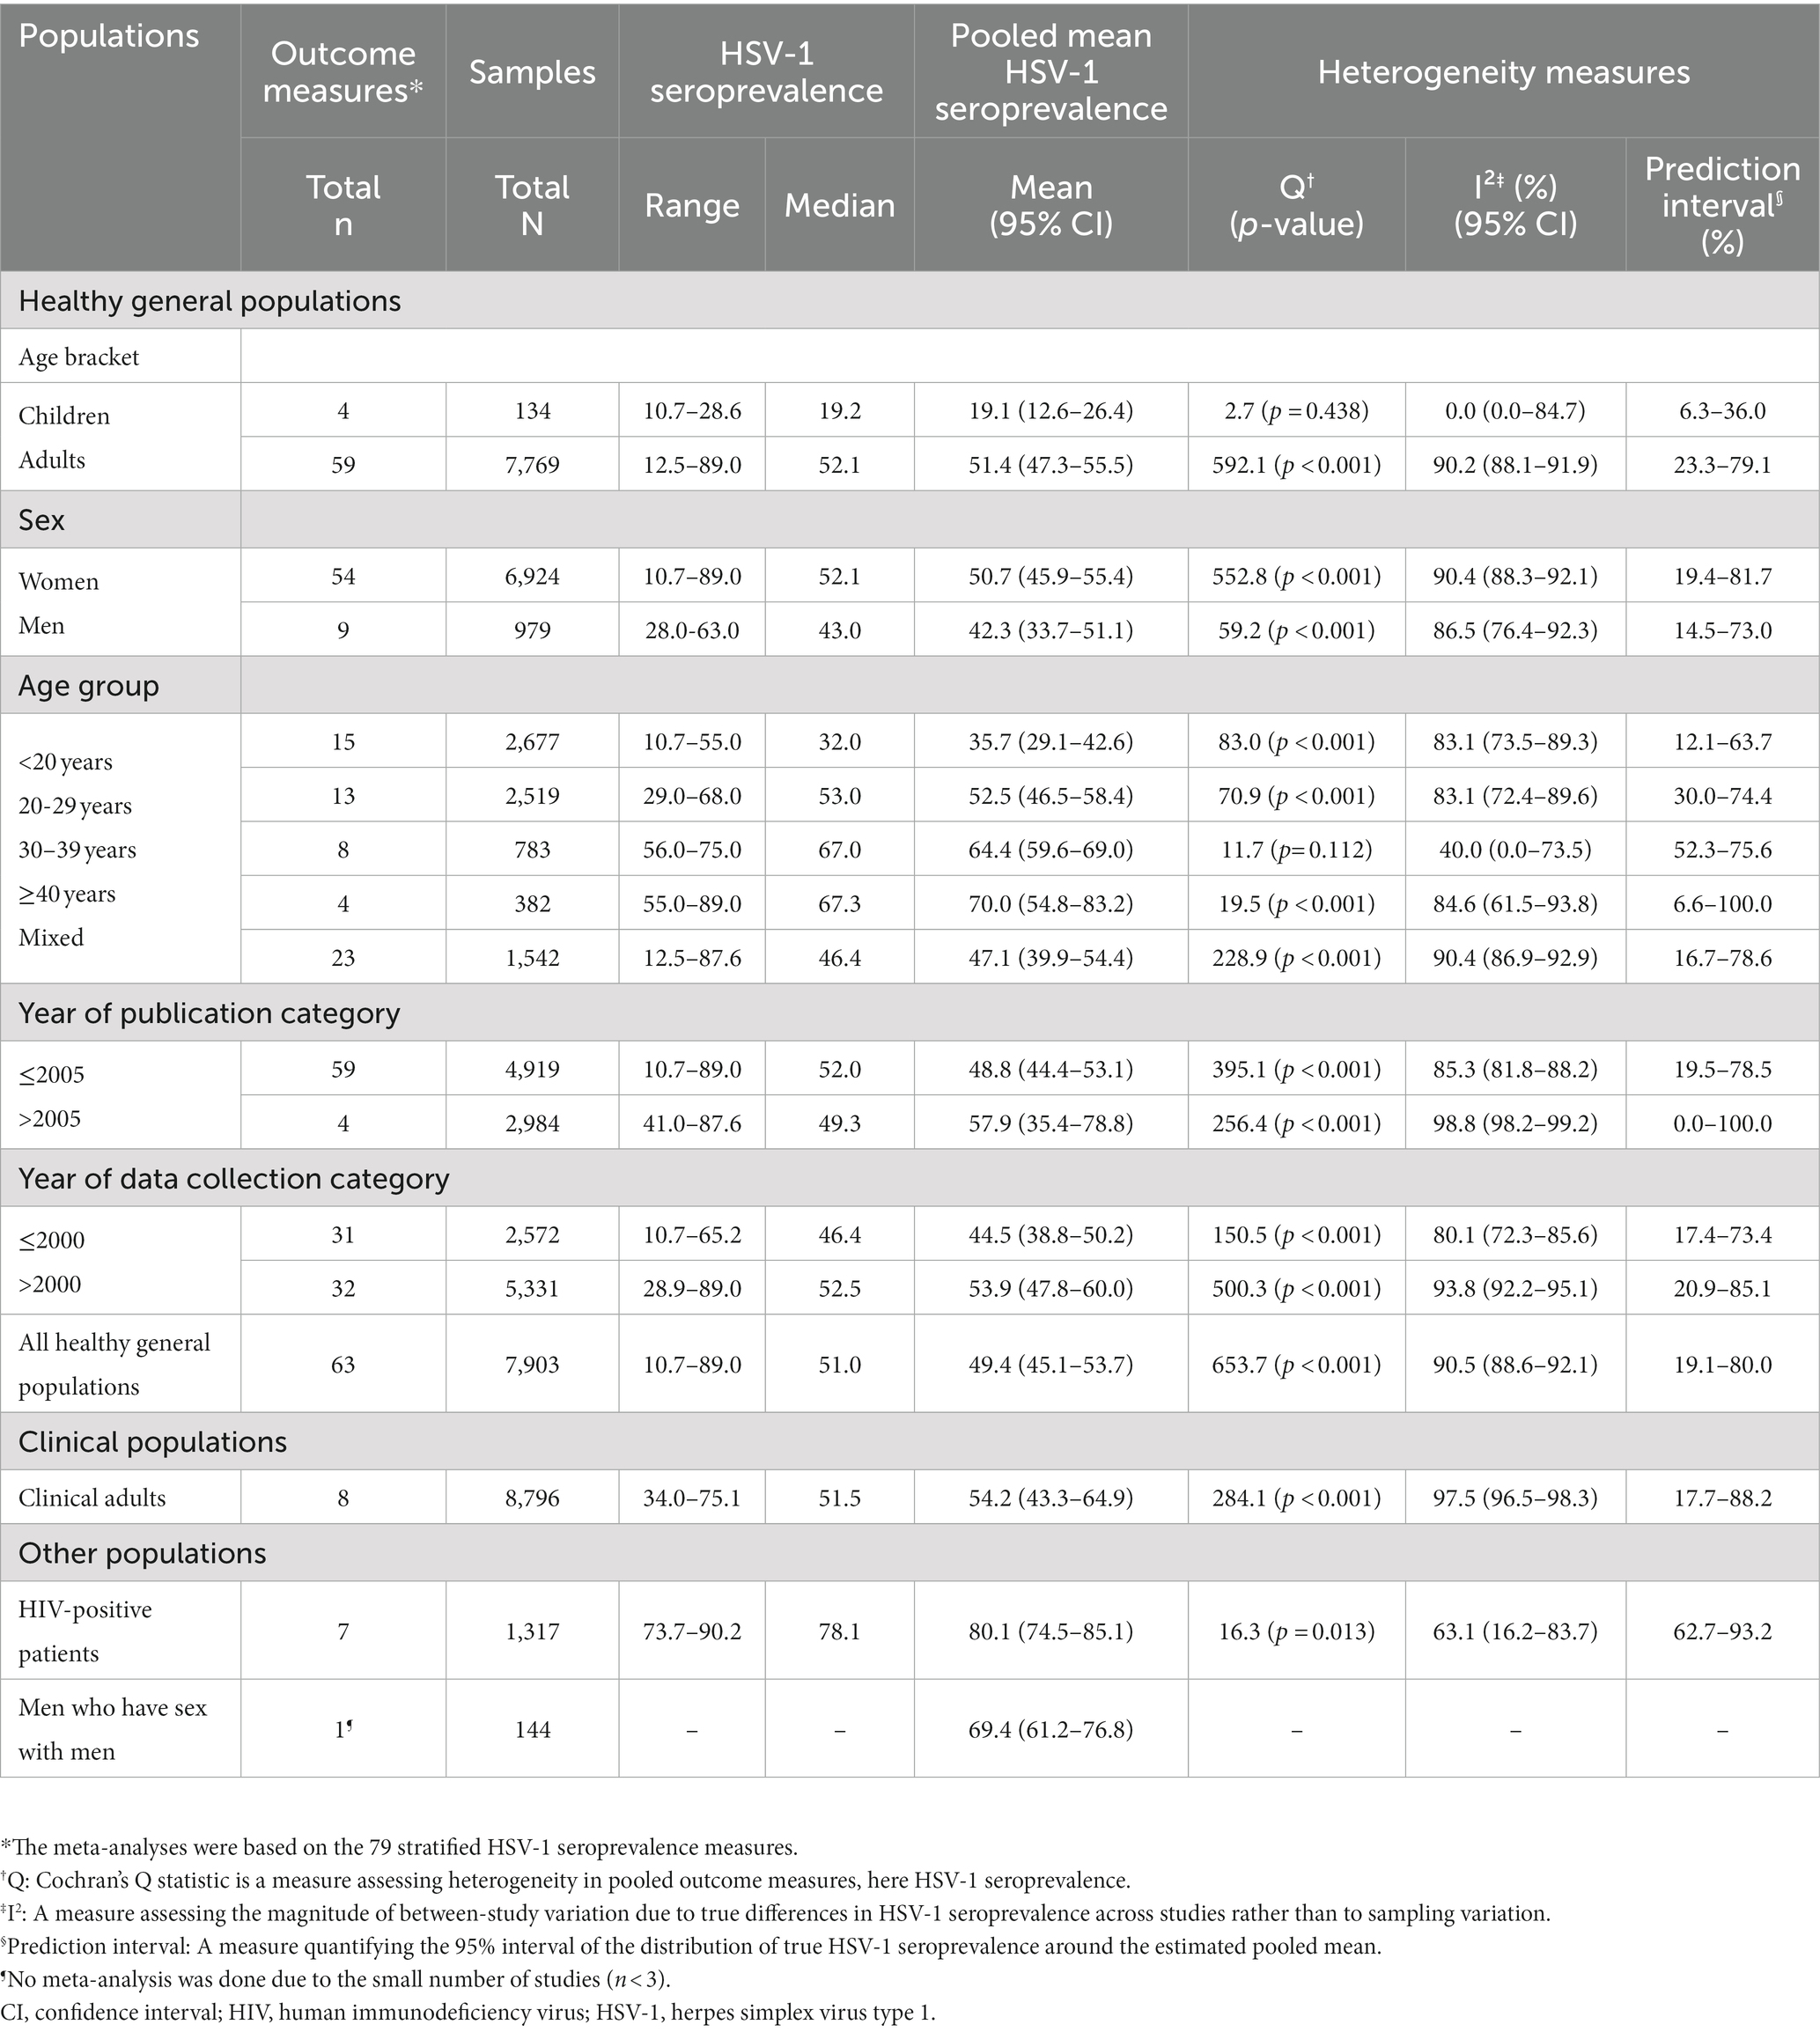
Table 1. Pooled mean estimates for HSV-1 seroprevalence in Canada.
Pooled mean estimates for HSV-1 seroprevalence
The meta-analyses were based on the 79 stratified HSV-1 seroprevalence measures. Pooled mean seroprevalence for healthy children, with a median age of 9 years, was 19.1% [95% confidence interval (CI): 12.6–26.4%]. In contrast, pooled mean seroprevalence for healthy adults was significantly higher at 51.4% (95% CI: 47.3–55.5%) (Table 1). Pooled mean seroprevalence for clinical adult populations was 54.2% (95% CI: 43.3–64.9%). Pooled mean seroprevalence for HIV-positive patients was 80.1% (95% CI: 74.5–85.1%).
Pooled mean seroprevalence in healthy general populations increased with age from 35.7% (95% CI: 29.1–42.6%) among individuals <20 years of age, followed by 52.5% (95% CI: 46.5–58.4%) in those 20–29 years, 64.4% (95% CI: 59.6–69.0%) in those 30–39 years, and 70.0% (95% CI: 54.8–83.2) in those ≥40 years.
Most meta-analyses showed evidence of heterogeneity (p-value<0.001) with wide prediction intervals (Table 1). Most seroprevalence variation was caused by true differences in seroprevalence, as opposed to sampling variation (I2 > 50%). This affirms the need for meta-regressions to explain this heterogeneity. Forest plots for the meta-analyses by population type classification are shown in Supplementary Figure S1.
Sources of between-study heterogeneity and predictors of HSV-1 seroprevalence
In the univariable meta-regression analyses for HSV-1 seroprevalence, the following variables were eligible for inclusion in the final multivariable analyses: age bracket, age group, sex, population type, assay type, sample size, sampling method, response rate, and year of data collection (Table 2 and Supplementary Table S4). Because of collinearity between age bracket and age group, and collinearity between year of data collection as a linear term and as a categorical variable, four multivariable models were conducted. The four models analyzed the 79 stratified HSV-1 seroprevalence measures.
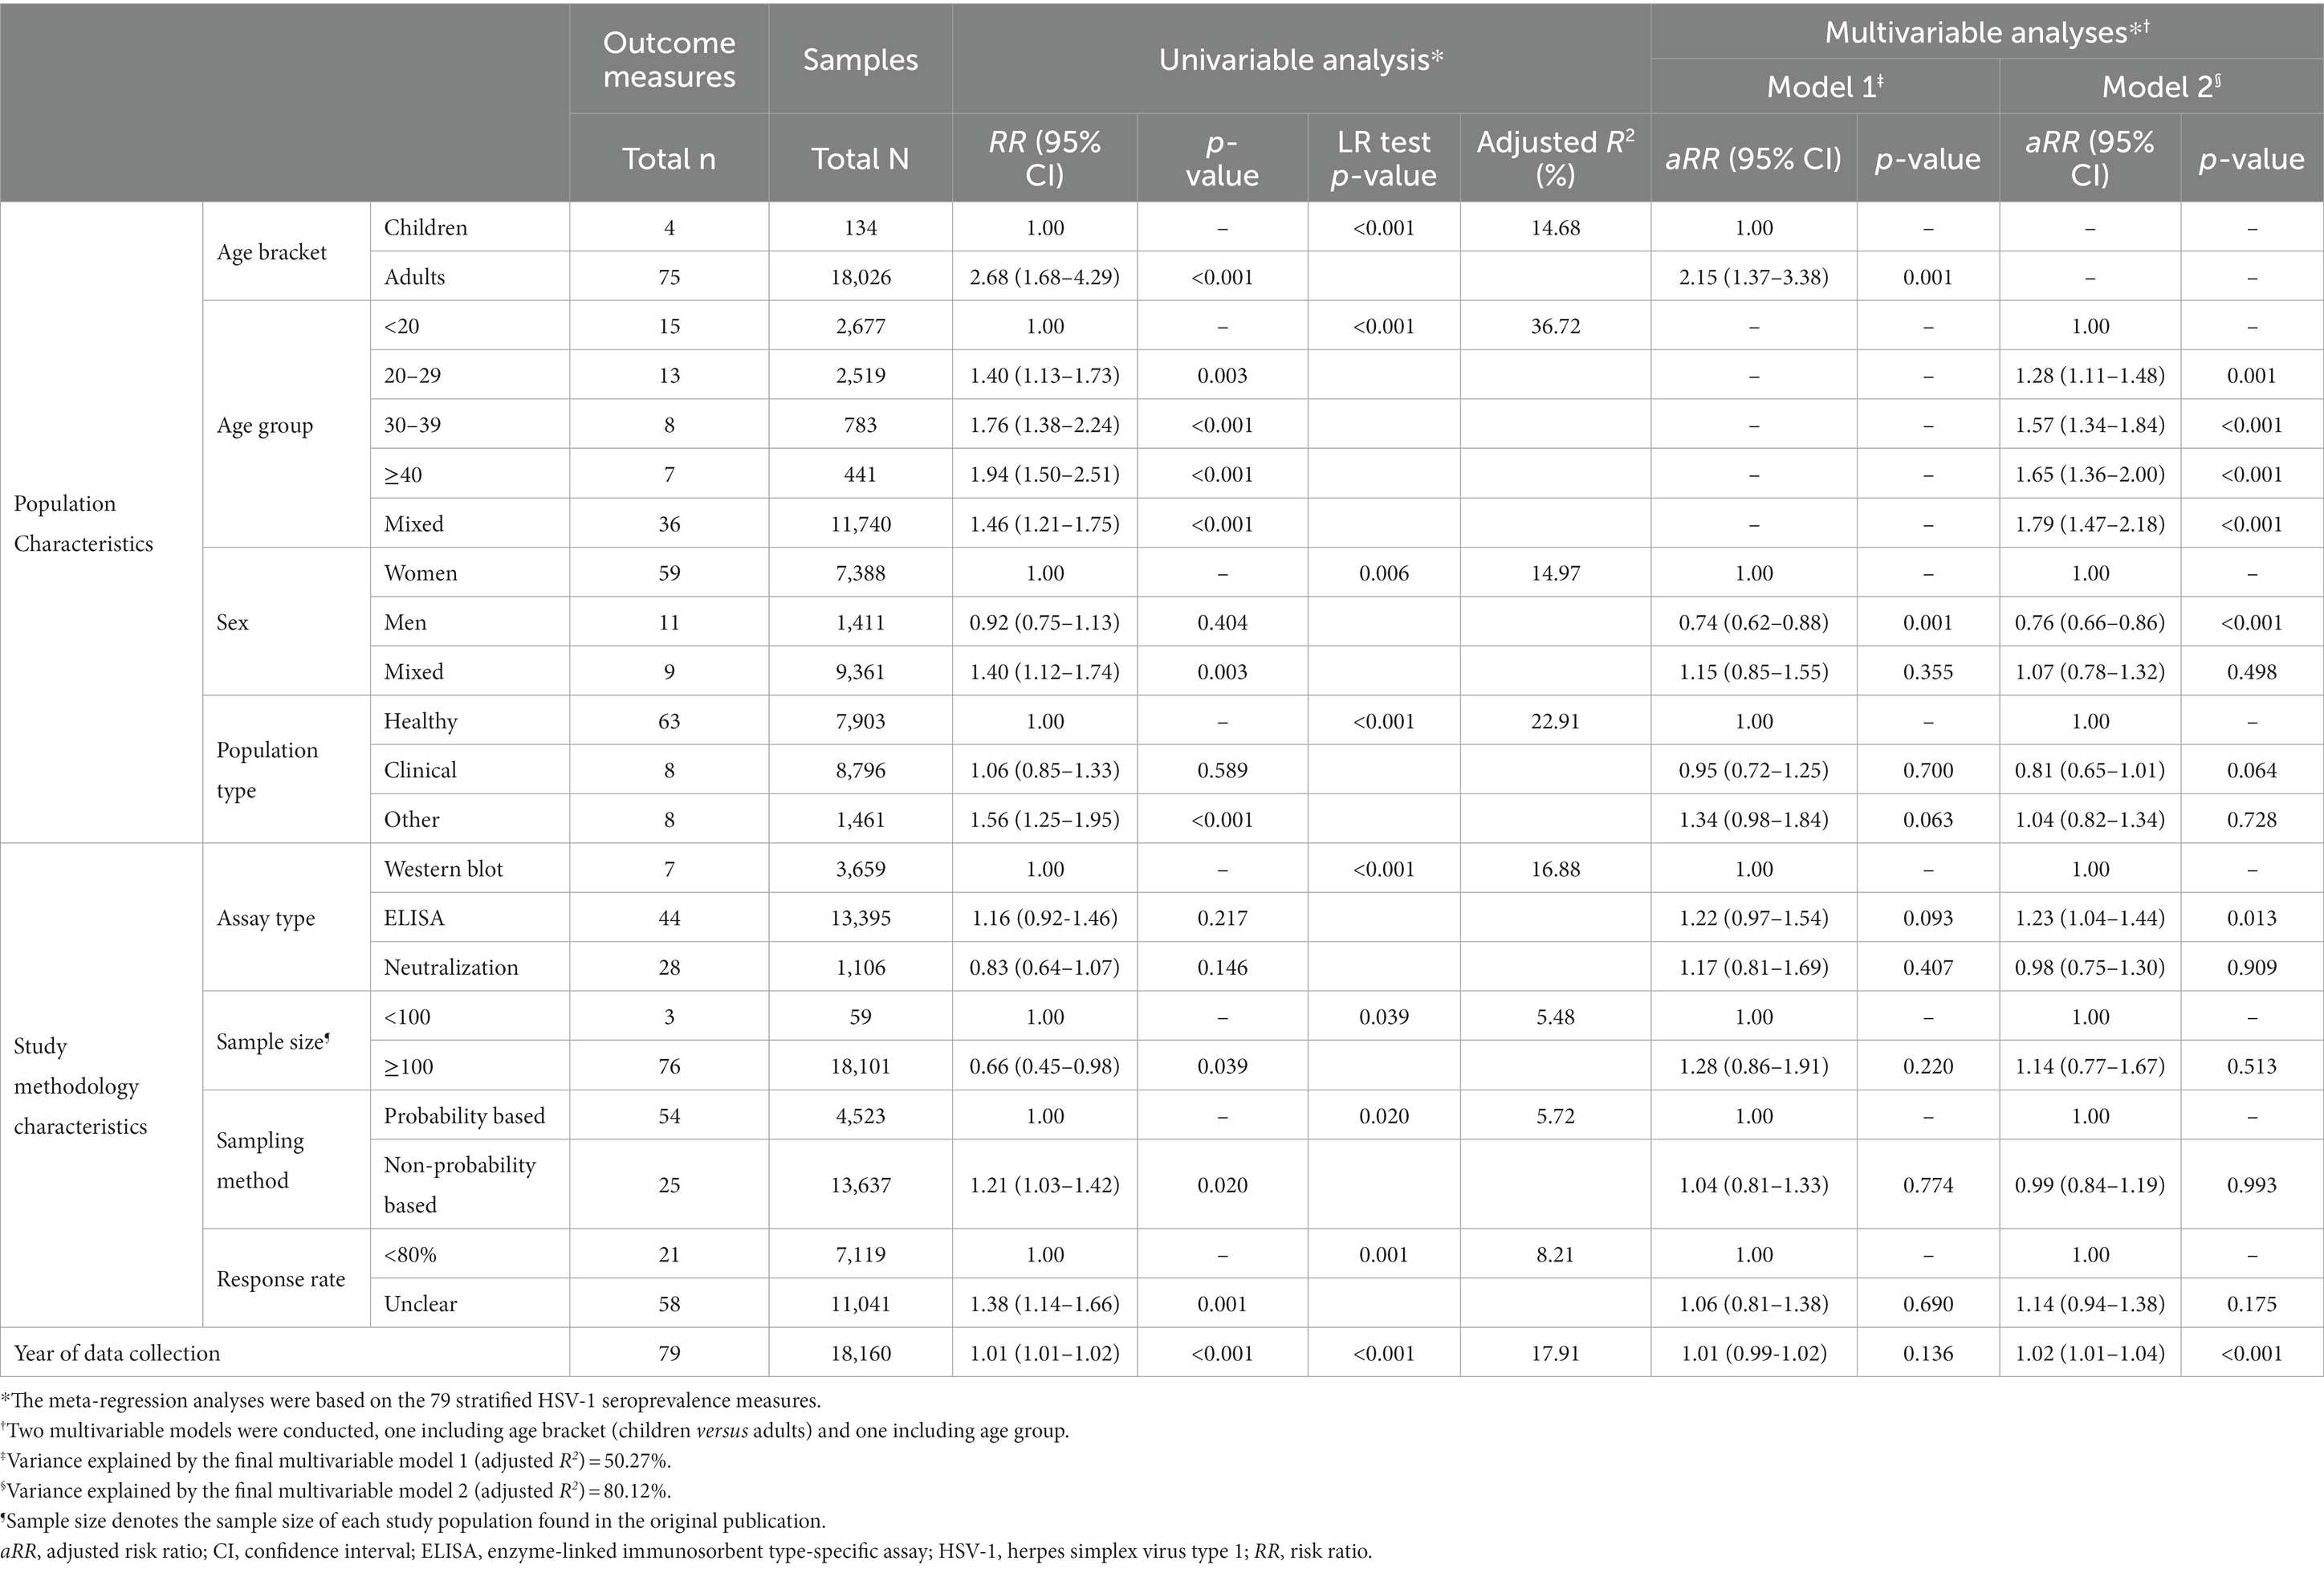
Table 2. Univariable and multivariable meta-regression analyses for HSV-1 seroprevalence in Canada.
The model that included age group, sex, population type, assay type, sample size, sampling method, response rate, and year of data collection as a linear term explained 80.12% of the variation (heterogeneity) in HSV-1 seroprevalence (Table 2). Compared to individuals <20 years of age, seroprevalence was 1.28-fold (95% CI: 1.11–1.48) higher in those 20–29 years, 1.57-fold (95% CI: 1.34–1.84) higher in those 30–39 years, and 1.65-fold (95% CI: 1.36–2.00) higher in those ≥40 years. Men had 0.76-fold (95% CI: 0.66–0.86) lower seroprevalence than women. Seroprevalence increased by 1.02-fold (95% CI: 1.01–1.04) per year.
Compared to studies using western blot as a diagnostic assay, seroprevalence was higher in studies that used enzyme-linked immunosorbent assays (ELISA) (Table 2). There was no evidence for differences in seroprevalence by population type (healthy versus clinical), sample size, sampling method, and response rate. The remaining three multivariable models confirmed similar findings (Table 2 and Supplementary Table S4).
HSV-1 detection in clinically diagnosed GUD and in laboratory-confirmed genital herpes
Overall proportions of HSV-1 detection in clinically diagnosed GUD and in laboratory-confirmed genital herpes are listed in Supplementary Table S5. Stratified proportions of these measures are summarized in Table 3. In GUD cases (n = 2), pooled mean proportion of HSV-1 detection was 30.8% (95% CI: 12.6–52.8%; Table 3).
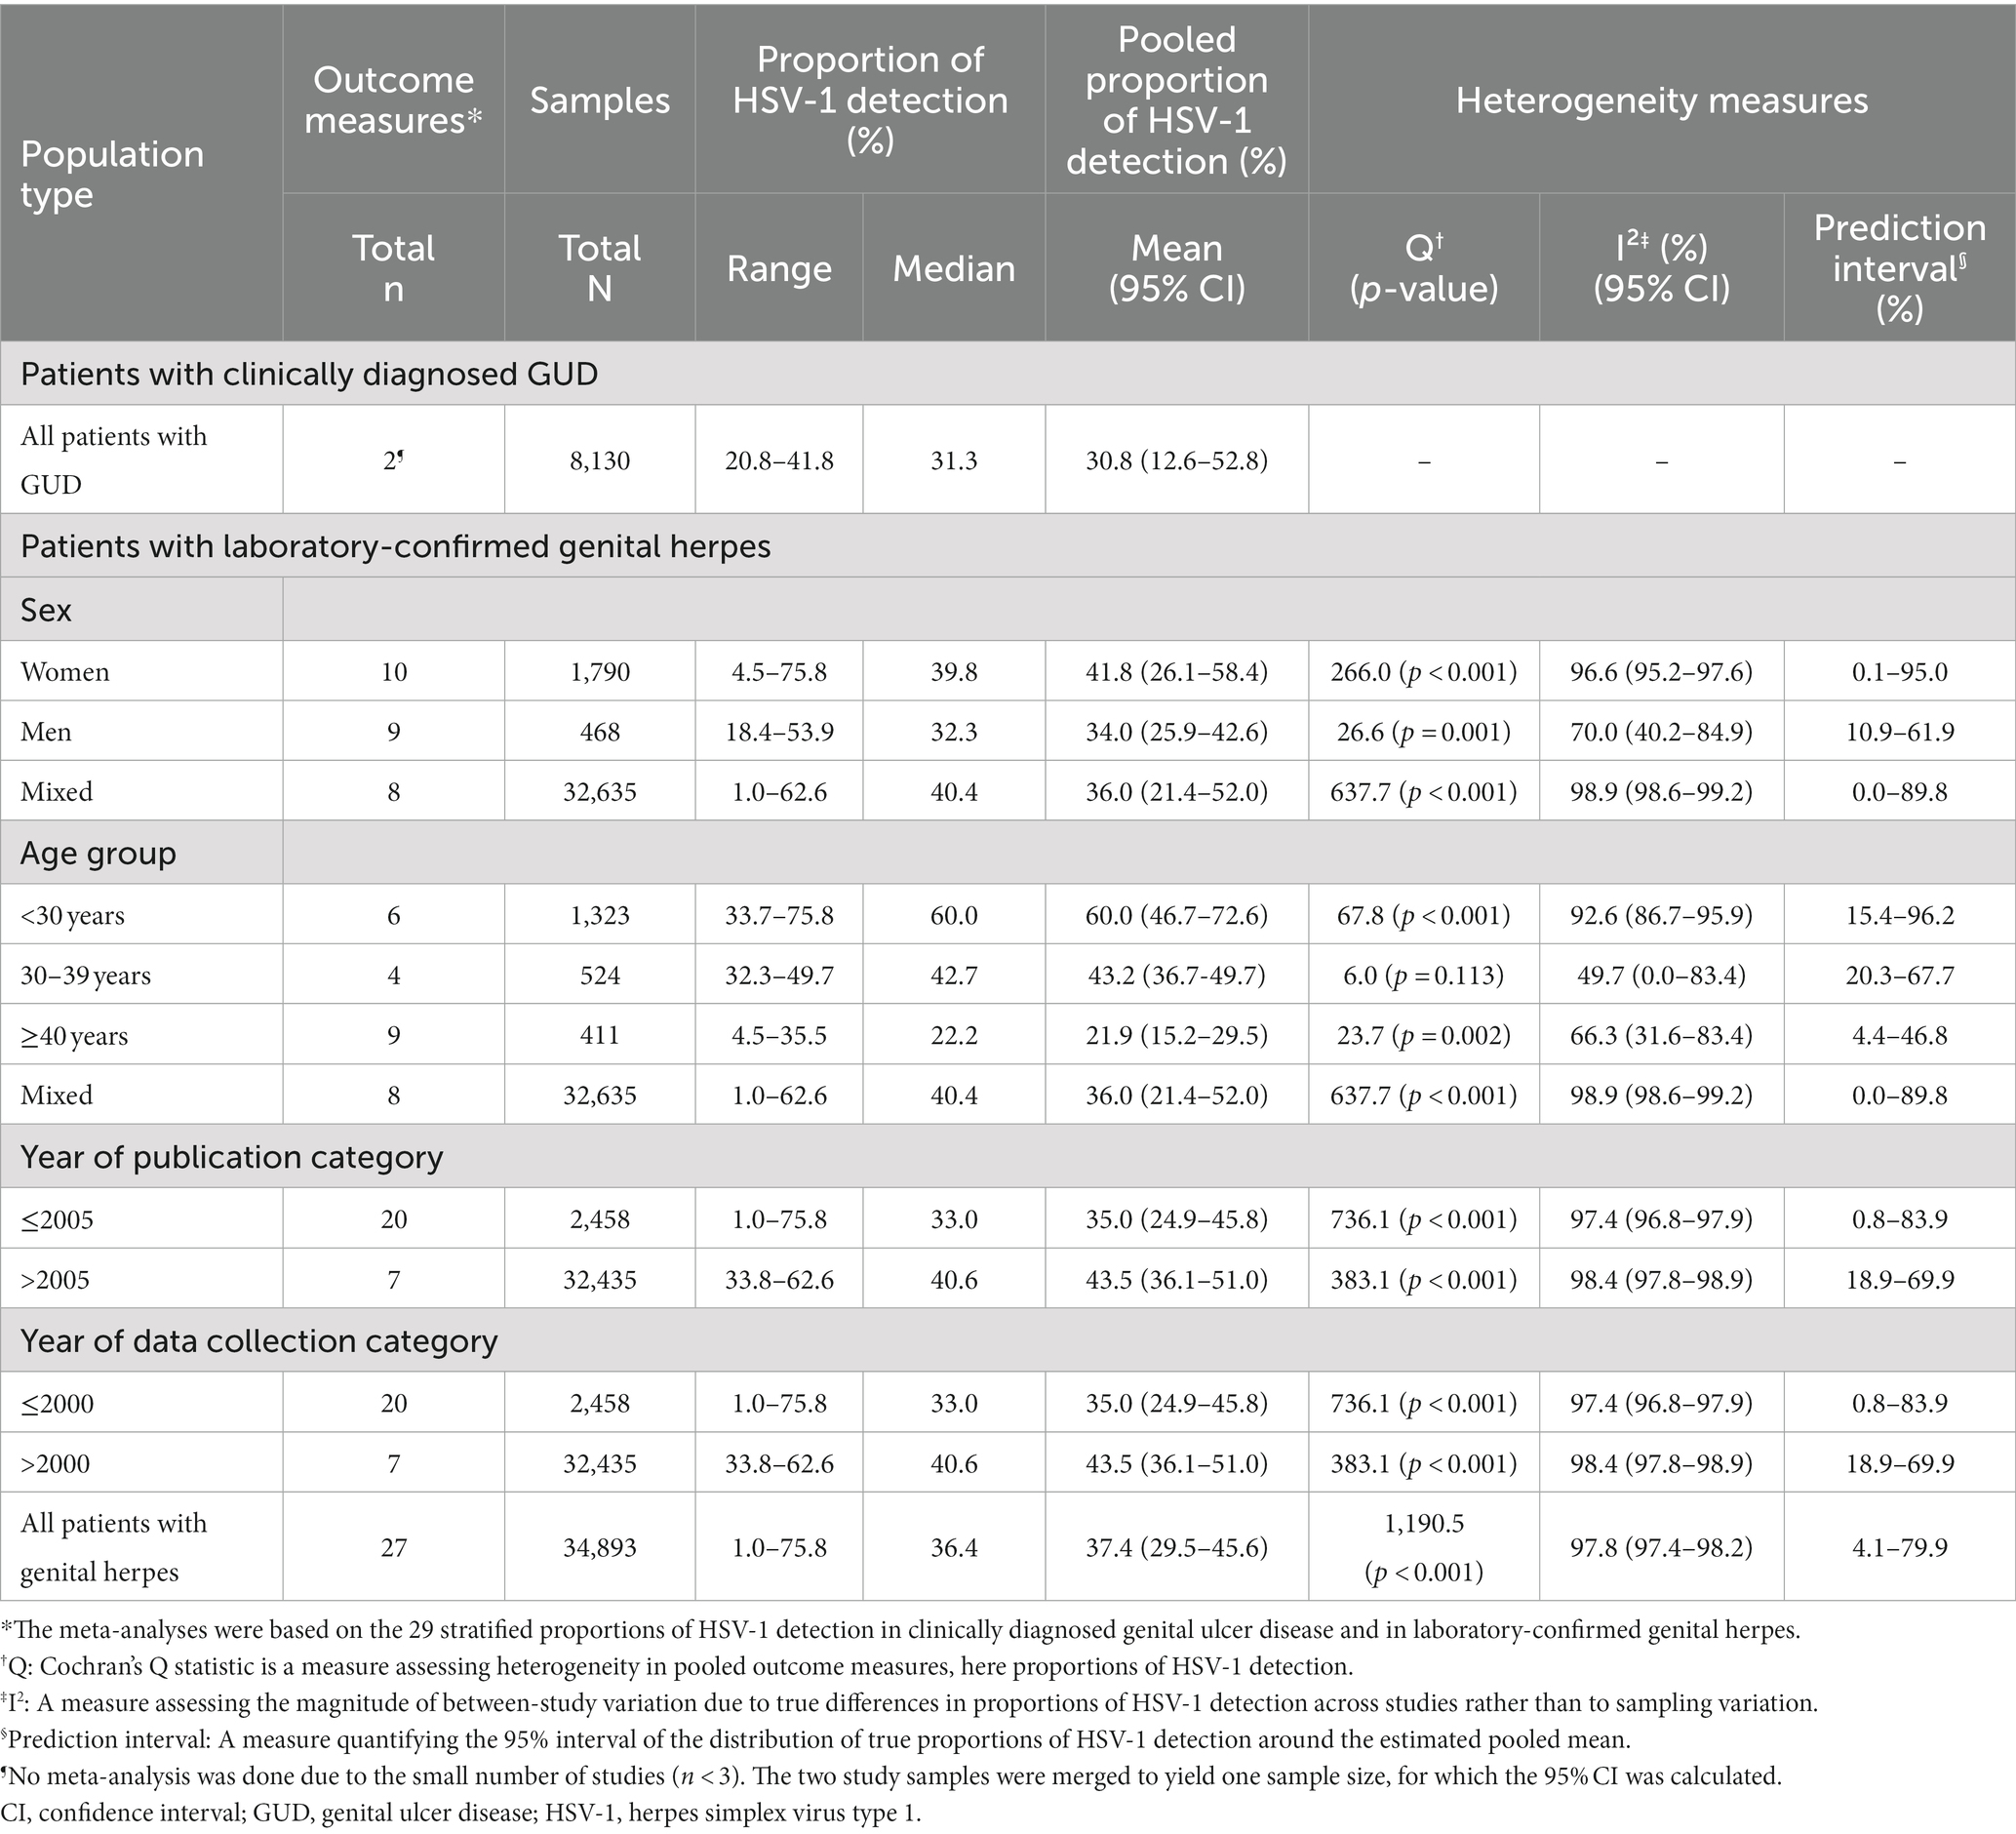
Table 3. Pooled mean proportions of HSV-1 detection in clinically diagnosed genital ulcer disease and in laboratory-confirmed genital herpes in Canada.
The meta-analyses were based on the 27 stratified proportions of HSV-1 detection in genital herpes. The pooled mean proportion of HSV-1 detection in genital herpes was 37.4% (95% CI: 29.5–45.6%; Table 3). Among women (n = 10), the pooled mean proportion was 41.8% (95% CI: 26.1–58.4%). Among men (n = 9), the pooled mean proportion was 34.0% (95% CI: 25.9–42.6%).
Heterogeneity was evident in most meta-analyses (p-value<0.001, I2 > 50%) and resulted in wide prediction intervals. A forest plot of the meta-analysis for the proportion of HSV-1 detection in laboratory-confirmed genital herpes is shown in Supplementary Figure S2.
Sources of between-study heterogeneity and predictors of HSV-1 detection in genital herpes
Results of the univariable and multivariable meta-regressions for the proportion of HSV-1 detection in laboratory-confirmed genital herpes are shown in Table 4. The multivariable model explained 84.3% of the variation (heterogeneity) in HSV-1 proportion and included age group, sex, and year of data collection as a linear term (Table 4). The model analyzed the 27 stratified proportions of HSV-1 detection in genital herpes.
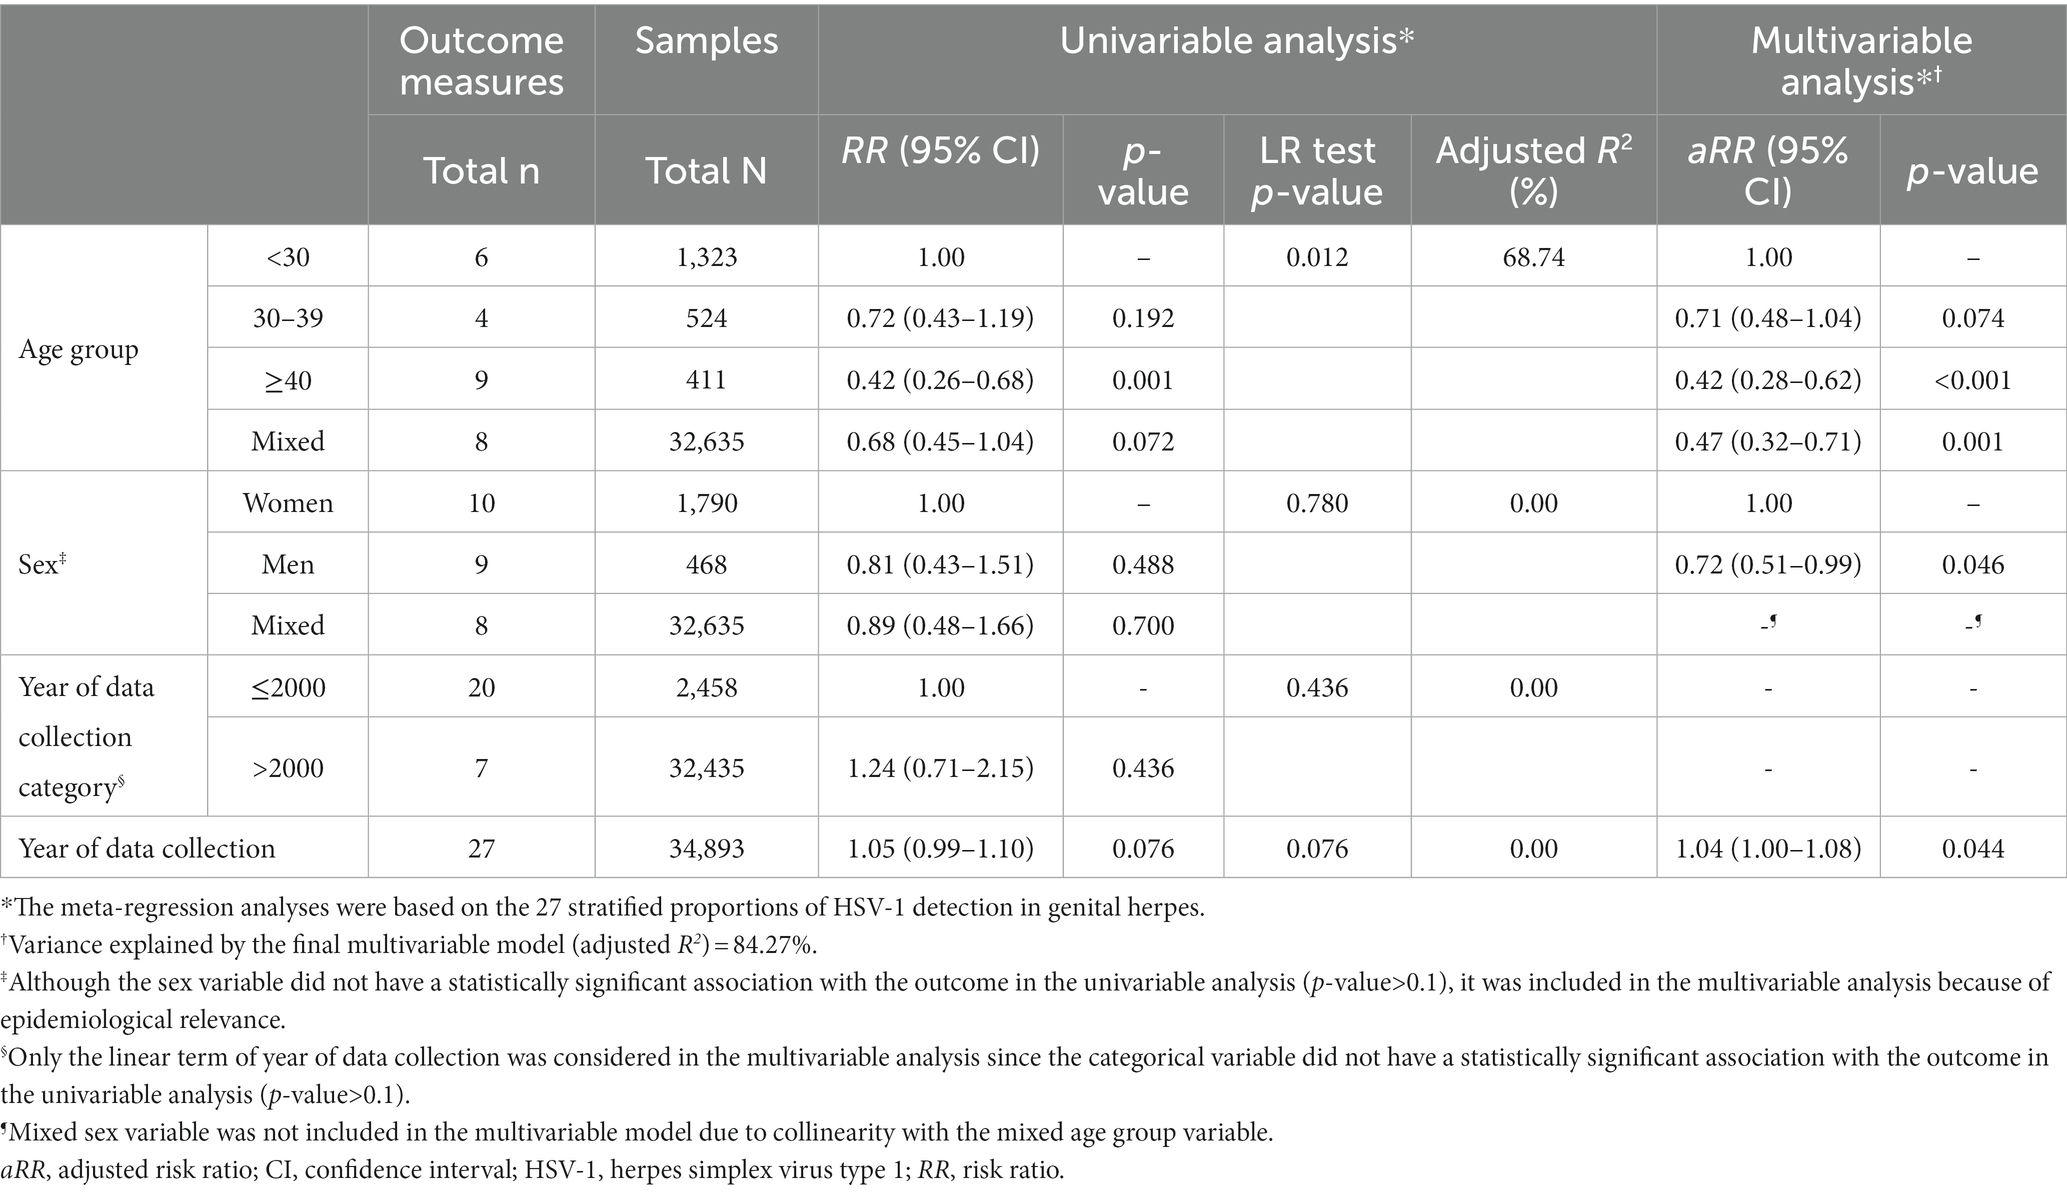
Table 4. Univariable and multivariable meta-regression analyses for HSV-1 detection in laboratory-confirmed genital herpes in Canada.
Compared to individuals <30 years of age, the proportion of HSV-1 detection was 0.71-fold (95% CI: 0.48–1.04) lower in those 30–39 years, and 0.42-fold (95% CI: 0.28–0.62) lower in those ≥40 years. Compared to women, the proportion of HSV-1 detection in genital herpes was 0.72-fold (95% CI: 0.51–0.99) lower in men. The proportion of HSV-1 detection in genital herpes increased by 1.04-fold (95% CI: 1.00–1.08) per year.
Quality assessment
Outcomes of quality assessment are shown in Supplementary Table S6. Twenty-nine studies (90.6%) were of high precision, 9 studies (28.1%) were of low ROB in the sampling method domain, and no studies were of low ROB in the response rate domain. Three (9.4%) studies were of low precision, 23 studies (71.9%) were of high ROB in the sampling method domain, and 5 studies (15.6%) were of high ROB in the response rate domain. No studies were of low ROB in both quality domains, while only one study (3.1%) was of high ROB in both quality domains. For 27 studies (84.4%), the ROB assessment for the response rate domain was “unclear.” Notably, in the meta-regressions for HSV-1 seroprevalence, none of the precision and ROB domains were significantly associated with HSV-1 seroprevalence (Table 2 and Supplementary Table S4).
Discussion
This study provided a detailed characterization and assessment of HSV-1 epidemiology in Canada. Both HSV-1 seroprevalence and proportion of HSV-1 detection in genital herpes appears to be increasing with time in this country. Two-thirds of youth are approaching sexual debut without being infected orally in childhood; thus, they are at risk of acquiring the infection genitally, through oral-genital sex or genital-genital sex, causing genital herpes (5). As a result, a range of psychosexual adverse outcomes can emerge such as effects on sexual relations and quality of life, depression, anxiety, and low self-esteem (44–47).
The shift in HSV-1 epidemiology from oral to increasingly genital acquisition in Canada resembles that observed in the United States, Western Europe, and Australia and New Zealand (5, 7, 14, 27, 48). This shift particularly affects youth and women, where rates of HSV-1 detection in genital herpes were highest (Table 4). However, unlike the United States and Western Europe (5, 7, 14, 48), HSV-1 seroprevalence is on the rise in Canada, potentially due to an increase in immigration from regions where HSV-1 seroprevalence rates are higher, notably Asian countries. These countries contribute to more than half of the immigrant population arriving in Canada (49). This increase was also observed in Australia, perhaps for a similar reason (27). Nevertheless, the seroprevalence of HSV-1 in Canada is comparable to that in the United States, standing at 58% (5, 7). However, it remains lower than the estimated global HSV-1 seroprevalence, which is estimated using mathematical modeling at 67% (9). In a global context, Canada’s seroprevalence rate is relatively low and significantly below the historical levels of near-universal childhood infection observed in other regions. For instance, Europe reports a seroprevalence of 74% (14), Asia at 77% (17), Australia at 85% (27), Latin America and the Caribbean at 85% (26), the Middle East and North Africa at 89% (23), and Africa at 96% (24).
HSV-1 seroprevalence increases with age, reflecting lifetime cumulative exposure, just as elsewhere (17, 23, 24, 26, 48). Age alone explained one-third of seroprevalence variation (Table 2). Seroprevalence among children was much less than among adults, suggesting, in context of the global epidemiology of this infection and its historical pattern (14, 17, 23, 24, 26, 27), that older cohorts had higher exposure in childhood, compared to the current cohort of children. Seroprevalence among healthy children in Canada, standing at 19%, was found to be comparatively lower than that of Europe (32%) (14), Asia (49%) (17), Latin America and the Caribbean (57%) (26), the Middle East and North Africa (65%) (23), and Africa (69%) (24). Seroprevalence was lower in males than females, a pattern seen elsewhere only in Europe and Australia (14, 27), in contrast to the global pattern (17, 23, 24, 26), in which there are no significant differences in seroprevalence by sex.
HSV-1 (versus HSV-2) detection in genital herpes was high at 37%, a level similar to that observed in the United States (33%) (50), Western Europe (34%) (14), and Australia and New Zealand (31%) (27), but much higher than the level observed in other regions [19% in Asia (17), 11% in Latin America and the Caribbean (26), and 1% in Africa (24)]. Also similar to Europe and Australia and New Zealand (14, 27), HSV-1 detection in genital herpes increased with time. Such indicators, along with the large difference in seroprevalence between children and adults, are classic indicators defining a shift in HSV-1 epidemiology, from oral to increasingly genital acquisition, as observed in the United States and other Western countries (5, 7, 13, 14, 27). In context of the global evidence for the epidemiology of this infection, and based on pooling the different lines of evidence generated in this study, it appears that there is an ongoing HSV-1 epidemiological transition in Canada whereby HSV-1 infection plays an increasing role as a sexually transmitted infection.
These findings are consistent with findings of a study for HSV-2 infection in Canada that estimated HSV-2’s contribution to genital herpes at 62% and decreasing with time (22). Women were more affected by HSV-1 genital herpes than men, possibly reflecting an age gap in sexual partnerships, in which younger women partner with older men, or possibly reflecting a higher biological susceptibility of women who acquire the infection genitally (51, 52).
The present study has limitations. Included studies showed heterogeneity, yet most of the heterogeneity in seroprevalence and in proportion of HSV-1 detection in genital herpes reflected the natural heterogeneity that exists in HSV-1 epidemiology due to key epidemiological factors, such as age. More than 80% of the variation in seroprevalence and in proportion of HSV-1 detection in genital herpes was explained by few epidemiological factors through the meta-regression analyses (Tables 2, 4 and Supplementary Table S4).
While it is not known whether available measures are adequate to provide a representative sample of all studies that could theoretically be done in Canada during the study’s timeframe, there was a considerable number of studies from different parts of Canada, in different populations, and in different years to support that this number of studies may provide a random sample of studies that could theoretically have been done. Accordingly, the identified trends and patterns should be representative of the actual trends and patterns that exist in the overall population. Indeed, the identified trends and patterns in HSV-1 epidemiology are consistent with the trends and patterns observed in the United States (5, 7, 13), Western Europe (14), and Australia and New Zealand (27), as a consequence of a transition in the epidemiology of this infection in this part of the world (53). The overall consistency of HSV outcome measures in Canada with those found in other Western countries supports the validity of the inferences drawn in this study.
We estimated only an average overall trend for seroprevalence and proportion of HSV-1 detection in genital herpes, but these measures may have changed dramatically over decades, ebbing and flowing with changes to sexual practices, testing, and treatments, and influences of other infections such as the HIV epidemic (54). The number of included studies was not large enough to conduct more complex (or non-linear) regressions to assess different trends in different times.
In contrast to other regions (14, 17, 23, 26, 27), there was evidence of higher seroprevalence in Canada when the ELISA assay was employed, which may have led to a slight overestimation of the calculated pooled mean seroprevalence. It is worth noting that none of the identified studies were excluded based on diagnostic method-related problems associated with cross-reactivity with HSV-2 antibodies. Instead, exclusions were mainly due to inadequate information regarding the diagnostic assay used. Studies varied by sample size, sampling method, and response rate, yet there was no evidence that any of these factors affected the observed seroprevalence (Table 2 and Supplementary Table S4). On balance, while these limitations may affect some of the quantitative estimates in this study, they should not affect the overall findings of the study or their interpretation.
Conclusions
Based on the totality of results presented in this study, HSV-1 epidemiology in Canada appears to be shifting toward less oral acquisition in childhood and more genital acquisition in adulthood. Two-thirds of youth are approaching sexual debut uninfected orally, and are at risk of being infected genitally, resulting in higher rates of genital herpes. Both HSV-1 seroprevalence and the proportion of HSV-1 detection in genital herpes appears to be increasing with time. These results emphasize the importance of research and surveillance to monitor HSV-1 seroprevalence and etiology of GUD and genital herpes, as well as the need for an HSV-1 vaccine to protect against acquisition of the infection. There is also a need to conduct mathematical modeling studies to quantitatively characterize HSV-1 transitioning epidemiology and to estimate its epidemiologic indicators such as incidence, past, present, and future, just as was done recently for the United States (5).
Data availability statement
All relevant data are presented in the manuscript and its Supplementary material file. The dataset including the stratified HSV-1 seroprevalence measures and the stratified proportions of HSV-1 detection in genital herpes is posted at https://github.com/Abu-Raddad/HSV-1-in-Canada.git.
Author contributions
SM, UF, MH, and LA conducted the systematic search, data extraction, and data analysis. SM wrote the first draft of the manuscript with LJA. LJA conceived the study and led the data extraction and analyses and interpretation of the results. All authors contributed to drafting and revising the manuscript.
Funding
This work was supported by the Qatar National Research Fund (NPRP 9-040-3-008) and by pilot funding from the Biomedical Research Program at Weill Cornell Medicine in Qatar.
Acknowledgments
The authors gratefully acknowledge Professor Emeritus Rhoda Ashley-Morrow of the University of Washington, for her support in assessing the quality of study diagnostic methods. The authors are also grateful to Adona Canlas for administrative support. This publication was made possible by NPRP grant number 9-040-3-008 from the Qatar National Research Fund (a member of Qatar Foundation). The findings achieved herein are solely the responsibility of the authors. The authors are also grateful for pilot funding by the Biomedical Research Program and infrastructure support provided by the Biostatistics, Epidemiology, and Biomathematics Research Core, both at Weill Cornell Medicine in Qatar.
Conflict of interest
The authors declare that the research was conducted in the absence of any commercial or financial relationships that could be construed as a potential conflict of interest.
Publisher’s note
All claims expressed in this article are solely those of the authors and do not necessarily represent those of their affiliated organizations, or those of the publisher, the editors and the reviewers. Any product that may be evaluated in this article, or claim that may be made by its manufacturer, is not guaranteed or endorsed by the publisher.
Supplementary material
The Supplementary material for this article can be found online at: https://www.frontiersin.org/articles/10.3389/fpubh.2023.1118249/full#supplementary-material
References
1. Fatahzadeh, M, and Schwartz, RA. Human herpes simplex virus infections: epidemiology, pathogenesis, symptomatology, diagnosis, and management. J Am Acad Dermatol. (2007) 57:737–63; quiz 764–6. doi: 10.1016/j.jaad.2007.06.027
2. Gnann, JW, and Whitley, RJ. Genital herpes. N Engl J Med. (2016) 375:666–74. doi: 10.1056/NEJMcp1603178
3. Ramchandani, M, Kong, M, Tronstein, E, Selke, S, Mikhaylova, A, Magaret, A, et al. Herpes simplex virus type 1 shedding in tears and nasal and oral mucosa of healthy adults. Sex Transm Dis. (2016) 43:756–60. doi: 10.1097/olq.0000000000000522
4. Brady, RC, and Bernstein, DI. Treatment of herpes simplex virus infections. Antivir Res. (2004) 61:73–81. doi: 10.1016/j.antiviral.2003.09.006
5. Ayoub, HH, Chemaitelly, H, and Abu-Raddad, LJ. Characterizing the transitioning epidemiology of herpes simplex virus type 1 in the USA: model-based predictions. BMC Med. (2019) 17:57. doi: 10.1186/s12916-019-1285-x
6. Bernstein, DI, Bellamy, AR, Hook, EW 3rd, Levin, MJ, Wald, A, Ewell, MG, et al. Epidemiology, clinical presentation, and antibody response to primary infection with herpes simplex virus type 1 and type 2 in young women. Clin Infect Dis. (2013) 56:344–51. doi: 10.1093/cid/cis891
7. Chemaitelly, H, Nagelkerke, N, Omori, R, and Abu-Raddad, LJ. Characterizing herpes simplex virus type 1 and type 2 seroprevalence declines and epidemiological association in the United States. PLoS One. (2019) 14:e0214151. doi: 10.1371/journal.pone.0214151
8. Gilbert, M, Li, X, Petric, M, Krajden, M, Isaac-Renton, JL, Ogilvie, G, et al. Using centralized laboratory data to monitor trends in herpes simplex virus type 1 and 2 infection in British Columbia and the changing etiology of genital herpes. Can J Public Health. (2011) 102:225–9. doi: 10.1007/bf03404902
9. James, C, Harfouche, M, Welton, NJ, Turner, KM, Abu-Raddad, LJ, Gottlieb, SL, et al. Herpes simplex virus: global infection prevalence and incidence estimates, 2016. Bull World Health Organ. (2020) 98:315–29. doi: 10.2471/blt.19.237149
10. Roberts, CM, Pfister, JR, and Spear, SJ. Increasing proportion of herpes simplex virus type 1 as a cause of genital herpes infection in college students. Sex Transm Dis. (2003) 30:797–800. doi: 10.1097/01.OLQ.0000092387.58746.C7
11. Broutet, N, Fruth, U, Deal, C, Gottlieb, SL, and Rees, H. Vaccines against sexually transmitted infections: the way forward. Vaccine. (2014) 32:1630–7. doi: 10.1016/j.vaccine.2014.01.053
12. Gottlieb, SL, Deal, CD, Giersing, B, Rees, H, Bolan, G, Johnston, C, et al. The global roadmap for advancing development of vaccines against sexually transmitted infections: update and next steps. Vaccine. (2016) 34:2939–47. doi: 10.1016/j.vaccine.2016.03.111
13. Xu, F, Sternberg, MR, Kottiri, BJ, McQuillan, GM, Lee, FK, Nahmias, AJ, et al. Trends in herpes simplex virus type 1 and type 2 seroprevalence in the United States. JAMA. (2006) 296:964–73. doi: 10.1001/jama.296.8.964
14. Yousuf, W, Ibrahim, H, Harfouche, M, Abu Hijleh, F, and Abu-Raddad, L. Herpes simplex virus type 1 in Europe: systematic review, meta-analyses and meta-regressions. BMJ Glob Health. (2020) 5:e002388. doi: 10.1136/bmjgh-2020-002388
15. AlMukdad, S, Harfouche, M, Wettstein, A, and Abu-Raddad, LJ. Epidemiology of herpes simplex virus type 2 in Asia: a systematic review, meta-analysis, and meta-regression. Lancet Reg Health West Pac. (2021) 12:100176. doi: 10.1016/j.lanwpc.2021.100176
16. Harfouche, M, Abu-Hijleh, FM, James, C, Looker, KJ, and Abu-Raddad, LJ. Epidemiology of herpes simplex virus type 2 in sub-Saharan Africa: systematic review, meta-analyses, and meta-regressions. EClinicalMedicine. 202:100876. doi: 10.1016/j.eclinm.2021.100876
17. Khadr, L, Harfouche, M, Omori, R, Schwarzer, G, Chemaitelly, H, and Abu-Raddad, LJ. The epidemiology of herpes simplex virus type 1 in Asia: systematic review, meta-analyses, and meta-regressions. Clin Infect Dis. (2019) 68:757–72. doi: 10.1093/cid/ciy562
18. Kouyoumjian, SP, Chemaitelly, H, and Abu-Raddad, LJ. Characterizing hepatitis C virus epidemiology in Egypt: systematic reviews, meta-analyses, and meta-regressions. Sci Rep. (2018) 8:1661. doi: 10.1038/s41598-017-17936-4
19. Smolak, A, Chemaitelly, H, Hermez, JG, Low, N, and Abu-Raddad, LJ. Epidemiology of Chlamydia trachomatis in the Middle East and North Africa: a systematic review, meta-analysis, and meta-regression. Lancet Glob Health. (2019) 7:e1197–225. doi: 10.1016/S2214-109X(19)30279-7
20. Smolak, A, Rowley, J, Nagelkerke, N, Kassebaum, NJ, Chico, RM, Korenromp, EL, et al. Trends and predictors of syphilis prevalence in the general population: global pooled analyses of 1103 prevalence measures including 136 million syphilis tests. Clin Infect Dis. (2017) 66:1184–91. doi: 10.1093/cid/cix975
21. Abu-Raddad, LJ, Schiffer, JT, Ashley, R, Mumtaz, G, Alsallaq, RA, Akala, FA, et al. HSV-2 serology can be predictive of HIV epidemic potential and hidden sexual risk behavior in the Middle East and North Africa. Epidemics. (2010) 2:173–82. doi: 10.1016/j.epidem.2010.08.003
22. AlMukdad, S, Farooqui, US, Harfouche, M, Aldos, L, and Abu-Raddad, LJ. Epidemiology of herpes simplex virus type 2 in Canada, Australia, and New Zealand: systematic review, meta-analyses, and meta-regressions. Sex Transm Dis. (2022) 49:403–13. doi: 10.1097/olq.0000000000001612
23. Chaabane, S, Harfouche, M, Chemaitelly, H, Schwarzer, G, and Abu-Raddad, LJ. Herpes simplex virus type 1 epidemiology in the Middle East and North Africa: systematic review, meta-analyses, and meta-regressions. Sci Rep. (2019) 9:1136. doi: 10.1038/s41598-018-37833-8
24. Harfouche, M, Chemaitelly, H, and Abu-Raddad, LJ. Herpes simplex virus type 1 epidemiology in Africa: systematic review, meta-analyses, and meta-regressions. J Infect. (2019) 79:289–99. doi: 10.1016/j.jinf.2019.07.012
25. Harfouche, M, Maalmi, H, and Abu-Raddad, LJ. Epidemiology of herpes simplex virus type 2 in Latin America and the Caribbean: systematic review, meta-analyses and metaregressions. Sex Transm Infect. (2021) 97:490–500. doi: 10.1136/sextrans-2021-054972
26. Sukik, L, Alyafei, M, Harfouche, M, and Abu-Raddad, LJ. Herpes simplex virus type 1 epidemiology in Latin America and the Caribbean: systematic review and meta-analytics. PLoS One. (2019) 14:e0215487. doi: 10.1371/journal.pone.0215487
27. AlMukdad, S, Harfouche, M, Farooqui, US, Aldos, L, and Abu-Raddad, LJ. Epidemiology of herpes simplex virus type 1 and genital herpes in Australia and New Zealand: systematic review, meta-analyses and meta-regressions. Epidemiol Infect. (2023) 151:e33. doi: 10.1017/s0950268823000183
28. Higgins, J, and Green, S. Chapter 8: assessing risk of bias in included studies In: J Higgins and S Green, editors. Cochrane handbook for systematic reviews of interventions, vol. 4. Chichester: John Wiley & Sons (2011)
29. Moher, D, Liberati, A, Tetzlaff, J, and Altman, DG, The PRISMA Group. Preferred reporting items for systematic reviews and meta-analyses: the PRISMA statement. PLoS Med. (2009) 6:e1000097. doi: 10.1371/journal.pmed.1000097
30. Page, MJ, McKenzie, JE, Bossuyt, PM, Boutron, I, Hoffmann, TC, Mulrow, CD, et al. The PRISMA 2020 statement: an updated guideline for reporting systematic reviews. BMJ. (2021) 372:n71. doi: 10.1136/bmj.n71
31. Ashley, RL. Performance and use of HSV type-specific serology test kits. Herpes. (2002) 9:38–45.
32. Ashley-Morrow, R, Nollkamper, J, Robinson, NJ, Bishop, N, and Smith, J. Performance of focus ELISA tests for herpes simplex virus type 1 (HSV-1) and HSV-2 antibodies among women in ten diverse geographical locations. Clin Microbiol Infect. (2004) 10:530–6. doi: 10.1111/j.1469-0691.2004.00836.x
33. Ashley, R, Cent, A, Maggs, V, Nahmias, A, and Corey, L. Inability of enzyme immunoassays to discriminate between infections with herpes simplex virus types 1 and 2. Ann Intern Med. (1991) 115:520–6. doi: 10.7326/0003-4819-115-7-520
34. Ashley, RL, Dalessio, J, Dragavon, J, Koutsky, LA, Lee, FK, Nahmias, AJ, et al. Underestimation of HSV-2 seroprevalence in a high-risk population by microneutralization assay. Sex Transm Dis. (1993) 20:230–5. doi: 10.1097/00007435-199307000-00009
35. Sherlock, CH, Ashley, RL, Shurtleff, ML, Mack, KD, and Corey, L. Type specificity of complement-fixing antibody against herpes simplex virus type 2 AG-4 early antigen in patients with asymptomatic infection. J Clin Microbiol. (1986) 24:1093–7. doi: 10.1128/jcm.24.6.1093-1097.1986
36. Borenstein, M, Hedges, LV, Higgins, JPT, and Rothstein, HR. Introduction to meta-analysis. Chichester, UK: John Wiley & Sons, Ltd (2011).
37. Freeman, MF, and Tukey, JW. Transformations related to the angular and the square root. Ann Math Statist. (1950) 21:607–11. doi: 10.1214/aoms/1177729756
38. Schwarzer, G, Chemaitelly, H, Abu-Raddad, LJ, and Rücker, G. Seriously misleading results using inverse of Freeman-Tukey double arcsine transformation in meta-analysis of single proportions. Res Synth Methods. (2019) 10:476–83. doi: 10.1002/jrsm.1348
41. Harbord, RM, and Higgins, JPT. Meta-regression in Stata. Stata. (2008) 8:493–519. doi: 10.1177/1536867X0800800403
42. Garland, SM, Lee, TN, Ashley, RL, Corey, L, and Sacks, SL. Automated microneutralization: method and comparison with western blot for type-specific detection of herpes simplex antibodies in two pregnant populations. J Virol Methods. (1995) 55:285–94. doi: 10.1016/0166-0934(95)00061-9
43. Tan, DH, Raboud, JM, Kaul, R, Brunetta, J, Kaushic, C, Kovacs, C, et al. Herpes simplex virus type 2 coinfection does not accelerate CD4 count decline in untreated HIV infection. Clin Infect Dis. (2013) 57:448–57. doi: 10.1093/cid/cit208
44. Fisman, DN. Health related quality of life in genital herpes: a pilot comparison of measures. Sex Transm Infect. (2005) 81:267–70. doi: 10.1136/sti.2004.011619
45. Gupta, R, Warren, T, and Wald, A. Genital herpes. Lancet. (2007) 370:2127–37. doi: 10.1016/S0140-6736(07)61908-4
46. Mark, H, Gilbert, L, and Nanda, J. Psychosocial well-being and quality of life among women newly diagnosed with genital herpes. J Obstet Gynecol Neonatal Nurs. (2009) 38:320–6. doi: 10.1111/j.1552-6909.2009.01026.x
47. Mindel, A, and Marks, C. Psychological symptoms associated with genital herpes virus infections: epidemiology and approaches to management. CNS Drugs. (2005) 19:303–12. doi: 10.2165/00023210-200519040-00003
48. McQuillan, G, Kruszon-Moran, D, Flagg, EW, and Paulose-Ram, R. Prevalence of herpes simplex virus type 1 and type 2 in persons aged 14–49: United States, 2015–2016. NCHS Data Brief. (2018) 304:1–8.
49. Statistics Canada. Canada at a glance, 2022: immigration. (2022). Available at: https://www150.statcan.gc.ca/n1/pub/12-581-x/2022001/sec2-eng.htm (Accessed June 13, 2023).
50. Dabestani, N, Katz, DA, Dombrowski, J, Magaret, A, Wald, A, and Johnston, C. Time trends in first-episode genital herpes simplex virus infections in an urban sexually transmitted disease clinic. Sex Transm Dis. (2019) 46:795–800. doi: 10.1097/OLQ.0000000000001076
51. Fleming, DT, McQuillan, GM, Johnson, RE, Nahmias, AJ, Aral, SO, Lee, FK, et al. Herpes simplex virus type 2 in the United States, 1976 to 1994. N Engl J Med. (1997) 337:1105–11. doi: 10.1056/NEJM199710163371601
52. Garland, SM, and Steben, M. Genital herpes. Best Pract Res Clin Obstet Gynaecol. (2014) 28:1098–110. doi: 10.1016/j.bpobgyn.2014.07.015
53. Whitley, RJ. Changing epidemiology of herpes simplex virus infections. Clin Infect Dis. (2013) 56:352–3. doi: 10.1093/cid/cis894
Keywords: herpes, genital ulcer disease, seroprevalence, prevalence, meta-analysis, meta-regression, Canada
Citation: AlMukdad S, Harfouche M, Farooqui US, Aldos L and Abu-Raddad LJ (2023) Epidemiology of herpes simplex virus type 1 in Canada: systematic review, meta-analyses, and meta-regressions. Front. Public Health 11:1118249. doi: 10.3389/fpubh.2023.1118249
Edited by:
Longxiang Su, Peking Union Medical College Hospital (CAMS), ChinaReviewed by:
Roberto Croci, Vita-Salute San Raffaele University, ItalyNobuyuki Kobayashi, Jikei University School of Medicine, Japan
Copyright © 2023 AlMukdad, Harfouche, Farooqui, Aldos and Abu-Raddad. This is an open-access article distributed under the terms of the Creative Commons Attribution License (CC BY). The use, distribution or reproduction in other forums is permitted, provided the original author(s) and the copyright owner(s) are credited and that the original publication in this journal is cited, in accordance with accepted academic practice. No use, distribution or reproduction is permitted which does not comply with these terms.
*Correspondence: Laith J. Abu-Raddad, bGphMjAwMkBxYXRhci1tZWQuY29ybmVsbC5lZHU=
†These authors share first authorship