 Li Ming
 Duan Wang
 Yong Zhu
- 1Department of Pediatrics, Xinqiao Hospital, Army Medical University, Chongqing, China
- 2Department of Rehabilitation, Children’s Hospital of Chongqing Medical University, Chongqing, China
- 3Department of Pediatric Intensive Care Medicine, Zhangzhou Affiliated Hospital of Fujian Medical University, Fujian, China
Background: Sodium is essential for human health, however the prevalence of various diseases is associated with excessive sodium intake, particularly cardiovascular disorders. However, in most countries, salt intake is much higher than the World Health Organization recommends. Several studies in recent years have revealed that high salt intake is associated with diabetes in the general population, but the association is uncertain in people who do not have hypertension. In this study, we aimed to find out whether high sodium intake increases the risk of diabetes in this particular population.
Method: Data were extracted from the National Health and Nutrition Examination Survey (NHANES; 2009–2018). Participants included adults aged over 20 years old who have undergone the diabetes questionnaire, and the hypertension population was excluded. In order to adjust the confounders, multivariate analysis models were built. Finally, subgroup analysis were conducted to investigate the association between sodium intake and diabetes separately.
Result: In the present study, 7,907 participants are included (3,920 female and 3,987 male), and 512 (6.48%) individuals reported diabetes. The median sodium intake of the participants was 3,341 mg/d (IQR: 2498, 4,364 mg/d). A linear association between sodium intake and the prevalence of diabetes was found (p = 0.003). According to the multivariate analysis models, the odds ratio of diabetes for every 1,000 mg sodium intake increment is 1.20 (OR: 1.20, 95% CI 1.07–1.35). The highest sodium intake quartile was 1.80-fold more likely to have diabetes than the lowest quartile (OR: 1.80, 95% CI 1.17–2.76).
Conclusion: Our results suggest that higher sodium intake is associated with an increased risk of diabetes in the population without hypertension, and for every 1,000 mg sodium intake increment, the risk of diabetes increased by 1.20-fold. To sum up, we have provided the clue to the etiology of diabetes and further prospective research is needed to contribute recommendations for the primary prevention of diabetes in the US.
Introduction
Sodium is a physiologically essential nutrient to maintain human health and well-being. As an osmotic determinant of extracellular fluid and plasma volume, it has a variety of functions in the body, including regulating nerve and muscle function and maintaining acid–base and water balance (1, 2). It has been found that excessive intake of sodium is linked to the increased risk of various chronic diseases, especially cardiovascular disease (3–5). However, the relationship between sodium intake and diabetes remains unknown.
Over 90% of the sodium in the diet comes from table salt, while processed foods account for 75% of salt consumption (6). The World Health Organization (WHO) proposes to reduce sodium intake to less than 2000 mg/day in the general population (7). However, in most countries, sodium consumption is significantly higher than the recommended amount. In 2010, the global average sodium intake was 3.95 g per day, which is equivalent to 10.06 g of salt per day and nearly twice the WHO recommended limit of 2 g per day (8). The most recent update of the National Academy’s Dietary Reference Intakes for Sodium and Potassium (2019) recommends all adults 19 years of age and older have a sodium adequate intake of 1,500 mg/d (9). In the United States, about 90% of adults consume sodium more than the recommended amount with an average of 3,400 milligrams per day (10). Excessive sodium intake is also prevalent in Asian countries. In China, about 92.6% of adults consume more sodium than the recommended amount, with an average of 5,013 milligrams per day (11). Various countries, both developed and developing, are adopting strategies to decrease the consumption of salt among their populations. These strategies encompass the establishment of salt targets for food, enforcing mandatory labeling for high-salt products, and educating consumers.
More than 34 million people in the United States have diabetes, which has a huge impact on public health globally (12) and dramatically raises the risk of cardiovascular events, microvascular disease and early death (13). Diabetes places a significant burden on society in the form of increased medical costs, lost productivity, premature mortality, and intangible costs such as decreased quality of life (14). Currently, smoking, high-risk drinking, dyslipidemia, hypertension, and metabolic syndrome were reported as the risk factors for diabetes (15). However, a few studies have explored the relationship between salt and sodium intake and diabetes, and the results have shown inconsistency (16–18), and no studies have looked at the relationship between sodium intake and diabetes in a specific group of people without hypertension. Thus, the relationship between sodium intake and diabetes is needed to further probe.
The National Health and Nutrition Examination Survey (NHANES) is a research program designed to assess the health and nutrition status of adults and children in the United States. It combines interviews and physical exams, focuses on a variety of health and nutrition measures, and provides a range of data, including socioeconomic, diet, health status, demographics, and laboratory tests (19). In this study, we analyzed data from the 2009 to 2018 National Health and Nutrition Examination Survey (NHANES) to examine the association between sodium intake and diabetes in US adults. Aim to find out whether high sodium intake increased the risk of diabetes.
Materials and methods
Study design and population
The NHANES is a series of cross-sectional, complex, multistage surveys conducted by the Centers for Disease Control (CDC) and Prevention of a nationally representative group of non-institutionalized members of the US population designed to provide health and nutrition data (20). Before taking part, participants provided written informed consent. The NCHS ethics review board reviewed and approved the collection of NHANES data (21).
In the present study, we have analyzed the participants from 5 cycles of NHANES (2009–2018). A total of 28,835 adults aged over 20 years old were enrolled. We excluded 316 participants who had missing data on the diabetes questionnaire, and 6,605 participants who had missing sodium intake, 8,899 participants who had missing demographic data and other covariates data, people with high blood pressure (n = 5,114). Finally, 7,907 participants were included in our study (Figure 1) Referring to other previous studies and NHANES official recommendations, we divided the population into three groups according to age (22, 23), among them, 4,016 young adults (ages 20–39 years), 2,720 middle-aged adults (age 40–59 years), and 1,171 older adults (age 60 and older). Meanwhile, fasting blood glucose (FBG, n = 3,825) and glycohemoglobin (HbA1c, n = 7,893) data of the final population were collected as outcome variables to further verify the correlation between sodium intake and diabetes.
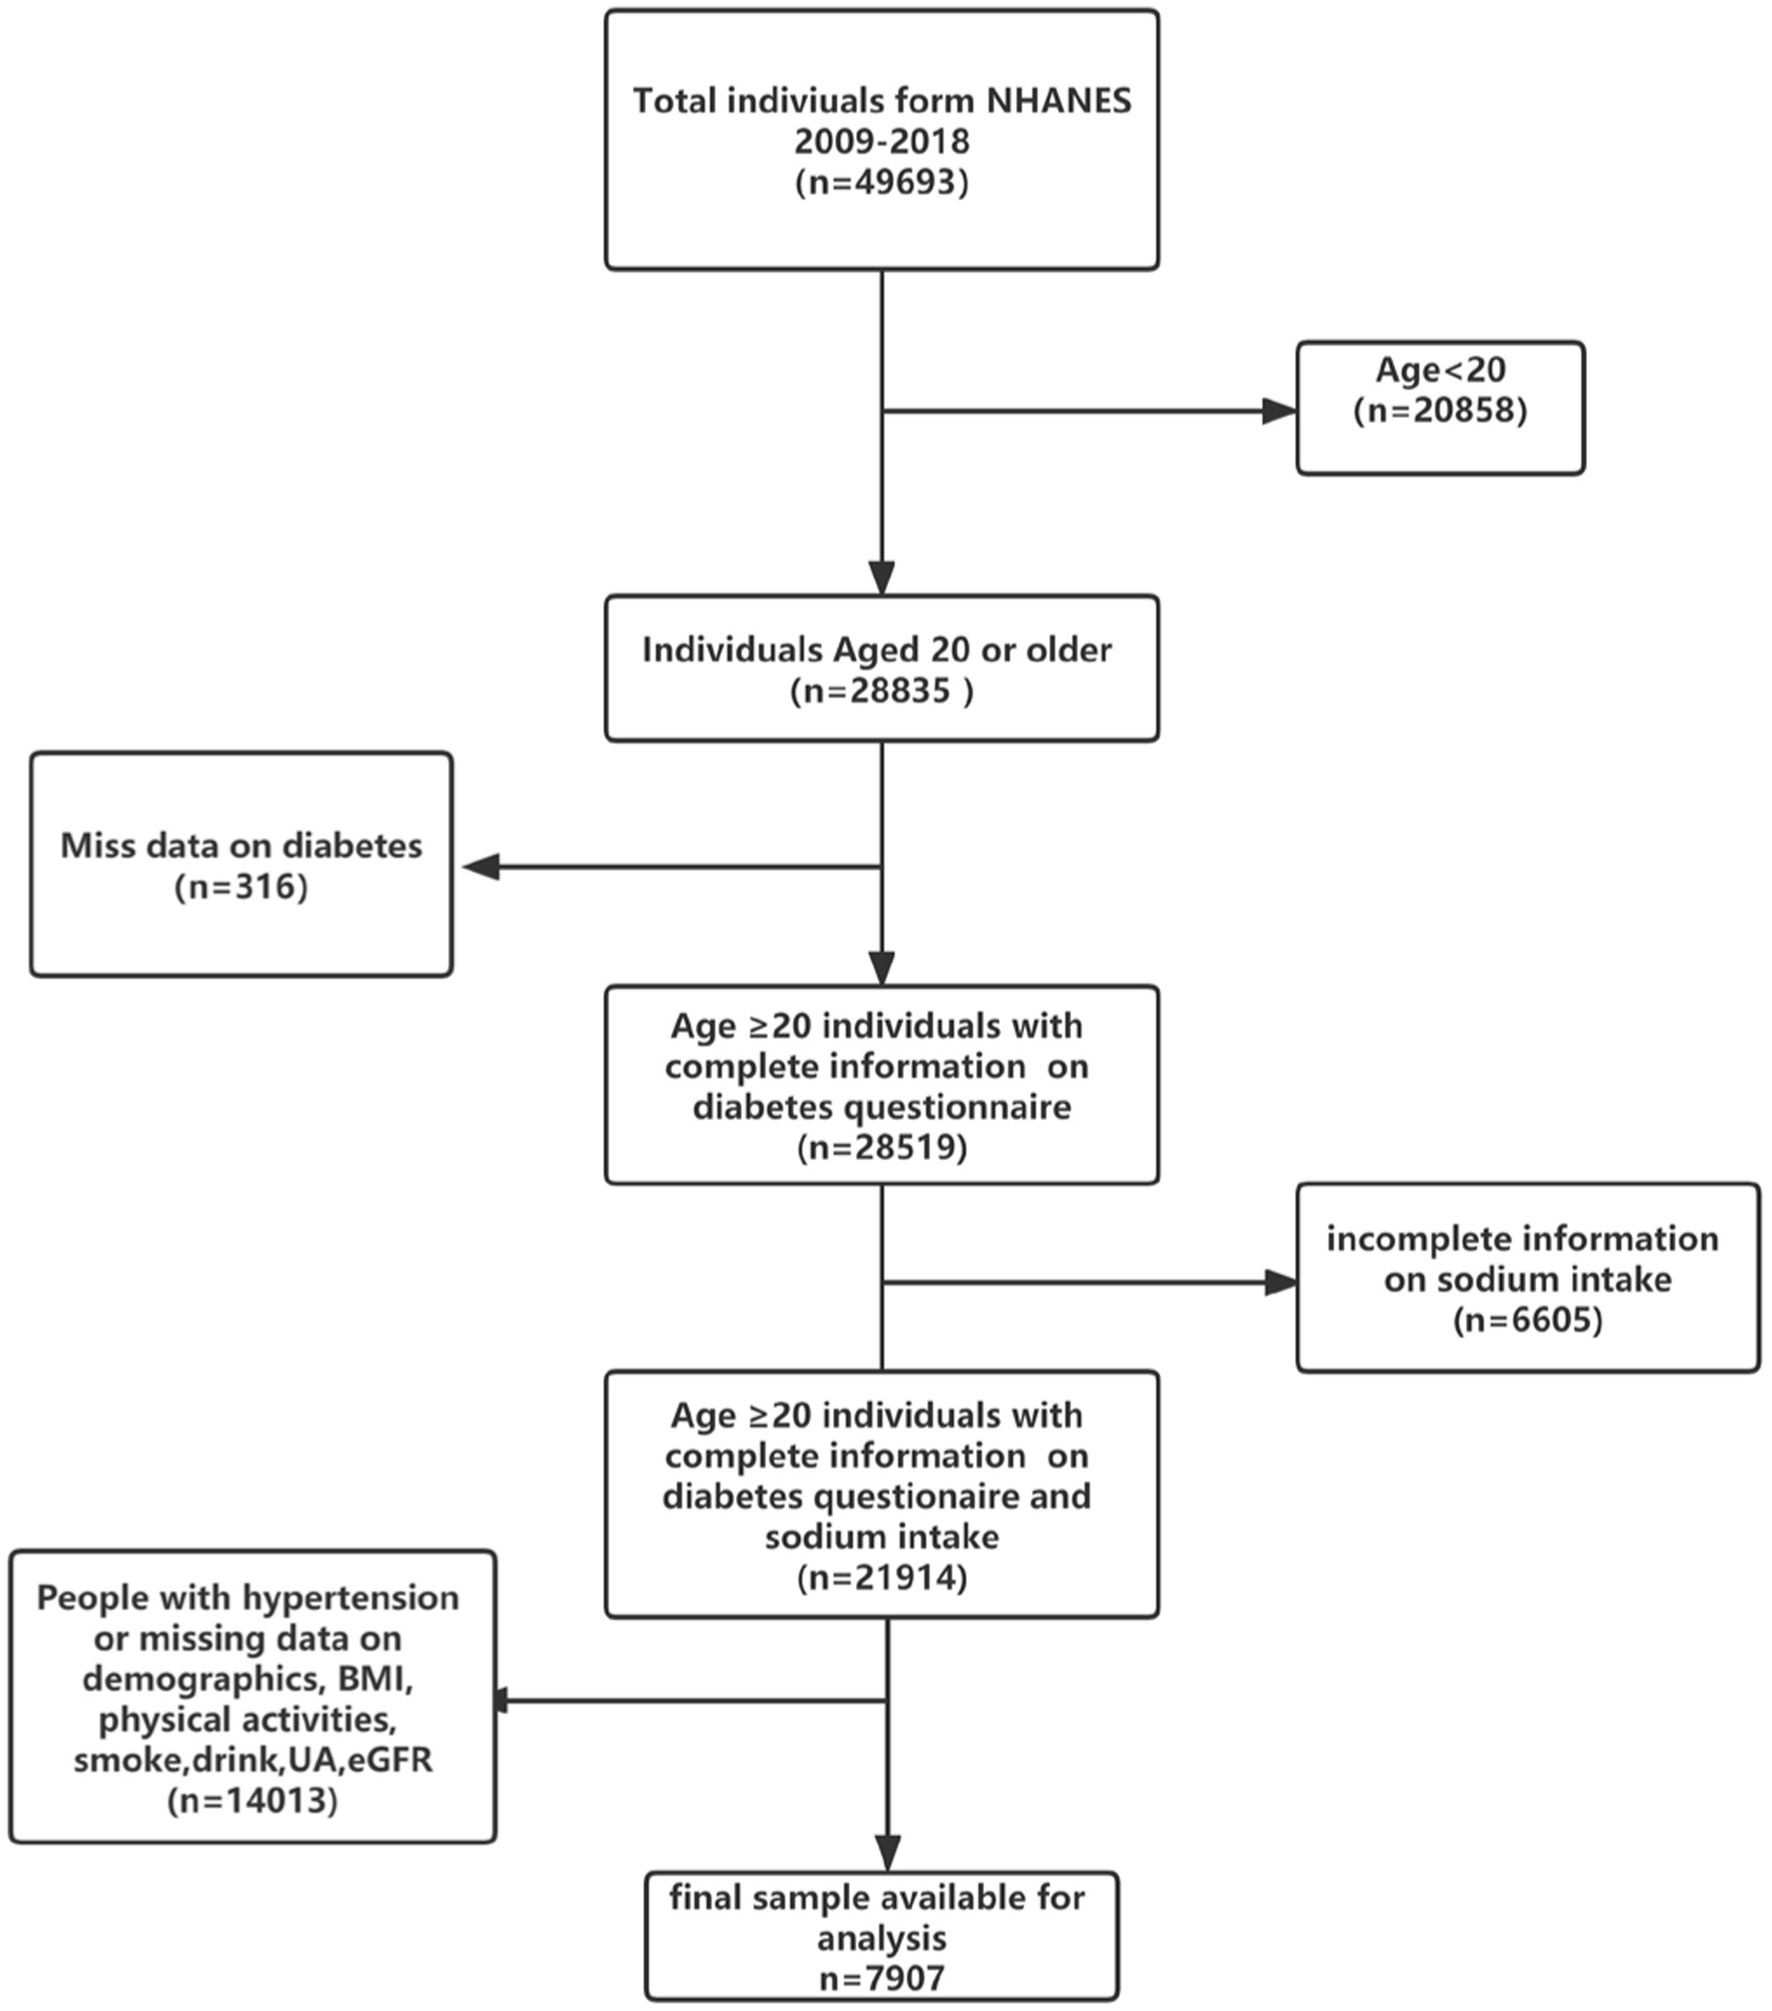
Figure 1. Flowchart of the sample selection from NHANES 2009–2018.
Dietary sodium intake
Dietary sodium intake (mg/day) was the main exposure of interest, face-to-face interviews between trained interviewers and respondents were used to collect dietary intake data form participants. Respondents were asked to recall all foods and beverages consumed in the previous 24 h. All participants were asked to participate in two 24-h total nutrient recall interviews, the second of which was conducted over the phone 3 to 10 days later. As a result, if an individual performed two 24-h recalls, the average sodium intake of the two 24-h recalls was used. Otherwise, we use statistics from the first 24-h recall.
Definition of outcome variable and hypertension
Diabetes was defined as being informed by a doctor/health professional about the diagnosis of diabetes, and/or the use of insulin or oral hypoglycemic medication (24). According to the diagnostic criteria for diabetes, the outcome variable FBG was divided into groups based on whether it was ≥ 7.0 mmol/L, and glycosylated hemoglobin was divided into groups based on whether it was ≥ 6.5%. Hypertension was defined as a mean SBP ≥ 130 mm Hg, or a mean DBP ≥ 80 mm Hg, or was taking hypertension medication or was informed of a hypertension diagnosis by a physician/health professional.
Potential covariates
Demographic variables include age (classified as 20–39 years, 40–59 years, and ≥ 60 years), gender, race (non-Hispanic white, non-Hispanic black, Mexican American, other Hispanic, or others), levels of education (below high school, high school and above high school), poverty income ratio (<1.35, 1.35–1.85, >1.85). Body mass index (BMI) is categorized as under/normal weight (<25 kg/m2), overweight (25–29.9 kg/m2), and obese (≥30 kg/m2). Serum cotinine level is used as a marker for smoke exposure (<0.05 ng/mL: unexposed or non-smoker; 0.05–10 ng/mL: Passive smokers; >10 ng/mL: active smoker) (25, 26). Drinking status is classified as never (any year < 12 cups), former (≥12 cups in any year, not drinking now), and current (≥12 cups in any year, currently drinking). The level of physical activity is measured by the MET-min/week, low (500 MET-min/wk), moderate (500–2,999 MET-min/wk), and high (>3,000 MET-min/wk) exercise were the three categories used to categorize total activity (27). Other covariates include total energy intake (Kcal/d), protein (g/d), carbohydrate (g/d), fat (g/d), uric Acid (UA, mg/dL), estimated glomerular filtration rate (eGFR, mL/min/1.73m2).
Statistical analysis
Continuous variables were compared using the one-way ANOVA (normal distribution), Kruscal Whallis H (skewed distribution) among the different groups. Categorical variables were compared using the chi-squared test among the different groups. Descriptive statistics were used to characterize the participants across the quartiles of sodium intake, continuous variables were expressed as mean ± standard deviation, categorical variables were expressed in frequency and percentage. Multivariate logistic regression analysis was used to evaluate the blood pressure based on sodium intake (continuous and categorical variables). Model I adjusted for: age, sex, protein, carbohydrate, and fat. Model II adjusted for: Model I + race, poverty income ratio, BMI, and education. Model III adjusted for: Model II + UA, alcohol intake, eGFR, smoke exposure, and total physical activity. Tests for trend (P for trend) were performed by entering the sodium intake group as a continuous variable and rerunning the corresponding regression models. In addition, a generalized additive model and fitted smoothing curve were used to characterize the shape of the relationship between sodium intake and.outcome variable Finally, we also conducted subgroup analysis, investigating the association between sodium intake and diabetes in the subgroup separately. Although some studies have suggested using NHANES sample weights in the analysis to obtain unbiased national estimates, this has the limitation of reducing the statistical power of the study. To balance this relationship, we included sample weights in the sensitivity analysis of the primary outcome variables.
All of the analyses were performed with the statistical software packages R (http://www.R-project.org, The R Foundation) and EmpowerStats (http://www.empowerstats.com, X&Y Solutions, Inc., Boston, MA). p values <0.05 (two-sided) were considered statistically significant.
Results
In the present study, 7,907 participants are included in our study (3,920 female and 3,987 male). Among them, 512 (6.48%) individuals reported diabetes. The median sodium intake of the participants was 3,341 mg/d (IQR: 2498, 4,364 mg/d).
Demographic characteristics of participants
Table 1 shows the baseline characteristics of participants by quartiles of daily dietary sodium intake. The youth have a higher sodium intake (58.1% vs. 45.1%). Compared to female, the male has a huge percentage of high sodium intake (28.9% vs. 78.4%). For dietary intake, the individuals with higher sodium intake consumed more energy intake (3079.7 ± 858.1 vs. 1379.9 ± 419.7 Kcal), protein (124.3 ± 39.2 vs. 52.5 ± 19.4 g), carbohydrate (357.5 ± 117.3 vs. 177.9 ± 65.3 g) and fat (121.5 ± 42.2 vs. 48.4 ± 19.9 g). In terms of lifestyle, participants who have a higher sodium intake are also more active in total physical activity (39.2% vs. 53.8%) and smoking (23.4% vs. 28.2%) and drinking (73.6% vs. 81.9%). And we found that uric acid level in the high sodium intake population significantly rose (5.0 ± 1.3 vs. 5.5 ± 1.3) too. In addition, people with lower education levels, PIR and eGFR have lower salt intake.
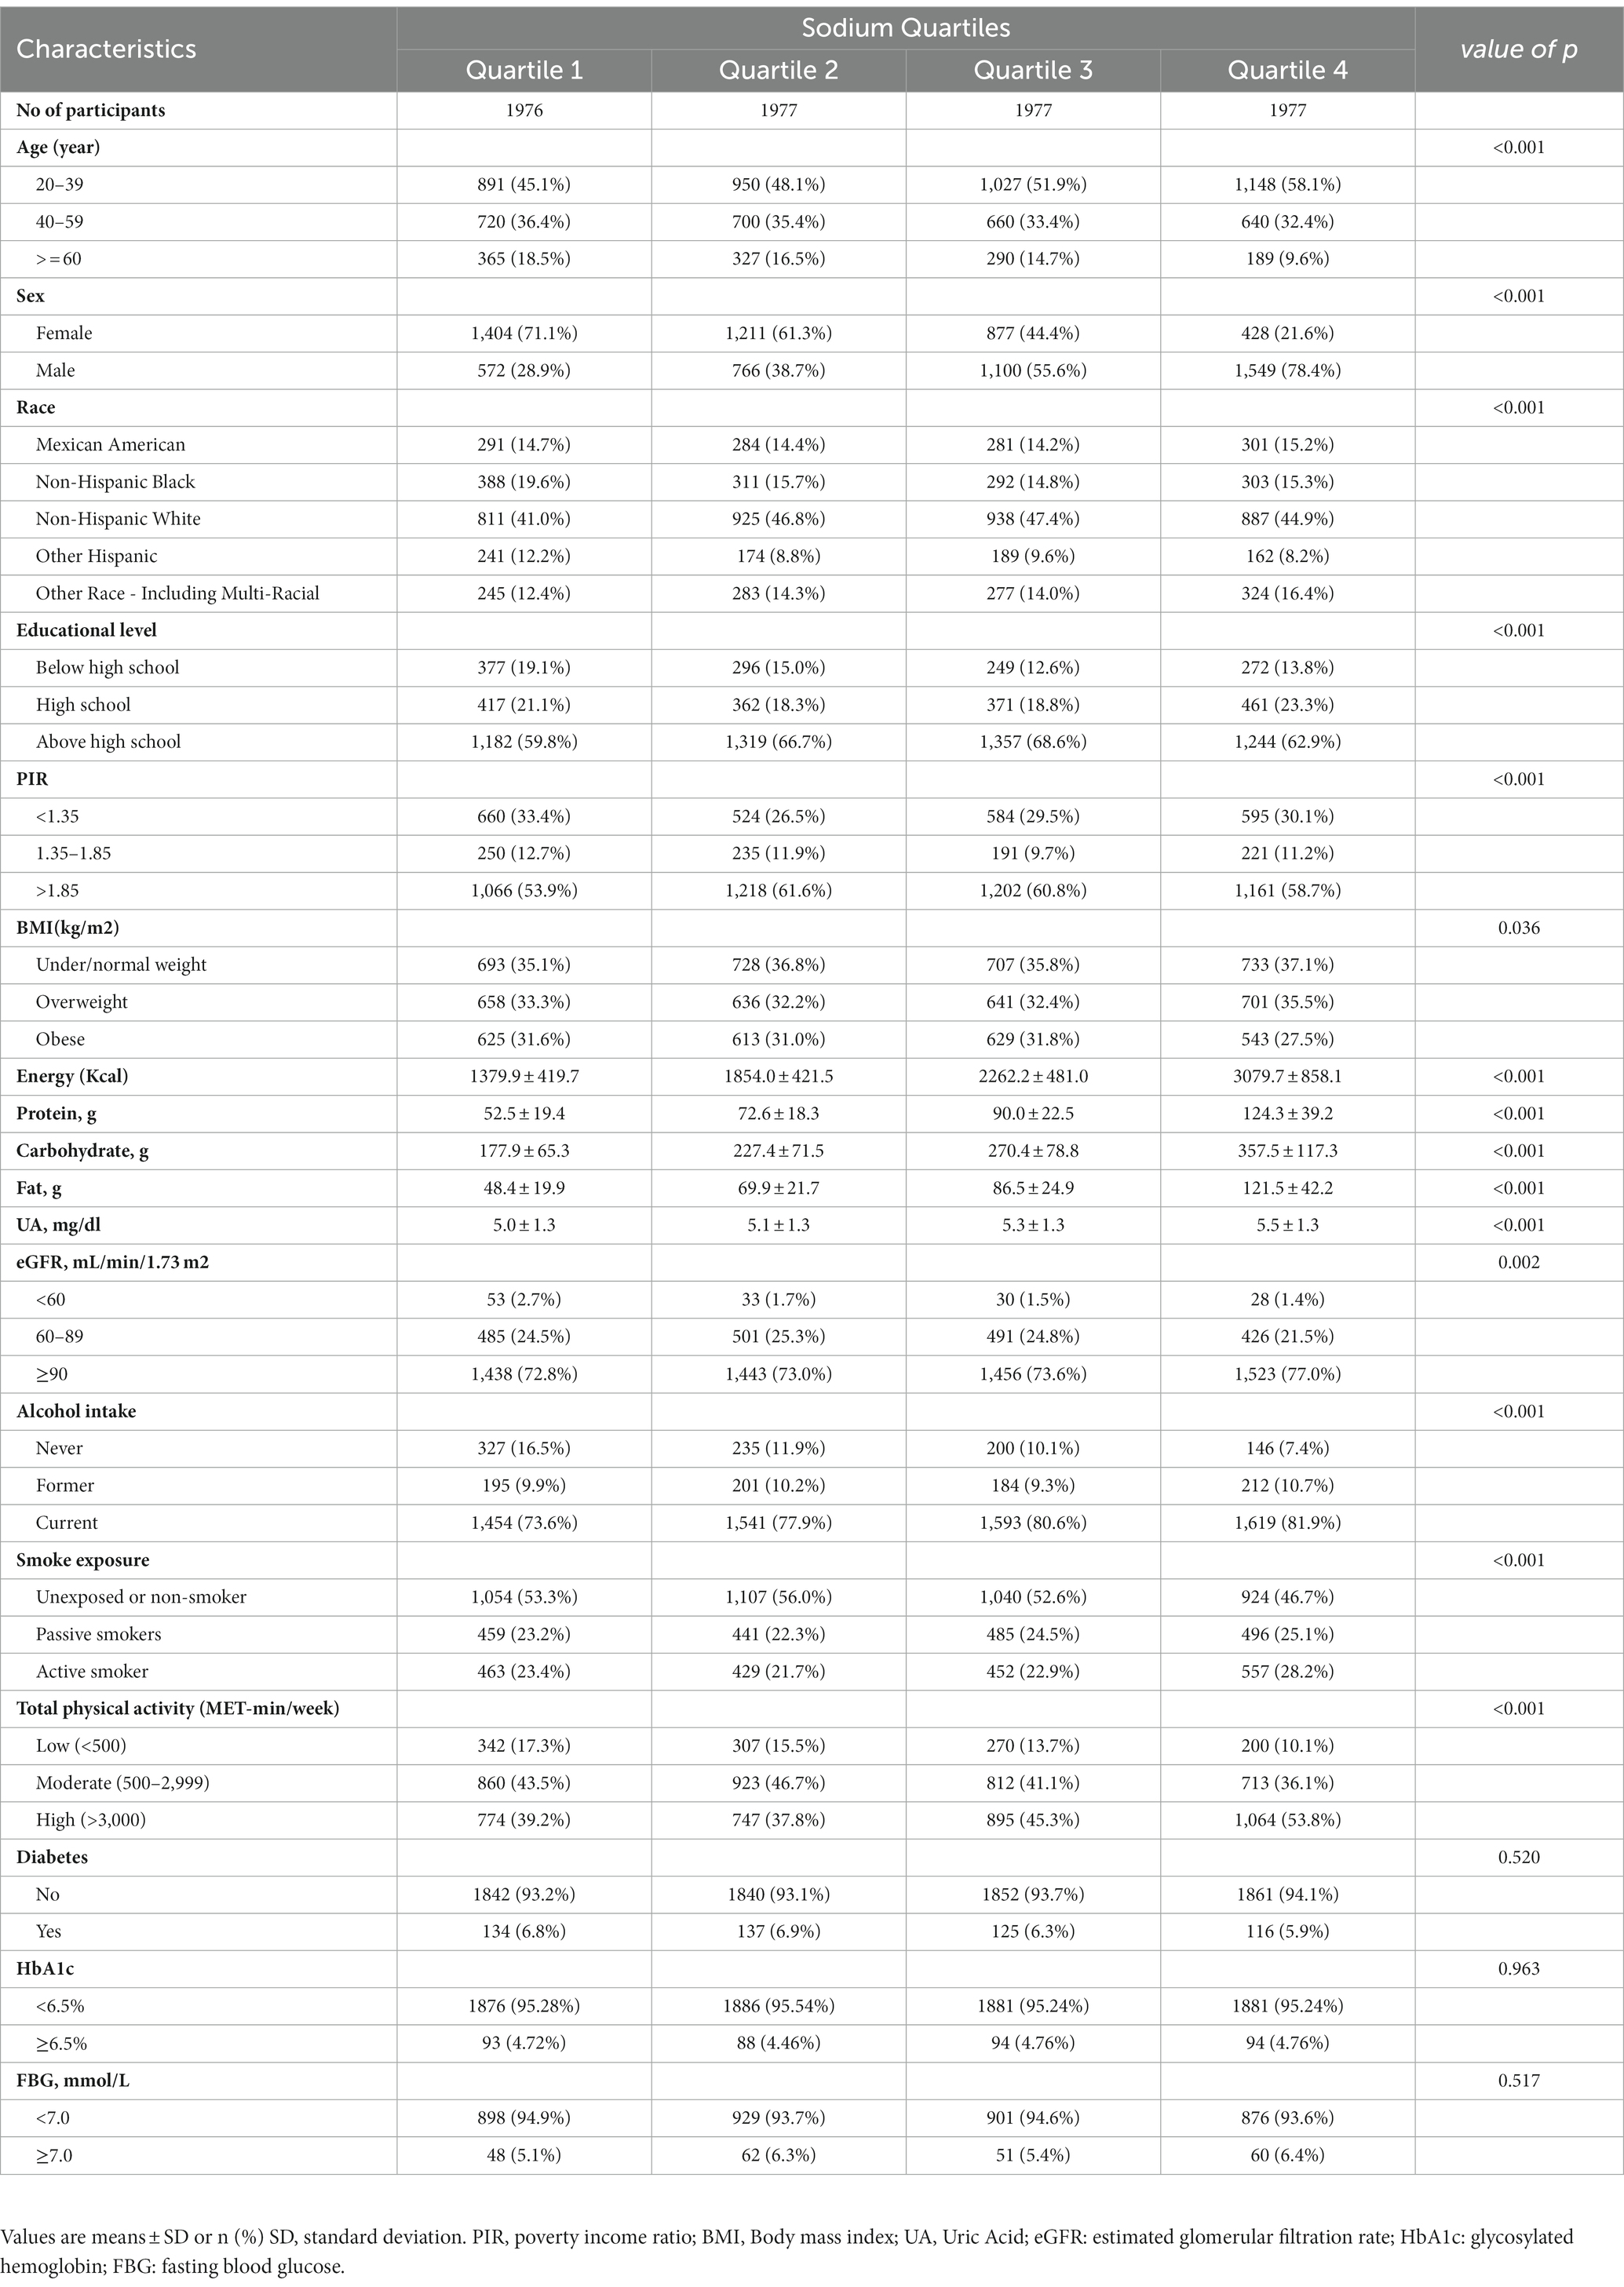
Table 1. Characteristics of participants by quartiles of sodium intake in the 2009–2018 continuous NHANES.
Relationship between sodium intake and diabetes, FBG, and HbA1c
Table 2 shows the relationship between sodium intake and diabetes through multivariate analyses in the included participants. After adjustment for age, sex, energy, protein, carbohydrate, and fat, there is a significant positive correlation between sodium intake and prevalence of diabetes, similar results are found after further adjustment for the other covariates in Table 1. As shown in Table 2, every 1,000 mg sodium intake increment had a multivariate-adjusted odd ratio (OR) with a 95% confidence interval (CI) of 1.20 (95% CI 1.07–1.35) (p = 0.003) for diabetes. When continuous sodium intake was converted to quartiles of sodium intake, we found that compared to those in quartile 1 (sodium intake <2,498 mg/d), the adjusted ORs for participants in quartile 2 (2,498 ≤ sodium intake <3,341 mg/d), quartile 3 (3,341 ≤ sodium intake <4,364 mg/d) and quartile 4 (sodium intake ≥ 4,364 mg/d) were 1.30 (95% CI 0.98–1.72), 1.32 (95% CI 0.96–1.83) and 1.80 (95% CI 1.17–2.76) (p = 0.008), respectively. There was a trend for higher OR of diabetes among participants in the higher quartile of sodium intake relative to the lower quartile (p for trend =0.016). As shown in Supplementary Tables S1, S2, similar results were observed for the association between salt intake and FBG and HBA1c, every 1,000 mg increase in sodium intake, the multivariate adjusted ratio (OR) for FBG ≥ 7 mmol/L was 1.31 (95% CI 1.14–1.49) (p < 0.001), and every 1,000 mg increase in sodium intake, the multivariate adjusted ratio (OR) for HbA1c ≥ 6.5% was1.28 (95% CI 1.07–1.55) (p = 0.008). In sensitivity analyses that included sample weights, the relationship between sodium intake and diabetes prevalence remained consistent and stable (Supplementary Table S3). The generalized additive model and the smoothed curve fit showed that sodium intake was positively associated with the prevalence of diabetes in participants. A linear association between sodium intake and the prevalence of diabetes was found (p = 0.003) (Figure 2). There was also a linear relationship between sodium intake and FBG ≥ 7 mmol/L (p = 0.009) and HBA1c ≥ 6.5% (p < 0.001) (Supplementary Figures S1, S2).
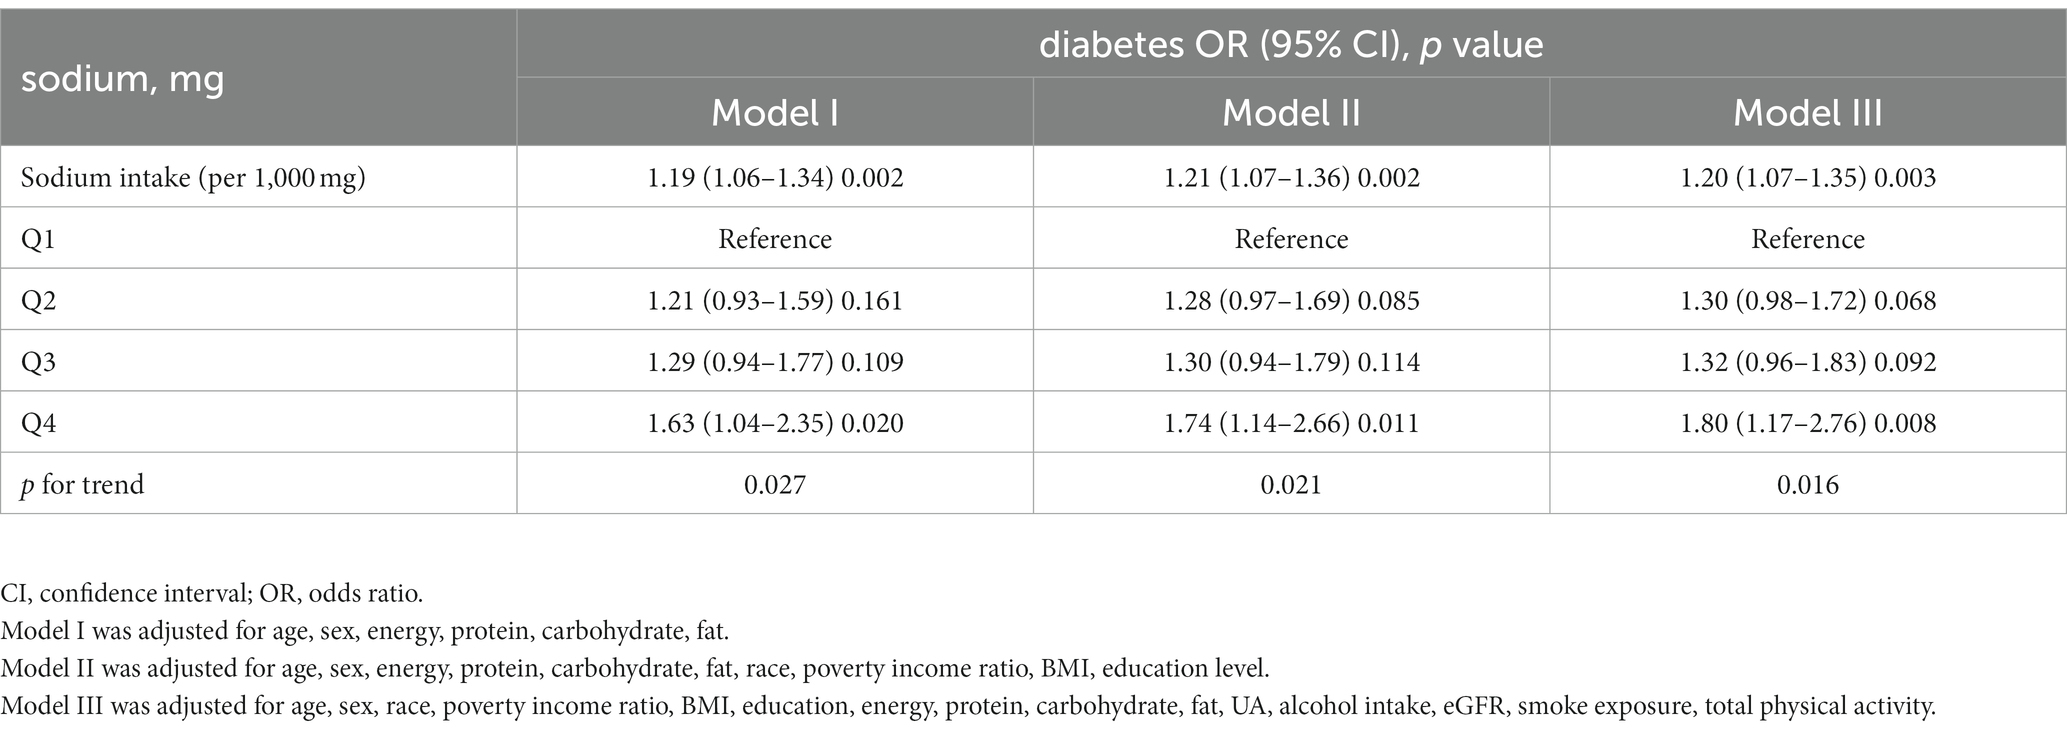
Table 2. Relationship between sodium intake and diabetes in different models among US adult.
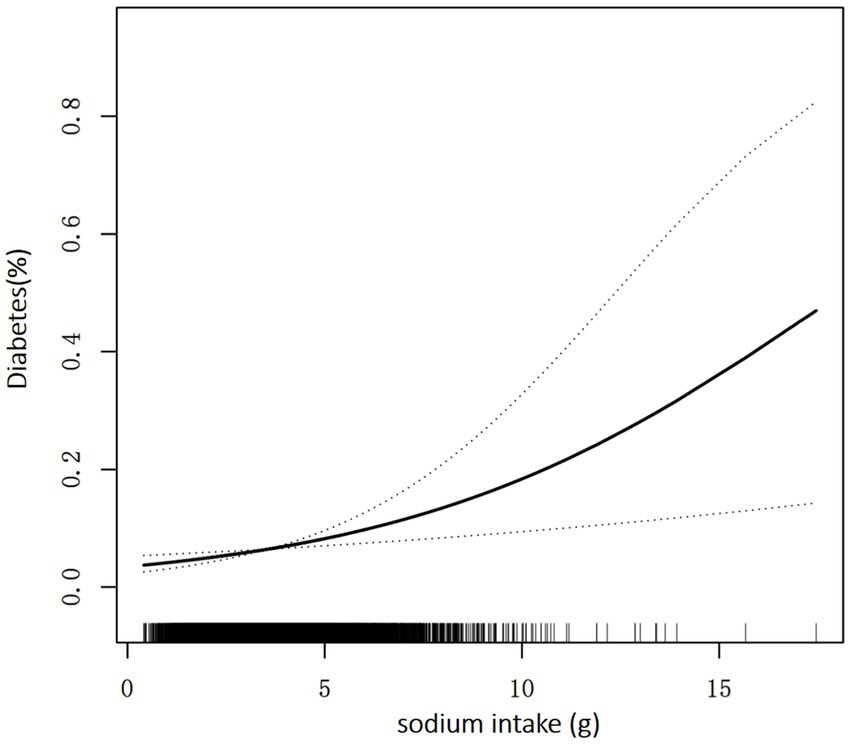
Figure 2. Association between sodium intake and the prevalence of diabetes. A linear association between sodium intake and the prevalence of diabetes was found (p = 0.003). The solid line and dashed line represent the estimated values and their corresponding 95% confidence interval. Adjustment factors included age, sex, race, poverty income ratio, BMI, education, energy, protein, carbohydrate, fat, UA, alcohol intake, eGFR, smoke exposure, and total physical activity.
Relationship between sodium intake and diabetes in subgroup
Participants were divided into several subgroups for a stratified analysis to assess the relationship between sodium intake and diabetes (Figure 3). Sodium intake was positively associated with prevalence of diabetes in different subgroups, with higher sodium intake associated with higher prevalence of diabetes, and this relationship remained stable across subgroups. None of the variables, including sex, age, race, BMI, smoking status, and drinking status significantly modified the association between sodium intake and the prevalence of diabetes (p for all interactions >0.05).
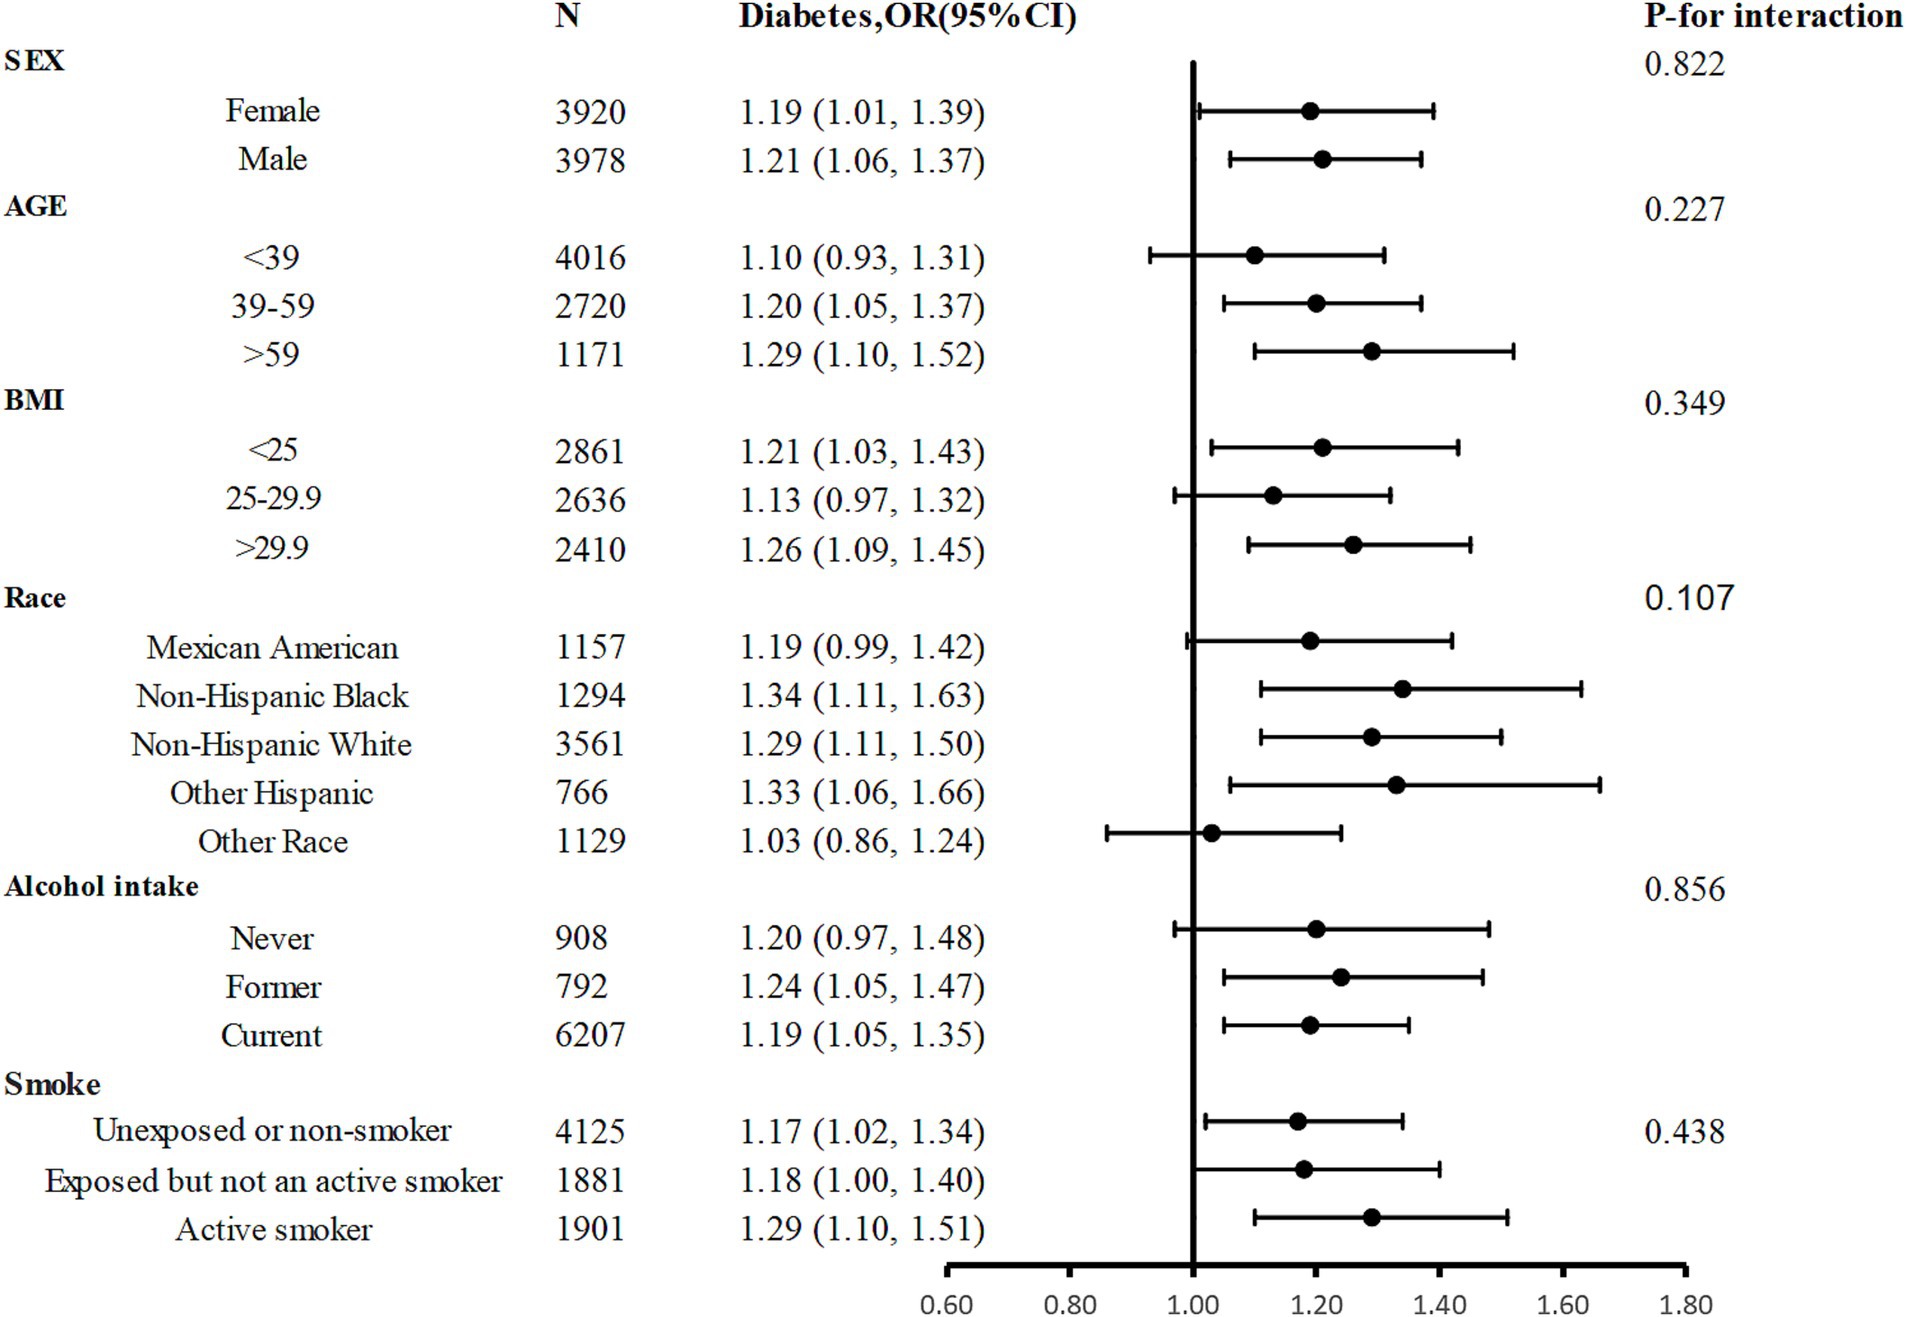
Figure 3. Stratified Analyses by Potential Modifiers of the Association between sodium intake and the prevalence of diabetes. Adjusted for age, sex, race, poverty income ratio, BMI, education, energy, protein, carbohydrate, fat, UA, alcohol intake, eGFR, smoke exposure, and total physical activity except the subgroup variable.
Discussion
To our knowledge, this is the first large sample cross-sectional study to evaluate sodium intake and diabetes prevalence in non-hypertensive adults in the United States, emphasizing the association of a high sodium diet for diabetes prevalence. The present study shows that the proportion of diabetes is significantly large in the high sodium intake group. The linear association depicts that the prevalence of diabetes has a positive correlation with sodium intake. The risk of diabetes increased by 1.20 times for every 1 g increase in sodium. In addition, subgroup analysis showed a stable positive association between sodium intake and diabetes in all subgroups.
Suckling RJ et al. study showed that reducing sodium intake has no significant effect on fasting blood glucose, glycosylated hemoglobin, and insulin sensitivity in patients with diabetes and impaired glucose tolerance (17), In another 8-week randomized controlled trial, limiting salt intake had no significant effect on glucose and insulin metabolism in hypertensive patients (16). However, our study revealed a positive correlation between sodium intake and abnormal fasting blood glucose and glycohemoglobin. It is important to note that previous studies had limited sample sizes, different study populations, and the relatively short follow-up time could only reflect short-term conclusions, which may account for the disparity in their results compared to ours. Therefore, randomized studies with larger samples and longer follow-up times are needed to verify this conclusion.
A prospective study has observed that high sodium intake is the independent risk factor of type 2 diabetes by testing the urinary sodium of participants (18). And another Mendelian randomization study verified that urinary sodium is one of the 21 suggestive risk factors which were selected by 170 risk factors of type 2 diabetes (28). Similarly, Matti A. Vuori et al. has emphasized that high sodium intake is associated with an increased incidence of cardiovascular disease and diabetes (29). Furthermore, sodium intake adds to the risk of 2 diabetes was widely reported in Asia, such as China, Korea and Japan where pickles and sauces are popular (30–32). For the first time, our examination of a nationally representative non-institutional members in the United States corroborates previous research indicating a positive correlation between higher sodium intake and an increased risk of diabetes. Compared with previous studies, we utilized a complex sampling design and weighted our research results based on the recommendations of NHANES to prevent over-sampling. Furthermore, our study included a larger sample size and NHANES provided more detailed dietary data, such as the intake of total energy, sugar, protein and fat, as well as complete laboratory examination data, which may be potential risk factors for the onset of diabetes. We included these data and constructed different models to adjust these risk factors. All the abovementioned reasons may increase the reliability of our conclusions.
Compared to previous studies in the general population, our study included a specific group of people without high blood pressure, it is widely known that over sodium intake contributes to hypertension (33), and the results from a retrospective propensity score-matched cohort study in China have indicated that subjects with hypertension are more likely to develop diabetes with an 11.0% increased risk (34). In addition, the participants with hypertension usually were advised by physicians to a low-salt diet. Thus, in the present study, to eliminate the interference of hypertension factors on the diet and the diabetes outcome, we excluded the hypertension participants. Given the high co-incidence of hypertension and diabetes and the two diseases are risk factors for each other, the association between sodium intake and diabetes may be even stronger in people with hypertension.
Despite the lack of clarity on the pathophysiological connection between sodium intake and diabetes, several potential mechanisms could explain the association. Some studies have attributed the link to excess salt intake associated with increased consumption of sugar-containing beverages, obesity and high blood pressure, which are both risk factors for diabetes (18, 35–37), moreover, in diabetic animal models, a high-salt diet aggravated renal fibrosis and impaired fatty acid metabolism (38). However, our study excluded people with high blood pressure and adjusted for BMI, and the association remained. Previous studies have suggested that higher magnesium intake may improve glucose processing and insulin action, and reduce the risk of developing type 2 diabetes (39, 40), extracellular sodium level is related to intracellular magnesium transfer to extracellular and reabsorption of magnesium by distal convoluted tubules (41, 42). However, it is unclear how sodium intake affects a person’s blood glucose. Excessive salt consumption has been demonstrated to cause insulin resistance in some earlier research by decreasing insulin sensitivity, preventing insulin mRNA expression, weakening insulin signaling, and raising angiotensin II production (43–45). A prior animal study proved that the PPARδ/adiponectin/SGLT2 pathway may play an important role in the regulation of sodium and glucose homeostasis (46), through the activation of the adipose PPAR, high sodium intake raises adiponectin levels, which in turn downregulate renal SGLT2 and cause natriuresis and glycosuria. Miguel A Lanaspa et al. observed that high intake of salt activates the aldose reductase-fructokinase pathway in the liver and hypothalamus, resulting in endogenous fructose production with the development of leptin resistance and hyperphagia (47).
There are still some limitations of this study. First of all, it is not possible to infer causality due to the cross-sectional design, more prospective studies are needed to validate our findings. Second, in the evaluation of confounding factors, residual confounding effects due to measurement errors are inevitable. Third, NHANES surveys used interviews and questionnaires to obtain self-reported information, which may lead to inaccurate information and recall bias, however, a previous study found a strong link between self-reported dietary sodium intake and 24-h urine sodium measurement. Last, we were unable to separate the data by diabetes type 1 or type 2 status because the NHANES survey did not contain that specific data. But previous reports suggest that 8.5% of American adults have type 2 diabetes, while only 0.5% have type 1 diabetes, therefore our results may be more appropriate for type 2 diabetes (48). Despite these limitations, the study has a number of significant advantages. This study employed recent data that was quite representative because it was gathered from national representatives using well-designed protocols. What is more, we investigated the incidence of diabetes in a special population from another perspective by excluding the participants with hypertension, moreover, we have adjusted the correlation with sufficient covariates, and the results are independent and reliable. In addition, several sensitivity analyses were performed to examine the consistency of the results and to reveal and correct for possible polymorphisms.
Our results suggest that higher sodium intake is associated with an increased risk of diabetes in the population without hypertension, and for every 1,000 mg sodium intake increment, the risk of diabetes increased by 1.19 times. To sum up, we have provided the clue to the etiology of diabetes and further prospective research is needed to contribute recommendations for the primary prevention of diabetes in the US.
Data availability statement
The datasets presented in this study can be found in online repositories. The names of the repository/repositories and accession number(s) can be found at: https://www.cdc.gov/nchs/nhanes/index.htm.
Ethics statement
The NHANES is a series of cross-sectional, complex, multistage surveys conducted by the Centers for Disease Control (CDC) and Prevention of a nationally representative group of non-institutionalized members of the US population designed to provide health and nutrition data. Before taking part, participants provided written informed consent. The NCHS ethics review board reviewed and approved the collection of NHANES data. The studies were conducted in accordance with the local legislation and institutional requirements. The participants provided their written informed consent to participate in this study.
Author contributions
LM, DW and YZ: protocol development and critical review and approval of the manuscript. LM: drafting of the manuscript, analysis, and interpretation of the data. YZ: analysis and interpretation of the data and approved the final version of the submitted manuscript. All authors contributed to the article and approved the submitted version.
Acknowledgments
We thank the authors of the included studies. A special thanks to all of the NHANES participants who freely gave their time to make this and other studies possible.
Conflict of interest
The authors declare that the research was conducted in the absence of any commercial or financial relationships that could be construed as a potential conflict of interest.
Publisher’s note
All claims expressed in this article are solely those of the authors and do not necessarily represent those of their affiliated organizations, or those of the publisher, the editors and the reviewers. Any product that may be evaluated in this article, or claim that may be made by its manufacturer, is not guaranteed or endorsed by the publisher.
Supplementary material
The Supplementary material for this article can be found online at: https://www.frontiersin.org/articles/10.3389/fpubh.2023.1118364/full#supplementary-material
References
1. Mohammadifard, N, Gotay, C, Humphries, KH, Ignaszewski, A, Esmaillzadeh, A, and Sarrafzadegan, N. Electrolyte minerals intake and cardiovascular health. Crit Rev Food Sci Nutr. (2019) 59:2375–85. doi: 10.1080/10408398.2018.1453474
2. Pirkmajer, S, and Chibalin, AV. Na, K-ATPase regulation in skeletal muscle. Am J Physiol Endocrinol Metab. (2016) 311:E1–E31. doi: 10.1152/ajpendo.00539.2015
3. Graudal, NA, Hubeck-Graudal, T, and Jurgens, G. Effects of low sodium diet versus high sodium diet on blood pressure, renin, aldosterone, catecholamines, cholesterol, and triglyceride. Cochrane Database Syst Rev. (2020) 2021:pub5. doi: 10.1002/14651858.CD004022.pub5
4. Zyriax, BC, and Windler, E. Lifestyle changes to prevent cardio– and cerebrovascular disease at midlife: a systematic review. Maturitas. (2022) 167:60–5. doi: 10.1016/j.maturitas.2022.09.003
5. Doyle, ME, and Glass, KA. Sodium reduction and its effect on food safety, food quality, and human health. Compr Rev Food Sci Food Saf. (2010) 9:44–56. doi: 10.1111/j.1541-4337.2009.00096.x
6. Nurmilah, S, Cahyana, Y, Utama, GL, and Ait-Kaddour, A. Strategies to reduce salt content and its effect on food characteristics and acceptance: a review. Foods. (2022) 11:11. doi: 10.3390/foods11193120
7. World Health Organization. Guideline: Sodium intake for adults and children World Health Organization. Geneva, Switzerland: (2012).
8. Powles, J, Fahimi, S, Micha, R, Khatibzadeh, S, Shi, P, Ezzati, M, et al. Global, regional and national sodium intakes in 1990 and 2010: a systematic analysis of 24 h urinary sodium excretion and dietary surveys worldwide. BMJ Open. (2013) 3:e3733. doi: 10.1136/bmjopen-2013-003733
9. National Academies of Sciences, Engineering, and Medicine. Dietary reference intakes for sodium and potassium. Washington, DC: The National Academies Press (2019).
10. Allison, A, and Fouladkhah, A. Adoptable interventions, human health, and food safety considerations for reducing sodium content of processed food products. Foods. (2018) 7:7. doi: 10.3390/foods7020016
11. Fang, K, He, Y, Fang, Y, and Lian, Y. Dietary sodium intake and food sources among Chinese adults: data from the CNNHS 2010-2012. Nutrients. (2020) 12:453. doi: 10.3390/nu12020453
12. Fang, M, Wang, D, Coresh, J, and Selvin, E. Trends in diabetes treatment and control in U.S. adults, 1999-2018. N Engl J Med. (2021) 384:2219–28. doi: 10.1056/NEJMsa2032271
13. National diabetes statistics report, 2020. Atlanta: Centers for Disease Control and Prevention (2020).
14. American Diabetes Association. Economic costs of diabetes in the U.S. in 2017. Diabetes Care. (2018) 41:917–28. doi: 10.2337/dci18-0007
15. Hyun, MK, Park, JH, Kim, KH, Ahn, SK, and Ji, SM. Incidence and risk factors for progression to diabetes mellitus: a retrospective cohort study. Int J Environ Res Public Health. (2021) 19:123. doi: 10.3390/ijerph19010123
16. Meland, E, and Aamland, A. Salt restriction among hypertensive patients: modest blood pressure effect and no adverse effects. Scand J Prim Health Care. (2009) 27:97–103. doi: 10.1080/02813430802661795
17. Suckling, RJ, He, FJ, Markandu, ND, and MacGregor, GA. Modest salt reduction lowers blood pressure and albumin excretion in impaired glucose tolerance and type 2 diabetes mellitus: a randomized double-blind trial. Hypertension. (2016) 67:1189–95. doi: 10.1161/HYPERTENSIONAHA.115.06637
18. Hu, G, Jousilahti, P, Peltonen, M, Lindstrom, J, and Tuomilehto, J. Urinary sodium and potassium excretion and the risk of type 2 diabetes: a prospective study in Finland. Diabetologia. (2005) 48:1477–83. doi: 10.1007/s00125-005-1824-1
19. National Health and nutrition examination survey. About NHANES. Available at: https://www.cdc.gov/nchs/nhanes/about_nhanes.htm (Accessed October 26, 2022).
20. National Health and nutrition examination survey. Survey methods and analytic guidelines. Available at: https://www.cdc.gov/nchs/nhanes/index.htm (Accessed October 26, 2022).
21. National Center for Health Statistics, Centers for Disease Control and Prevention NCHS research ethics review board (ERB) approval. Available at: https://www.cdc.gov/nchs/nhanes/irba98.htm (Accessed October 26, 2022).
22. Heianza, Y, Zheng, Y, Ma, W, Rimm, EB, Albert, CM, Hu, FB, et al. Duration and life-stage of antibiotic use and risk of cardiovascular events in women. Eur Heart J. (2019) 40:3838–45. doi: 10.1093/eurheartj/ehz231
23. National Health and nutrition examination survey. Tutorials-weighting module. Available at: https://wwwn.cdc.gov/nchs/nhanes/tutorials/Weighting.aspx (Accessed April 01, 2023).
24. International Diabetes Federation Guideline Development Group. Global guideline for type 2 diabetes. Diabetes Res Clin Pract. (2014) 104:1–52. doi: 10.1016/j.diabres.2012.10.001
25. Centers for Disease Control and Prevention: biomonitoring summary for cotinine. Available at: https://www.cdc.gov/biomonitoring/Cotinine_BiomonitoringSummary.html (Accessed October 26, 2022).
26. Hukkanen, J, Jacob, PR, and Benowitz, NL. Metabolism and disposition kinetics of nicotine. Pharmacol Rev. (2005) 57:79–115. doi: 10.1124/pr.57.1.3
27. Bull, FC, Maslin, TS, and Armstrong, T. Global physical activity questionnaire (GPAQ): nine country reliability and validity study. J Phys Act Health. (2009) 6:790–804. doi: 10.1123/jpah.6.6.790
28. Yuan, S, and Larsson, SC. An atlas on risk factors for type 2 diabetes: a wide-angled Mendelian randomisation study. Diabetologia. (2020) 63:2359–71. doi: 10.1007/s00125-020-05253-x
29. Vuori, MA, Harald, K, Jula, A, Valsta, L, Laatikainen, T, Salomaa, V, et al. 24-h urinary sodium excretion and the risk of adverse outcomes. Ann Med. (2020) 52:488–96. doi: 10.1080/07853890.2020.1780469
30. Kim, MK. Dietary sodium intake in patients with type 2 diabetes mellitus. Diabetes Metab J. (2016) 40:280–2. doi: 10.4093/dmj.2016.40.4.280
31. Ueno, S, Aung, MN, Yuasa, M, Ishtiaq, A, Khin, ET, Latt, TS, et al. Association between dietary habits and type 2 diabetes mellitus in Yangon, Myanmar: a case-control study. Int J Environ Res Public Health. (2021) 18:11056. doi: 10.3390/ijerph182111056
32. Itoh, N, Tsuya, A, Togashi, H, Kimura, H, Konta, T, Nemoto, K, et al. Increased salt intake is associated with diabetes and characteristic dietary habits: a community-based cross-sectional study in Japan. J Clin Biochem Nutr. (2022) 71:143–50. doi: 10.3164/jcbn.21-153
33. Grillo, A, Salvi, L, Coruzzi, P, Salvi, P, and Parati, G. Sodium intake and hypertension. Nutrients. (2019) 11:11091970. doi: 10.3390/nu11091970
34. Wu, Y, Hu, H, Cai, J, Chen, R, Zuo, X, Cheng, H, et al. Association of hypertension and incident diabetes in Chinese adults: a retrospective cohort study using propensity-score matching. BMC Endocr Disord. (2021) 21:87. doi: 10.1186/s12902-021-00747-0
35. Abdulai, T, Runqi, T, Mao, Z, Oppong, TB, Amponsem-Boateng, C, Wang, Y, et al. Preference for high dietary salt intake is associated with undiagnosed type 2 diabetes: the Henan rural cohort. Front Nutr. (2020) 7:537049. doi: 10.3389/fnut.2020.537049
36. Wei, GS, Coady, SA, Goff, DJ, Brancati, FL, Levy, D, Selvin, E, et al. Blood pressure and the risk of developing diabetes in african americans and whites: ARIC, CARDIA, and the Framingham heart study. Diabetes Care. (2011) 34:873–9. doi: 10.2337/dc10-1786
37. He, FJ, Marrero, NM, and MacGregor, GA. Salt intake is related to soft drink consumption in children and adolescents: a link to obesity? Hypertension. (2008) 51:629–34. doi: 10.1161/HYPERTENSIONAHA.107.100990
38. Zou, M, Chen, Y, Zheng, Z, Sheng, S, Jia, Y, Wang, X, et al. High-salt attenuates the efficacy of Dapagliflozin in tubular protection by impairing fatty acid metabolism in diabetic kidney disease. Front Pharmacol. (2021) 12:741087. doi: 10.3389/fphar.2021.741087
39. Alswat, K. Type 2 diabetes control and complications and their relation to serum magnesium level. Arch Med Sci. (2022) 18:307–13. doi: 10.5114/aoms/102443
40. Fang, X, Wang, K, Han, D, He, X, Wei, J, Zhao, L, et al. Dietary magnesium intake and the risk of cardiovascular disease, type 2 diabetes, and all-cause mortality: a dose-response meta-analysis of prospective cohort studies. BMC Med. (2016) 14:210. doi: 10.1186/s12916-016-0742-z
41. Franken, G, Adella, A, Bindels, R, and de Baaij, J. Mechanisms coupling sodium and magnesium reabsorption in the distal convoluted tubule of the kidney. Acta Physiol (Oxf). (2021) 231:e13528. doi: 10.1111/apha.13528
42. Romani, AM. Cellular magnesium homeostasis. Arch Biochem Biophys. (2011) 512:1–23. doi: 10.1016/j.abb.2011.05.010
43. Baudrand, R, Campino, C, Carvajal, CA, Olivieri, O, Guidi, G, Faccini, G, et al. High sodium intake is associated with increased glucocorticoid production, insulin resistance and metabolic syndrome. Clin Endocrinol. (2014) 80:677–84. doi: 10.1111/cen.12225
44. Vedovato, M, Lepore, G, Coracina, A, Dodesini, AR, Jori, E, Tiengo, A, et al. Effect of sodium intake on blood pressure and albuminuria in type 2 diabetic patients: the role of insulin resistance. Diabetologia. (2004) 47:300–3. doi: 10.1007/s00125-003-1303-5
45. Premilovac, D, Richards, SM, Rattigan, S, and Keske, MA. A vascular mechanism for high-sodium-induced insulin resistance in rats. Diabetologia. (2014) 57:2586–95. doi: 10.1007/s00125-014-3373-y
46. Zhao, Y, Gao, P, Sun, F, Li, Q, Chen, J, Yu, H, et al. Sodium intake regulates glucose homeostasis through the PPARdelta/adiponectin-mediated SGLT2 pathway. Cell Metab. (2016) 23:699–711. doi: 10.1016/j.cmet.2016.02.019
47. Lanaspa, MA, Kuwabara, M, Andres-Hernando, A, Li, N, Cicerchi, C, Jensen, T, et al. High salt intake causes leptin resistance and obesity in mice by stimulating endogenous fructose production and metabolism. Proc Natl Acad Sci U S A. (2018) 115:3138–43. doi: 10.1073/pnas.1713837115
Keywords: sodium intake, diabetes, NHANES, diet, non-hypertension
Citation: Ming L, Wang D and Zhu Y (2023) Association of sodium intake with diabetes in adults without hypertension: evidence from the National Health and Nutrition Examination Survey 2009–2018. Front. Public Health. 11:1118364. doi: 10.3389/fpubh.2023.1118364
Edited by:
Pierluigi Marzuillo, University of Campania Luigi Vanvitelli, ItalyReviewed by:
Reza Nemati, Canterbury Health Laboratories, New ZealandTao Feng, Shanghai Institute of Technology, China
Copyright © 2023 Ming, Wang and Zhu. This is an open-access article distributed under the terms of the Creative Commons Attribution License (CC BY). The use, distribution or reproduction in other forums is permitted, provided the original author(s) and the copyright owner(s) are credited and that the original publication in this journal is cited, in accordance with accepted academic practice. No use, distribution or reproduction is permitted which does not comply with these terms.
*Correspondence: Yong Zhu, Y3FtdXpodXlvbmdAMTYzLmNvbQ==