 Arti Tiwari
 Kamanasish Bhattacharjee2*
 Vaclav Snasel
- 1Department of Applied Mathematics and Scientific Computing, Indian Institute of Technology Roorkee, Roorkee, Uttarakhand, India
- 2Machine Intelligence in Medicine and Imaging (MI-2) Lab, Mayo Clinic, Phoenix, AZ, United States
- 3Mehta Family School for Data Science and Artificial Intelligence, Indian Institute of Technology Roorkee, Roorkee, Uttarakhand, India
- 4CHRIST (Deemed to be University) Delhi NCR, Ghaziabad, India
- 5Department of Computer Science, VŠB-Technical University of Ostrava, Ostrava, Czechia
The outbreak of COVID-19, a little more than 2 years ago, drastically affected all segments of society throughout the world. While at one end, the microbiologists, virologists, and medical practitioners were trying to find the cure for the infection; the Governments were laying emphasis on precautionary measures like lockdowns to lower the spread of the virus. This pandemic is perhaps also the first one of its kind in history that has research articles in all possible areas as like: medicine, sociology, psychology, supply chain management, mathematical modeling, etc. A lot of work is still continuing in this area, which is very important also for better preparedness if such a situation arises in future. The objective of the present study is to build a research support tool that will help the researchers swiftly identify the relevant literature on a specific field or topic regarding COVID-19 through a hierarchical classification system. The three main tasks done during this study are data preparation, data annotation and text data classification through bi-directional long short-term memory (bi-LSTM).
1. Introduction
Early in the year 2020, the outbreak of COVID-19 created havoc around the world, leading to mental trauma, shattered economies and, above all, the loss of human life. While the researchers and scientists were trying to understand more about the virus and a possible antidote/vaccine for it, the challenge for the Government was to keep its people safe by enforcing preventive measures like lockdowns. The uncertainty of the situation affected almost all sections of society. Despite all this grimness, the scientific and research community was doing its bit through experiments and observations and publishing research articles and reports on its basis. The COVID pandemic, perhaps, also is the first case of its kind that provoked research in all possible dimensions. Although the situation is not alarming anymore, with people getting vaccinated and economies getting back on pace, the research on COVID-19 is still continuing, and a noticeable quantity of research articles are being published.
The internet now contains a plethora of literature dedicated to the various aspects of COVID-19 ranging from studies related to lab experiments to clinical studies to vaccines and drug development to diagnostic techniques and many more. There are several studies dedicated to economics and mathematical models, forecasting methods to estimate the spread of the virus, supply chain models and several others.
1.1. Bibliometric analysis
A selected bibliometric analysis was performed on the CORD-19 dataset for articles related to COVID-19 which were later used for model training and database development. The results are obtained to show the trend of publications for COVID-19 articles and the “terms” used in the paper to label the classes.
Figure 1 shows that in 2019, at the onset of COVID-19, the publications were 301 in number, which raised to 83,660 in 2020 and further raised to 92,469 in 2021 and although in 2022, the number of articles became 29,485, the trends are good enough to indicate that the research is still continuing in this area with new research papers being published from time to time.
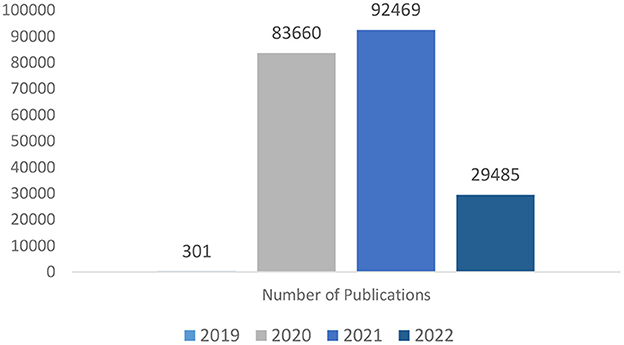
Figure 1. Year-wise number of publications listed in CORD-19 dataset.
Figure 2 shows a network visualization created using Vosviewer (https://www.vosviewer.com/). The network map includes the terms/items (object of interest) represented by a circle driven by the title and abstract of the selected articles and the links between the terms based on their pair-wise occurrence. The higher the occurrence of an item, the bigger the circle. In this map total of 612 terms are selected and grouped into four non-overlapping clusters. Cluster-one (red) consists of 223 terms, cluster-two (green) contains 186 items, cluster-three (blue) incorporate 149 items, and cluster-four (yellow) contains 54 terms.
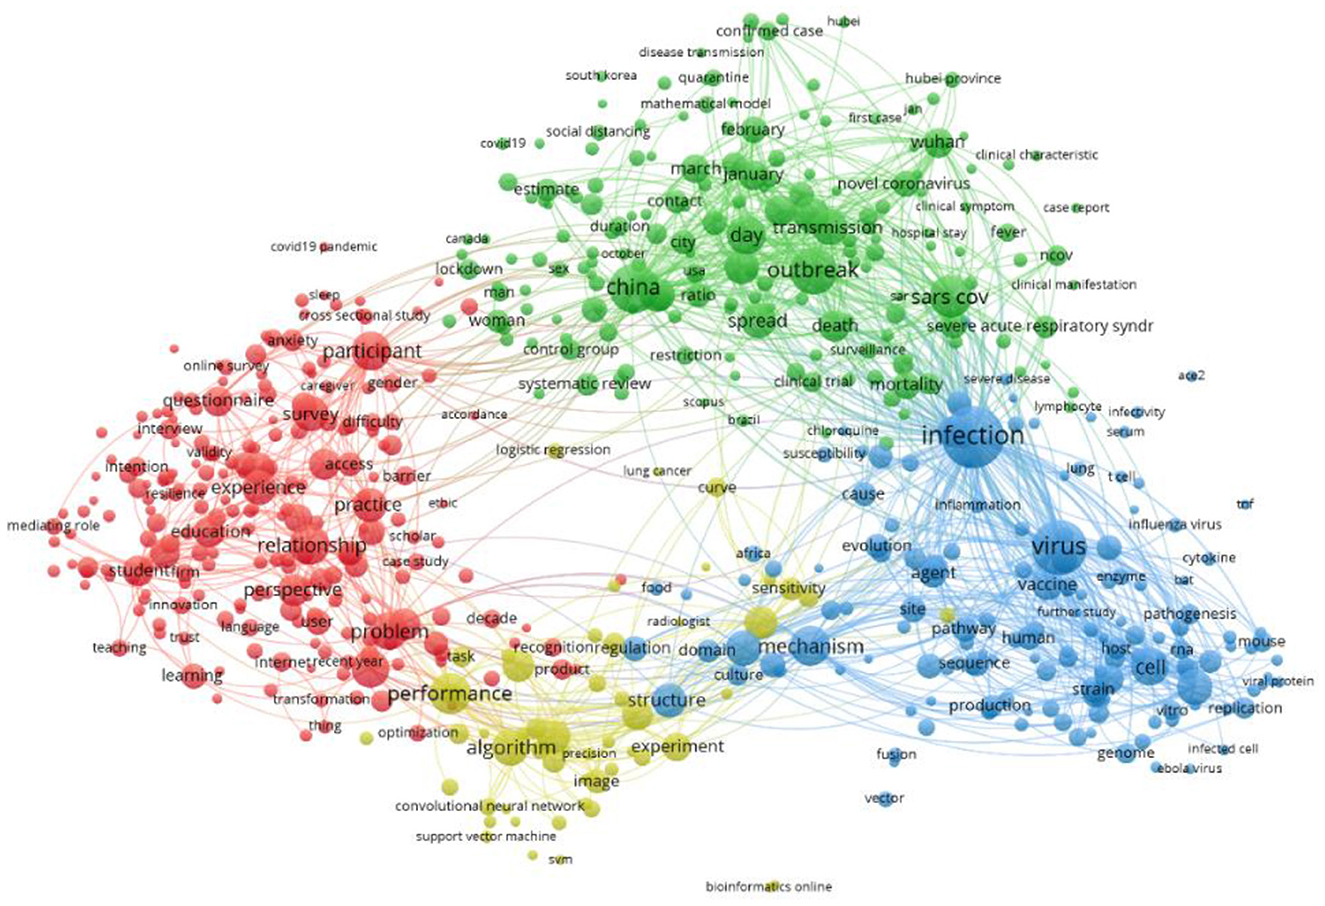
Figure 2. Network visualization map based on Abstract and Title.
In Figure 2, the term “infection” is depicted with the biggest circle, as this term shares the highest co-occurrence with the other terms.
Figure 3 describes the network visualization map of the term/item “infection,” which possesses the highest occurrence value and link strength value as 433 and 5,014, respectively. The link strength value shows the number of articles where two terms occurred together.
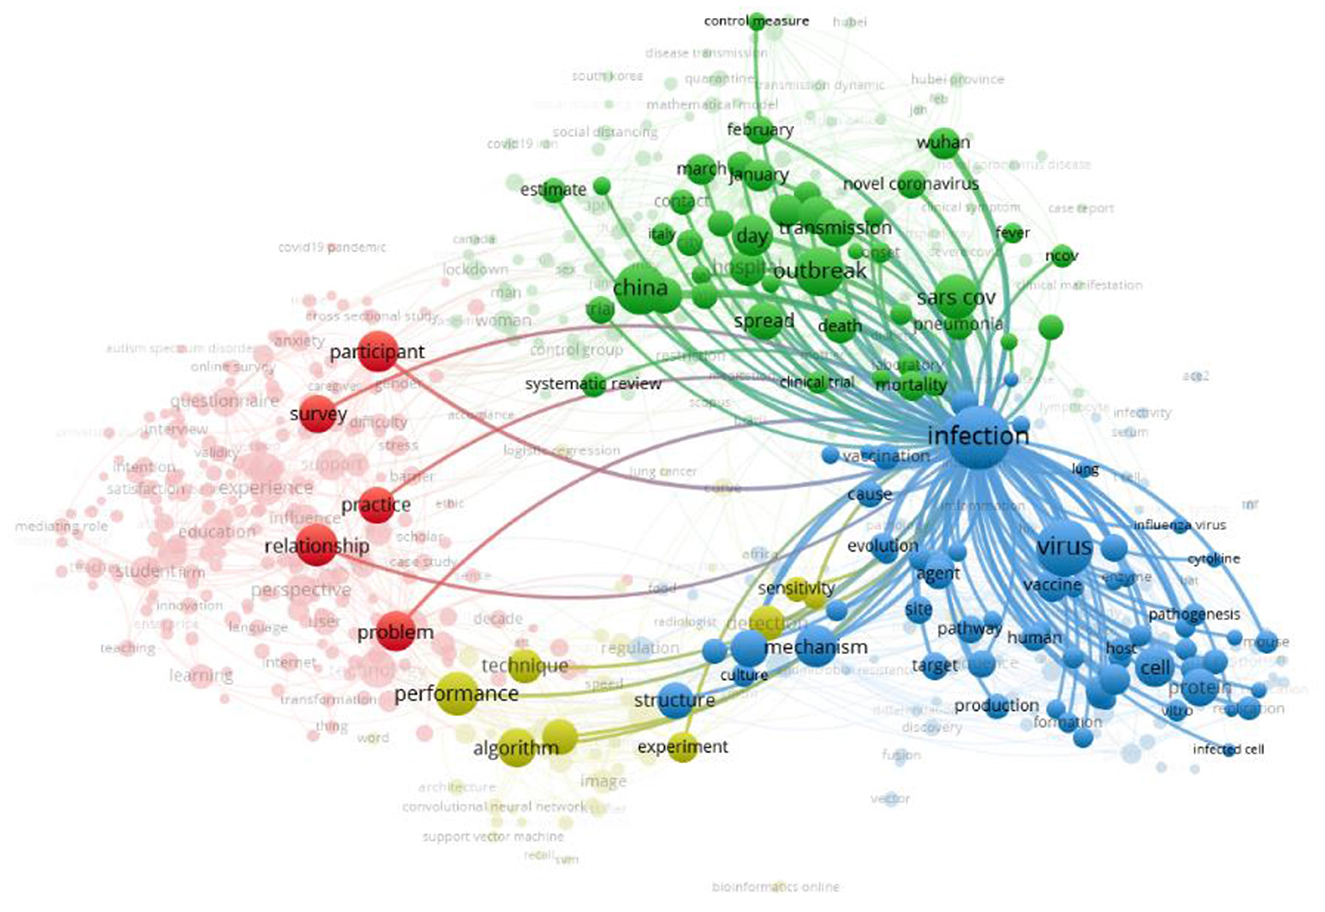
Figure 3. Network visualization map of the term “infection”.
On the basis of the publication years of the selected articles, an overlay visualization map is created in Figure 4. This visualization of this map is identical to the network map, however, its interpretation is based on the score of the average publication year.
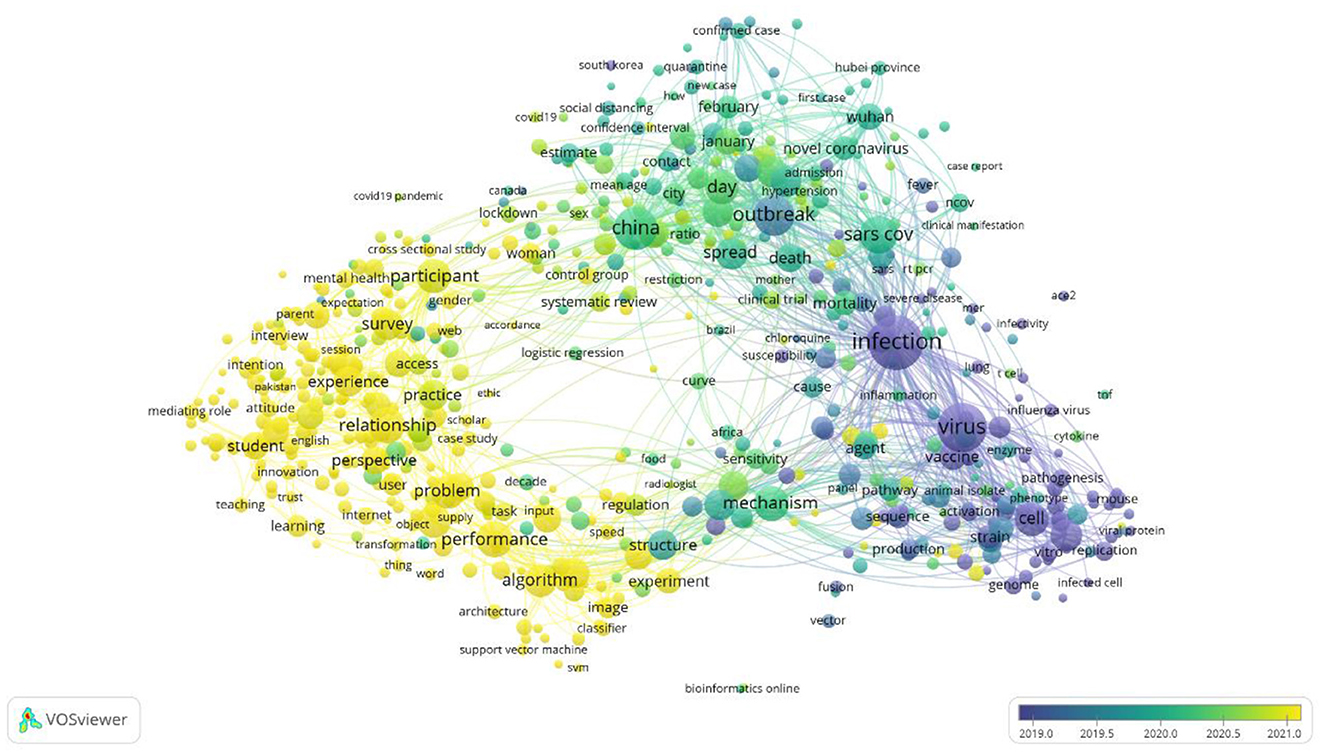
Figure 4. Overley visualization of the articles based on publication year.
This map shows the focus shifts on the area of research publication throughout the year 2019 to the year 2021. Since early to mid-2019, the published articles were subjected toward the infection, virus, and vaccine. From mid-2019 to mid-2020 the published articles were tend toward China, the outbreak, SARS-CoV, and its spread. After mid-2020, the articles are focused on problem-solving, algorithms, perspective, experiments and performance.
1.2. Need for a dedicated research support tool
The graphs given above clearly indicate, how the research is growing in the area of COVID-19. These graphs also show that there are several categories (fields) of research and every category can be further divided into sub-categories (subfields). For a new researcher, digging into this plethora of information can be quite overwhelming. It becomes difficult for a researcher to identify the correct literature relevant to one's area of interest. This difficulty may be eased to some extent if there is a dedicated platform which can easily guide them to their area of interest. In the literature, very few dedicated research support tools are available as per the authors understanding. The closest works to this study can be found in Simon et al. (1). Here the authors have presented a text mining based tool called BioReader for the classification of Biomedical research. In (2), R-classify is a web tool developed by Aggarwal et al. to help users in finding out the relevant literature in the area of Computer Science. Doty et al. (3) developed a python-based graphical user interface to conduct the classification and visualization of electron microscopy data.
In the present article, an Artificial Intelligence (AI) enabled automatic classification tool called Research Support Tool (RST) is developed for COVID-19-related literature. Since the problem is of text (literature) classification, a Bi-LSTM neural network is used. The Bi-LSTM model is trained on the abstract and title of the selected articles. The articles are taken from the CORD-19 dataset and are divided into seven categories (class labels) based on their subjects. The RST is developed using IONIC and Angular framework. Remaining of the article consists of three more sections. In Section 2, the methodology followed in the present study is described. In Section 3, the user interface is presented, and the workflow is defined. Finally, Section 4 provides the concluding remarks and also provides some future directions in which the work can be extended.
2. Materials and methodology
The work done in this study can be divided into four major steps, which start from data collection to its preparation to its labeling and finally to its classification. The steps are defined below in Figure 5.
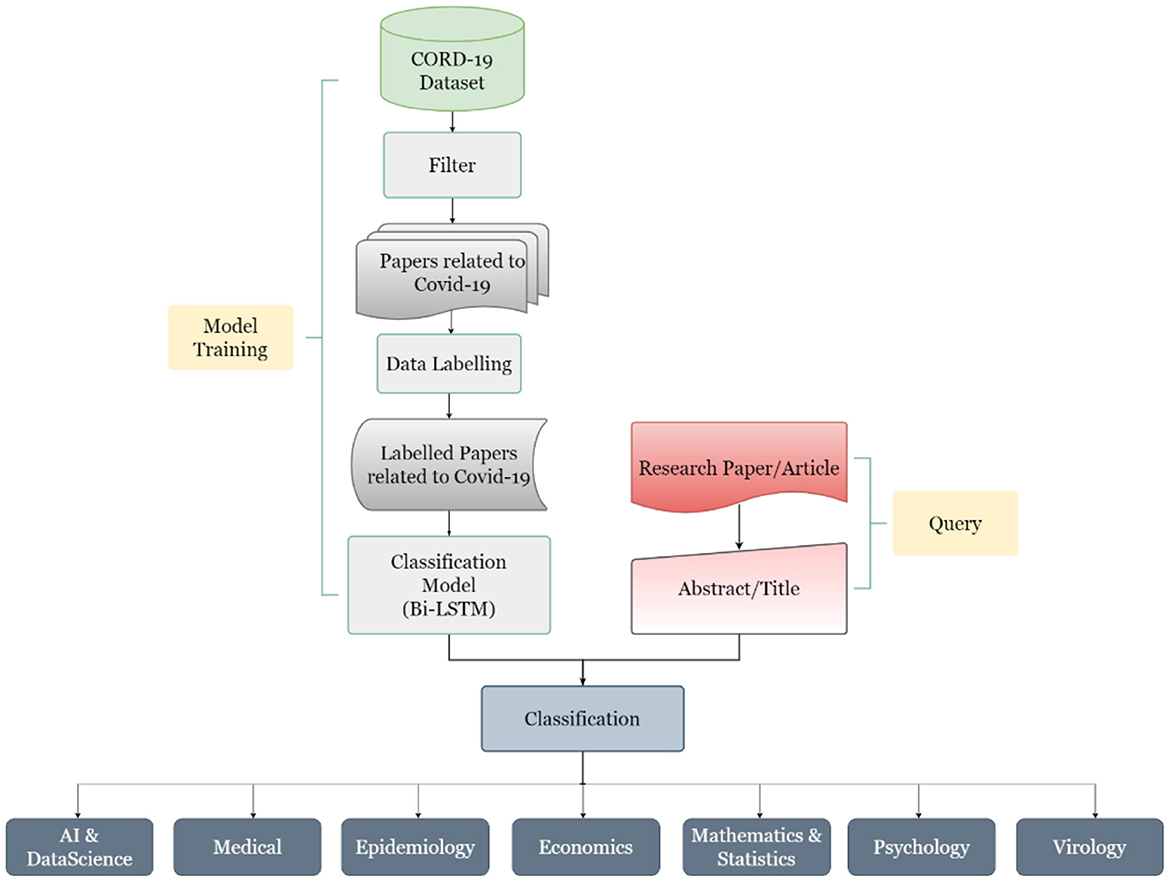
Figure 5. The workflow diagram of the AI-enabled research support tool process.
2.1. Step 1: Data collection
The first step in this study is the collection of data for which the COVID-19 Open Research Dataset or CORD-19 (4) was selected. It is curated by Allen Institute for AI (AI2) and is available on Kaggle (5) as well as on AI2's Semantic Scholar website (6). This database is periodically updated. At the time of the preparation of this article, it contained resources for almost 4,00,000 scholarly articles, including over 2,45,000 full-text articles on COVID-19, SARS-CoV-2, and variants of coronaviruses.
2.2. Step 2: Data preparation
Once the data source has been identified, the next step is to prepare the data for further usage. To make the study more relevant in terms of the COVID scenario, only the studies subjected to COVID-19 or SARS-CoV-2 were considered. This was done by using the keywords like “COVID-19,” “Wuhan,” “Hubei,” “SARS-CoV-2,” “2019 novel coronavirus,” “2019-nCoV,” “coronavirus disease 2019,” “corona pandemic,” “coronavirus outbreak,” and their combinations and filtering out the studies not meeting up with our criteria. Initially, 4,532 articles were selected based on different subjects, after filtering out the inconsistent, incomplete data, a total of 3,011 articles are taken for the model training and database development.
2.3. Step 3: Data labeling
The third step, and also one of the key tasks of this study, was to label the articles, which can be classified later as per the machine learning algorithms. The literature was segregated into seven major classes per the experts' discussion. These seven classes are Artificial Intelligence (AI) and Data Science, Economics, Epidemiology, Mathematics and Statistics, Medical, Psychology and Virology. A brief description of the classes is shown in Table 1, and the subclasses of the selected articles are shown in Figure 6.
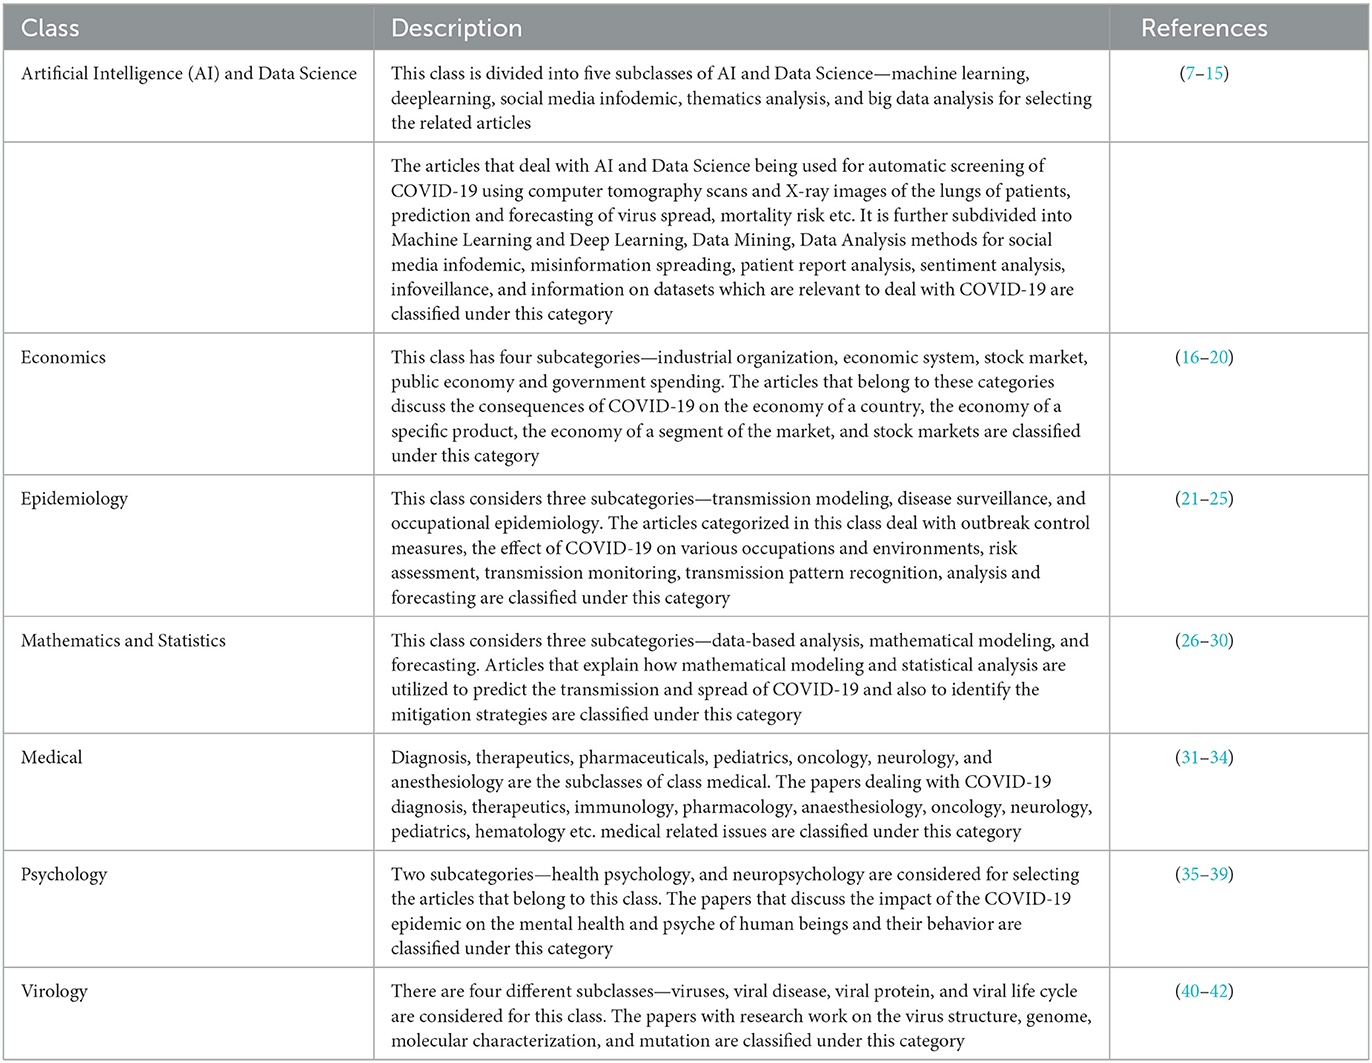
Table 1. A description of class labels categorization.
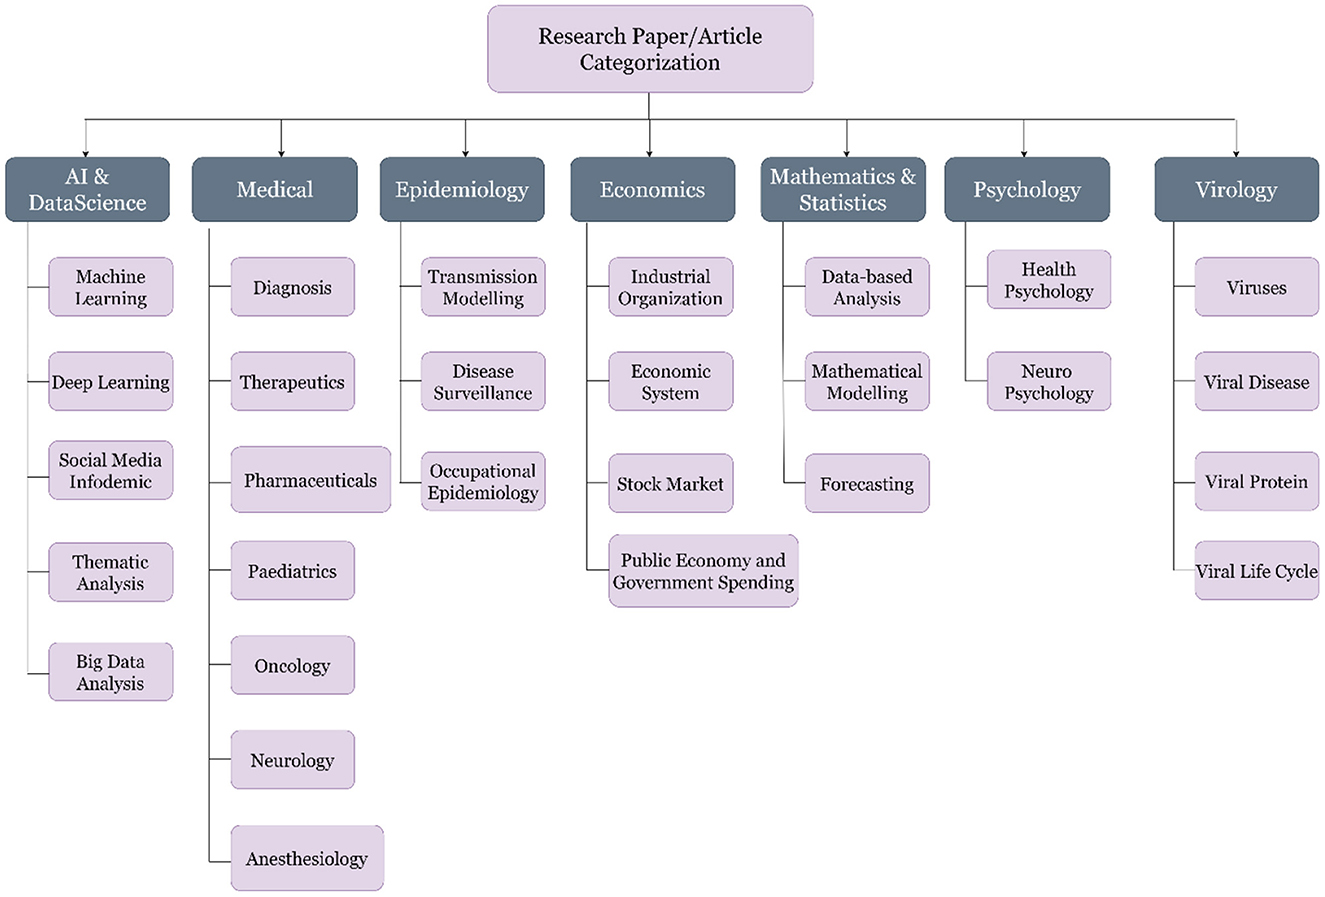
Figure 6. Categorization and sub-categorization of the articles selected for the study.
In the dataset created for this work, each data contains the title, abstract, and class label of the literature. The data distribution among the selected seven categories is shown in Figure 7.
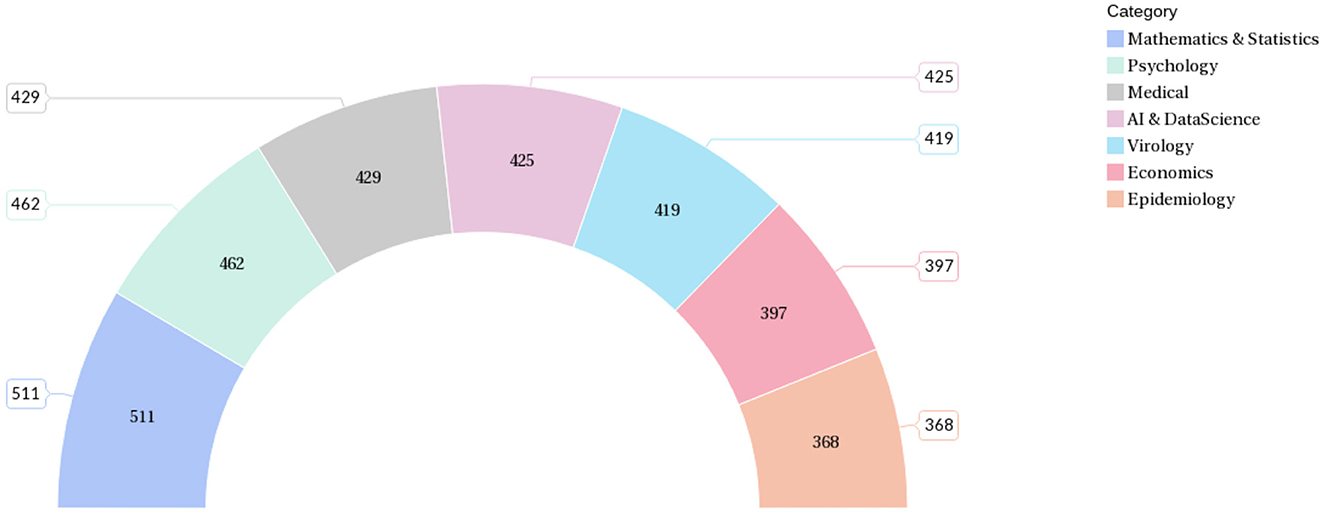
Figure 7. Number of data samples (articles) assigned to the class categories.
2.4. Step 3: Classification
The AIRST developed in the present study is based on the classification of text, for which the Bi-directional long short-term memory (Bi-LSTM) neural network (43) is implemented. Vanilla neural networks are not found to be suitable for texts as these are unable to process the sequences.
Recurrent neural networks (RNN), have a loop-like architecture which allows the information to persist. RNNs have been successfully applied to various areas including speech recognition, speech synthesis, language translation, image captioning and many more (44–46). However, in the case of sequential data, it sometimes becomes susceptible to vanishing gradient due to long-term dependency. The problem of vanishing gradient can be resolved with the help of LSTMs (47), a type of RNN which are capable of learning long-term dependencies. The LSTM models are made up of cell states and various gates. While the cell state in LSTM acts like a memory of the network and transfers relevant information down the sequence chain model; gates are the neural networks that decide the information to be retained and the information to be forgotten during training. An LSTM model consists of three gates viz. forget gate, input gate, and output gate. These gates are described in brief as follows.
2.4.1. Forget gate
The first step of the LSTM cell is to retain the relevant information and to discard the information that is not of significance. This is done with the help of the sigmoid layer known as the “forget gate layer.” The activation value for the forget gate can be given as:
where xt is input vector at timestamp t ht−1is a hidden state or output of the previous timestamp, w, b represent the weight and deviation matrix, respectively.
The sigmoid function normalizes all the activation values between 0 and 1. The value 0 implies all forgotten, and the value 1 implies nothing forgotten.
2.4.2. Input gate
The second step in an LSTM model is to identify the information that will be stored in the state of a cell. The input gate layer quantifies the crucial information carried by the input. This step is further divided into two parts. First, an “input gate layer” (sigmoid layer) decides the values to be added to the cell state Ct and then, a tanh layer derives a vector of new candidate value Nt, that has to be added to the state. This is followed by the combination of the aforementioned steps to update the state. The input gate activation value is as follows:
where, xt is input vector at timestamp t, ht−1is a hidden state or output of the previous timestamp, w, b represent the weight and deviation matrix, respectively.
Nt is defined as:
Cell state is updated as:
Where, Ct−1 is the previous cell state.
2.4.3. Output gate
The objective of the output gate is to decide the output which in turn will be n the basis of the state of the cell. Here, a sigmoid layer identifies the part of the cell state that will be the output. This information is further processed by passing the cell state through the activation function tanh and multiplying it with the output of the sigmoid gate. Finally, the output ht is obtained as:
2.4.4. Bi-directional long short-term memory
Bi-directional long short-term memory (Bi-LSTM) is an extended and improved version of LSTM; it is an integration of two independent RNN models. Unlike unidirectional LSTM, in Bi-LSTM, the information flows in both directions: backward as well as in the forward direction. This is illustrated in Figure 8.
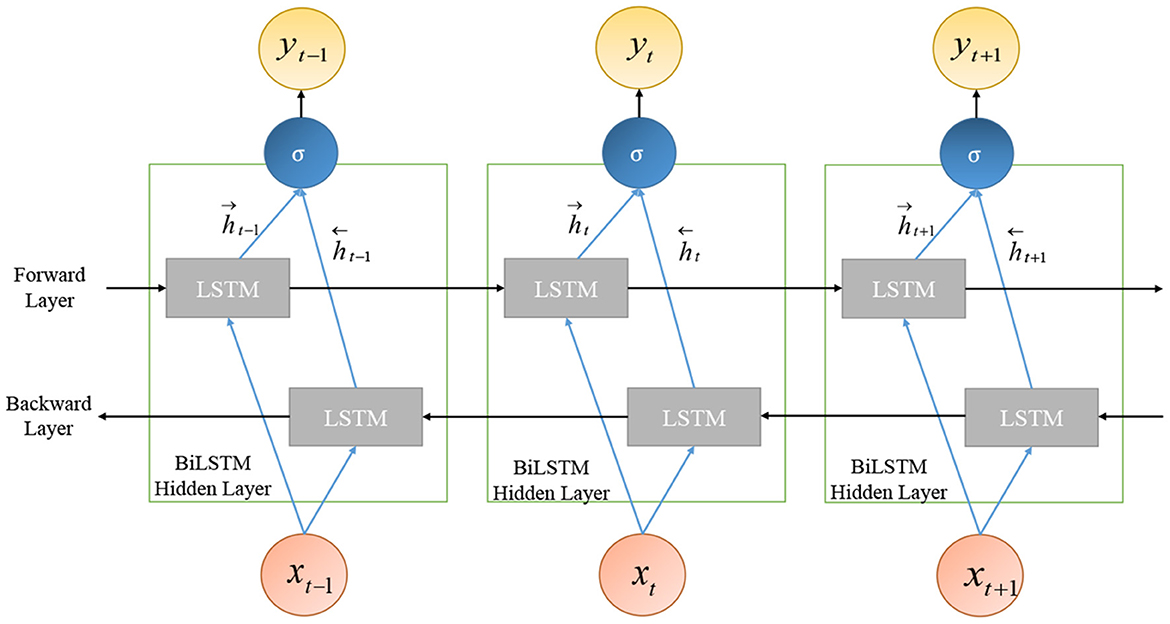
Figure 8. Bi-directional long short-term memory (Bi-LSTM).
Bi-LSTM exploits the information about the sequence in both directions at every timestamp by connecting two hidden layers to the same output. The management of the past and future information, for a sequence, leads to better predictions for Bi-LSTM. The output of the hidden layer of Bi-LSTM is made up of the activation output of forward as well as backward hidden layers:
where, Ht represents the hidden layer, and its output includes the forward layer output and backward layer output .
The Bi-LSTM model was trained on a total of 3,011 samples of seven different categories of research articles related to COVID-19 that are collected from the CORD-19 dataset. The parameters of the Bi-LSTM model architecture are mentioned in Table 2.
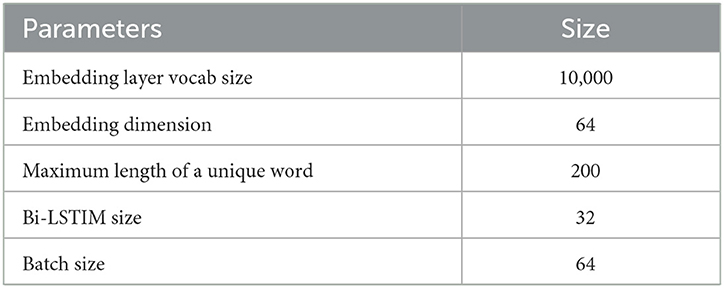
Table 2. Parameters of Bi-LSTM model architecture.
The final layer of the model is the Dense output layer with seven neurons representing the total number of class labels and Softmax activation function. To avoid overfitting while training the model, each layer is followed by the Dropout layer with an alpha value as 0.35.
2.5. User interface and workflow
The workflow of the research support tool has two components—the objective of the user interface development and the cloud environment-based application development tools.
2.5.1. Objective
A research support tool has been designed to meet the following three primary objectives:
1. Enable users to view COVID-19-related research papers and articles under different categories. The users are also enabled to filter and search for research papers based on the title of the research papers.
2. Enable users to categorize an article not available in the dataset. The user can do that by providing DOI and proceeding after checking the extracted title and abstract.
3. Enable users to contribute to the labeled dataset by providing the title and abstract of the research paper and assigning a category manually.
2.5.2. Application development tool
A cloud environment-based application was developed that used a micro-service architecture to meet the mentioned requirements. The following technology stack was selected to develop the tool:
1. Azure Cloud platform—Azure Cosmos DB (NoSQL) and Azure Cloud Functions were used for storing and retrieving data, executing the Python script to categorize research papers based on the trained model.
2. Ionic + Angular—Ionic and Angular frameworks were used to develop the user interface because of easily available components and ability to deploy on multiple platforms such as Desktop, Mobile (Android and iOS using Cordova or Capacitor), Progressive Web Apps (PWA) and Cloud Hosted Web.
3. NodeJ—NodeJS middleware was used to access micro-services and respond to user interactions.
The workflow of the developed user interface consists of three parts: (1) use of helper APIs, (2) load data for training and training the model, (3) evaluation: evaluation again consists of two parts—the use of helper APIs and Evaluation against the model. The complete process of user interface workflow is shown in Table 3.
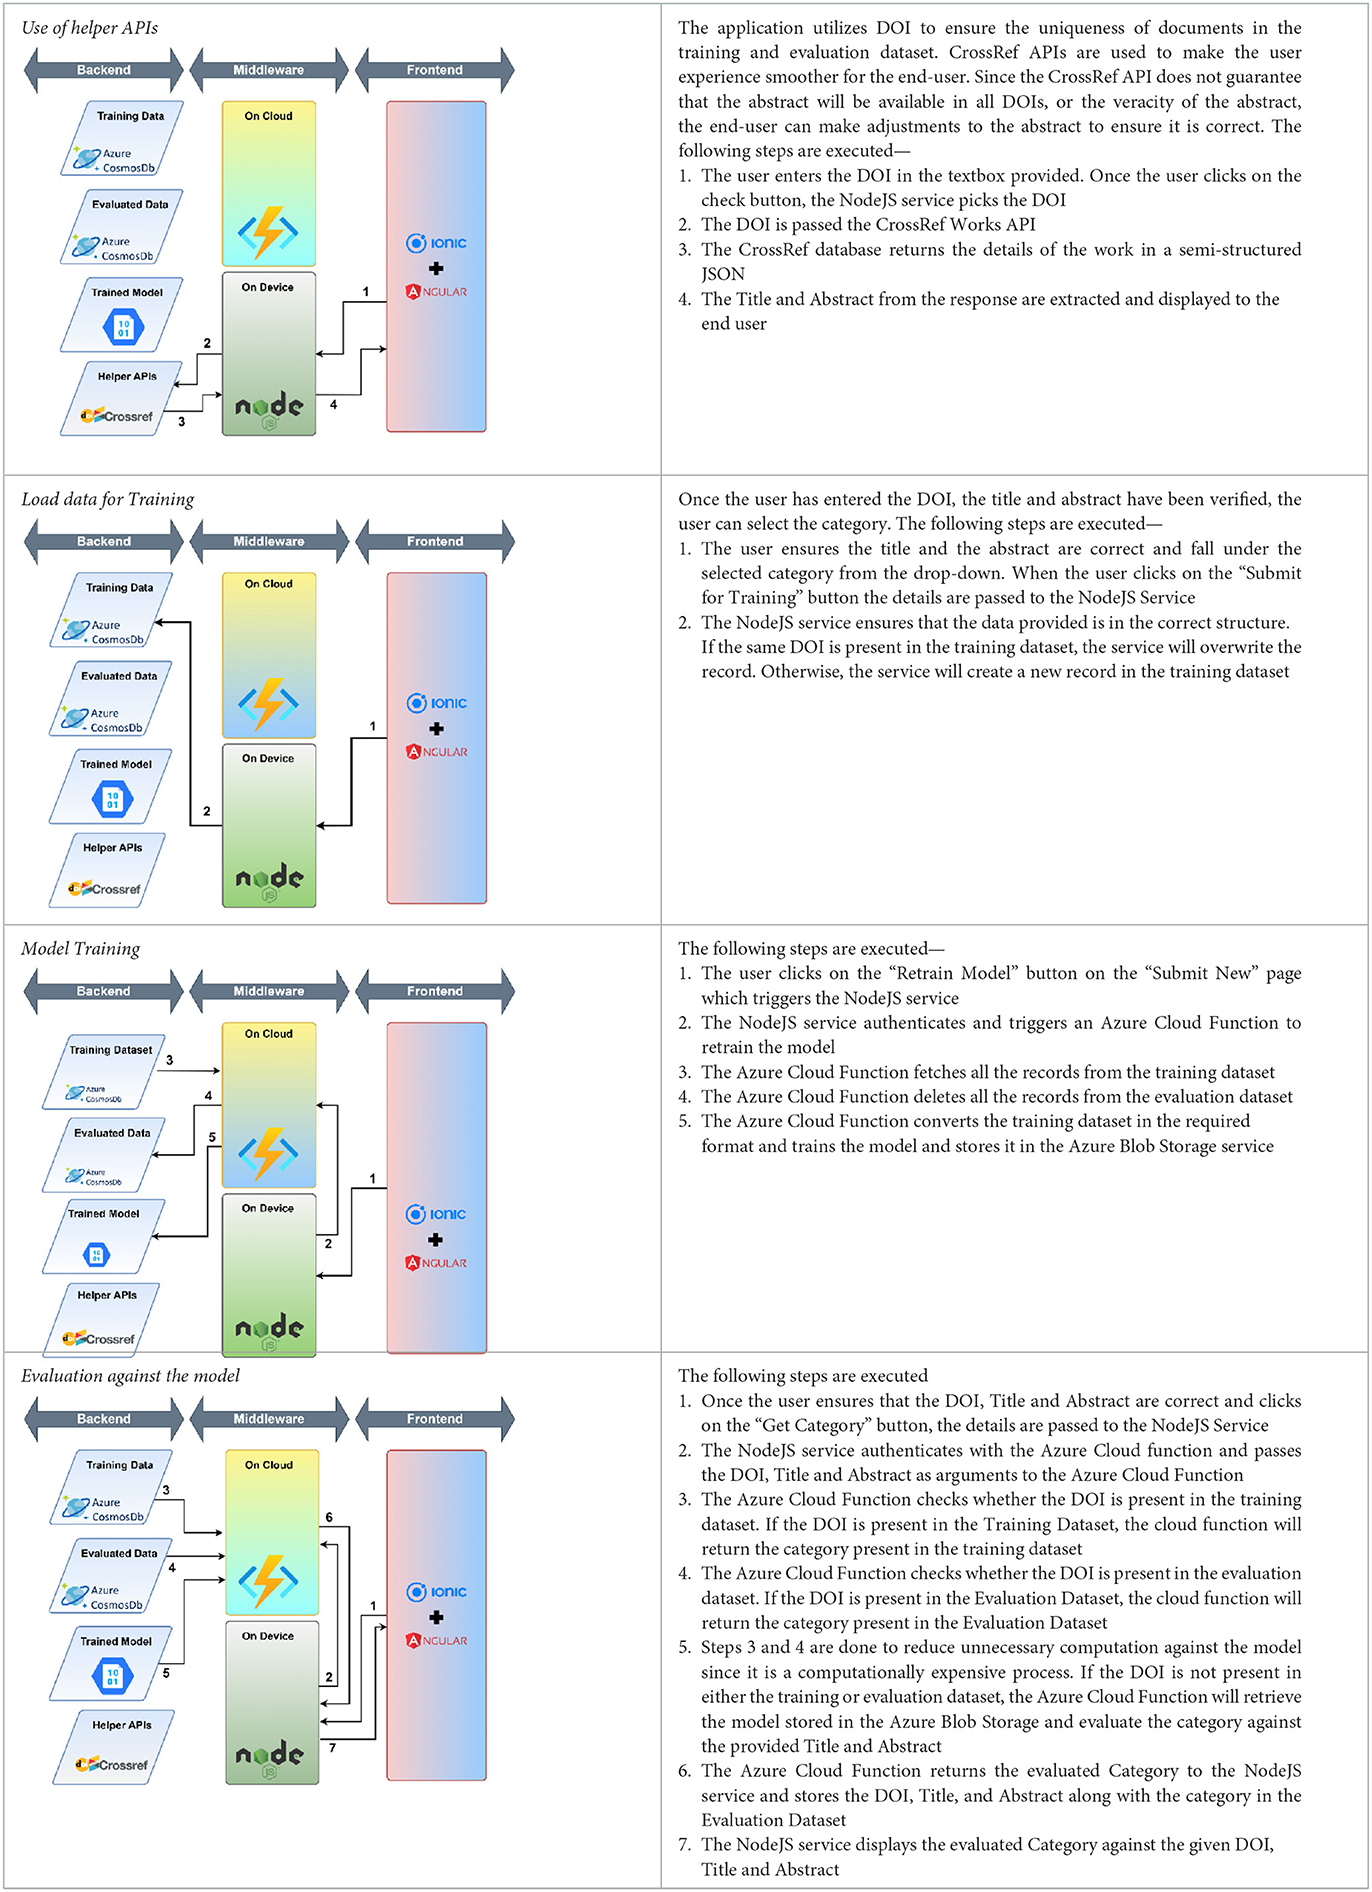
Table 3. A detailed workflow of the developed user interface.
3. Results and analysis
The Bi-LSTM classification model is trained for the 25 epochs, and obtained maximum validation accuracy as 0.97, with a minimum validation loss as 0.015. The accuracy and loss for every epoch of training and validation are shown in graphs plots in Figures 9A, B, respectively.
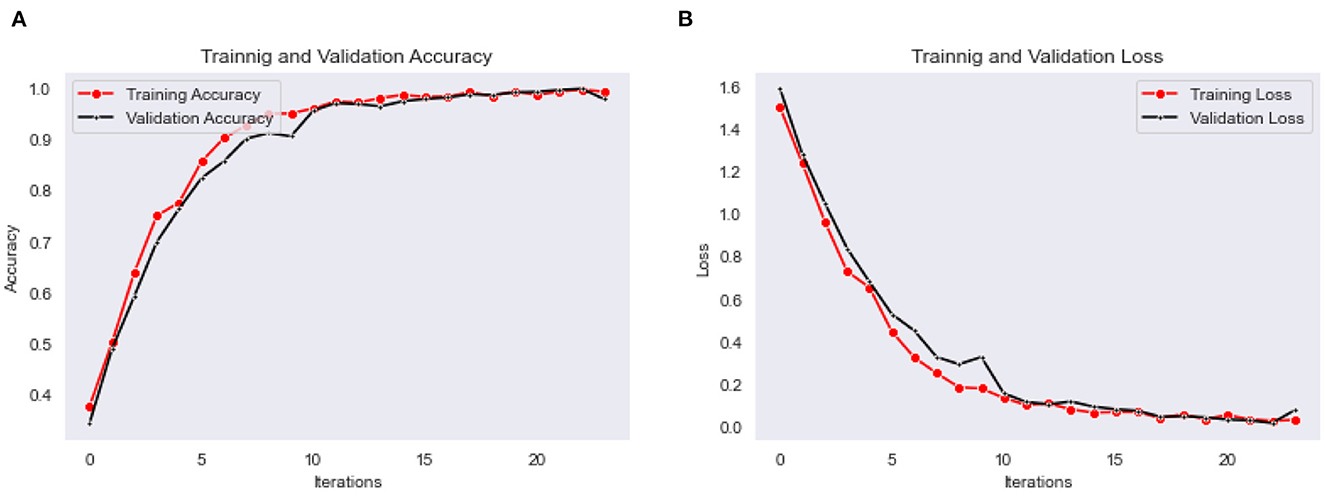
Figure 9. (A) Training and validation accuracy, (B) training and validation loss plots of Bi-LSTM classification model.
The performance of the research support tool is presented through the screen captures of the developed user interface. Users can see the following view upon landing. The view is divided into three segments to meet the three objectives mentioned above. These segments can be accessed using the three tabs at the bottom of the interface.
1. The “Directory” tab is used to view, search and filter the research papers already categorized by the model. These include records from the training dataset and any records generated when a customer is evaluating a research paper using the model, shown in Figures 10A–D.
2. The “Evaluate” tab is used to provide the details of a research paper and categorize it using the trained model, shown in Figure 11A.
3. The “Submit New Entry” tab is used to manually label any research paper and add it to the training dataset. This will allow us to grow the training dataset and re-train the model periodically, as shown in Figure 11B.
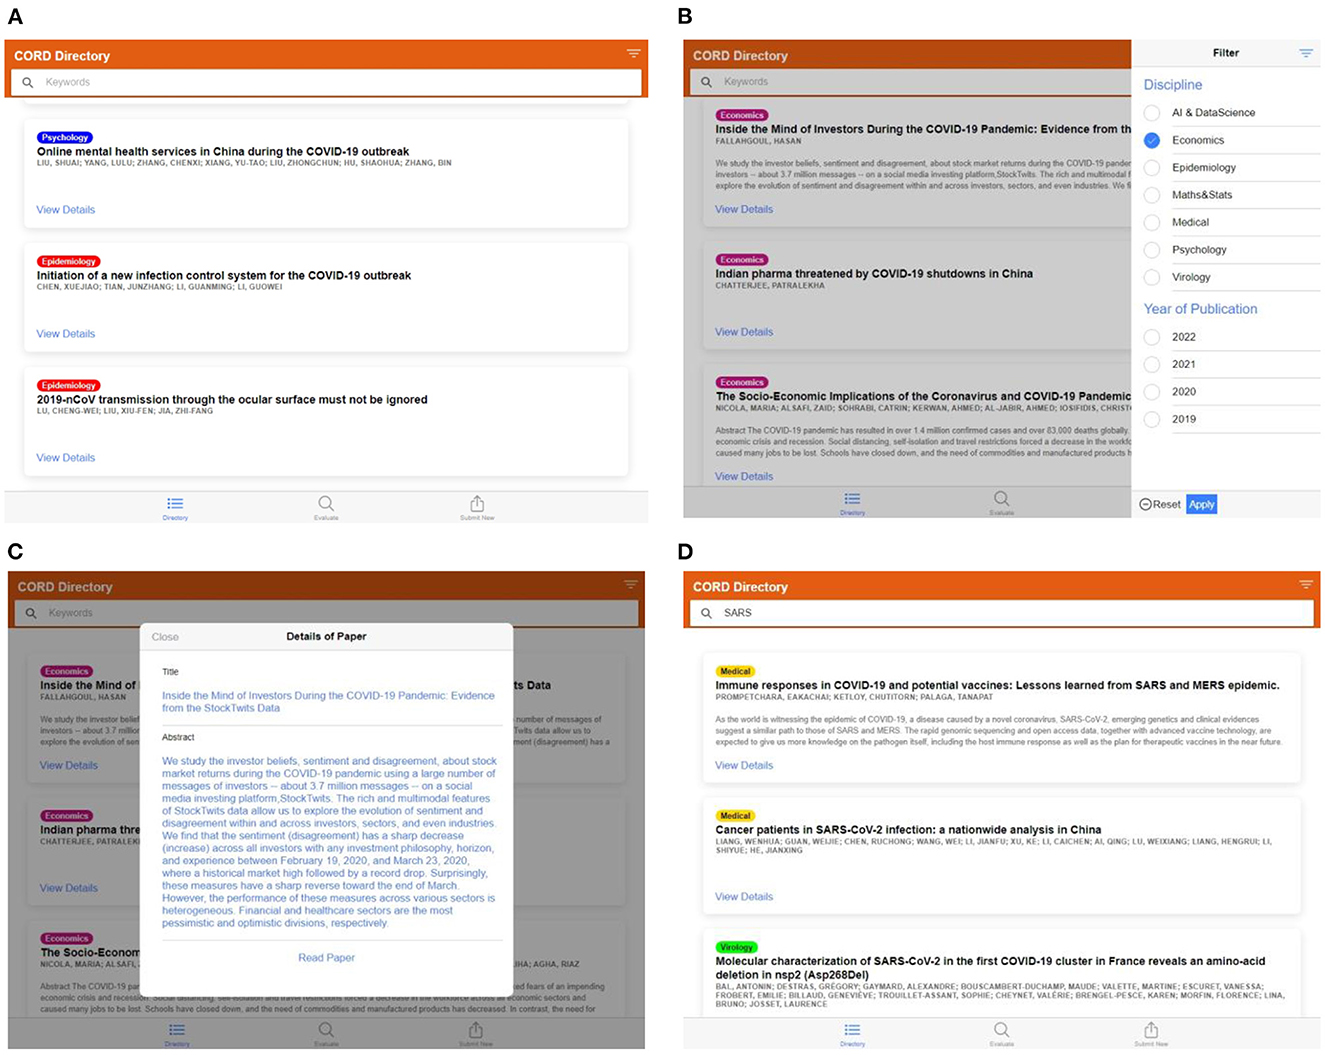
Figure 10. (A) Screen capture of the “Directory” tab—list of labeled articles in the database, (B) filter panel on the left side to select the articles of the particular category, (C) details of the listed articles, read paper tab will redirect to the original article page through DOI, (D) keyword tab can be used to search the article from the labeled dataset.
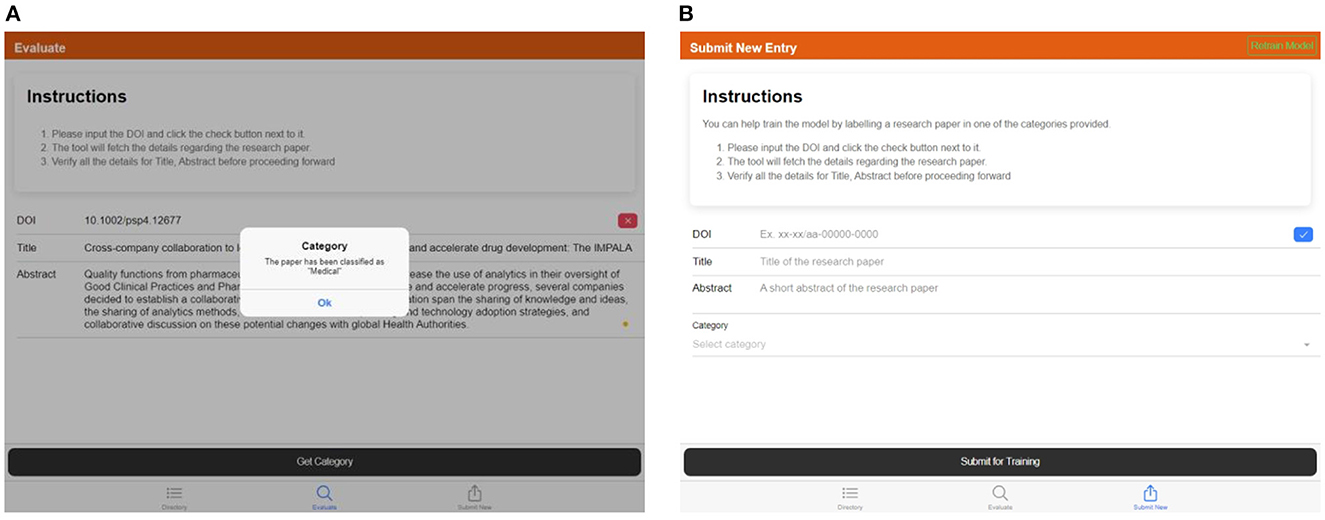
Figure 11. (A) Screen capture of the “Evaluate” tab—popup showing the category of the provided DOI, (B) screen capture of the “Submit New Entry” tab—details of the article can be provided by manually feeding the DOI, title, abstract, and the relevant category.
The user interface requests DOI to enable CrossRef API to get details regarding the research paper, such as the title and abstract.
4. Conclusion and future scope
This work primarily intends to communicate the idea of developing a Research Support Tool for researchers around the world. The conclusive statements can be drawn from this study as shown below:
• The researchers can leverage this tool to delve deeper into COVID-19 research and make the relevant literature identification smoother.
• A multi-platform graphical user interface is developed to fulfill the primary objectives of extracting the COVID-19 related articles effortlessly and classifying them based on the particular research area.
• The classification system uses the Bi-LSTM model, which enhances efficiency by feeding the input in both backward and forward directions. The results regarding the system's performance have been presented.
• The research support tool can further be extended for different research areas, and the classification model can also be trained on different datasets for other application areas.
• This article considers the abstract and title while training the model. In future, the conclusion and the related work part of the articles can also be included for increasing the better exploration.
Data availability statement
The original contributions presented in the study are included in the article/supplementary material, further inquiries can be directed to the corresponding authors.
Author contributions
KB: interpretation and acquisition of data. AT: development of model architecture and user interface. MP, SS, and VS: conception of ideas and formulation and development of designing concepts. All authors contributed to the article and approved the submitted version.
Funding
This publication was realized with support of the Operational Program Integrated Infrastructure in frame of the project: Intelligent technologies for protection of health-care personnel in the front line and operation of medical facilities during spreading of disease COVID-19, code ITMS2014+: 313011ATQ5 and co-financed by the Europe Regional Development Found.
Conflict of interest
The authors declare that the research was conducted in the absence of any commercial or financial relationships that could be construed as a potential conflict of interest.
Publisher's note
All claims expressed in this article are solely those of the authors and do not necessarily represent those of their affiliated organizations, or those of the publisher, the editors and the reviewers. Any product that may be evaluated in this article, or claim that may be made by its manufacturer, is not guaranteed or endorsed by the publisher.
References
1. Simon C, Davidsen K, Hansen C, Seymour E, Barnkob MB, Olsen LR, et al. BioReader: a text mining tool for performing classification of biomedical literature. BMC Bioinformatics. (2019) 19:165–70. doi: 10.1186/s12859-019-2607-x
2. Aggarwal T, Salatino A, Osborne F, Motta E. R-classify: extracting research papers' relevant concepts from a controlled vocabulary. Softw Impacts. (2022) 14:100444. doi: 10.1016/j.simpa.2022.100444
3. Doty C, Gallagher S, Cui W, Chen W, Bhushan S, Oostrom M, et al. Design of a graphical user interface for few-shot machine learning classification of electron microscopy data. Comput Mater Sci. (2022) 203:111121. doi: 10.1016/j.commatsci.2021.111121
4. Wang LL, Lo K, Chandrasekhar Y, Reas R, Yang J, Eide D, et al. Cord-19: the COVID-19 open research dataset. arXiv. (2020). doi: 10.48550/arXiv.2004.10706
5. COVID-19, Open Research Dataset Challenge (CORD-19),. Kaggle. Available online at: https://www.kaggle.com/datasets/allen-institute-for-ai/CORD-19-research-challenge (accessed December 15, 2022).
6. CORD-19:, COVID-19 Open Research Dataset,. Allen Institute for AI. Available online at: https://allenai.org/data/cord-19 (accessed December 15, 2022).
7. Yan L, Zhang H, Goncalves J, Xiao Y, Wang M, Guo Y, et al. A machine learning-based model for survival prediction in patients with severe COVID-19 infection. MedRxiv. (2020). doi: 10.1101/2020.02.27.20028027
8. Randhawa GS, Soltysiak MPM, El Roz H, de Souza CPE, Hill KA, Kari L, et al. Machine learning using intrinsic genomic signatures for rapid classification of novel pathogens: COVID-19 case study. PLoS ONE. (2020) 15:e0232391. doi: 10.1371/journal.pone.0232391
9. Song Y, Zheng S, Li L, Zhang X, Zhang X, Huang Z, et al. Deep learning enables accurate diagnosis of novel coronavirus (COVID-19) with CT images. IEEE/ACM Trans Comput Biol Bioinform. (2021) 18:2775–80. doi: 10.1109/TCBB.2021.3065361
10. Wang S, Kang B, Ma J, Zeng X, Xiao M, Guo J, et al. A deep learning algorithm using CT images to screen for Corona virus disease (COVID-19). Eur Radiol. (2021) 31:6096. doi: 10.1007/s00330-021-07715-1
11. Yu J. Open access institutional and news media tweet dataset for COVID-19 social science research. ArXiv [preprint] arXiv:2004.01791 (2020).
12. Medford RJ, Saleh SN, Sumarsono A, Perl TM, Lehmann CU. An Infodemic Leveraging High-Volume Twitter Data to Understand Public Sentiment for the COVID-19 Outbreak. Oxford: Oxford University Press. (2020). doi: 10.1101/2020.04.03.20052936
13. Callaghan S. COVID-19 is a data science issue. Patterns. (2020) 1:100022. doi: 10.1016/j.patter.2020.100022
14. Thelwall M, Thelwall S. A thematic analysis of highly retweeted early COVID-19 tweets: consensus, information, dissent, and lockdown life. ASLIB J Inform Manage. (2020) 72:945–62. doi: 10.1108/AJIM-05-2020-0134
15. Baïna K. Leveraging data preparation, HBase NoSQL storage, and HiveQL querying for COVID-19 big data analytics projects version 1. arXiv:2004.00253. (2020). doi: 10.48550/arXiv.2004.00253
16. Tanne JH. COVID-19: trump proposes tax cuts and improved health insurance, but millions are not covered. BMJ. (2020) 993:10–1. doi: 10.1136/bmj.m993
17. Kristoufek L. Grandpa, grandpa, tell me the one about bitcoin being a safe haven : new evidence from the COVID-19 pandemic. Front Phys. (2020) 8:296. doi: 10.3389/fphy.2020.00296
18. Chatterjee P. Indian pharma threatened by COVID-19 shutdowns in China. Lancet. (2019) 395:675. doi: 10.1016/S0140-6736(20)30459-1
19. Stephany F, Neuhäuser L, Stoehr N, Darius P, Teutloff O, Braesemann F, et al. The CoRisk-Index: a data-mining approach to identify industry-specific risk perceptions related to COVID-19. Human Soc Sci Commun. (2022) 9:1–5. doi: 10.1057/s41599-022-01039-1
20. Inoue H, Todo Y. The propagation of the economic impact through supply chains: the case of a mega-city lockdown against the spread of COVID-19. SSRN Electron J. (2020) 1–11. doi: 10.2139/ssrn.3564898
21. Zhang R, Liu H, Li F, Zhang B, Liu Q, Li X, et al. Transmission and epidemiological characteristics of Severe Acute Respiratory Syndrome Coronavirus 2 (SARS-CoV-2) infected pneumonia (COVID-19): preliminary evidence obtained in comparison with 2003-SARS. MedRxiv. (2020). doi: 10.1101/2020.01.30.20019836
22. Cho HW. Effectiveness for the response to COVID-19: the MERS outbreak containment procedures. Osong Public Health Res Perspect. (2020) 11:1–2. doi: 10.24171/j.phrp.2020.11.1.01
23. Bobdey S, Ray S. Going viral-COVID-19 impact assessment: a perspective beyond clinical practice. J Mar Med Soc. (2020) 22:9. doi: 10.4103/jmms.jmms_12_20
24. Liu Y, Gayle AA, Wilder-Smith A, Rocklöv J. The reproductive number of COVID-19 is higher compared to SARS coronavirus. J Travel Med. (2020) 1:1–4. doi: 10.1093/jtm/taaa021
25. Wu Y, Chen C, Chan Y. The outbreak of COVID-19: an overview. J Chin Med Assoc. (2020) 83:217–20. doi: 10.1097/JCMA.0000000000000270
26. Li R, Lu W, Yang X, Feng P, Muqimova O, Chen X, et al. Prediction of the epidemic of COVID-19 based on quarantined surveillance in China. medrxiv. [Preprint]. (2020). doi: 10.1101/2020.02.27.20027169
27. Odendaal WG. A method to model outbreaks of new infectious diseases with pandemic potential such as COVID-19. medRxiv. (2020). doi: 10.1101/2020.03.11.20034512
28. Anastassopoulou C, Russo L, Tsakris A, Siettos C. Data based analysis, modelling and forecasting of the COVID-19 outbreak. PLoS ONE. (2020) 15:e0230405. doi: 10.1371/journal.pone.0230405
29. Kucharski AJ, Russell TW, Diamond C, Liu Y, Edmunds J, Funk S, et al. Early dynamics of transmission and control of COVID-19: a mathematical modelling study. Lancet Infect Dis. (2020) 20:553–8. doi: 10.1016/S1473-3099(20)30144-4
30. Liu Z, Magal P, Seydi O, Webb G. Understanding unreported cases in the COVID-19 epidemic outbreak in Wuhan, China, and the importance of major public health interventions. Biology. (2020) 9:50. doi: 10.3390/biology9030050
31. Shi F, Yu Q, Huang W, Tan C. 2019 novel coronavirus (COVID-19) pneumonia with hemoptysis as the initial symptom: CT and clinical features. Korean J Radiol. (2020) 21:537. doi: 10.3348/kjr.2020.0181
32. Sun Q, Xu X, Xie J, Li J, Huang X. Evolution of computed tomography manifestations in five patients who recovered from coronavirus disease 2019 (COVID-19) pneumonia. Kor J Radiol. (2020) 21:614. doi: 10.3348/kjr.2020.0157
33. Prompetchara E, Ketloy C, Palaga T. Immune responses in COVID-19 and potential vaccines: lessons learned from SARS and MERS epidemic. Asian Pac J Allergy Immunol. (2020) 38:1–9. doi: 10.12932/AP-200220-0772
34. Pua U, Wong D. What is needed to make interventional radiology ready for COVID-19? Lessons from SARS-CoV epidemic. Korean J Radiol. (2020) 21:629. doi: 10.3348/kjr.2020.0163
35. Huang Y, Zhao N. Generalized anxiety disorder, depressive symptoms and sleep quality during COVID-19 outbreak in China : a web-based cross-sectional survey. Psychiatry Res. (2020) 288:112954. doi: 10.1016/j.psychres.2020.112954
36. Xiao C. A novel approach of consultation on 2019 novel coronavirus (COVID-19)-related psychological and mental problems: structured letter therapy. Psychiatry Investig. (2020) 17:175–6. doi: 10.30773/pi.2020.0047
37. Liu S, Yang L, Zhang C, Xiang YT, Liu Z, Hu S, et al. Online mental health services in China during the COVID-19 outbreak. Lancet Psychiatry. (2020) 7:e17–8. doi: 10.1016/S2215-0366(20)30077-8
38. Liu CY, Yang YZ, Zhang XM, Xu X, Dou QL, Zhang WW, et al. The prevalence and influencing factors in anxiety in medical workers fighting COVID-19 in China: a cross-sectional survey. Epidemiol Infect. (2020) 148. doi: 10.1017/S0950268820001107
39. Li Z, Ge J, Yang M, Feng J, Qiao M, Jiang R, et al. Vicarious traumatization in the general public, members, and non-members of medical teams aiding in COVID-19 control. Brain Behav Immun. (2020) 88:916–9. doi: 10.1016/j.bbi.2020.03.007
40. Herst CV, Burkholz S, Sidney J, Sette A, Harris PE, Massey S, et al. An effective CTL peptide vaccine for Ebola Zaire based on survivors' CD8+ targeting of a particular nucleocapsid protein epitope with potential implications for COVID-19 vaccine design. Vaccine. (2020) 38:4464–75. doi: 10.1016/j.vaccine.2020.04.034
41. Li Q, Ding X, Xia G, Geng Z, Chen F, Wang L, et al. A simple laboratory parameter facilitates early identification of COVID-19 patients. MedRxiv. (2020). doi: 10.1101/2020.02.13.20022830
42. Goh GKM, Dunker AK, Foster JA, Uversky VN. Rigidity of the outer shell predicted by a protein intrinsic disorder model sheds light on the COVID-19 (Wuhan-2019-nCoV) infectivity. Biomolecules. (2020) 10:331. doi: 10.3390/biom10020331
43. Graves A, Schmidhuber J. Framewise phoneme classification with bidirectional LSTM networks. In: Proceedings. 2005 IEEE International Joint Conference on Neural Networks. IEEE (2005).
44. Yadav SP, Zaidi S, Mishra A, Yadav V. Survey on machine learning in speech emotion recognition and vision systems using a recurrent neural network (RNN). Arch Comput Methods Eng. (2022) 29:1753–70. doi: 10.1007/s11831-021-09647-x
45. Ackerson JM, Dave R, Seliya N. Applications of recurrent neural network for biometric authentication and anomaly detection. Information. (2021) 12:272. doi: 10.3390/info12070272
46. Dixon M, London J. Financial forecasting with α-rnns: a time series modeling approach. Front Appl Math Stat. (2021) 6:551138. doi: 10.3389/fams.2020.551138
Keywords: COVID-19, long short-term memory, classification, bi-directional LSTM, Artificial Intelligence
Citation: Tiwari A, Bhattacharjee K, Pant M, Srivastava S and Snasel V (2023) An AI-enabled research support tool for the classification system of COVID-19. Front. Public Health 11:1124998. doi: 10.3389/fpubh.2023.1124998
Received: 15 December 2022; Accepted: 10 February 2023;
Published: 03 March 2023.
Edited by:
Steven Fernandes, Creighton University, United StatesReviewed by:
Akriti Nigam, Birla Institute of Technology, Mesra, IndiaFnu Bilal, University of Texas Southwestern Medical Center, United States
Nidhi Arora, University of Delhi, India
Neetu Kushwaha, The Alan Turing Institute, United Kingdom
Copyright © 2023 Tiwari, Bhattacharjee, Pant, Srivastava and Snasel. This is an open-access article distributed under the terms of the Creative Commons Attribution License (CC BY). The use, distribution or reproduction in other forums is permitted, provided the original author(s) and the copyright owner(s) are credited and that the original publication in this journal is cited, in accordance with accepted academic practice. No use, distribution or reproduction is permitted which does not comply with these terms.
*Correspondence: Arti Tiwari, YXRpd2FyaTFAYXMuaWl0ci5hYy5pbg==; Kamanasish Bhattacharjee, a2IwMjBzYXlhbkBnbWFpbC5jb20=; Millie Pant, cGFudC5taWxsaUBhcy5paXRyLmFjLmlu