 Jing Shen
 Junjie Wang
 Fan Yang
 Ruopeng An
- 1Department of Physical Education, China University of Geosciences (Beijing), Beijing, China
- 2School of Kinesiology and Health Promotion, Dalian University of Technology, Dalian, Liaoning, China
- 3School of Public Administration, Dongbei University of Finance and Economics, Dalian, Liaoning, China
- 4Brown School, Washington University, St. Louis, MO, United States
Background: As a primary source of added sugars in the US diet, sugar-sweetened beverage (SSB) consumption is presumed to contribute to obesity prevalence and poor oral health. We systematically synthesized and quantified evidence from US-based natural experiments concerning the impact of SSB taxes on beverage prices, sales, purchases, and consumption.
Methods: A keyword and reference search was performed in PubMed, Web of Science, Cochrane Library, Scopus, and EconLit from the inception of an electronic bibliographic database to Oct 31, 2022. Meta-analysis was conducted to estimate the pooled effect of soda taxes on SSB consumption, prices, passthrough rate, and purchases.
Results: Twenty-six natural experiments, all adopting a difference-in-differences approach, were included. Studies assessed soda taxes in Berkeley, Oakland, and San Francisco in California, Philadelphia in Pennsylvania, Boulder in Colorado, Seattle in Washington, and Cook County in Illinois. Tax rates ranged from 1 to 2 ¢/oz. The imposition of the soda tax was associated with a 1.06 ¢/oz. (95% confidence interval [CI] = 0.90, 1.22) increase in SSB prices and a 27.3% (95% CI = 19.3, 35.4%) decrease in SSB purchases. The soda tax passthrough rate was 79.7% (95% CI = 65.8, 93.6%). A 1 ¢/oz. increase in soda tax rate was associated with increased prices of SSBs by 0.84 ¢/oz (95% CI = 0.33, 1.35).
Conclusion: Soda taxes could be effective policy leverage to nudge people toward purchasing and consuming fewer SSBs. Future research should examine evidence-based classifications of SSBs, targeted use of revenues generated by taxes to reduce health and income disparities, and the feasibility of redesigning the soda tax to improve efficiency.
1. Introduction
Sugar-sweetened beverages (SSBs) are beverages sweetened with various forms of added sugars, including brown sugar, corn syrup, glucose, lactose, and sucrose (1). In the United States, SSB consumption is prevalent, with six in ten youths and five in ten adults consuming SSBs on any given day during the period of 2011–2014 (2, 3). This consumption amounts to over 140 kcal from SSBs per day for both youth and adults (2, 3). Extensive epidemiologic studies have consistently documented that SSB consumption, as a primary source of added sugars in the US diet, is a significant contributor to the prevalence of obesity, cardiometabolic diseases, and oral health risk (4–6). These associations have also been observed globally (7, 8).
Recent policy interventions aimed at combating obesity have utilized economic incentives to “nudge” (i.e., promote or encourage) people toward a healthier diet choice (9–11). For example, healthy food subsidies promote fruit and vegetable intake, while excise taxes aim to discourage the consumption of less desirable foods and beverages. Excise taxes, such as soda taxes, are implemented in countries like the US, France, New Zealand, Netherlands, and South Africa (12). A soda tax is a specific excise tax charged on the sale of SSBs to reduce consumption (13). Merchants pay the tax, which is then passed on to consumers through higher prices. The amount of the tax varies across different regions, as it is applied by both state and federal governments.
Preliminary evidence suggests that soda taxes are associated with weight loss, reduced body mass index (BMI), and decreased risks of overweight and obesity (14, 15). Additionally, soda taxes can help address dental health issues and reduce the prevalence of tooth decay (16). Berkeley, California, became the first city in the US to implement a soda tax, which imposed a 1 ¢/oz. tax on the distributors of specific SSBs, including soda and sports/energy drinks (17). This tax took effective on January 1, 2015 (17). Following Berkeley’s example, several other cities, such as Philadelphia, Pennsylvania (1.5 ¢/oz.; 1/1/2017), Albany, California (1 ¢/oz.; 4/1/2017), Oakland, California (1 ¢/oz.; 7/1/2017), Boulder, Colorado (2 ¢/oz.; 7/1/2017), Cook County, Illinois (1 ¢/oz.; 8/2/2017), San Francisco, California (1 ¢/oz.; 1/1/2018), and Seattle, Washington (1.75 ¢/oz.; 1/1/2018), have also implemented soda taxes (18).
Existing research on the effect of soda taxes in the US can be categorized into three groups: “proxy,” “modeling,” and “local” studies. The “proxy” studies have used state sales tax on soda, candy, and other qualified groceries as a substitute for a soda tax due to the absence of soda taxes or related data (19–24). However, using such a “proxy” can be problematic because a soda tax, as an excise tax, is fundamentally different from a state general or selective sales tax applied as a percentage of the purchase price (24). The “modeling” studies have employed systems science models to simulate the effect of a soda tax using pre-specified parameter values and statistical distributions (25–34). However, these studies differ from other categories of research in that they are prospective in nature. They aim to identify potential effects of policies that have yet to be enacted and, by necessity, make assumptions about possible retailer and consumer responses. Although the “modeling” studies compare simulated counterfactuals to status quo baselines, they do not provide direct causal inference due to their non-experimental study design. The “local” studies, on the other hand, have utilized quasi-experimental methods to compared soda prices, sales, purchases, or consumption between cities that have implemented a soda tax and neighboring cities without such a tax, or before and after the implementation of a soda tax in a city. Unlike “proxy” or “modeling” studies, the “local” studies directly estimated the impact of soda tax using temporal and geographical variations in tax implementation (35–52). Thus, these “local” studies serve as natural experiments that provide valuable causal inference. Powell et al. conducted a review of seven local SSB tax implementations and reported an average tax pass-through rate of 70% (53). Another review by Powell et al. found that the demand for SSBs declined by 20%, with an estimated price elasticity of demand of −1.5 following the implementation of soda taxes (54).
This study aims to systematically synthesize and quantify the impacts of soda taxes on beverage prices, sales, purchases, and consumption in the US. By exclusively relying on natural experiments (i.e., “local” studies), our review provides robust causal inferences regarding the effectiveness of soda taxes. Moreover, our approach goes beyond a narrative review by providing quantitative estimates of the magnitude of the tax effect. The findings of this study can inform local, state, and federal policymakers in designing or revising soda tax-related legislation and implementation strategies to effectively combat obesity.
2. Methods
The present study was conducted following the Preferred Reporting Items for Systematic Reviews and Meta-Analyses (55).
2.1. Eligibility criteria
Studies meeting all of the following criteria were eligible for the review: (1) Participants: consumers, stores, or beverage items within US taxing jurisdictions that implemented a soda tax; (2) Interventions: soda tax (SSB excise tax); (3) Comparisons: consumers, stores, or beverage items within and outside the US taxing jurisdictions that implemented a soda tax; (4) Outcomes: beverage prices, sales, purchases, and consumption; (5) Study design: natural experiment; (6) Article type: peer-reviewed original study; (7) Time window of search: from the inception of an electronic bibliographic database to Oct 31, 2022; and (8) Language: English.
2.2. Search strategy
A keyword search was performed in five electronic bibliographic databases: PubMed, Web of Science, Cochrane Library, Scopus, and EconLit. The search algorithm included all keywords from two groups: (1) “tax,” “taxes,” “taxation,” “taxed,” “taxing,” “pre-taxation,” “post-taxation,” “pre-tax,” “post-tax,” “excise,” or “excises”; and (2) “beverage,” “beverages,” “drink,” “drinks,” “soda,” “sodas,” “cola,” “coke,” “SSB,” or “SSBs.” The search algorithm used in PubMed was reported in Appendix 1 (Supplementary material). Two co-authors independently screened the title and abstract and identified potentially pertinent articles for the full-text review (Cohen’s kappa κ = 0.85).
2.3. Meta-analysis
Meta-analyses were performed to estimate the pooled effects, represented as mean differences, of soda taxes in the US. The six outcomes included: (1) change in prices of taxed beverages (i.e., SSBs); (2) change in prices of untaxed beverages; (3) change in purchases of taxed beverages; (4) change in purchases of untaxed beverages; (5) change in the consumption of taxed beverages; and (6) tax passthrough rate. Out of the 40 studies, 13 were excluded from the meta-analyses due to: (1) non-overlapping outcome measures (36, 40, 44, 56–63), or (2) neither standard error nor confidence interval (CI) reported (35, 43). To assess heterogeneity among the included studies, we employed the I2 index, which allows us to quantify the degree of variability between study estimates (64). The I2 index was interpreted as modest (I2 ≤ 25%), moderate (25% < I2 ≤ 50%), substantial (50% < I2 ≤ 75%), or considerable (I2 > 75%) (65). Based on the level of heterogeneity observed, we estimated the meta-analyses using either a fixed-effect (FE) model or a random-effect (RE) model. The FE model was utilized when modest or moderate heterogeneity was present, while the RE model was employed when substantial or considerable heterogeneity was observed. To assess publication bias, we conducted Begg’s and Egger’s tests. These tests allow us to evaluate potential bias in the included studies (66). Additionally, we performed random-effect meta-regressions to assess the dose–response effect of alternative soda tax rates on the various outcomes. Meta-analyses were performed using Stata 16.1 MP version. We employed these methods to synthesize the available evidence and provide quantitative estimates of the pooled effects of soda taxes on the specified outcomes.
2.4. Study quality assessment
Following Littell et al. (65) and An et al. (67), we designed a study quality assessment tool that rated each study based on ten criteria (Table 5). For each criterion, a score of 1 is assigned if the answer is “yes”; otherwise, a score of 0 is assigned if the answer is “no,” “not applicable” or “not reported.” We sum the scores of all ten criteria for a total study-specific score, ranging from 0 to 10. The study quality score was not used as a criterion for inclusion of a study, but as a measure of the strength of the scientific evidence.
3. Results
3.1. Study selection
Figure 1 shows the study selection flow diagram. We identified 4,574 articles through the keyword and reference search. After removing duplicates, 3,655 articles underwent title and abstract screening, in which 3,562 articles were excluded. The remaining 93 articles were reviewed of full texts against the eligibility criteria. Of these, 53 articles were excluded, including 12 “modeling” studies, 14 “proxy” studies, 17 studies that did not examine soda taxes, six commentaries, and four non-US-based studies. The remaining 40 studies that examined the impact of soda taxes on beverage prices, sales, purchases, and consumption in the US were included in the review (35–52, 56–63, 68–81).
Figure 1. Study selection flow diagram (PRISMA).
3.2. Characteristics of the included studies
Table 1 reports the characteristics of soda taxes assessed in the included studies. All 40 studies were conducted in or after 2015. Fourteen examined soda tax in Philadelphia, Pennsylvania (35, 39, 40, 43, 49, 50, 52, 57, 58, 60, 68, 69, 76, 81); eight in Berkeley, California (36, 37, 44–47, 51, 56); six in Oakland, California (42, 61, 72, 77, 78, 80); three each in Cook County, Illinois (73–75), and Seattle, Washington (48, 71, 79); two in Boulder, Colorado (38, 59); one each in two cities—Oakland and San Francisco (70), Berkeley and Washington State (62); one in six cities—Philadelphia, Berkeley, Seattle, Boulder, Cook County, and Oakland (63); and the remaining one in four cities—Philadelphia, San Francisco, Seattle, and Oakland (41). The tax rate ranged from 1 to 2 ¢/oz., with a mean of 1.321 ¢/oz. among the seven cities under investigation.
Table 1. Characteristics of soda taxes assessed in the studies included in the review.
To account for cross-border estimation across studies within the same jurisdiction, we employed a variety of methods to explain the variation in findings. These methods included considering differences in sample size, sample characteristics, statistical approaches, and outcome measures. By examining these factors, we aimed to provide insights into the varying effects observed within jurisdictions. Table 2 reports sample characteristics, statistical approach, and outcome measures of the studies included in the review. Twenty-nine studies collected beverage pricing or sales data from various types of retailers (e.g., supermarkets, corner/convenience stores, restaurants, and grocery stores) (35–39, 43, 45, 48–51, 56, 59, 61–63, 68–75, 77–81), whereas the remaining 11 surveyed participants regarding their beverage purchases or consumption (40–42, 44, 46, 47, 52, 57, 58, 60, 76). All studies except one (73) adopted a difference-in-differences (DID) approach to estimate the impacts of soda taxes. DID is a quasi-experimental approach (82), which uses geographical and timing variations in soda tax implementation across US cities to estimate the causal impact of soda taxes on SSB prices, sales, purchases, and consumption. Twenty-eight studies assessed the effect of soda taxes on SSB or untaxed beverage prices (36–39, 42, 43, 45, 48–51, 59, 61–63, 68–73, 75–81). Twenty-two studies focused on beverage sales or purchases (35–37, 41, 42, 44, 48–51, 56, 57, 62, 63, 69, 73, 74, 76, 77, 79–81). Nine studies examined the frequency or quantity of beverage consumption (40, 42, 44, 46, 47, 51, 52, 58, 60). Data on beverage prices were collected mainly through three channels: hand-recoding of price tags during retailer visits (37–39, 42, 43, 45, 59, 61, 68–72, 76, 78), web-scraped data of beverage prices (38, 59), or point-of-sale electronic scanner data (36, 48–51, 59, 62, 63, 73, 75, 77, 79–81). Data on beverage sales were collected through two channels: retailers’ aggregate sales records (35, 42, 56) or point-of-sale electronic scanner data (36, 48–51, 62, 63, 73, 74, 77, 79–81). Data on beverage purchases were collected from surveyed participants (40, 41, 44, 57, 69, 76). Data on beverage consumption were collected through two methods: interviews using a food frequency questionnaire (40, 46, 60) or a 24-h dietary recall (42, 51, 58).
Table 2. Sample characteristics, sample size, and measures of the studies included in the review.
3.3. Study findings
Table 3 reports the estimated effects of soda taxes. Four key findings have emerged. First, soda taxes led to increased SSB prices in the taxing jurisdictions relative to the nontaxing jurisdictions. In Berkeley, a 1.0 ¢/oz. soda tax increased the price for taxed beverages by 0.65¢/oz. relative to non-Berkeley stores (51). Across all brands and sizes of SSBs, the overall price of taxed beverages increased by 0.43 ¢/oz. relative to neighboring cities (37). The price increase was 0.47 ¢/oz. for small-size SSBs (≤33.8 oz), 0.46 ¢/oz. for a 2-liter SSB bottle, and 0.49 ¢/oz. for a multipack of soda relative to that in neighboring cities (45). In other taxing jurisdictions implementing a 1.0 ¢/oz. soda tax, Falbe et al. documented that the average price of SSBs increased by 0.92 ¢/oz. (95%CI = 0.28, 1.56; p < 0.01) in Oakland 10 months post-tax and 1 ¢/oz. (95%CI = 0.35, 1.65; p < 0.01) in San Francisco 4 months post-tax in comparison to Richmond and San Jose (70). Studies reported that the taxed beverage prices increased by 0.49 ¢/oz. (77), and the regular soda price increased by 0.82 ¢/oz. (72) in Oakland relative to Sacramento one year post-tax. The taxed beverage prices increased by 0.67 ¢/oz. (80), and bottled regular soda prices increased by 1.44 ¢/oz. (78) in Oakland relative to Sacramento two year post-tax. Powell and Leider found that the taxed beverage prices increased by 1.13 ¢/oz. in Cook County relative to St. Louis (73). Powell et al. found the prices of all taxed beverage types increased by 1.19 ¢/oz. in Cook County relative to St. Louis (75). In Philadelphia, a 1.5 ¢/oz. soda tax raised prices by 1.58 ¢/oz. for all taxed beverages combined relative to comparison untaxed stores outside Philadelphia (39). Coary et al. found that SSB prices increased by 1.53 ¢/oz. relative to those outside the city (43). Seiler et al. reported that the soda tax passed through at a rate of 97%, leading to a price increase by 1.45 ¢/oz. relative to the surrounding area of Philadelphia (50). Bleich et al. reported that the relative price of taxed beverages increased by 1.81 ¢/oz. 1-year post-tax (69) and 2.06 ¢/oz. two-year post-tax (76) in Philadelphia compared to Baltimore, resulting in a tax passthrough rate of 120.4% (69) and 137% (76), respectively. Petimar et al. reported that taxed beverage prices increased by 1.02 ¢/oz., with 68% of the tax passed through to prices 2 years after tax implementation in Philadelphia compared to Baltimore (81). Cawley et al. reported that the price of taxed beverages increased by 0.83 ¢/oz. relative to untaxed beverages, and 55.3% of the tax was passed through to consumers at the Philadelphia International Airport (68). In Seattle, a 1.75 ¢/oz. soda tax raised prices of taxed beverages by 1.03 ¢/oz. relative to Portland, corresponding to a 59% tax passthrough rate (48). Jones-Smith et al. found that the soda tax was associated with a price increase of 1.58 ¢/oz. relative to its comparison area south of Seattle, and 90% of the tax was passed through to consumers (71).
Table 3. Estimated effects of a soda tax on price, consumption, purchases, or sales of beverages in the studies included in the review.
Second, soda taxes reduced SSB sales and purchases in the taxing jurisdictions relative to the nontaxing jurisdictions. SSB sales in Berkeley declined by 2.7% relative to neighboring cities (51). The total sales volume of taxed beverages decreased by 48.7% (49), or 38.9% (69) in Philadelphia relative to Baltimore following soda tax implementation. Similarly, the volume sold of taxed beverages decreased by 27% (74) or 25.7% (73) in Cook County relative to St. Louis. Sales volume of taxed SSBs reduced by 14% (77) or 18% (80) in Oakland compared to Sacramento. Taxed beverage volume sales decreased by 50% in Philadelphia relative to Baltimore two years post-tax (81). Taxed beverage sales fell by 22% in Seattle relative to Portland (79). Compared with the surrounding metropolitan area, sales quantity of taxed SSB fell by 10.6% in Berkeley, 14.4% in Oakland, 5.1% in Boulder, 8.3% in Philadelphia, 10.7% in Cook County, and 5.6% in Seattle, respectively (63). Concerning purchases, taxed beverage purchases declined by 6.1 fl oz., corresponding to a 42% decline in Philadelphia relative to Baltimore (76). An increase in the soda tax rate by 1 ¢/oz. decreased monthly household purchases of taxed beverages by 53.0 oz. or 12.2% (41). The average quantity of taxed beverages purchased per shopping trip decreased in Philadelphia and increased in neighboring cities, which resulted in a relative decrease of 8.5 oz. of SSBs purchased per shopping trip in Philadelphia (40).
Third, soda taxes reduced the consumption of SSBs in taxing jurisdictions relative to nontaxing jurisdictions. Consumption of SSBs was found to decrease by 25% in Berkeley relative to neighboring cities (46). Soda intake was reduced by 0.81 servings per week in Philadelphia compared with all other comparison cities two years after tax implementation (60). The odds of daily consumption of regular soda and energy drinks were 40 and 64% lower, respectively, in Philadelphia relative to the comparison cities two-month post-tax (52). Adults in Philadelphia were found to consume regular soda 10.4 fewer times per month after soda tax implementation, denoting a reduction of approximately 30% (40). People in Philadelphia were more likely to reduce their frequency of SSB consumption, and their monthly SSB consumption declined by 51.65 oz. compared to those residing in neighboring cities (58).
Fourth, the impact of soda taxes on SSB sales and purchases was compromised by cross-border shopping. Roberto et al. estimated that approximately a quarter of the decrease in the taxed beverage sales in Philadelphia could be offset by increases in sales in bordering areas (49). Seiler et al. estimated that cross-shopping to stores outside Philadelphia offset over half of the reduction in SSB sales in the city (50). Petimar et al. estimated that 30% of the reduction in taxed beverage sales in Philadelphia was offset by cross-border shopping (81). Leider et al. estimated that two-thirds of the overall decrease in the volume sold of taxed beverages in Oakland was offset by cross-border shopping (80). Léger and Powell estimated that 46% of Oakland’s taxed beverage sales decrease was offset by cross-border shopping (77). Powell and Leider reported that there was no significant change in taxed beverage sales in Seattle’s two-mile border area, suggesting there was no cross-border shopping for taxed beverages (79).
3.4. Meta-analysis
Table 4 summarizes the results from meta-analyses. Data from 27 studies contributed to the meta-analysis: 22 focused on the change in prices of taxed beverages and tax passthrough rate (37–39, 42, 45, 48–51, 68–73, 75–81), 11 on purchases of taxed beverages (41, 42, 48, 49, 69, 73, 74, 77, 79–81), three on the change in consumption of taxed beverages (46, 47, 52), 15 on the change in prices of untaxed beverages (38, 39, 42, 45, 49–51, 68, 71, 73, 75–78, 81), and five on the change in the purchases of untaxed beverages (48, 74, 77, 80, 81). Soda tax implementation was found to be associated with an increase in the prices of taxed beverages by 1.06 ¢/oz. (95% CI = 0.90, 1.22; I2 = 98.8%; RE), a reduction in the purchases of taxed beverages by 27.3% (95% CI = 19.3, 35.4%; I2 = 97.2%; RE). The soda tax passthrough rate was estimated to be 79.7% (95% CI = 65.8, 93.6%; I2 = 99.1%; RE). Following the soda tax implementation, the prices of untaxed beverages were estimated to increase by 0.08 ¢/oz. (95% CI = 0.04, 0.12; I2 = 77.3%; RE). No changes were observed for the purchases of untaxed beverages and the consumption of taxed beverages (p > 0.05). Meta-regression found that 1 ¢/oz. increase in the soda tax rate was associated with an increase in the prices of taxed beverages by 0.84 ¢/oz. (95% CI = 0.33, 1.35). No dose–response effect of soda taxes was found for purchases and consumption of taxed beverages or the tax passthrough rate (ps > 0.05). No publication bias was identified by Egger’s or Begg’s tests (ps > 0.05).
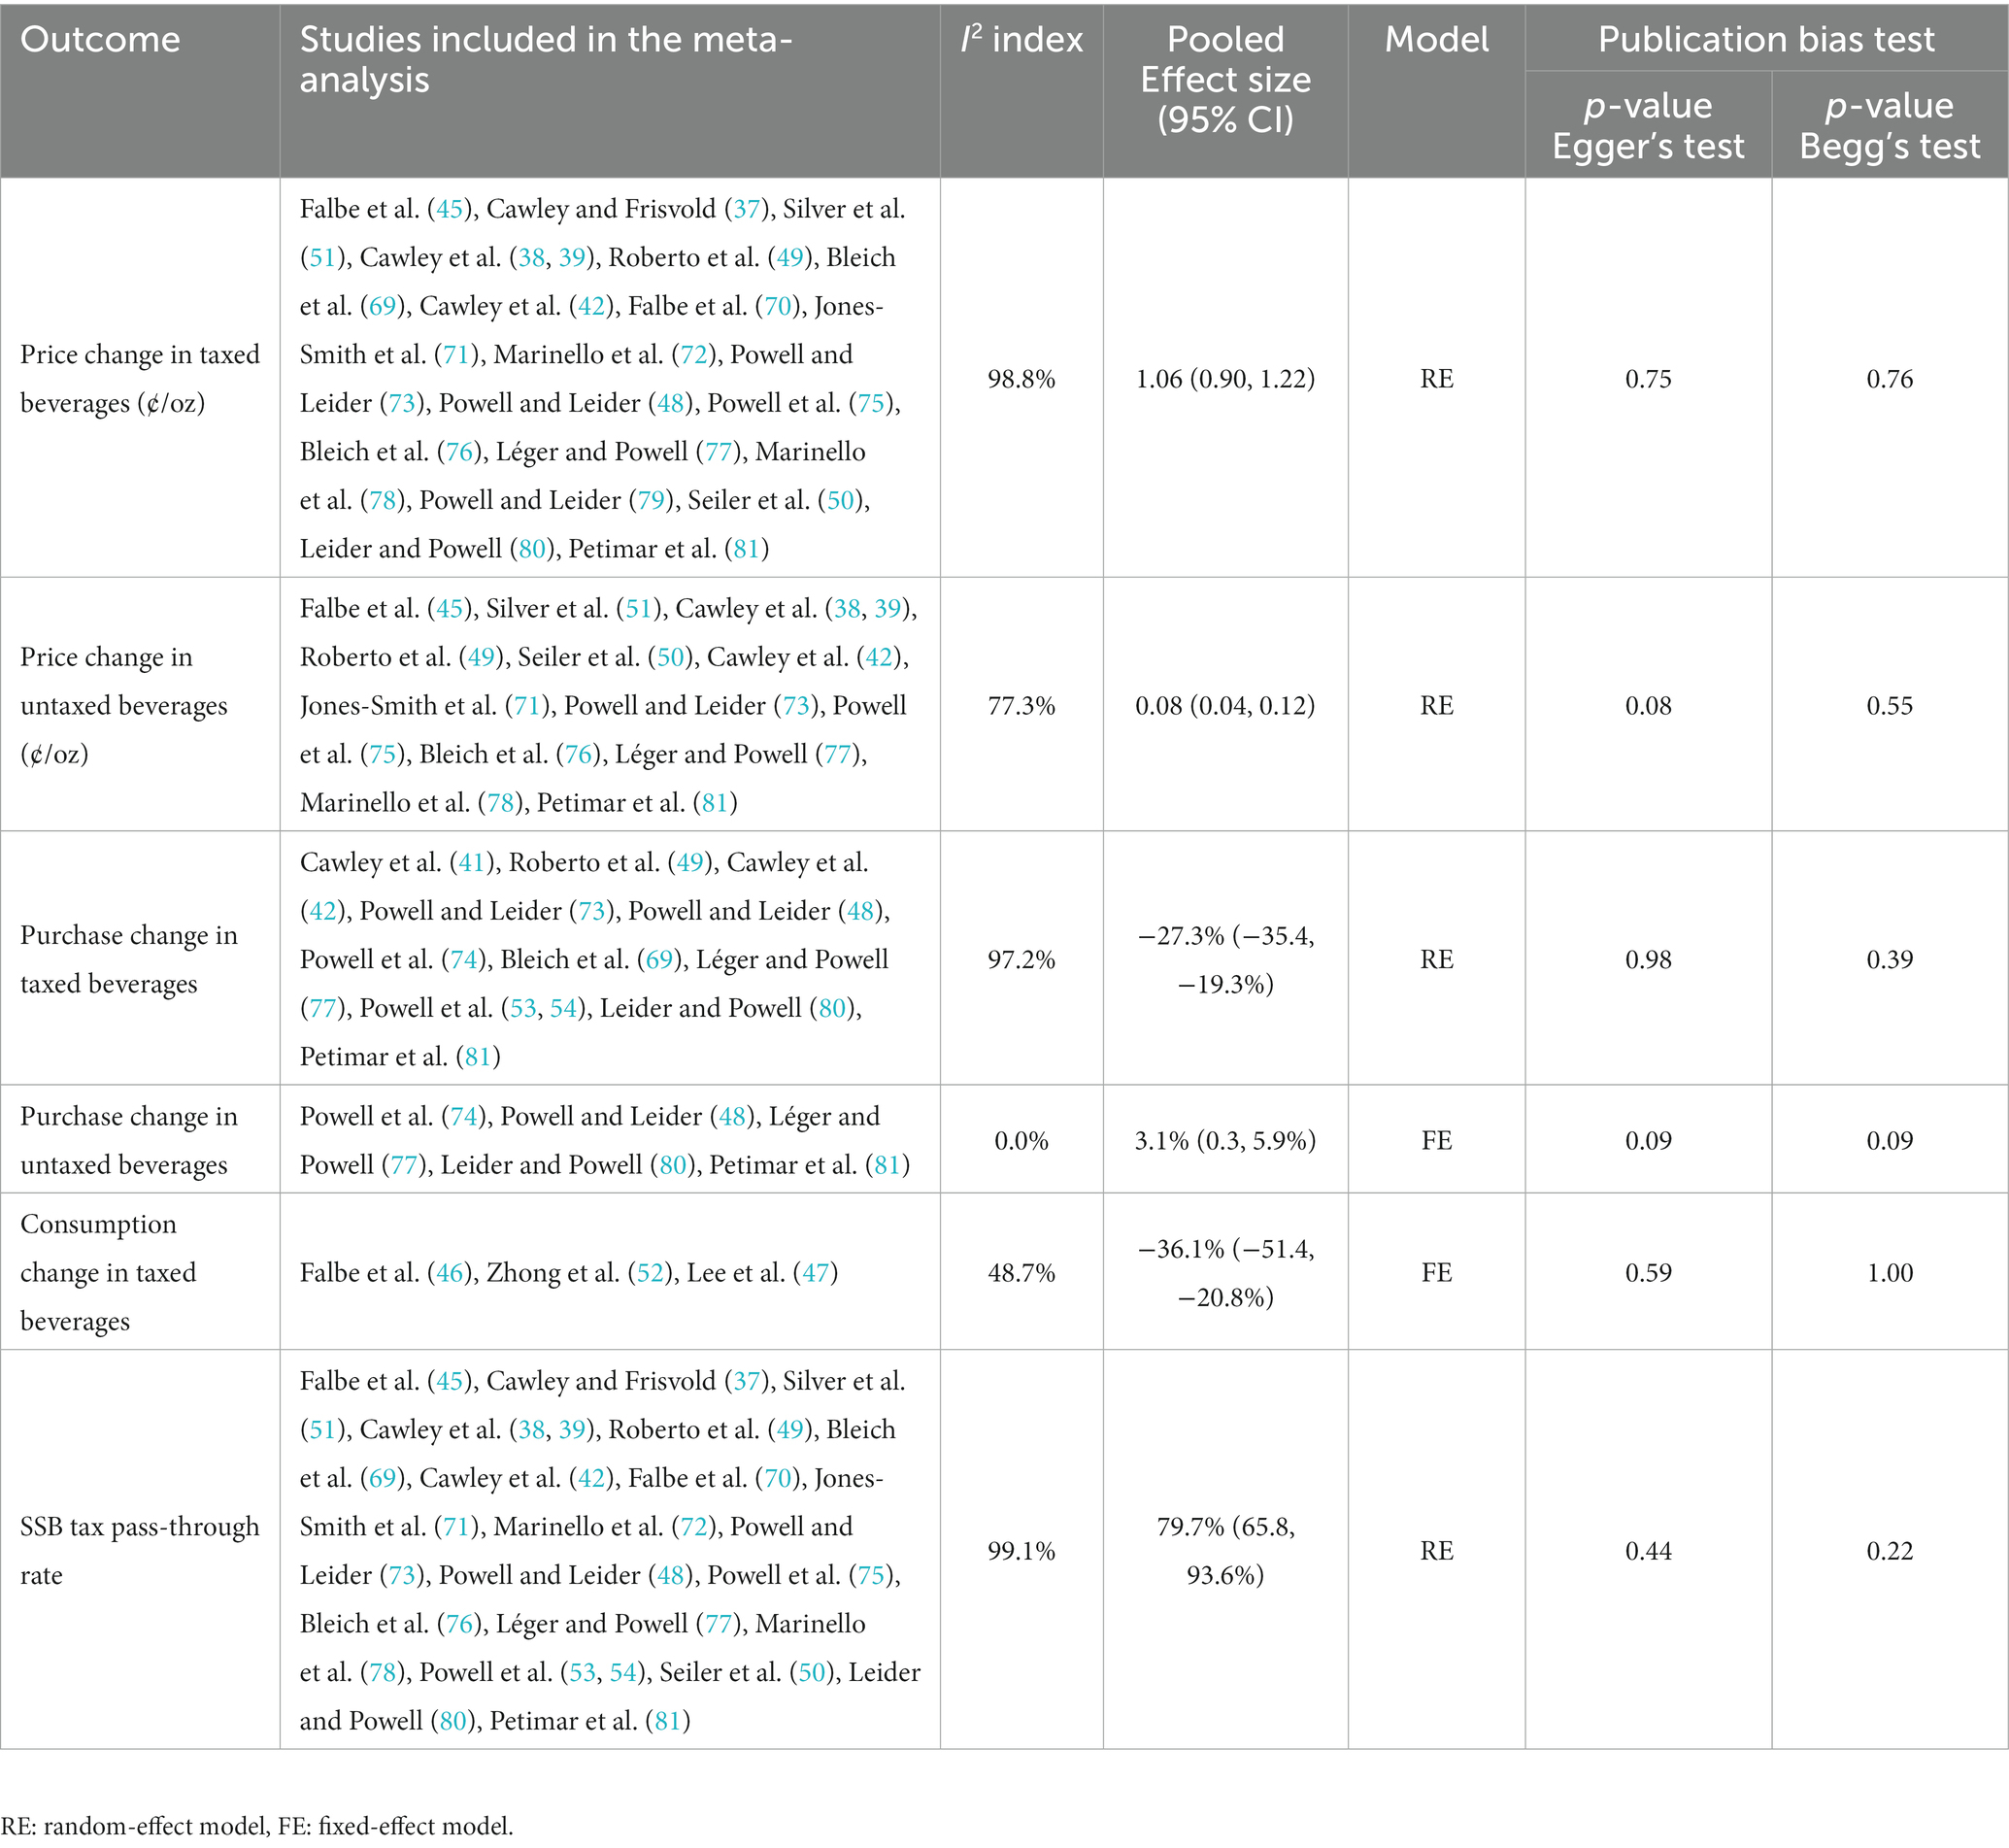
Table 4. Results from meta-analyses and publication bias tests.
3.5. Study quality assessment
Table 5 reports criterion-specific and overall ratings from the study quality assessment. The included studies, on average, scored six out of ten, with scores ranging from 3 to 9. All studies collected and analyzed both pre- and post-tax outcomes for the intervention group (i.e., retailers or consumers residing in the taxing jurisdiction) and included a control group (i.e., retailers or consumers living outside the taxing jurisdiction or beverages not subject to the soda tax). The majority of studies (n = 36) had comparable intervention and control groups. Additionally, most studies had a sample representative of the stores or the population residing in the taxing jurisdiction (n = 17) (35, 36, 38–42, 44, 45, 50, 51, 60, 70–72, 74, 75). Furthermore, most studies included the change in beverage prices (n = 28) (36–39, 42, 43, 45, 48–51, 59, 61–63, 68–73, 75–81), sales or purchases (n = 22) (35, 36, 40–42, 44, 48–51, 56, 57, 62, 63, 69, 73, 74, 76, 77, 79–81) and consumption (n = 11) as outcomes (36, 40, 42, 44, 46, 47, 50–52, 58, 60). Additionally, several studies assessed the impact of cross-border sales or purchases (n = 17) (36, 37, 39, 40, 42, 46, 48–50, 57, 62, 69, 74, 77, 79–81). However, we noted some limitations in the quality of the included studies. Only two studies provided a sample size justification (58, 62), and nine studies performed adequate statistical procedures to adjust for temporal trends of the outcomes (37, 44, 47, 49, 50, 52, 60, 73, 79). To enhance the rigor of future research in this area, we recommend that studies provide clear justifications for sample sizes and utilize appropriate statistical procedures to account for temporal trends. Additionally, researchers should aim to improve reporting practices, including the transparent reporting of study limitations and potential sources of bias.
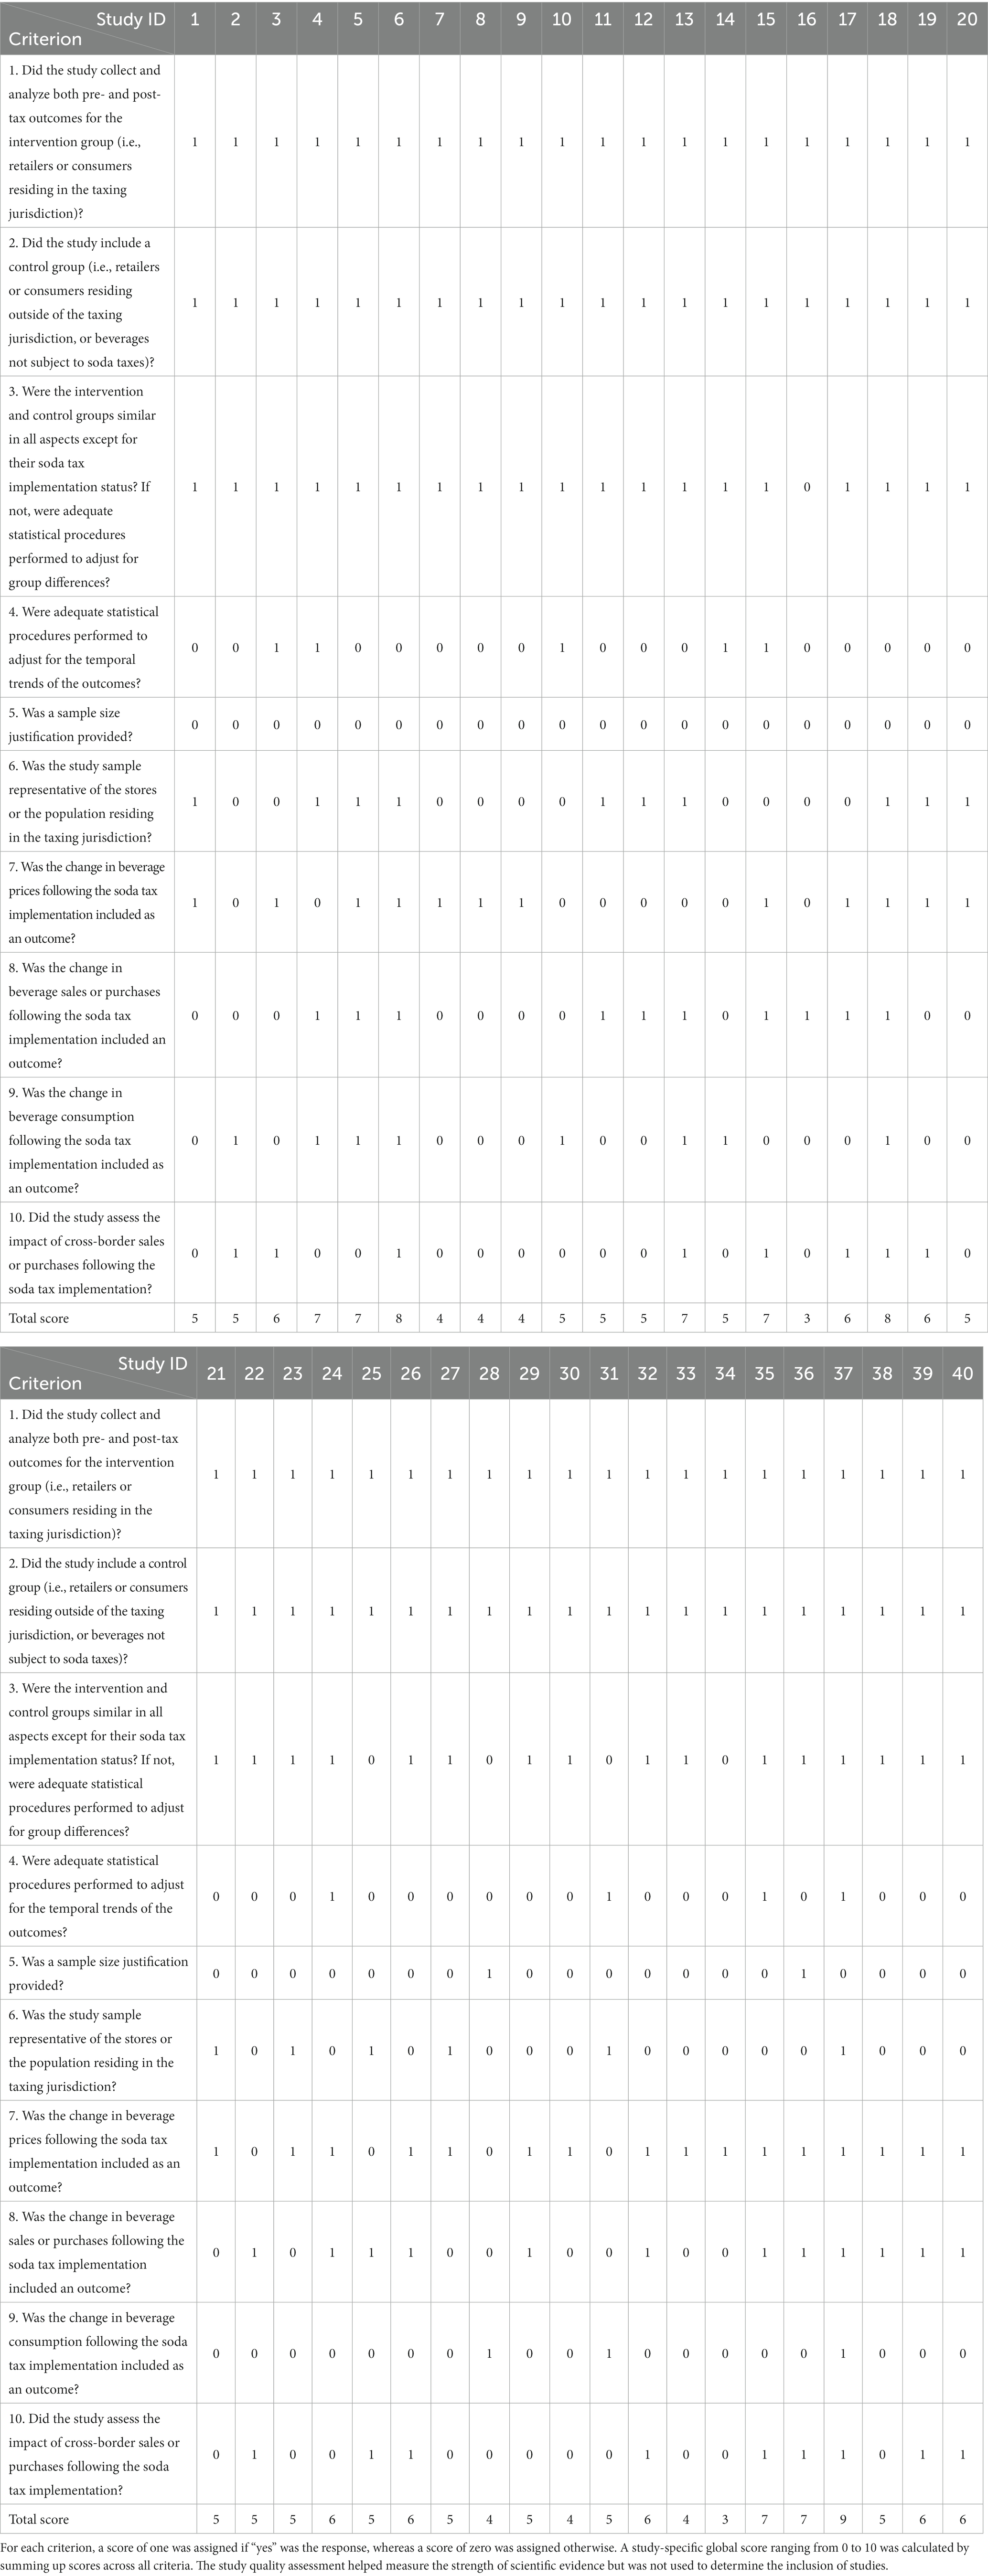
Table 5. Study quality assessment.
4. Discussion
A few previous meta-analyses estimated the effect of soda taxes or SSB prices on beverage sales, purchases, and consumption. Nakhimovsky et al. reviewed studies in middle-income countries and estimated that a 10% increase in SSB prices was associated with a reduction in SSB consumption from 1.2–9.3 kcal per person per day (83). Teng et al. estimated that a 10% soda tax was associated with a decline in SSB purchases and consumption by 10% (84). Escobar et al. (14) and Powell et al. (85) estimated the price-elasticity of SSBs to be −1.30 and − 1.21, indicating that a 10% increase in SSB prices was associated with a reduction in demand for SSBs by 13.0 and 12.1%, respectively. Afshin et al. (12) reported that a 10% increase in SSB prices was associated with a reduction in SSB consumption by 7%. Those estimates from the previous meta-analyses were comparable to the estimated impact of soda taxes on SSB purchases and consumption in this review. However, the key differences are: previous reviews and meta-analyses were nearly exclusively based on the “proxy” or “modeling” studies due to lacking a soda tax in reality and collected data from multiple other countries besides the US. This review contributed to the literature by comprehensively assessing the efficacy of soda taxes based on evidence reported exclusively from natural experiments (the “local” studies). In addition, the review provided quantitative estimates of the magnitude of the tax effect. Review findings can potentially inform policymakers in designing and implementing soda taxes to curb the obesity epidemic.
Several main criticisms of soda taxes are worth noting. First, substitution effects in addition to cross-border shopping may partially offset the intended effect of soda taxes on SSB purchases and consumption (49, 50). A nationwide soda tax adoption could eliminate cross-border shopping (49). Second, the soda tax could be regressive and the impact of soda consumption is greatest in low income populations. However, a systematic review revealed only modest differences—0.1–1.0% and 0.03–0.60% of annual household income paid for soda taxes for low- and high-income households, respectively (86). Third, revenues collected by soda taxes were rarely earmarked for healthy diet promotion, such as in the form of healthy food subsidies paid to low-income households (87). Fourth, relatively arbitrary classifications of SSBs result in taxing some low-sugar beverages but exempting some high-sugar ones (88). The beverage industry has used these policy loopholes to lobby against soda tax bills (88). Finally, some researchers questioned the efficiency of the volumetric soda tax and suggested taxing the amount of sugar in a drink rather than the volume of liquid that accompanied the sugar to boost the soda tax’s health benefits and overall economic gains (89).
Despite the various criticisms of soda taxes, it remains a potentially effective policy leverage to nudge people toward reducing purchases and consumption of SSBs. There is also preliminary evidence linking soda tax to reduced body weight, BMI, and overweight or obesity (14, 15). The revenues collected from soda taxes could support other health interventions, such as nutrition education campaigns or healthy food subsidies, which may reinforce the long-term sustainability of soda taxes on dietary pattern changes. Such policy arrangements might also alleviate health disparities at the population level.
This study comprehensively reviews evidence reported from natural experiments on soda taxes implemented across US local taxing jurisdictions. The strengths of the included studies encompassed real-world policy interventions providing causal inferences, the inclusion of comparison cities, an elucidation of the local soda tax implementation processes, and longitudinal changes in price, consumption, and purchases pre-and post-tax. However, a few limitations of this review and the included studies should be noted. First, all studies were natural experiments focused on one or a few US cities implementing a soda tax. The limited geographic coverage and nationally non-representative sample have confined the generalizability of study findings. Therefore, caution should be exercised when extrapolating the results to other cities or jurisdictions. Second, DID is a quantitative method to reveal causal references, but the resulting evidence should not be overstated due to lacking a randomization design (82). Third, it is important to consider the magnitude of the tax rates examined in the included studies. The range of tax rates observed in the reviewed studies was relatively narrow, typically between 1 and 2 ¢/oz. Thus, the effects reported in the included studies may not necessarily apply to different tax magnitudes. Non-linearities in the effects on tax pass-through or purchases may exist, and these non-linearities could be influenced by factors such as company profit considerations or consumer price sensitivity. Additionally, we acknowledge that the slight increase in prices of untaxed beverages following soda tax implementations is an interesting finding. However, the reasons behind this increase are not entirely clear from available evidence. It could be a result of temporal changes in the prices of untaxed beverages or it may reflect substitution effects, where higher demand for untaxed beverages leads to a price increase. Further research is needed to understand the underlying factors contributing to this observation.
5. Conclusion
This study systematically reviewed evidence from natural experiments regarding the impact of soda taxes on beverage prices, sales, purchases, and consumption in the US. Soda tax implementation was associated with increased prices of taxed beverages and reduced purchases and consumption of taxed beverages. Soda taxes could be effective policy leverage to nudge people toward purchasing and consuming fewer SSBs. Future research should examine evidence-based classifications of SSBs, more targeted use of revenues generated by taxes to reduce health and income disparities, and the feasibility of redesigning the soda tax to improve its efficiency.
Data availability statement
The original contributions presented in the study are included in the article/Supplementary material, further inquiries can be directed to the corresponding author.
Author contributions
JS, JW, and RA designed the study, wrote the manuscript, and revised the manuscript. JW, FY, and JS jointly designed the search algorithm and screened articles. JS and JW performed data extraction and constructed the summary tables. All authors contributed to the article and approved the submitted version.
Funding
This research was funded by the Fundamental Research Funds for the Central Universities, CUGB, grant number 2-9-2020-036; The Ministry of Education of Humanities and Social Science project, grant number 19YJC890044.
Conflict of interest
The authors declare that the research was conducted in the absence of any commercial or financial relationships that could be construed as a potential conflict of interest.
Publisher’s note
All claims expressed in this article are solely those of the authors and do not necessarily represent those of their affiliated organizations, or those of the publisher, the editors and the reviewers. Any product that may be evaluated in this article, or claim that may be made by its manufacturer, is not guaranteed or endorsed by the publisher.
Supplementary material
The Supplementary material for this article can be found online at: https://www.frontiersin.org/articles/10.3389/fpubh.2023.1126569/full#supplementary-material
References
1. US Department of Agriculture and US Department of Health and Human Services. Dietary guidelines for Americans, 2015–2020. 8th ed. Washington, DC: US Government Printing Office (2015).
2. Rosinger, A, Herrick, K, Gahche, J, and Park, S. Sugar-sweetened beverage consumption among US adults 2011–2014, NCHS Data Brief. Hyattsville, MD: National Center for Health Statistics (2017a).
3. Rosinger, A, Herrick, K, Gahche, J, and Park, S. Sugar-sweetened beverage consumption among US youth 2011–2014, NCHS Data Brief. Hyattsville, MD: National Center for Health Statistics (2017b).
4. Valenzuela, MJ, Waterhouse, B, Aggarwal, VR, Bloor, K, and Doran, T. Effect of sugar-sweetened beverages on oral health: a systematic review and meta-analysis. Eur J Pub Health. (2021) 31:122–9. doi: 10.1093/eurpub/ckaa147
5. Keller, A, Bucher, D, and Torre, S. Sugar-sweetened beverages and obesity among children and adolescents: a review of systematic literature reviews. Child Obes. (2015) 11:338–6. doi: 10.1089/chi.2014.0117
6. Malik, VS, Popkin, BM, Bray, GA, Després, JP, and Hu, FB. Sugar-sweetened beverages, obesity, type 2 diabetes mellitus, and cardiovascular disease risk. Circulation. (2010) 121:1356–64. doi: 10.1161/CIRCULATIONAHA.109.876185
7. Malik, VS, and Hu, FB. The role of sugar-sweetened beverages in the global epidemics of obesity and chronic diseases. Nat Rev Endocrinol. (2022) 18:205–8. doi: 10.1038/s41574-021-00627-6
8. Alhareky, M. Taxation of sugar-sweetened beverages and its impact on dental caries: a narrative review. Saudi J Med Med Sci. (2021) 9:113–7. doi: 10.4103/sjmms.sjmms_54_21
9. Faulkner, GE, Grootendorst, P, Nguyen, VH, Andreyeva, T, Arbour-Nicitopoulos, K, Auld, MC, et al. Economic instruments for obesity prevention: results of a scoping review and modified Delphi survey. Int J Behav Nutr Phys Act. (2011) 8:109. doi: 10.1186/1479-5868-8-109
10. Paul-Ebhohimhen, V, and Avenell, A. Systematic review of the use of financial incentives in treatments for obesity and overweight. Obes Rev. (2008) 9:355–7. doi: 10.1111/j.1467-789X.2007.00409.x
11. Vlaev, I, King, D, Darzi, A, and Dolan, P. Changing health behaviors using financial incentives: a review from behavioral economics. BMC Public Health. (2019) 19:1059. doi: 10.1186/s12889-019-7407-8
12. Afshin, A, Peñalvo, JL, Gobbo, LD, Silva, J, Michaelson, M, and O'Flaherty, M. The prospective impact of food pricing on improving dietary consumption: a systematic review and meta-analysis. PLoS One. (2017) 12:e0172277. doi: 10.1371/journal.pone.0172277
13. Royo-Bordonada, MÁ, Fernández-Escobar, C, Simón, L, Sanz-Barbero, B, and Padilla, J. Impact of an excise tax on the consumption of sugar-sweetened beverages in young people living in poorer neighborhoods of Catalonia, Spain: a difference in differences study. BMC Public Health. (2019) 19:1553. doi: 10.1186/s12889-019-7908-5
14. Escobar, MA, Veerman, JL, Tollman, SM, Bertram, MY, and Hofman, KJ. Evidence that a tax on sugar-sweetened beverages reduces the obesity rate: a meta-analysis. BMC Public Health. (2013) 13:1072. doi: 10.1186/1471-2458-13-1072
15. Chen, LW, Appel, LJ, Loria, C, Lin, PH, Champagne, CM, Elmer, PJ, et al. Reduction in consumption of sugar-sweetened beverages is associated with weight loss: the PREMIER trial. Am J Clin Nutr. (2009) 89:1299–06. doi: 10.3945/ajcn.2008.27240
16. Sowa, PM, Keller, E, Stormon, N, Lalloo, R, and Ford, PJ. The impact of a sugar-sweetened beverages tax on oral health and costs of dental care in Australia. Eur J Pub Health. (2019) 29:173–7. doi: 10.1093/eurpub/cky087
17. City of Berkeley. Imposing a general tax on the distribution of sugar-sweetened beverage products. (2014) Available at: https://www.cityofberkeley.info/uploadedFiles/Health_Human_Services/Level_3_-_Public_Health/SSBTaxOrdinance7388-N.S.pdf.
18. Wikipedia. American localities with a soda tax. (2019). Available at: https://en.wikipedia.org/wiki/Sugary_drink_tax#American_localities_with_a_soda_tax.
19. Finkelstein, EA, Zhen, C, Nonnemaker, J, and Todd, JE. Impact of targeted beverage taxes on higher-and lower-income households. Arch Intern Med. (2010) 170:2028–34. doi: 10.1001/archinternmed.2010.449
20. Fletcher, J, Frisvold, DE, and Tefft, N. Can soft drink taxes reduce population weight? Contemp Econ Policy. (2010) 28:23–35. doi: 10.1111/j.1465-7287.2009.00182.x
21. Fletcher, J, Frisvold, DE, and Tefft, N. The effects of soft drink taxes on child and adolescent consumption and weight outcomes. Econ Hum Biol. (2010) 94:967–4. doi: 10.1016/j.jpubeco.2010.09.005
22. Fletcher, J, Frisvold, DE, and Tefft, N. Non-linear effects of soda taxes on consumption and weight outcomes. Health Econ. (2015) 24:566–2. doi: 10.1002/hec.3045
23. Powell, LM, Chriqui, JF, and Chaloupka, FJ. Associations between state-level soda taxes and adolescent body mass index. J Adolesc Health. (2009) 45:S57–63. doi: 10.1016/j.jadohealth.2009.03.003
24. Sturm, R, Powell, LM, Chriqui, JF, and Chaloupka, FJ. Soda taxes, soft drink consumption, and children’s body mass index. Health Aff. (2010) 29:1052–8. doi: 10.1377/hlthaff.2009.0061
25. Allcott, H, Lockwood, B, and Taubinsky, D. Regressive sin taxes, with an application to the optimal soda tax. National Bureau of economic research. Q J Econ. (2019) 134:1557–26. doi: 10.1093/qje/qjz017
26. Andreyeva, T, Chaloupka, FJ, and Brownell, KD. Estimating the potential of taxes on sugar-sweetened beverages to reduce consumption and generate revenue. Prev Med. (2011) 52:413–6. doi: 10.1016/j.ypmed.2011.03.013
27. Gortmaker, SL, Wang, YC, Long, MW, Giles, CM, Ward, ZJ, Barrett, JL, et al. Three interventions that reduce childhood obesity are projected to save more than they cost to implement. Health Aff. (2015) 34:1932–9. doi: 10.1377/hlthaff.2015.0631
28. Gortmaker, SL, Long, MW, Resch, SC, Ward, ZJ, Cradock, AL, Barrett, JL, et al. Cost effectiveness of childhood obesity interventions: evidence and methods for choices. Am J Prev Med. (2015) 49:102–1. doi: 10.1016/j.amepre.2015.03.032
29. Lin, BH, Smith, TA, Lee, JY, and Hall, KD. Measuring weight outcomes for obesity intervention strategies: the case of a sugar-sweetened beverage tax. Econ Hum Biol. (2011) 9:329–1. doi: 10.1016/j.ehb.2011.08.007
30. Liu, S, Osgood, N, Gao, Q, Xue, H, and Wang, Y. Systems simulation model for assessing the sustainability and synergistic impacts of sugar-sweetened beverages tax and revenue recycling on childhood obesity prevention. J Oper Res Soc. (2016) 67:708–1. doi: 10.1057/jors.2015.99
31. Long, MW, Gortmaker, SL, Ward, ZJ, Resch, SC, Moodie, ML, Sacks, G, et al. Cost effectiveness of a sugar-sweetened beverage excise tax in the U.S. Am J Prev Med. (2015) 49:112–3. doi: 10.1016/j.amepre.2015.03.004
32. Veerman, JL, Sacks, G, Antonopoulos, N, and Martin, J. The impact of a tax on sugar-sweetened beverages on health and health care costs: a modeling study. PloS One. (2016) 11:e0151460. doi: 10.1371/journal.pone.0151460
33. Wang, YC, Coxson, P, Shen, YM, Goldman, L, and Bibbins-Domingo, K. A penny-per-ounce tax on sugar-sweetened beverages would cut health and cost burdens of diabetes. Health Aff. (2012) 31:199–7. doi: 10.1377/hlthaff.2011.0410
34. Wilde, P, Huang, Y, Sy, S, Abrahams-Gessel, S, Jardim, TV, Paarlberg, R, et al. Cost-effectiveness of a US national sugar-sweetened beverage tax with a multistakeholder approach: who pays and who benefits. Am J Public Health. (2019) 109:276–4. doi: 10.2105/AJPH.2018.304803
35. Baskin, E, and Coary, SP. Implications of the Philadelphia beverage tax on sales and beverage substitution for a major grocery retailer chain. J Int Food Agric Mark. (2019) 31:293–7. doi: 10.1080/08974438.2018.1520180
36. Bollinger, B, SE Sexton. Local excise taxes, sticky prices, and spillovers evidence from Berkeley soda tax. (2018). Available at: https://pdfs.semanticscholar.org/61c6/98eb8e37fefdc7abc2c7582ac1d0331f1ec5.pdf.
37. Cawley, J, and Frisvold, DE. The passthrough of taxes on sugar-sweetened beverages to retail prices: the case of Berkeley, California. J Policy Anal Manage. (2017) 36:303–6. doi: 10.1002/pam.21960
38. Cawley, J, Crain, C, Frisvold, D, and Jones, D. The passthrough of the largest tax on sugar-sweetened beverages: The case of Boulder, Colorado. (2018a). Available at: https://www.nber.org/papers/w25050.pdf.
39. Cawley, J, Frisvold, D, Hill, A, and Jones, D. The impact of the Philadelphia beverage tax on prices and product availability. (2018b). Available at: https://www.nber.org/papers/w24990.pdf.
40. Cawley, J, Frisvold, D, Hill, A, and Jones, D. The impact of the Philadelphia beverage tax on purchases and consumption by adults and children. J Health Econ. (2019b) 67:102225. doi: 10.1016/j.jhealeco.2019.102225
41. Cawley, J, Frisvold, D, and Jones, D. The impact of sugar-sweetened beverage taxes on purchases: evidence from four City-level taxes in the United States. Health Econ. (2019a) 29:1289–06. doi: 10.1002/hec.4141
42. Cawley, J, Frisvold, DE, Hill, A, and Jones, D. Oakland’s sugar-sweetened beverage tax: impacts on prices, purchases and consumption by adults and children. Econ Hum Biol. (2020) 37:100865. doi: 10.1016/j.ehb.2020.100865
43. Coary, SP, and Baskin, E. Sweetened beverages excise tax passthrough rates: a case study in Philadelphia. J Int Food Agri Mark. (2018) 30:382–1. doi: 10.1080/08974438.2018.1449696
44. Debnam, J. Selection effects and heterogeneous demand responses to the Berkeley soda tax vote. Am J Agric Econ. (2017) 99:1172–87. doi: 10.1093/ajae/aax056
45. Falbe, J, Rojas, N, Grummon, AH, and Madsen, KA. Higher retail prices of sugar-sweetened beverages 3 months after implementation of an excise tax in Berkeley California. Am J Public Health. (2015) 105:2194–01. doi: 10.2105/AJPH.2015
46. Falbe, J, Thompson, HR, Becker, CM, Rojas, N, McCulloch, CE, and Madsen, KA. Impact of the Berkeley excise tax on sugar-sweetened beverage consumption. Am J Public Health. (2016) 106:1865–71. doi: 10.2105/AJPH.2016.303362
47. Lee, MM, Falbe, J, Schillinger, D, Basu, S, McCulloch, CE, and Madsen, KA. Sugar-sweetened beverage consumption 3 years after the Berkeley, California, sugar-sweetened beverage tax. Am J Public Health. (2019) 109:637–9. doi: 10.2105/AJPH.2019.304971
48. Powell, LM, and Leider, J. The impact of Seattle’s sweetened beverage tax on beverage prices and volume sold. Econ Hum Biol. (2020b) 37:100856. doi: 10.1016/j.ehb.2020.100856
49. Roberto, CA, Lawman, HG, LeVasseur, MT, Mitra, N, Peterhans, A, and Herring, B. Association of a Beverage tax on sugar-sweetened and artificially sweetened beverages with changes in beverage prices and sales at chain retailers in a large urban setting. JAMA. (2019) 321:1799–10. doi: 10.1001/jama.2019.4249
50. Seiler, S, Tuchman, A, and Yao, S. The impact of soda taxes: Pass-through, tax avoidance, and nutritional effects. Stanford University: Graduate School of Business, Research Papers (2019).
51. Silver, LD, Ng, SW, Ryan-Ibarra, S, Taillie, LS, Induni, M, Miles, DR, et al. Changes in prices, sales, consumer spending, and beverage consumption one year after a tax on sugar-sweetened beverages in Berkeley, California, US: a before-and-after study. PloS Med. (2017) 14:e1002283. doi: 10.1371/journal.pmed.1002283
52. Zhong, YC, Auchincloss, AH, Lee, BK, and Kanter, GP. The short-term impacts of the Philadelphia beverage tax on beverage consumption. Am J Prev Med. (2018) 55:26–34. doi: 10.1016/j.amepre.2018.02.017
53. Powell, LM, Marinello, S, and Leider, J. A review and meta-analysis of tax passthrough of local sugar-sweetened beverage taxes in the United States. Chicago, IL: Policy, Practice and Prevention Research Center: University of Illinois Chicago. (2021a). Available at: https://p3rc.uic.edu/wp-content/uploads/sites/561/2021/09/Rvw-Meta-Anal-Tax-PssThrgh-SSB-Taxes_Rsrch-Brf-No.-120_Jul-2021.pdf
54. Powell, LM, Marinello, S, Leider, J, and Andreyeva, T. A review and meta-analysis of the impact of local US sugar-sweetened beverage taxes on demand. UIC Policy, Practice and Prevention Research Center Research Brief. (2021b). Available at: https://p3rc.uic.edu/wp-content/uploads/sites/561/2021/09/Rvw-Meta-Anal-Impct-Lcl-US-SSB-Taxes-Demand_Rsrch-Brf-No.-121_Aug-2021.pdf
55. Moher, D, Liberati, A, Tetzlaff, J, and Altman, DG. Preferred reporting items for systematic reviews and meta-analyses: the PRISMA statement. BMJ. (2009) 339:b2535. doi: 10.1136/bmj.b2535
56. Taylor, RLC, Kaplan, S, Villas-Boas, SB, and Jung, K. Soda wars: the effect of a soda tax election on university beverage sales. Econ Inq. (2019) 57:1480–96. doi: 10.1111/ecin.12776
57. Lawman, HG, Bleich, SN, Yan, J, Hua, SV, Lowery, CM, Peterhans, A, et al. One-year changes in sugar-sweetened beverage consumers’ purchases following implementation of a beverage tax: a longitudinal quasi-experiment. Am J Clin Nutr. (2020) 112:644–1. doi: 10.1093/ajcn/nqaa158
58. Zhong, Y, Auchincloss, AH, Lee, BK, McKenna, RM, and Langellier, BA. Sugar-sweetened and diet beverage consumption in Philadelphia one year after the beverage tax. Int J Environ Res Public Health. (2020) 17:1336. doi: 10.3390/ijerph17041336
59. Cawley, J, Frisvold, D, Jones, D, and Lensing, C. The pass-through of a tax on sugar-sweetened beverages in Boulder, Colorado. Am J Agric Econ. (2021) 103:987–05. doi: 10.1111/ajae.12191
60. Edmondson, EK, Roberto, CA, Gregory, EF, Mitra, N, and Virudachalam, S. Association of a Sweetened Beverage tax with Soda Consumption in high school students. JAMA Pediatr. (2021) 175:1261–8. doi: 10.1001/jamapediatrics.2021.3991
61. Leider, J, Li, Y, and Powell, LM. Pass-through of the Oakland, California, sugar-sweetened beverage tax in food stores two years post-implementation: a difference-in-differences study. PLoS One. (2021) 16:e0244884. doi: 10.1371/journal.pone.0244884
62. Rojas, C, and Wang, E. Do taxes on soda and sugary drinks work? Scanner data evidence from Berkeley and Washington state. Econ Inq. (2021) 59:95–8. doi: 10.1111/ecin.12957
63. Zhang, Q, McCluskey, JJ, Gallardo, RK, and Brady, MP. Avoidance behaviors circumventing the sugar-sweetened beverages tax. Food Policy. (2021) 105:102166. doi: 10.1016/j.foodpol.2021.102166
64. Higgins, JP, Thompson, SG, Deeks, JJ, and Altman, DG. Measuring inconsistency in meta-analyses. BMJ. (2003) 327:557–24. doi: 10.1136/bmj.327.7414.557
65. Littell, J, Corcoran, J, and Pillai, V. Systematic reviews and meta-analysis. New York: Oxford University Press (2008).
66. Lin, L, and Chu, H. Quantifying publication bias in meta-analysis. Biometrics. (2018) 74:785–4. doi: 10.1111/biom.12817
67. An, R, Ji, M, and Zhang, S. Global warming and obesity: a systematic review. Obes Rev. (2018) 19:150–3. doi: 10.1111/obr.12624
68. Cawley, J, Willage, B, and Frisvold, D. Pass-through of a tax on sugar-sweetened beverages at the Philadelphia international airport. JAMA. (2018) 319:305–6. doi: 10.1001/jama.2017.16903
69. Bleich, SN, Lawman, HG, LeVasseur, MT, Yan, J, Mitra, N, and Lowery, CM. The association of a sweetened beverage tax with changes in beverage prices and purchases at independent stores. Health Aff. (2020) 39:1130–9. doi: 10.1377/hlthaff.2019.01058
70. Falbe, J, Lee, MM, Kaplan, S, Rojas, NA, Hinojosa, AMO, and Madsen, KA. Higher sugar-sweetened beverage retail prices after excise taxes in Oakland and San Francisco. Am J Public Health. (2020) 110:1017–23. doi: 10.2105/AJPH.2020.305602
71. Jones-Smith, JC, Pinero Walkinshaw, L, Oddo, VM, Knox, M, Neuhouser, ML, Hurvitz, PM, et al. Impact of a sweetened beverage tax on beverage prices in Seattle. WA Econ Hum Biol. (2020) 39:100917. doi: 10.1016/j.ehb.2020.100917
72. Marinello, S, Pipito, AA, Leider, J, Pugach, O, and Powell, LM. The impact of the Oakland sugar-sweetened beverage tax on bottled soda and fountain drink prices in fast-food restaurants. Prev Med Rep. (2019) 17:101034. doi: 10.1016/j.pmedr.2019.101034
73. Powell, LM, and Leider, J. Evaluation of changes in beverage prices and volume sold following the implementation and repeal of a sweetened beverage tax in Cook County Illinois. JAMA Netw Open. (2020b) 3:e2031083. doi: 10.1001/jamanetworkopen.2020.31083
74. Powell, LM, Leider, J, and Léger, PT. The impact of a sweetened beverage tax on beverage volume sold in Cook County, Illinois, and its border area. Ann Intern Med. (2020a) 172:390–7. doi: 10.7326/M19-2961
75. Powell, LM, Leider, J, and Léger, PT. The impact of the Cook County, IL, sweetened beverage tax on beverage prices. Econ Hum Biol. (2020b) 37:100855. doi: 10.1016/j.ehb.2020.100855
76. Bleich, SN, Dunn, CG, Soto, MJ, Yan, J, Gibson, LA, Lawman, HG, et al. Association of a Sweetened Beverage tax with Purchases of beverages and high-sugar foods at independent Stores in Philadelphia. JAMA Netw Open. (2021) 4:e2113527. doi: 10.1001/jamanetworkopen.2021.13527
77. Léger, PT, and Powell, LM. The impact of the Oakland SSB tax on prices and volume sold: a study of intended and unintended consequences. Health Econ. (2021) 30:1745–71. doi: 10.1002/hec.4267
78. Marinello, S, Pipito, AA, Leider, J, Pugach, O, and Powell, LM. Longer-term impacts of sugar-sweetened beverage taxes on fast-food beverage prices: evidence from Oakland, California, 2-year post-tax. Public Health Nutr. (2021) 24:3571–5. doi: 10.1017/s1368980020005212
79. Powell, LM, and Leider, J. Impact of a sugar-sweetened beverage tax two-year post-tax implementation in Seattle, Washington United States. J Public Health Policy. (2021) 42:574–8. doi: 10.1057/s41271-021-00308-8
80. Leider, J, and Powell, LM. Longer-term impacts of the Oakland, California, sugar-sweetened beverage tax on prices and volume sold at two-years post-tax. Soc Sci Med. (2022) 292:114537. doi: 10.1016/j.socscimed.2021.114537
81. Petimar, J, Gibson, LA, Yan, J, Bleich, SN, Mitra, N, Trego, ML, et al. Sustained impact of the Philadelphia beverage tax on beverage prices and sales over 2 years. Am J Prev Med. (2022) 62:921–9. doi: 10.1016/j.amepre.2021.12.012
82. O’Neill, S, Kreif, N, Grieve, R, Sutton, M, and Sekhon, JS. Estimating causal effects: considering three alternatives to difference-in-differences estimation. Health Serv Outcome Res Methodol. (2016) 16:1–21. doi: 10.1007/s10742-016-0146-8
83. Nakhimovsky, SS, Feigl, AB, Avila, CO, Macgregor-Skinner, E, and Spranca, M. Taxes on sugar-sweetened beverages to reduce overweight and obesity in middle-income countries: a systematic review. PLoS One. (2016) 11:e0163358. doi: 10.1371/journal.pone.0163358
84. Teng, AM, Jones, AC, Mizdrak, A, Signal, L, Genç, M, and Wilson, N. Impact of sugar-sweetened beverage taxes on purchases and dietary intake: systematic review and meta-analysis. Obes Rev. (2019) 20:1187–04. doi: 10.1111/obr.12868
85. Powell, LM, Chriqui, JF, Khan, T, Wada, R, and Chaloupka, FJ. Assessing the potential effectiveness of food and beverage taxes and subsidies for improving public health: a systematic review of prices, demand and body weight outcomes. Obes Rev. (2013) 14:110–8. doi: 10.1111/obr.12002
86. Backholer, K, Sarink, D, Beauchamp, A, Keating, C, Loh, V, Ball, K, et al. The impact of a tax on sugar-sweetened beverages according to socioeconomic position: a systematic review of the evidence. Public Health Nutr. (2016) 19:3070–84. doi: 10.1017/S136898001600104X
87. An, R. Effectiveness of subsidies in promoting healthy food purchases and consumption: a review of field experiments. Public Health Nutr. (2013) 16:1215–28. doi: 10.1017/S1368980012004715
88. City of Berkeley. Arguments Against Measure D. (2014). Available at: http://www.smartvoter.org/2014/11/04/ca/alm/meas/D/.
Keywords: sugar-sweetened beverages, tax, systematic review, meta-analysis, natural experiments
Citation: Shen J, Wang J, Yang F and An R (2023) Impact of soda tax on beverage price, sale, purchase, and consumption in the US: a systematic review and meta-analysis of natural experiments. Front. Public Health. 11:1126569. doi: 10.3389/fpubh.2023.1126569
Edited by:
Maximilian Pangratius de Courten, Victoria University, AustraliaReviewed by:
Gemma Bridge, Independent Researcher, Leeds, United KingdomMatt Kasman, Brookings Institution, United States
Copyright © 2023 Shen, Wang, Yang and An. This is an open-access article distributed under the terms of the Creative Commons Attribution License (CC BY). The use, distribution or reproduction in other forums is permitted, provided the original author(s) and the copyright owner(s) are credited and that the original publication in this journal is cited, in accordance with accepted academic practice. No use, distribution or reproduction is permitted which does not comply with these terms.
*Correspondence: Junjie Wang, d2FuZ2p1bmppZUBkbHV0LmVkdS5jbg==