 Fatma Mohamed Hassan1
 Eman D. El Desouky2
 Marwa Rashad Salem3*
 Motaze Adel Abdelsabour4Mostafa Alaa Abdelmoneim4Mohamed Mahmoud Elsaieed4Mona Mohamed Ali1,5
- 1Forensic Medicine and Clinical Toxicology, Faculty of Medicine, Cairo University, Cairo, Egypt
- 2Epidemiology and Biostatistics, National Cancer Institute, Cairo University, Cairo, Egypt
- 3Public Health and Community Medicine, Faculty of Medicine, Cairo University, Cairo, Egypt
- 4Kasr Alainy Medical School, Cairo University, Cairo, Egypt
- 5Forensic Medicine and Clinical Toxicology, Faculty of Medicine, Taif University, Taif, Saudi Arabia
Introduction: Plastic is extensively used in everyday life, particularly for food and beverage containers. The inappropriate use of these containers may lead to the leaching of various chemicals from plastic, such as bisphenol A, phthalate, and styrene, which cause numerous adverse health effects. This study aimed to assess the knowledge, attitudes, and practices toward using plastic for food and drinks among a sample of the Egyptian population.
Materials and methods: A questionnaire was designed based on scientific literature to assess sociodemographic data, knowledge, attitudes, and practices toward the use of plastic for food and drinks. A total of 639 participants were recruited by employing the convenience sampling technique.
Results: More than half of the participants (347, 54%) had poor knowledge scores. Personal experiences, social media, and web pages represented the most common knowledge sources. A comparison between plastic-related knowledge scores and the studied sociodemographic characteristics revealed statistically significant differences in age, gender, education, marital status, residence, working, and socioeconomic standard. A good attitude was reported by the majority (515, 80.6%) of participants. The majority (493, 77.2%) were occasional and frequent plastic users and the practice scores were significantly associated with age, education, residence, and socioeconomic standard. Higher educational level, gender (women), and rural residence were predictors of good participants knowledge, while lower socioeconomic status and urban residence were predictors of bad participants practice in a multivariate logistic regression analysis.
Conclusion: The observed unsatisfactory knowledge and practice scores vs. the high attitude indicates a knowledge gap that can help direct future improvements. We call for public awareness programs about safe plastic use and the related health hazards of plastic chemicals. We also stress upon the urgent need for a collaboration between health authorities and the plastic and food industry to guarantee that information about proper plastic use is conveyed to consumers.
Introduction
Plastic has become an integral part of human life because it is a low-cost, lightweight, and long-lasting material that can be molded into a wide variety of products. Food and beverage containers, as well as food packaging materials, are examples of these products (1). Egypt consumes 0.7% of the world's plastic production and 11% of the Middle East's share. Furthermore, the plastic market in Egypt is expected to expand at a rate of 10% a year over the next 10 years, making Egypt the top plastic consumer in Africa (2).
Plastics are made of a wide range of chemicals; plastic packaging alone has been linked to more than 4,000 chemicals. Phthalates and bisphenol A (BPA) are among the chemicals used in plastic that are susceptible to leaching (3). Numerous studies have reported an association between phthalates and BPA with several adverse health conditions, such as polycystic ovarian disease (4, 5), frequent abortion (6), obesity (7), and cancer (8, 9).
A recent study investigated the habits related to food packaging in a sample of Portuguese citizens and their knowledge and concerns about its use, with the majority confirming that they think about the negative impact of plastic packaging. Most of the interviewees had concerns about the use of plastic packaging, and 55% reported that they are attempting to change their habits to avoid the use of plastics in this context (10). In addition, several studies in different countries reported poor knowledge and practices of individuals regarding the use of plastic for food and drinks (3, 11, 12). In that context, the United Nations Environment Programme statement suggested a 10-step plan for decision-makers. Increasing user awareness is one of them (13). This study aimed to assess the knowledge, attitudes, and practices toward the safe use of plastic containers for food and drinks.
Materials and methods
Study design
The proposed study was an exploratory cross-sectional study that was performed among a sample of the general population in Egypt to assess the knowledge, attitudes, and practices toward the use of plastic containers for food and drinks. The research was carried out following the guidelines outlined in the Checklist for Reporting Results of Internet E-surveys for the online survey (14) and the Strengthening the Reporting of Observational Studies in Epidemiology (STROBE) Statement for reporting observational studies (15).
Sample size and sampling technique
The researchers used a consecutive convenience sampling technique called “self-selection web-based questionnaires” and shared the questionnaire link with groups on Facebook, the most frequently utilized social media in Egypt. Requests were sent to the administrators of these groups to obtain permission to distribute this survey. The researchers posted the survey link along with an encouraging statement about its purpose and the contact information of one of the researchers. The questionnaire was open to the public, so anyone could participate. The researchers also printed and distributed the questionnaire to study participants who could not access the Google Forms. The total returned complete questionnaires were 204 out of 250 printed copies and 435 online forms collected via a Google Forms link sent through social media. The final total was 639 questionnaires. The inclusion criteria for participants were as follows: (i) being an Egyptian resident; adults (18 years old); and willing to participate between 1st of October 2022, and 1st of December 2022. Open Epi was used to calculate the required sample size, using the following formula: (n = [DEFF*Np (1-p)]/[(d2/Z21-/2*(N-1) + p*(1-p)]).
In the formula, n refers to the required sample size, Z∝/2 = 2.57(99% CI), P refers to the prevalence of the outcome (good knowledge assumed to be 50%), N refers to population size (for the finite population correction factor or FPC), d refers to the margin of error; 0.05, and DEFF refers to the design effect (for cluster surveys, here assumed to be 1). With a precision of 5%, a 95% confidence interval, and an 80% power, the minimal sample size required is 384 participants. Adding 50% to compensate for potential non-responses, the minimal sample size was estimated to be 576 participants.
Data collection technique
We used the online data collection method. A form was created via Google Forms, and participants were invited to complete and submit it. The researchers also printed and distributed the questionnaire to study participants who could not access the Google Forms. The questionnaire consisted of the following sections:
• Sociodemographic characteristics: Age, gender, occupation, education, residence, marital status, and socioeconomic level.
• The knowledge of study participants about plastic use consisted of a total of 11 items. The questions were formatted as close-ended statements with yes, no, and do not know options.
• The attitudes of study participants, which were assessed using five closed-ended questions with options of strongly agree, agree, neutral, strongly disagree, and disagree.
• The practice part, which had 7 items, assessed the frequency of plastic use-related practice in its weekly format and the selection of food and drink containers.
• Sources of knowledge, which were assessed through multiple options, including social media, web pages, newspapers, study materials, and parents.
Questions used in these sections were adopted from available studies in the literature (3, 16).
Pilot test
The data collection instrument for the survey was tested on a subset (58, 10%) of the total sample size, to evaluate the questionnaire's suitability in terms of language, questions, and time needed to complete it, as well as to investigate any variations between online and offline responses collected by the interviewers. The required modifications were applied; for example, some questions such as “What are the most common types of plastic products that you use?” were deleted. The questionnaire content was validated by four faculty members who are experts in public health, and the required modifications were made.
A Cronbach's alpha reliability test was performed for different sections of the questionnaire, as well as for the entire questionnaire. The results were as follows: knowledge section = 0.84, attitude section = 0.77, practice section = 0.65, and entire questionnaire = 0.72.
Statistical analysis
Data entry was carried out using the Statistical Package for Social Science (SPSS) version 28.0 (IBM, SPSS, USA). Categorical variables were expressed in numbers and percentages. Comparisons were made by performing a chi-squared test. Quantitative variables were examined for normality by performing the Kolmogorov–Smirnov test and were expressed using mean and standard deviation; a t-test and one-way ANOVA followed by the Bonferroni post-hoc test were performed for comparison, as appropriate. A logistic regression analysis was performed to assess the effects of different factors on the likelihood of participants having good knowledge or exhibiting poor practice. All tests were two-tailed, and a P-value of <0.05 was considered statistically significant.
Regarding knowledge about plastic containers for food and drink, the points for questions were distributed as follows: No and I don't know = 0 and Yes = 1; the total score was 11, and the range of scores was 0–11. Participants with scores of 9–11 (>75%) were considered “good,” those with scores of 6–8 (>50%) were considered “fair,” and those with scores of 1–5 (50%) were considered “poor.” For the attitude section, the highest score was 5 for strongly agree and 1 for strongly disagree. The total attitude score was 25, and the range of scores was 5–25. Participants with scores of 19–25 (>75%) were considered “good,” those with scores of 13–18 (>50%) were considered “fair,” and those with scores of 5–12 (50%) were considered “poor.”
Regarding practices related to plastic containers for food and drink, the points for questions were distributed as follows: Not at all = 0 and Usually = 3, except for reversed questions, where the points were Not at all = 3 and Usually = 0. The total score was 21, and the range of scores was 0–21. Participants with a score of 16–21 (>75%) were classified as “frequent users” of plastic food and beverage products, those with a score of 11–15 (>50%) were classified as “occasional users,” and those with a score of 0–10 (50%) were classified as “rare users.” A higher score indicated bad practice, while a lower score indicated good practice (16).
Ethical considerations
The National Cancer Institute Ethical Review Board at Cairo University granted ethical approval for the study protocol (Approval number = 2207-504-012). All procedures for data collection were treated with confidentiality according to the Helsinki Declaration on biomedical ethics. Participants were informed that the survey was anonymous and that participation was voluntary. Only those who agreed were included in the study. All procedures for data collection were treated according to the Helsinki Declaration and Biomedical Ethics (17). All the study participants provided written informed consent; for the online form, they provided electronically signed informed consent.
Results
The demographic characteristics of the study participants are demonstrated in Table 1. Six hundred thirty-nine individuals completed the questionnaire; their mean age was 31.0 ± 12.8 years (range 18–73 years), with 356 (55.8%) being <31 years old and 327 (51.2%) being women. The majority of participants (495, 77.4%) were highly educated (university and postgraduate levels), approximately half of them (324, 50.7%) were single, 497 (77.8%) were from urban areas, and more than three-quarters (501, 78.4%) reported a medium socioeconomic standard. More than half were working (324, 50.7%).
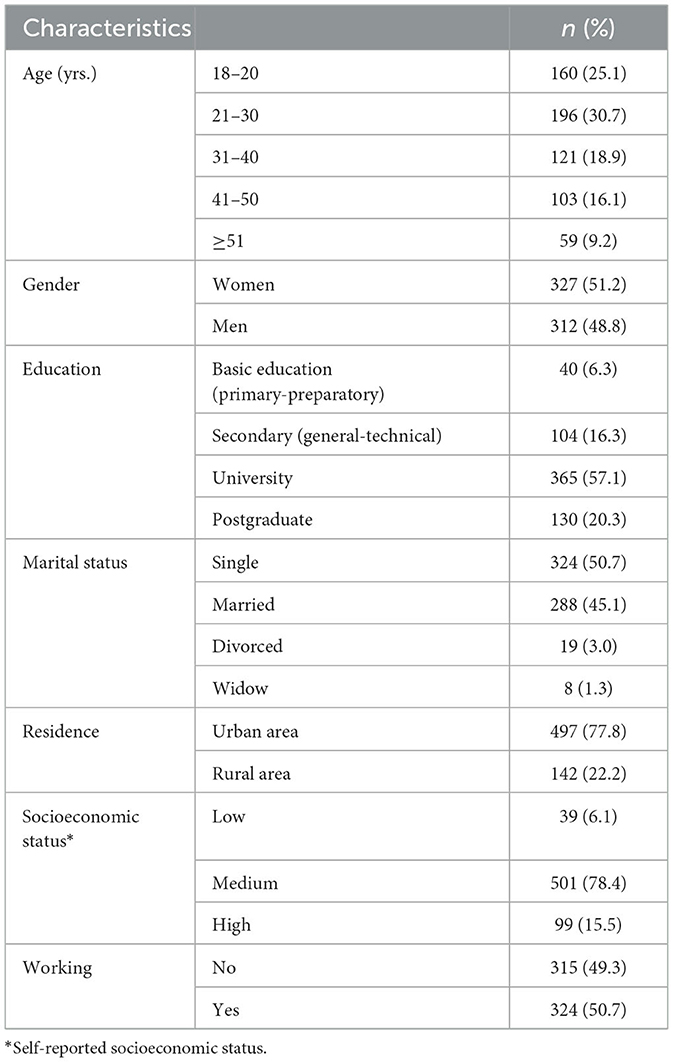
Table 1. Demographic characteristics of the study participants (n = 639).
Knowledge of participants
The items used for knowledge assessment and the frequency of participants' responses are presented in Table 2. We found that only 235 (36.8%) participants have correct knowledge about the safe use of plastic containers for eating or storing cold food or drink. However, most of the participants (539, 84.4%) have correct knowledge about handling hot food and drinks in plastic containers. Regarding the numbers written on plastic containers, 207 (32.4%) participants reported that they knew their meanings, but only approximately 16% of the participants correctly answered the questions related to these numbers. As for overall knowledge, more than half (347, 54.3 %) of them had poor knowledge scores. Their mean knowledge score was 5 ± 2 (range 0–11).
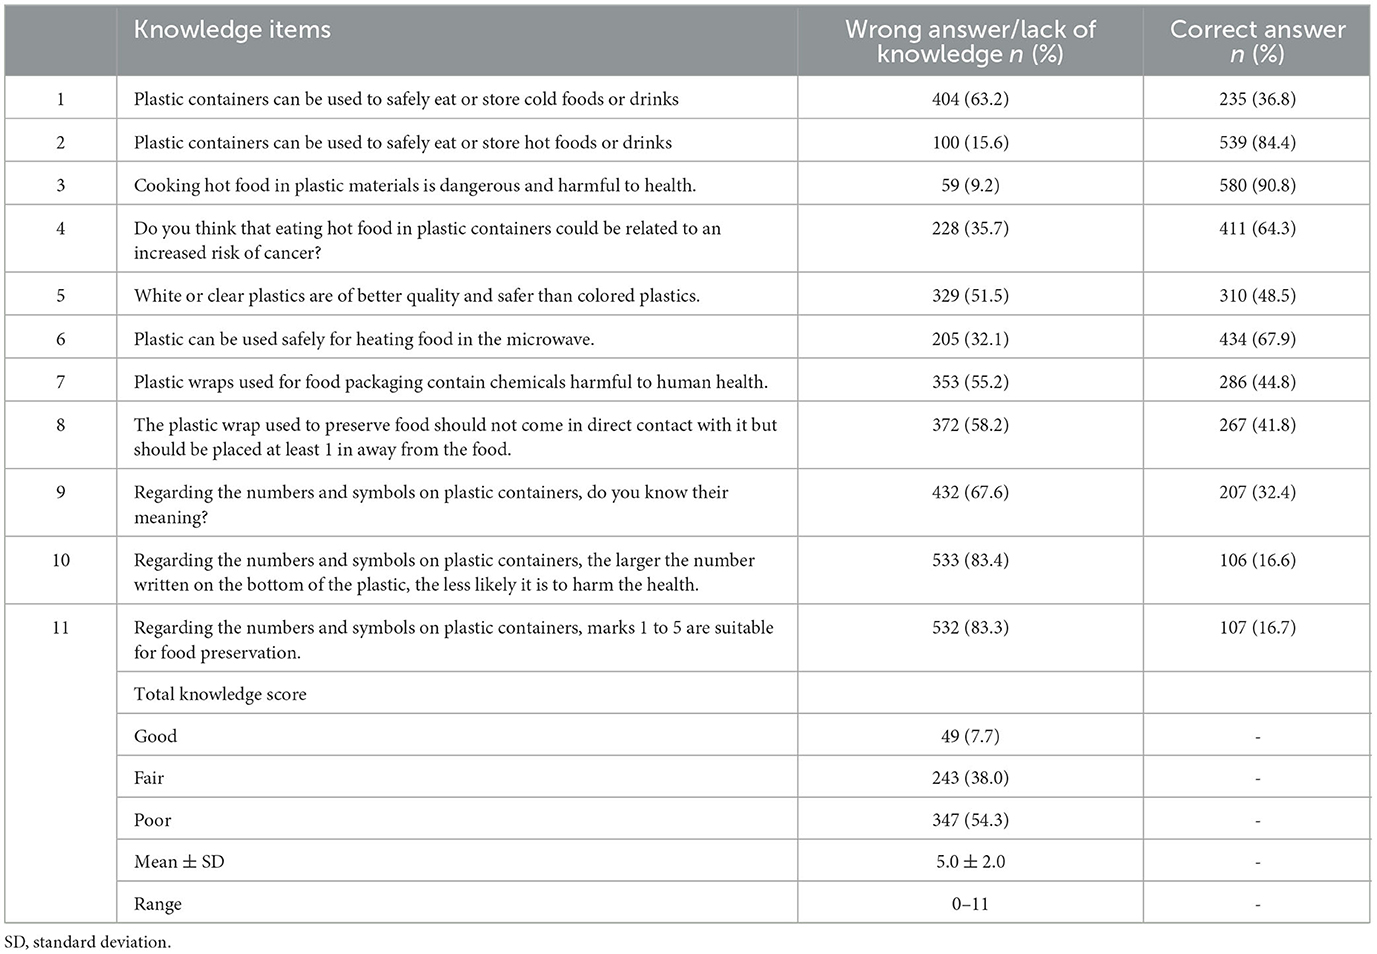
Table 2. Distribution of knowledge assessment items regarding the use of plastic containers for food and drinks among study participants (n = 639).
Figure 1 shows the knowledge sources of the participants, where personal experiences, social media, and web pages represented the most common sources (54.5, 43.0, and 38.5%, respectively). Parents were the least-reported source.
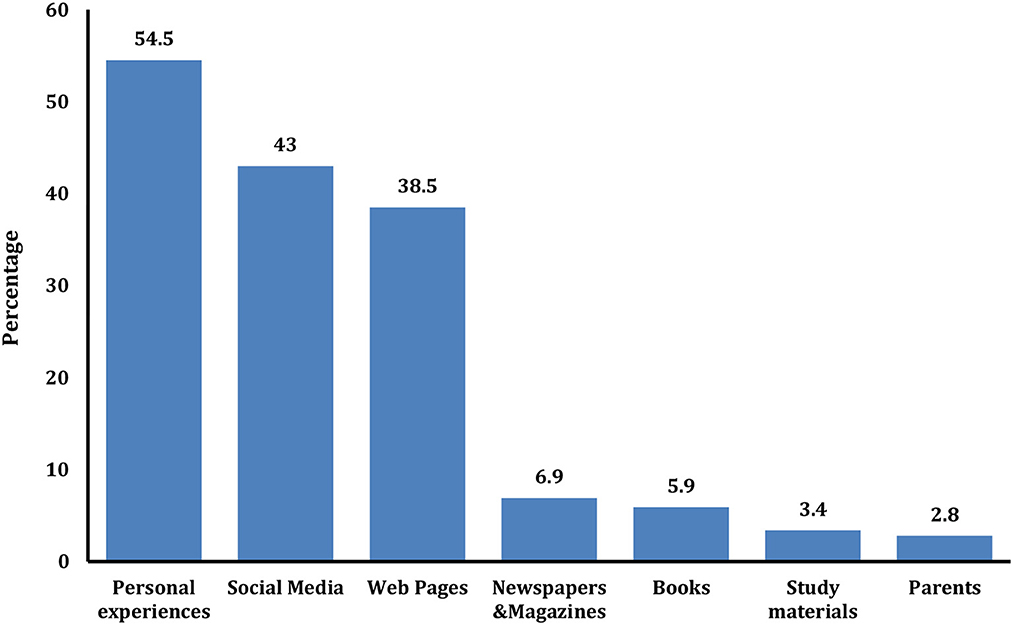
Figure 1. Sources of plastic-related knowledge among the enrolled participants (n = 639).
Attitude of participants
More than three-fourths of the participants showed a positive attitude toward the use of plastic containers for attitude statements regarding food and drinks. Most of them were against using plastic with hot drinks or foods, which should be avoided, and were willing to pay more money to buy alternative materials to such as plastic (Table 3). Overall, a good attitude was reported by the majority (515, 80.6%) of participants. The participants' mean attitude score was 21 ± 3 (range 11–25).
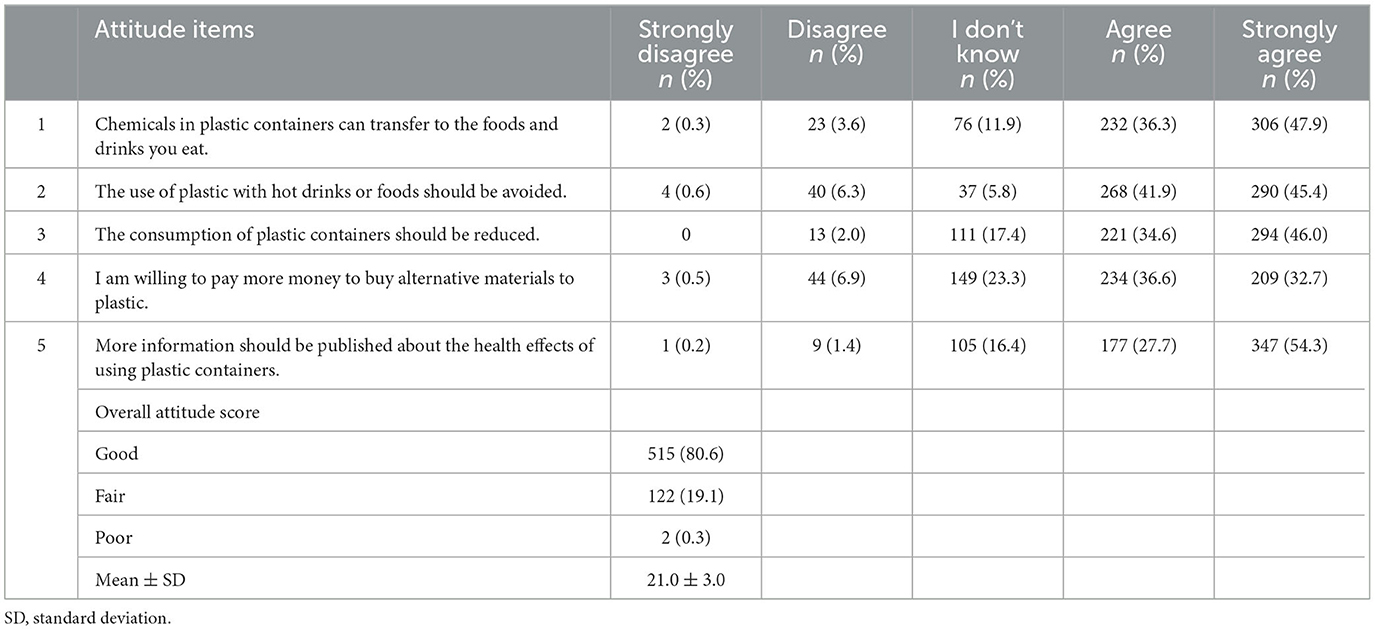
Table 3. Distribution of attitude assessment items regarding the use of plastic containers for food and drinks among study participants (n = 639).
Practices of participants
As shown in Figure 2, the most stated reason for using plastic was its light weight (43.3%), followed by its availability (41.6%).
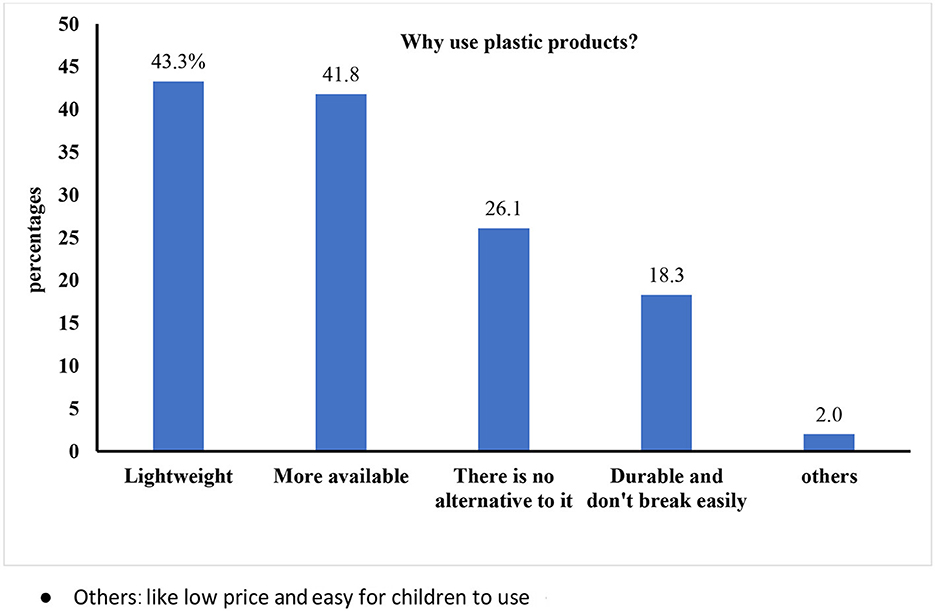
Figure 2. The most stated reason for using plastic among the enrolled participants (n = 639).
As displayed in Table 4, more than half (320, 50.1%) of the enrolled participants reported that they usually eat or drink in plastic containers, and 358 (56.0%) participants reported that they reuse plastic bottles to save or drink water. More than half (357, 55.9%) of the participants do not use plastic to heat food in the microwave, and nearly half (271, 42.4%) of the participants do not check the type of plastic before purchasing. Most (493, 77.2%) of the participants were occasional and frequent users. The mean practice score was 11.7 ± 3.5 (range 1–21).
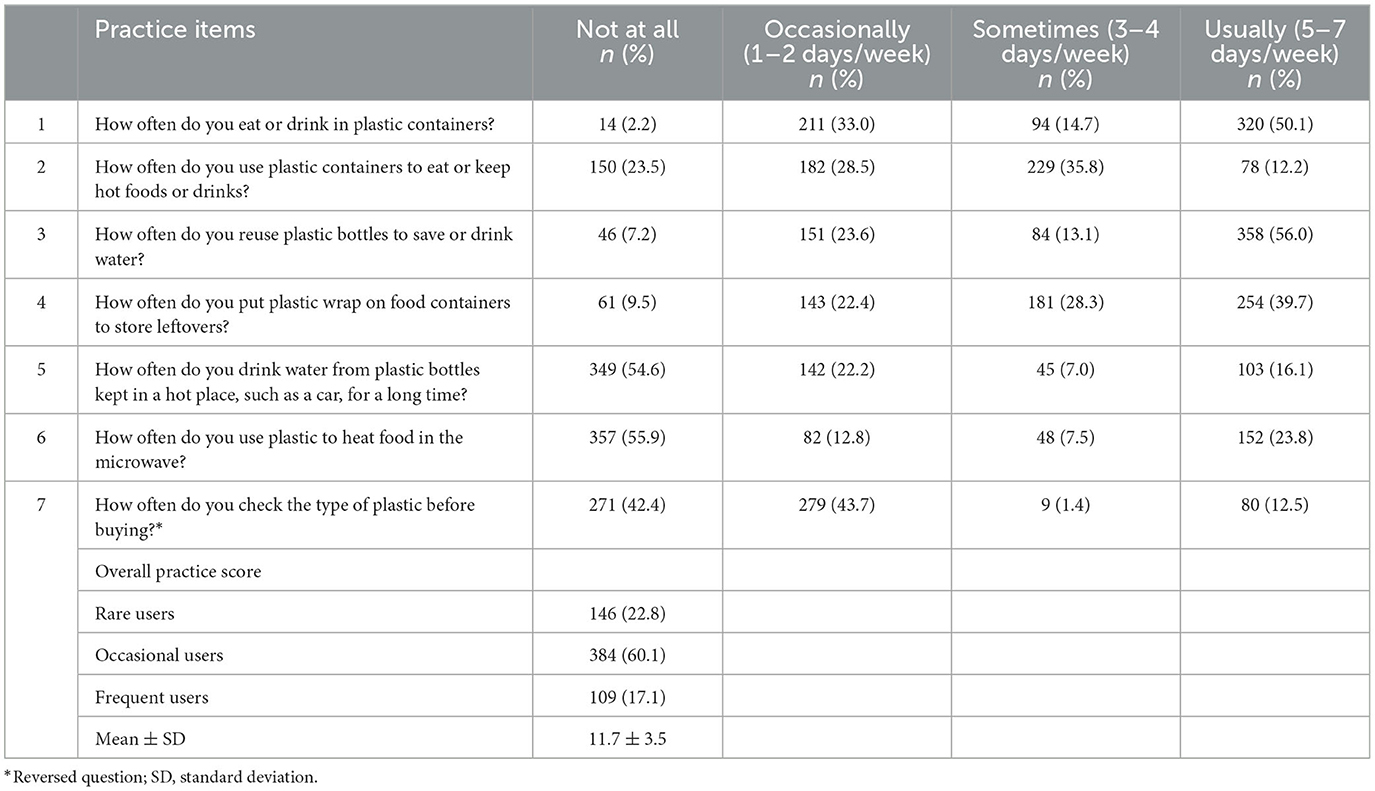
Table 4. Distribution of practice assessment items regarding the use of plastic containers for food and drinks among study participants (n = 639).
A comparison between plastic-related knowledge scores and the studied sociodemographic characteristics revealed statistically significant differences in age, gender, education, marital status, residence, working, and socioeconomic standard, as displayed in Table 5. Regarding practices, the same significant differences were revealed, except for gender, marital, and working status, which were not significant.
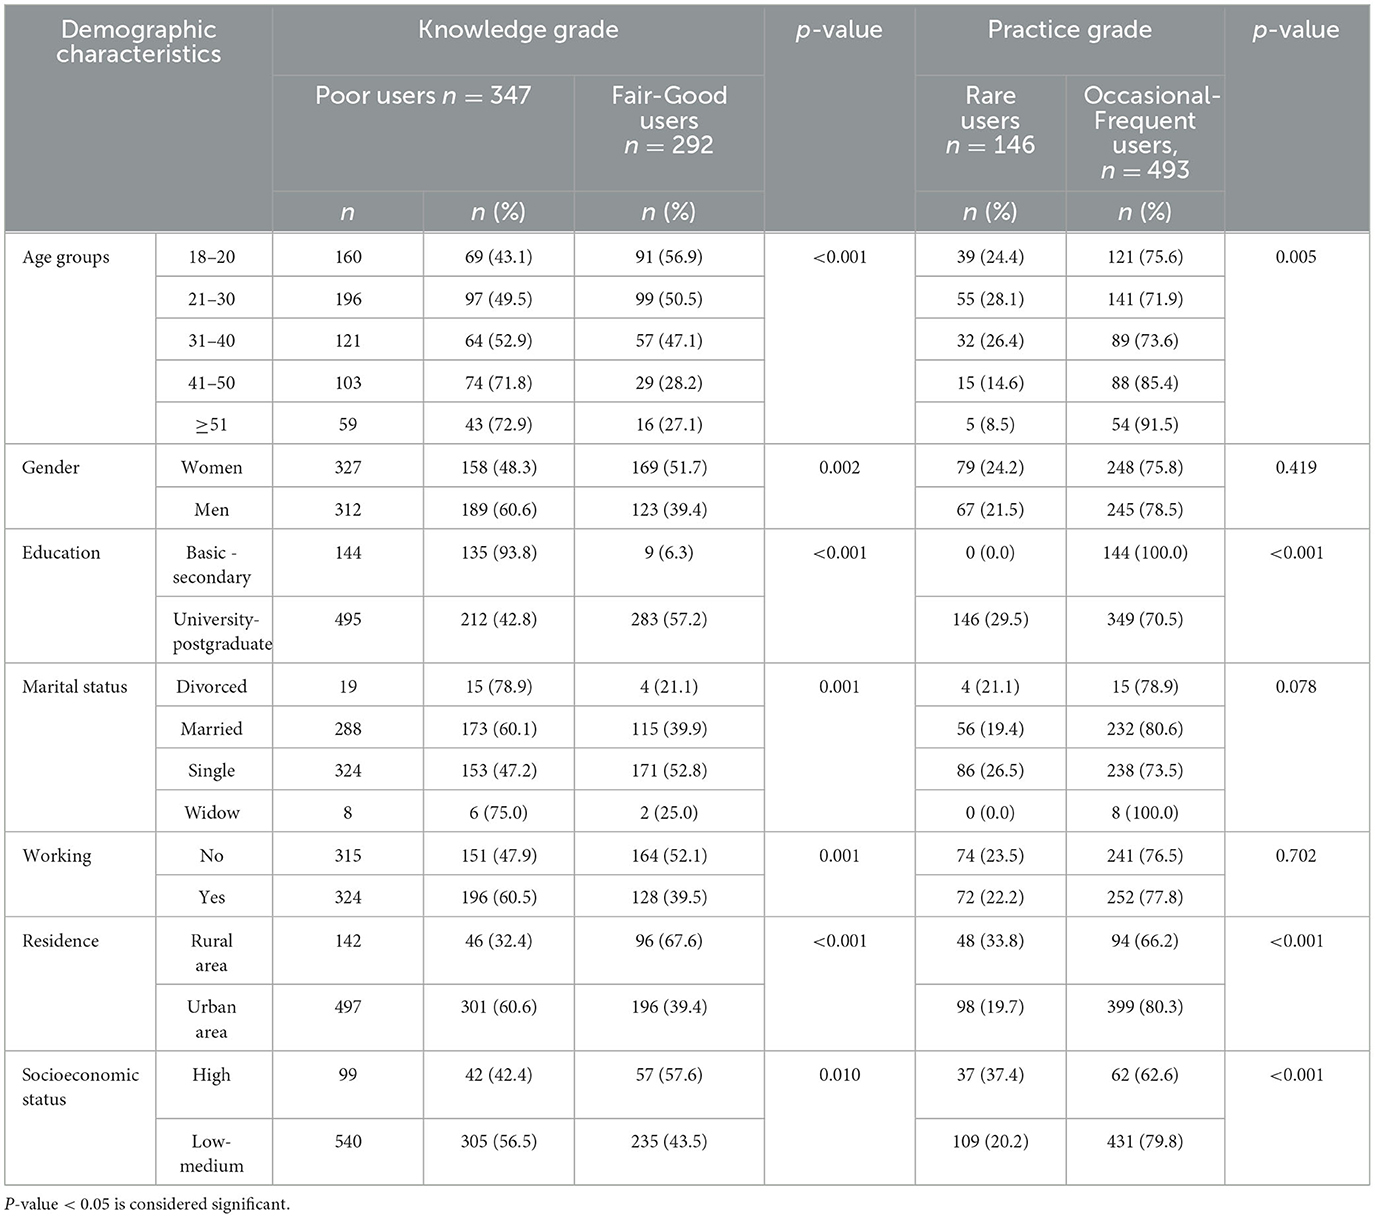
Table 5. Relationship between the distribution of knowledge and practice scores regarding the safe uses of plastic containers and demographic characteristics.
Age group (18–20 vs. 41–50), gender (women), higher education (university–postgraduate), residence in a rural area, and a high socioeconomic level were significantly associated with a higher mean knowledge score regarding the safe uses of plastic containers (p < 0.05), as illustrated in Table 6. Concerning the safe use of plastic, women and participants with basic and secondary education, those living in cities, and those working were significantly associated with a higher mean attitude score (p < 0.001). Contrarily, being single (vs. others) and age (21–30 vs. 31–40 and 41–50) were associated with a lower attitude score. Statistically significant relationships were revealed between the mean practice scores and all the studied demographic characteristics (age, education, marital status, and working), except for gender and residence. Age (18–20 vs. 21–30 and 31–40) had a higher practice score; the 31–40 age group had a lower practice score than those aged ≥51 years. Widowed participants had a higher score than divorced participants.
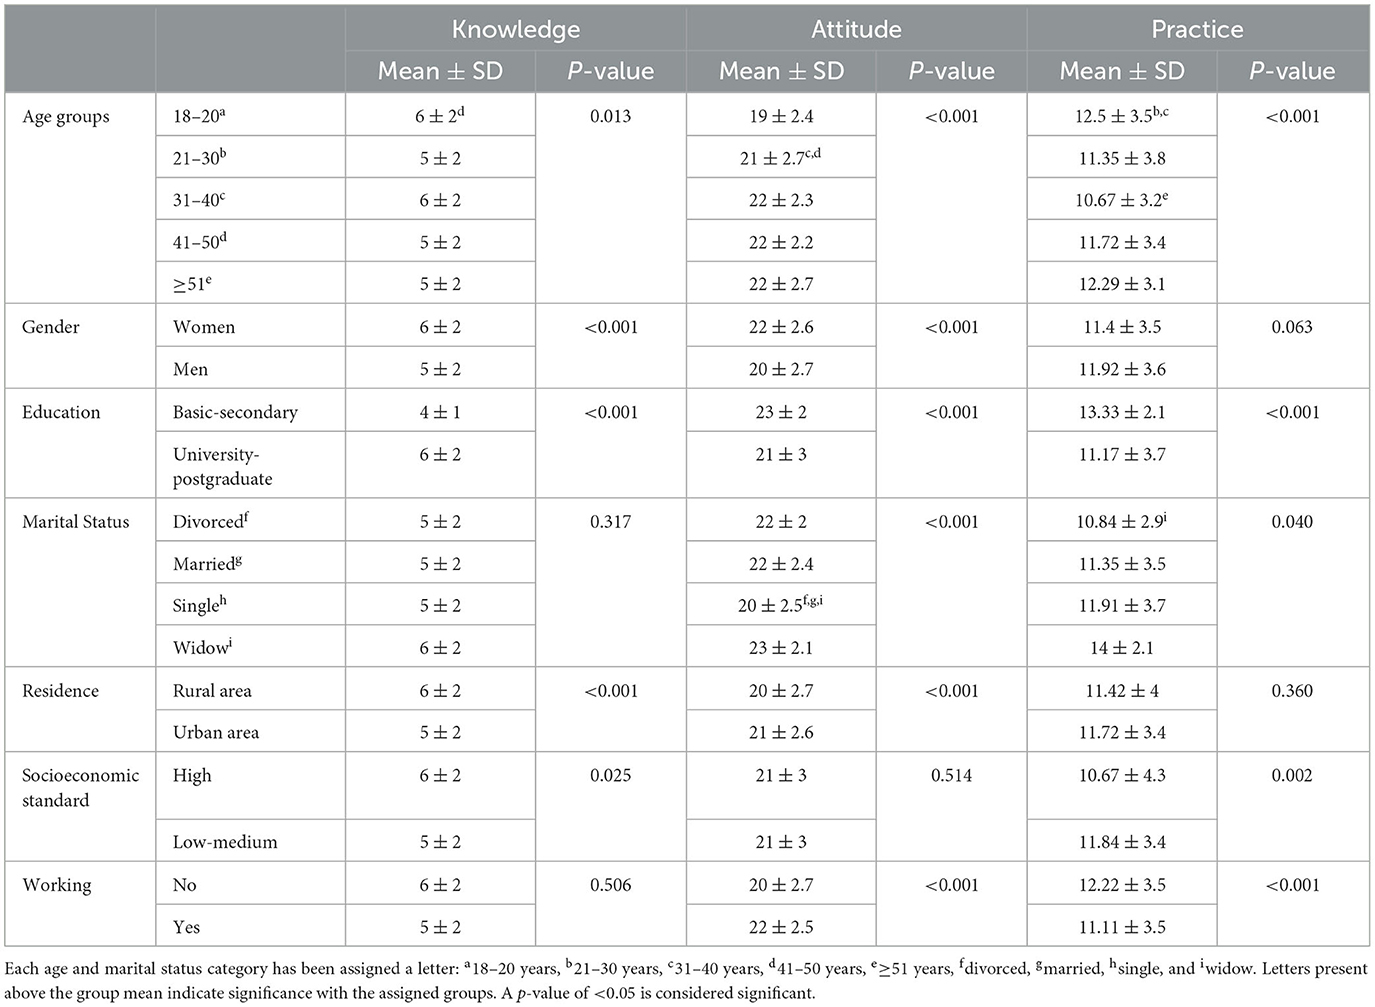
Table 6. Relationship between the mean scores of knowledge, attitude, and practice regarding the safe uses of plastic containers and demographic characteristics (n = 639).
A higher education level, gender (women), and residence in rural areas were found to be predictors of good participant knowledge in a multivariate logistic regression analysis. Participants with a higher level of education were 22.2 times more knowledgeable than those with a primary or secondary education. Women outperformed men in terms of knowledge, with an OR of 3.0 and a 95% confidence interval (2.1–4.3). Participants living in rural areas had 2.6 times more knowledge than those living in urban areas (Table 7).
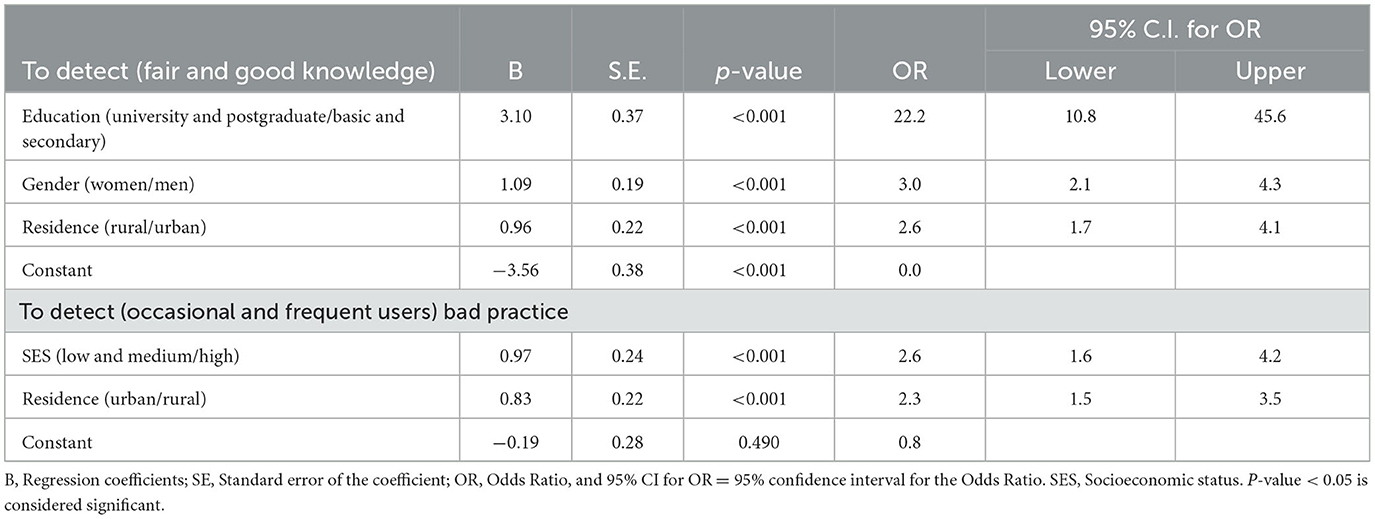
Table 7. Multivariate logistic regression analysis for factors associated with good knowledge and bad practice regarding the use of plastic containers for food and drinks.
Participants living in urban areas followed bad practices regarding the use of plastic containers for food and drinks 2.3 times more times than those living in rural areas. Participants with a low to medium socioeconomic standard followed bad practices 2.6 times more times than those with a higher standard.
Discussion
This study revealed that the majority of the participants had unsatisfactory knowledge and improper practices regarding the appropriate use of plastic for foods and drinks, which necessitates the implementation of public awareness programs about the safe uses of plastic. This finding is frustrating because knowledgeable people are more concerned about environmental pollution and engage in protective behaviors. Coco Chin et al. (18) found the same results among Malaysians.
Similarly, El-sayed et al. (1) reported an unsatisfactory knowledge level among 120 Egyptian children's mothers. Kasemsup and Neesanan (16), in their study that included 100 parents, found that more than 80% of participants lacked adequate knowledge about appropriate plastic use. Furthermore, Kaur et al. (19) assessed the knowledge about health risks associated with plastic use among students and observed that, at the pre-test, 60% of them had poor knowledge, while none had good knowledge. In addition, Samuel (20) studied the knowledge level of street food sellers and customers in Nigeria and found that 89.3% of the food sellers and 59.3% of the customers do not know the health hazards of wrapping hot food in plastic or cooking food using plastic. Recently, a community-based study conducted in Egypt by Hamza and Mahmoud (21) revealed that only 24% of the participants had adequate knowledge regarding single-use plastics.
Contrarily, Vigneshwaran and Arun Kumar (22) reported that three-fourths of their study participants had a high knowledge level regarding plastic use in Tiruchirappalli Municipal Corporation, Tamil Nadu, India. Additionally, Praveena found that 70% of the participants had moderately adequate knowledge of Mohan Kumar Nagar, Bengaluru, India (11).
This may be justified by the fact that India is a country that produces a tremendous number of plastic products, so Indian people have a high basic knowledge level.
One of the knowledge assessment items was symbols on plastic containers; only approximately 16% of our study participants knew their correct meanings. According to Nourbakhsh et al. (3), an average of 4.83% of their study participants in Iran verified their exact knowledge of various plastic labels. Unawareness of labels used at the bottom of plastic containers can be a barrier against proper use. According to the Food and Drug Administration (FDA), symbols number 1, 2, 4, and 5 (PET, HDPE, LDPE, and PP, respectively) are considered safe food-contact plastics (23).
Regarding attitude scores, our results revealed good attitude levels among the participants. More than 80% of the participants approved that the consumption of plastic containers should be reduced and that information about the health hazards of using plastic containers for food and drinks should be disseminated. It must be noted that attitude scores were higher than knowledge scores. Similarly, Kasemsup and Neesanan (16) observed this discrepancy between knowledge and attitude regarding plastic use, and they attributed this discrepancy to the fact that consumers are aware of the harmful effects of using plastic but need more information about the appropriate use of plastic containers for food and drinks, including different types of plastics, symbols and their specification, and microwave use. This finding is parallel to the outcomes of multiple studies (21, 24).
Regarding practice assessment items, approximately 76.5% of our study participants used plastic containers for hot foods or drinks with variable frequency. Similarly, Alharbi et al. (25), in their study that involved Saudi pregnant women, observed that almost 70% of the participants reheat or buy hot food in plastic containers. Additionally, we found that more than 90% of our study participants reused plastic bottles for saving and drinking water. This result is higher than that obtained in the study by El-sayed et al. (1), where 80.8% of pre-test mothers used natural water bottles more than once. Furthermore, Kasemsup and Neesanan (16) reported that 74.5% of their participants reused plastic bottles.
Plastic water bottles are usually made of polyethylene terephthalate (PET). The repeated use of such water bottles has a risk of bacterial or fungal growth inside the bottle and migration of chemicals from the inner surface of the bottle into water. Several compounds, including acetaldehyde, antimony, and phthalates, are suspected to leach from PET and lead to adverse health effects among consumers (26, 27).
Our results revealed that most participants (91.5%) use plastic wrap in variable frequencies to keep leftovers. Similarly, in a study involving 1,000 European citizens that evaluated awareness of the direct and indirect effects of plastics on human health, food packaging was the most commonly (n = 920, 92.5%) used modality of plastics (28). Additionally, Du Preez et al. (29) reported a high frequency of using plastic food packaging among South African young adults; 58.1% of the participants used it daily, and 23.0% used it more than once a week.
Regarding practice level, the majority of participants (77.2%) were occasional and frequent plastic users. Similarly, El-sayed et al. (1) found that 95.8% of pre-test Egyptian participants had improper practices regarding safe plastic use. Furthermore, Kasemsup and Neesanan (16) reported that most of their respondents usually use plastic for food and drinks.
In contrast to our findings, Vigneshwaran and Arun Kumar (22) reported high practice levels among participants, which could be attributed to the high basic knowledge of Indian people about plastic use.
Studying the relationship between participants' scores and their sociodemographic characteristics revealed that age and educational level significantly affected all scores (as the educational level increased, the scores increased). This is in agreement with El-Sayed et al. (1), who found that highly educated children's mothers had high mean knowledge, attitude, and practice scores regarding the safe use of plastic containers. We found that participants of younger ages had higher knowledge scores. This could be related to the fact that these ages are the most common users of the Internet and social media, as the participants reported these as the most frequent sources of information. For Facebook (the main social media platform in Egypt), 58.3% of users are in the 18–34 age group (30). This finding highlighted the importance of using Facebook to disseminate health education about the safe uses of plastic and the dangers of improper use and recycling. Furthermore, as reported by Filho et al. (31), factors such as educational background and age play a significant role in determining the level of engagement in reducing plastic usage and the actions undertaken. Any interventions aimed at reducing single-use plastics need to consider these factors.
Conclusion and recommendations
Based on the study findings, we conclude that the majority of the participants lacked satisfactory knowledge and followed improper practices regarding the safe use of plastic for food and drinks. Therefore, public awareness of appropriate plastic use for food and drinks should be raised. Initiatives for raising public awareness should be supported by various approaches that ensure easy accessibility of information. An efficient low-cost information approach could include the exhibition of banners about the safe uses of plastic for food and drinks and posting pamphlets that display numbers and symbols written on plastic containers near checkouts or cash registers in supermarkets and other retail establishments. Furthermore, television and radio can support broad information dissemination. In addition, continuous health education programs regarding the safe use of plastics should be provided by healthcare providers such as nurses, village health advisors, and midwives. Additionally, we recommend that health authorities, in collaboration with the food industry, evaluate, and regulate the use of plastics. Eventually, policies regulating materials used in plastic manufacture need to be reconsidered to safeguard consumers.
Study limitations
The current study findings should be viewed in light of the following limitations: The non-probability sampling technique was applied in the current research due to the difficulty of using probability sampling, especially because part of the research part was conducted online. Moreover, a small percentage of the study participants were older than 50 years, and most of them were young due to the frequent use of the Internet and social media among the young generation. However, the researchers conducted the current research to explore the situation in this new area of inquiry and to generate hypotheses, as no information is available about the current research question in Egypt. The intent was not to generalize the study's findings.
Data availability statement
The raw data supporting the conclusions of this article will be made available by the authors, without undue reservation.
Ethics statement
The studies involving human participants were reviewed and approved by National Cancer Institute. The patients/participants provided their written informed consent to participate in this study.
Author contributions
FH conceived the study. MMA contributed to the literature searches and data management. EE and MS contributed to the data analysis and writing of the results. MAbdels, MAbdelm, and ME contributed to the data collection and writing. All authors participated in data collection, drafting, and approving the final manuscript, and they contributed to the article and approved the submitted version.
Conflict of interest
The authors declare that the research was conducted in the absence of any commercial or financial relationships that could be construed as a potential conflict of interest.
Publisher's note
All claims expressed in this article are solely those of the authors and do not necessarily represent those of their affiliated organizations, or those of the publisher, the editors and the reviewers. Any product that may be evaluated in this article, or claim that may be made by its manufacturer, is not guaranteed or endorsed by the publisher.
References
1. El-sayed Y, Marzouk SA, Mahmoud TM, El Magrabi NM. Effectiveness of educational intervention on knowledge, attitude and practices of children's mothers regarding the safe use of plastic containers. Am J Nurs Res. (2019) 7:723–731. doi: 10.12691/ajnr-7-5-6
2. UNIDO. Study on plastic value chain in Egypt. (2021). Available online at: https://www.unido.org/sites/default/files/files/2022-01/Plastic_value_chain_in_Egypt.pdf (accessed December 2022).
3. Nourbakhsh S, Afzal-Aghaee M, Salmani ER, Naderi M, Zangi R, Feizi R. Knowledge and behavior assessment about the use of disposable plastic containers amongst medical sciences students in northeastern Iran in 2016. Iranian J Health, Safety Environ. (2017) 4:804–11.
4. Rutkowska A, Rachoń D. Bisphenol A (BPA) and its potential role in the pathogenesis of the polycystic ovary syndrome (PCOS). Gynecol Endocrinol. (2014) 30:260–5. doi: 10.3109/09513590.2013.871517
5. Akin L, Kendirci M, Narin F, Kurtoglu S, Hatipoglu N, Elmali F. Endocrine disruptors and polycystic ovary syndrome: phthalates. J Clin Res Pediatr Endocrinol. (2020) 12:393–400. doi: 10.4274/jcrpe.galenos.2020.2020.0037
6. Liao KW, Kuo PL, Huang HB, Chang JW, Chiang HC, Huang PC. Increased risk of phthalates exposure for recurrent pregnancy loss in reproductive-aged women. Environ Pollut. (2018) 241:969–77. doi: 10.1016/j.envpol.2018.06.022
7. Kim KY, Lee E, Kim Y. The association between bisphenol a exposure and obesity in children-a systematic review with meta-analysis. Int J Environ Res Public Health. (2019) 16:2521. doi: 10.3390/ijerph16142521
8. Gao H, Yang BJ Li N, Feng LM, Shi XY, Zhao WH, Liu SJ. Bisphenol A and hormone-associated cancers: current progress and perspectives. Medicine (Baltimore). (2015) 94:e211. doi: 10.1097/MD.0000000000000211
9. Chuang SC, Chen HC, Sun CW, Chen YA, Wang YH, Chiang CJ, et al. Phthalate exposure and prostate cancer in a population-based nested case-control study. Environ Res. (2020) 181:108902. doi: 10.1016/j.envres.2019.108902
10. Weber Macena M, Carvalho R, Cruz-Lopes LP, Guiné RPF. Plastic food packaging: perceptions and attitudes of Portuguese consumers about environmental impact and recycling. Sustainability. (2021) 13:9953. doi: 10.3390/su13179953
11. Praveena BG. A study to assess the knowledge regarding health hazards of plastic in domestic use and attitude toward the use of alternatives in women residing at Mohan Kumar Nagar, Bengaluru. Int J Nur Med Invest. (2019) 4:50–3. doi: 10.31690/ijnmi/50
12. Srinivasan N, Swarnapriya V. Assessment of knowledge and practice on plastics among the professional course students of Annamalai University, Tamil Nadu. Int J Commun Med Public Health. (2019) 6:510–4. doi: 10.18203/2394-6040.ijcmph20190099
14. Eysenbach G. Improving the quality of web surveys: the checklist for reporting results of internet E-surveys (CHERRIES). J Med Internet Res. (2004) 6:e34. doi: 10.2196/jmir.6.3.e34
15. Cuschieri S. The STROBE guidelines. Saudi J Anaesth. (2019) 13:S31–4. doi: 10.4103/sja.SJA_543_18
16. Kasemsup R, Neesanan N. Knowledge, attitudes and practices relating to plastic containers for food and drinks. J Med Assoc Thai. (2011) 94 Suppl 3:S121–5.
17. Carlson VR, Boyd KM, Webb DJ. The revision of the Declaration of Helsinki: past, present, and future. Br J Clin Pharmacal. (2004) 57:695–713. doi: 10.1111/j.1365-2125.2004.02103.x
18. Coco Chin KK, Mahanta J, Nath TK. Knowledge, attitude, and practices toward plastic pollution among malaysians: implications for minimizing plastic use and pollution. Sustainability. (2023) 15:1164. doi: 10.3390/su15021164
19. Kaur S, Jeganathan J, Kaur M. Effectiveness of structured teaching programme on knowledge regarding health hazards of plastic use among students -a Quasi experimental study. Nurs Health Care Int J. (2019) 3:000180. doi: 10.23880/NHIJ-16000180
20. Samuel OO. Health hazard of plastic: assessing the knowledge level among street food sellers and customers in Delta State, Nigeria. J Biol Agric Healthcare. (2018) 8:7–13.
21. Hamza WS, Mahmoud SR. A community-based cross-sectional study exploring knowledge, attitude, and practice of adults towards the use and hazards of plastic products. Egyptian J Commun Med. (2023) 41:101–10. doi: 10.21608/ejcm.2022.157402.1232
22. Vigneshwaran R, Arun kumar B. Knowledge attitude and practice on plastic usage among the residents of Tiruchirappalli municipal corporation, Tamil Nadu -A descriptive study IOSR. J Human Soc Sci. (2014) 12:33–9.
23. Irby C. Which Plastics Are FDA Compliant for Food Storage? (2020). Available online at: https://www.plascene.com/which-plastics-are-fda-compliant-for-food-storage (accessed December 2022).
24. Bhasin V, Kirandeep Kaur Dhaliwal S, Gautam A. Assessment of the knowledge and attitude regarding plastic use and its health effects among nursing students of selected nursing colleges of Ambala, Haryana. Medico-legal Update. (2021) 21:2479. doi: 10.37506/mlu.v21i1.2479%20
25. Alharbi MH, Mumena WA, Hammouda SA. Use of plastics with hot food among saudi pregnant women is associated with increased concentrations of A1C, thyroid-stimulating hormone, and homocysteine and decreased concentrations of vitamins and minerals. Nutrients. (2020) 12:2609. doi: 10.3390/nu12092609
26. Astolfi ML, Castellani F, Avino P, Antonucci A, Canepari S, Protano C, et al. Reusable water bottles: release of inorganic elements, phthalates, and bisphenol A in a “Real Use” simulation experiment. Separations. (2021) 8:1–13. doi: 10.3390/separations8080126
27. Mortula MM. Health risk assessment of PET bottles in GCC. Int Scholarly Sci Res Innov. (2013) 7:276–2.
28. Barbir J, Leal Filho W, Salvia AL, Fendt MTC, Babaganov R, Albertini MC, et al. Assessing the levels of awareness among European citizens about the direct and indirect impacts of plastics on human health. Int J Environ Res Public Health. (2021) 18:3116. doi: 10.3390/ijerph18063116
29. Du Preez M, Van der Merwe D, Wyma L, Ellis SM. Assessing knowledge and use practices of plastic food packaging among young adults in South Africa: concerns about chemicals and health. Int J Environ Res Public Health. (2021) 18:10576. doi: 10.3390/ijerph182010576
30. Facebook users in Egypt in May. (2022). Available online at: https://napoleoncat.com/stats/facebook-users-in-egypt/2022/05/ (accessed December 2022).
Keywords: plastic containers, knowledge, attitude, practice, survey, Egypt
Citation: Hassan FM, El Desouky ED, Salem MR, Abdelsabour MA, Abdelmoneim MA, Elsaieed MM and Ali MM (2023) Plastic use for food and drinks and related knowledge, attitudes, and practices among a sample of Egyptians. Front. Public Health 11:1146800. doi: 10.3389/fpubh.2023.1146800
Received: 19 January 2023; Accepted: 23 August 2023;
Published: 28 September 2023.
Edited by:
Hossein Shahnazi, Isfahan University of Medical Sciences, IranReviewed by:
Rafael Moreno-Gómez-Toledano, University of Alcalá, SpainAdriana Izquierdo, Rey Juan Carlos University, Spain
Copyright © 2023 Hassan, El Desouky, Salem, Abdelsabour, Abdelmoneim, Elsaieed and Ali. This is an open-access article distributed under the terms of the Creative Commons Attribution License (CC BY). The use, distribution or reproduction in other forums is permitted, provided the original author(s) and the copyright owner(s) are credited and that the original publication in this journal is cited, in accordance with accepted academic practice. No use, distribution or reproduction is permitted which does not comply with these terms.
*Correspondence: Marwa Rashad Salem, bXI4MDAwMjAwMEBrYXNyYWxhaW55LmVkdS5lZw==; bXI4MDAwMjAwMEBjdS5lZHUuZWc=