 Jian Huang
 Rong Li2†
 Zhirong Liu
- 1Department of Neurology, Xijing Hospital, Airforce Military Medical University, Xi'an, Shaanxi, China
- 2Department of Nephrology, Xijing Hospital, Airforce Military Medical University, Xi'an, Shaanxi, China
- 3Department of Neurology, Xianyang First People's Hospital, Xianyang, Shaanxi, China
- 4Department of Neurology, The Second People's Hospital of Shaanxi Province, Xi'an, Shaanxi, China
- 5Department of Neurology, Xi'an Daxing Hospital, Xi'an, Shaanxi, China
- 6Department of Neurology, Xi'an First Hospital, Xi'an, Shaanxi, China
Background and aims: Cognitive impairment is on the rise around the world, with profound economic and social consequences. Serum globulin, a marker of liver function, may also play a role in cognitive function. Unfortunately, no consistent conclusion exists regarding the association between serum globulin and cognitive function.
Methods: Data from the 2011 to 2014 National Health and Nutrition Examination Survey were used to assess the association between serum globulin and cognitive impairment. Cognitive function was assessed by three tests: Consortium to Establish a Registry for Alzheimer’s Disease (CERAD), Animal Fluency (AF), and Digit Symbol Substitution Test (DSST). Furthermore, the breakthrough point of cognitive impairment correlated with CERAD < 5, AF < 14, and DSST < 34. A weighted multiple logistics regression model was used to verify the association between serum globulin and cognitive impairment. Generalized additive models (GAMs) and a smooth curve fit (penalty spline method) were used to determine a non-linear relationship between serum globulin and cognitive impairment. Finally, subgroup analysis and interaction tests were conducted to further verify the association between serum globulin and cognitive impairment.
Results: Data from 2,768 participants aged ≥60 (in accordance with the study design) were collected for the final analysis. Data suggested that serum globulin levels were associated with an elevated cognitive impairment based on the AF [full adjustment, OR = 1.05, 95% CI: 1.01–1.08] and DSST [full adjustment, OR = 1.06, 95% CI: 1.02–1.10] tests. Eventually, the GAM and smooth curve fit model was conducted to confirm that the association between serum globulin and cognitive impairment was non-linear. Moreover, the inflection point was 27 g/L serum globulin based on the CERAD test and 35 g/L serum globulin based on the AF test. Finally, the interaction term between serum globulin and cognitive impairment based on the AF test indicated no significant interactions among all variables (all p for interaction >0.05).
Conclusion: The association between serum globulin levels and cognitive impairment is non-linear. A threshold effect exists between serum globulin and cognitive impairment. Large-scale prospective clinical trials are needed to validate our findings.
Introduction
While globalization is sweeping the world, aging is also quietly hitting the world (1). Aging aggravates the prevalence of cognitive impairment (2). The most intuitive feeling is a sharp increase in the number of patients with cognitive impairment (3). Consequences of cognitive dysfunction include memory decline, reduced social mobility, and spatial cognitive impairment (4, 5). The disease specificity of cognitive impairment has brought serious economic and social burdens to society, especially in low-income countries (6, 7). A report estimated that the number of dementia cases will reach 150 million globally by 2050 (8). This figure is also very significant in the United States (US), which is estimated to be as high as 13.8 million by 2060 (9). This will pose serious economic and social challenges (10). Effective treatment methods and interventions will be worth investigating (4). Unfortunately, the current interventions have limited efficacy (11). Early prevention including identification of risk and protective factors may be an effective pathway (12–15).
Risk and protective factors of cognitive dysfunction and beneficial diet are important research directions and breakthroughs (4, 16–18). In recent years, serum globulin as a liver function marker has been used to predict other diseases such as stroke, ulcerative colitis, atrial fibrillation, rheumatoid arthritis, nasopharyngeal carcinoma, and hepatitis C virus and now it has become a hot spot of theoretical research (19–24). The relationship between serum globulin and cognitive function is also a current research hot spot (25–28). Data showed that serum globulin is related to cognitive function (29). However, Serum ApoB activity might relate to cognitive decline rather than serum globulin (30). Another research confirmed that there was a correlation between cognitive decline and serum albumin/globulin ratio (A/G ratio) (31).
Considering that existing studies do not fully understand the association between serum globulin and cognitive function, we consulted the National Health and Nutrition Examination Survey (NHANES) data analysis from 2011 to 2012 and 2013 to 2014 to verify the association between serum globulin and cognitive impairment in older American adults. To the best of our knowledge, this is the first study to determine the association between serum globulin and cognitive impairment based on clinical public data.
Methods
Study population
We extracted data from NHANES (2011–2012 and 2013–2014). The NHANES public database launched by the U.S. Centers for Disease Control and Prevention (CDC) is designed to evaluate the health status and nutrition level of the United States population, releasing data on a 2-year cycle (32–36). To date, thousands of secondary analyses have been performed globally based on NHANES data. Including 2011–2012 (n = 9,756) and 2013–2014 (n = 10,175), a total of 19,931 Americans participated. We had the following exclusion criteria: (1) <60 years old (n = 16,299), (2) inability to complete cognitive function tests (n = 695), (3) inability to complete blood tests (n = 169). Thus, 2,768 participants were eventually included in the analysis (Figure 1). In this study, written informed consent was obtained from all study participants and the Research Ethics Review Committee of the National Center for Health Statistics. The secondary analysis of the public database NHANES does not require specific informed consent. This research, with a secondary analysis of NHANES, was based on the guidelines of Strengthening the Reporting of Observation Studies in Epidemiology (STROBE) (37).
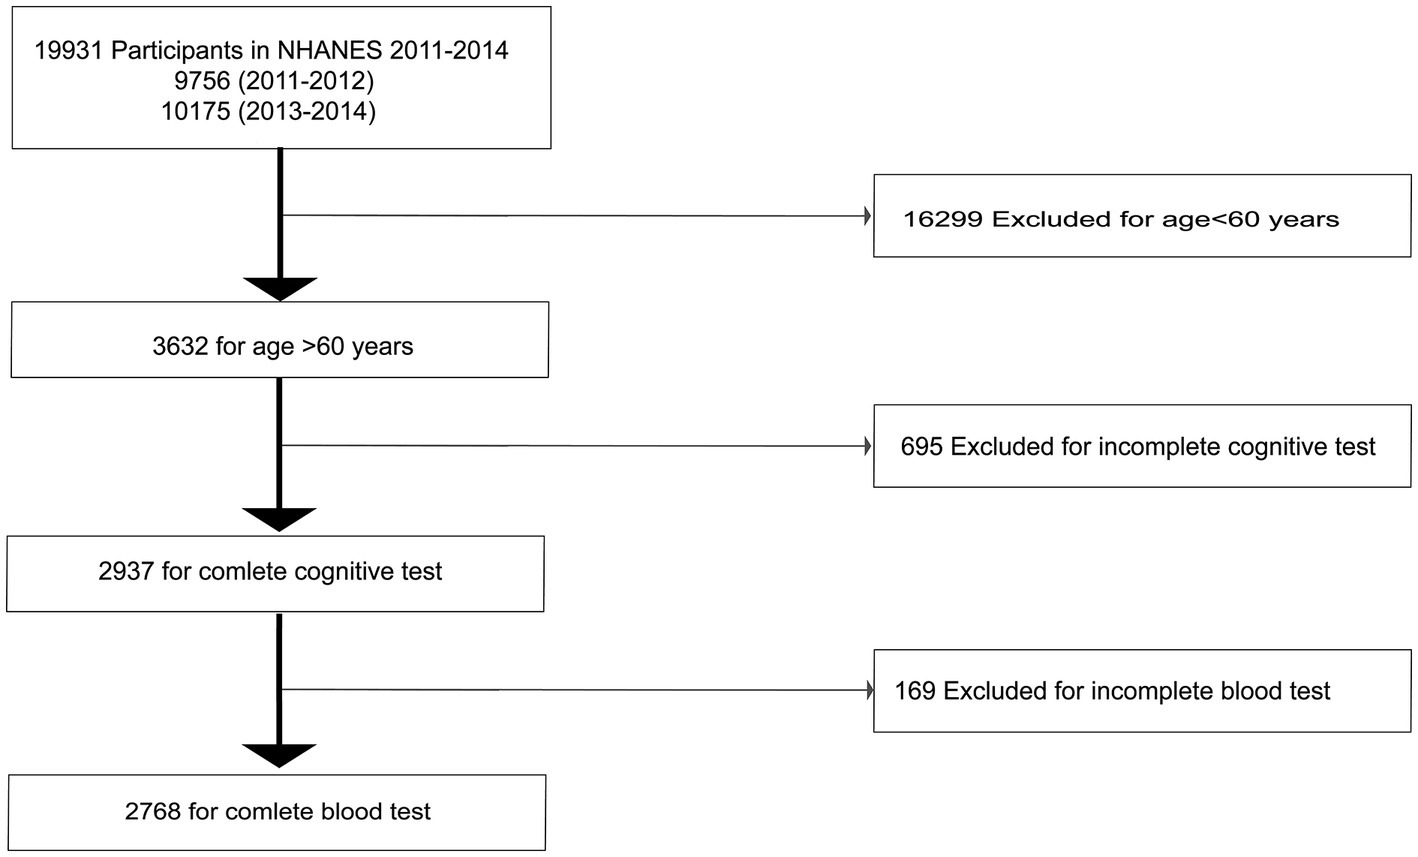
Figure 1. Flow chart showing the selection of study participants.
Primary exposure
In this study, we followed the guidelines in the NHANES Laboratory/Medical Technician Procedures Manual (LPM) for detailed specimen collection and processing instructions (38). Samples that needed to be tested were tested by the Collaborative Laboratory Services Department, and the samples for testing needed to be placed under specific conditions, such as the need to be packaged in vials and stored between 2 and 8°C. The value range of serum globulin was 14–65 g/L. In sensitive analysis, serum globulin was transferred into a categorical variable by quartile.
Outcome variable
The assessment of cognitive function, including working memory, delayed recall, and verbal fluency, was mainly conducted for American adults ≥60 years. The whole evaluation process was completed by the mobile detection center (MEC). Each participant recognized the recording quality and score of the completed examination.
The Consortium to Establish a Registry for Alzheimer’s Disease (CERAD) conducted research on new learning, recognition memory, and delayed recall. The CERAD Word Learning test (CERAD-WL) consists of three consecutive learning tests (39). During the assessment, after participants read 10 unrelated words aloud, they were instructed to recall as many words as they could from what they had just read. The total score of three trials was 30 points. The CERAD Delayed Recall (CERAD-DR) test asked participants to recall 10 words from the CERAD-WL test after completing other tests (16, 40).
Participants completed the Animal Fluency (AF) test, in which they were asked to name as many animals as possible within 1 min. Language fluency was judged during the test by the number of scores the participants named the animals (41). The operator used Digit Symbol Substitution Test (DSST) to evaluate participants’ working memory, processing speed, and continuous attention. The whole test was completed in 2 min. By copying the symbols of 133 boxes, the more correct the matching, the higher the score (42).
At present, in the published literature, the scoring criteria of cognitive impairment have not been completely unified. The dividing point of cognitive impairment is usually 25% of the total score (43). Consistent with the references, CERAD < 5, AF < 14, and DSST < 34 were considered to suffer cognitive impairment.
Covariates
We referred to the historical literature for possible confounding factors, which mainly included three factors: sociodemographic factors, lifestyle, health status, and laboratory tests.
Sex, age, race, education, marital status, and poverty-to-income ratios were included in sociodemographic factors. Ages were divided into three groups: 60–69, 70–79, and ≥ 80 years. Race included five groups: Mexican American/Other Hispanic, Non-Hispanic White, Non-Hispanic Black, Non-Hispanic Asian, and Other. The educational levels of the subjects were classified as below high school, high school, and above high school. Marital status was divided into married/living with a partner, widowed/divorced/separated, and never married. The poverty-to-income ratio included two states: <1 and > 1.
In addition, lifestyle included alcohol consumption (12 alcoholic drinks per year), smoking habits (at least 100 cigarettes), and vigorous work activity (yes or no) (44). Health status was divided according to the history of coronary heart disease, stroke, diabetes, hypertension, and high cholesterol. Body mass index (BMI) included three statuses: <25, 25–30, and > 30 kg/m2. A nine-question patient health questionnaire (PHQ9) was used to assess depressive status. Depression was defined as a score greater than 10 in historical literature (45). Laboratory tests included alanine aminotransferase (ALT), aspartate aminotransferase (AST), alkaline phosphatase (ALP), gamma-glutamyl transferase (GGT), total bilirubin, total protein, albumin, blood urea nitrogen (BUN), uric acid, and creatinine.
Statistical analysis
First, the two types of variables were expressed in different ways, in which continuous variables were described by weighted mean ± standard deviation, and differences were compared by one-way ANOVA. Conversely, weighted percentages were used to describe categorical variables and differences were compared by a chi-square test.
Second, in the current cross-sectional study, we used a weighted multivariate logistic regression model to effectively explore the association between serum globulin and cognitive impairment. Next, the model was fully adjusted in four areas: sociodemographic factors (sex, age, race, education level, marital status, and poverty-income ratio), lifestyle (alcohol consumption, smoking habit, and vigorous work activity), health status (BMI, depressive, and the history of coronary heart disease, stroke, diabetes, hypertension, and high cholesterol), and laboratory tests (ALT, AST, GGT, ALP, BUN, total bilirubin, total protein, albumin, creatinine, and uric acid). Whereas the minor model was just adjusted in three variables: sex, age, and race.
Third, we constructed generalized additive models (GAMs) and a smooth curve fit (penalty spline method) to detect any non-linear relationship between serum globulin and cognitive impairment. The linear fitting model (linear regression model) is significantly different from the non-linear fitting model (two-piecewise linear regression model) based on the p value of the log-likelihood ratio test <0.05. A two-piecewise linear regression model was suitable to evaluate the non-linear relationship between serum globulin and cognitive impairment. Moreover, a recursive algorithm method was used to automatically calculate threshold or inflection points.
Finally, we conducted subgroup analysis and interaction terms to verify the result. We divided each continuous variable into three groups in subgroup analysis. Furthermore, except for the subgroup variable itself, all variables were adjusted in the subgroup analysis.
Moreover, to more sensitively determine the association between serum globulin and cognitive impairment, serum globulin was transferred into a categorical variable by quartile and was assessed by p value for trend.
All statistical analyses were completed by R software,1 EmpowerStats (http://www.empowerstats.com, X&Y Solutions, Inc., United States). We employed a full-sample 4-year MEC exam weighted to ensure that the survey was representative of all older adults. A bilateral test was performed, and p < 0.05 confirmed a statistically significant difference.
Results
Characteristics of study participants
Participants from 2011 to 2014 in NHANES were included in this study, and 2,768 participants over the age of 60 met the study design and entered the final statistical analysis. The overall characteristics of all study populations are statistically analyzed in Table 1, which is the quartile of serum globulin. First, the distribution of cognitive impairment for the primary outcome measure was that in all samples, 21.13% of CERAD < 5, 21.19% of AF < 14, and 14.54% of DSST < 34. Except for three variables, namely, age, smoking history, and coronary heart disease history (p > 0.05), the differences of other variables in serum globulin after quartile grouping were statistically significant. First, higher levels of serum globulin were found in women aged 60–69 years old with a BMI > 30 and a history of coronary heart disease, stroke, diabetes, and hypertension. However, lower levels of serum globulin were associated with the following factors: non-Hispanic White, above high school, married/living with a partner, poverty-income ratio > 1, alcohol, BMI 25–30, and history of high cholesterol.
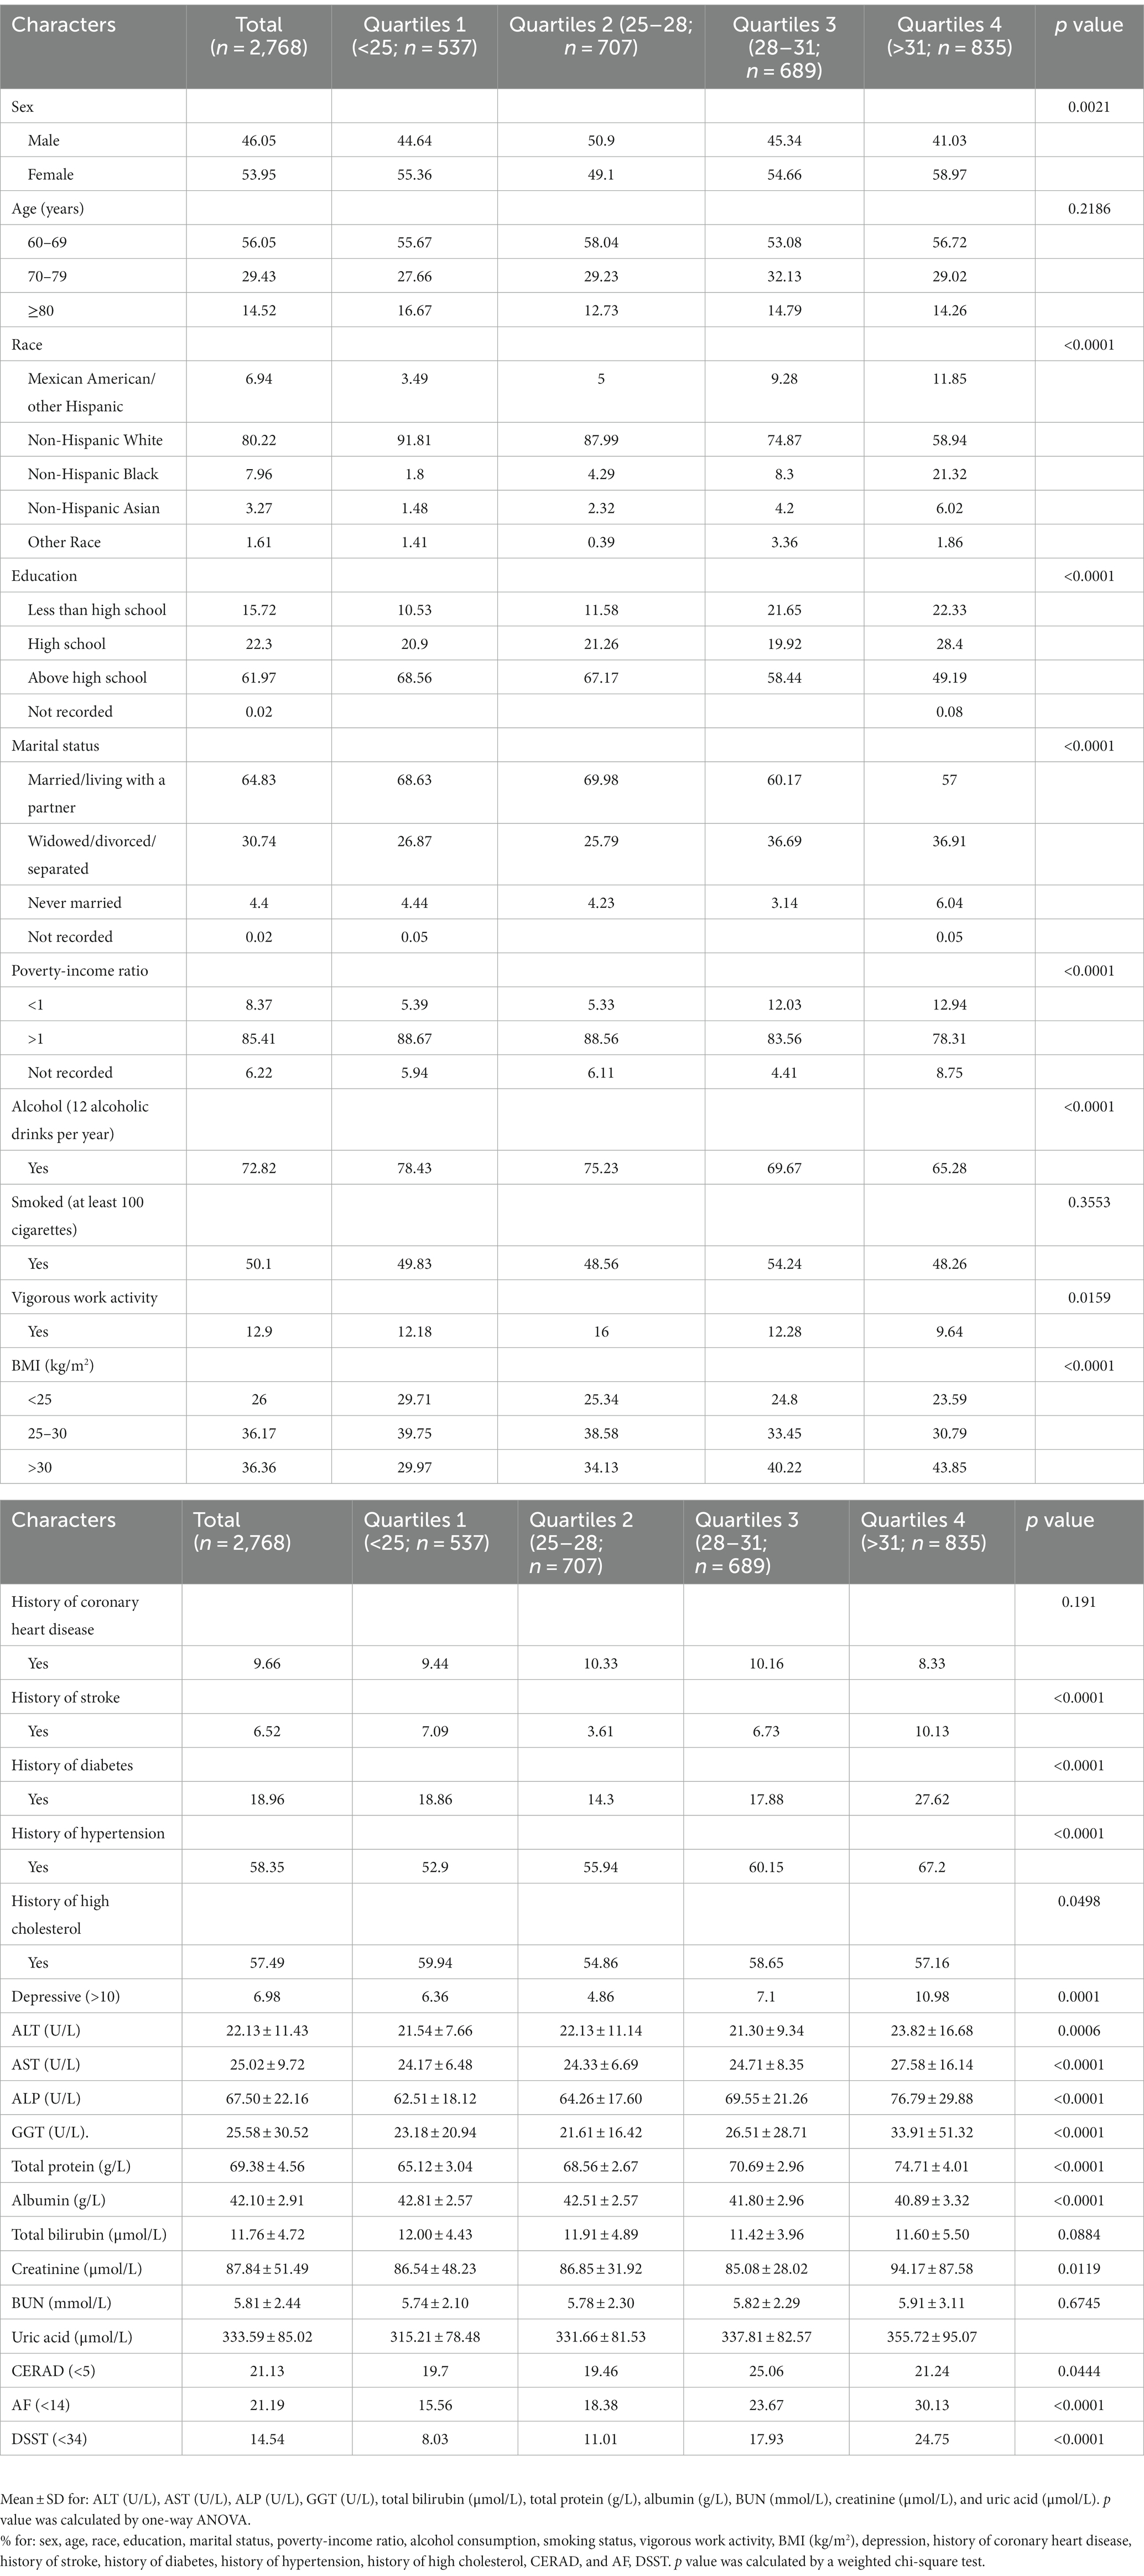
Table 1. General characteristics of participants (n = 2,768) stratified by serum globulin (1–4, g/L) in the NHANES 2011–2014.
Association between serum globulin and cognitive impairment
The association between serum globulin and cognitive impairment based on the CERAD, AF, and DSST tests is shown in Table 2. Three multivariate logistical regression models were applied to evaluate the association between serum globulin and cognitive impairment: model 1 (non-adjusted model), model 2 (minor adjusted model), and model 3 (fully adjusted model).
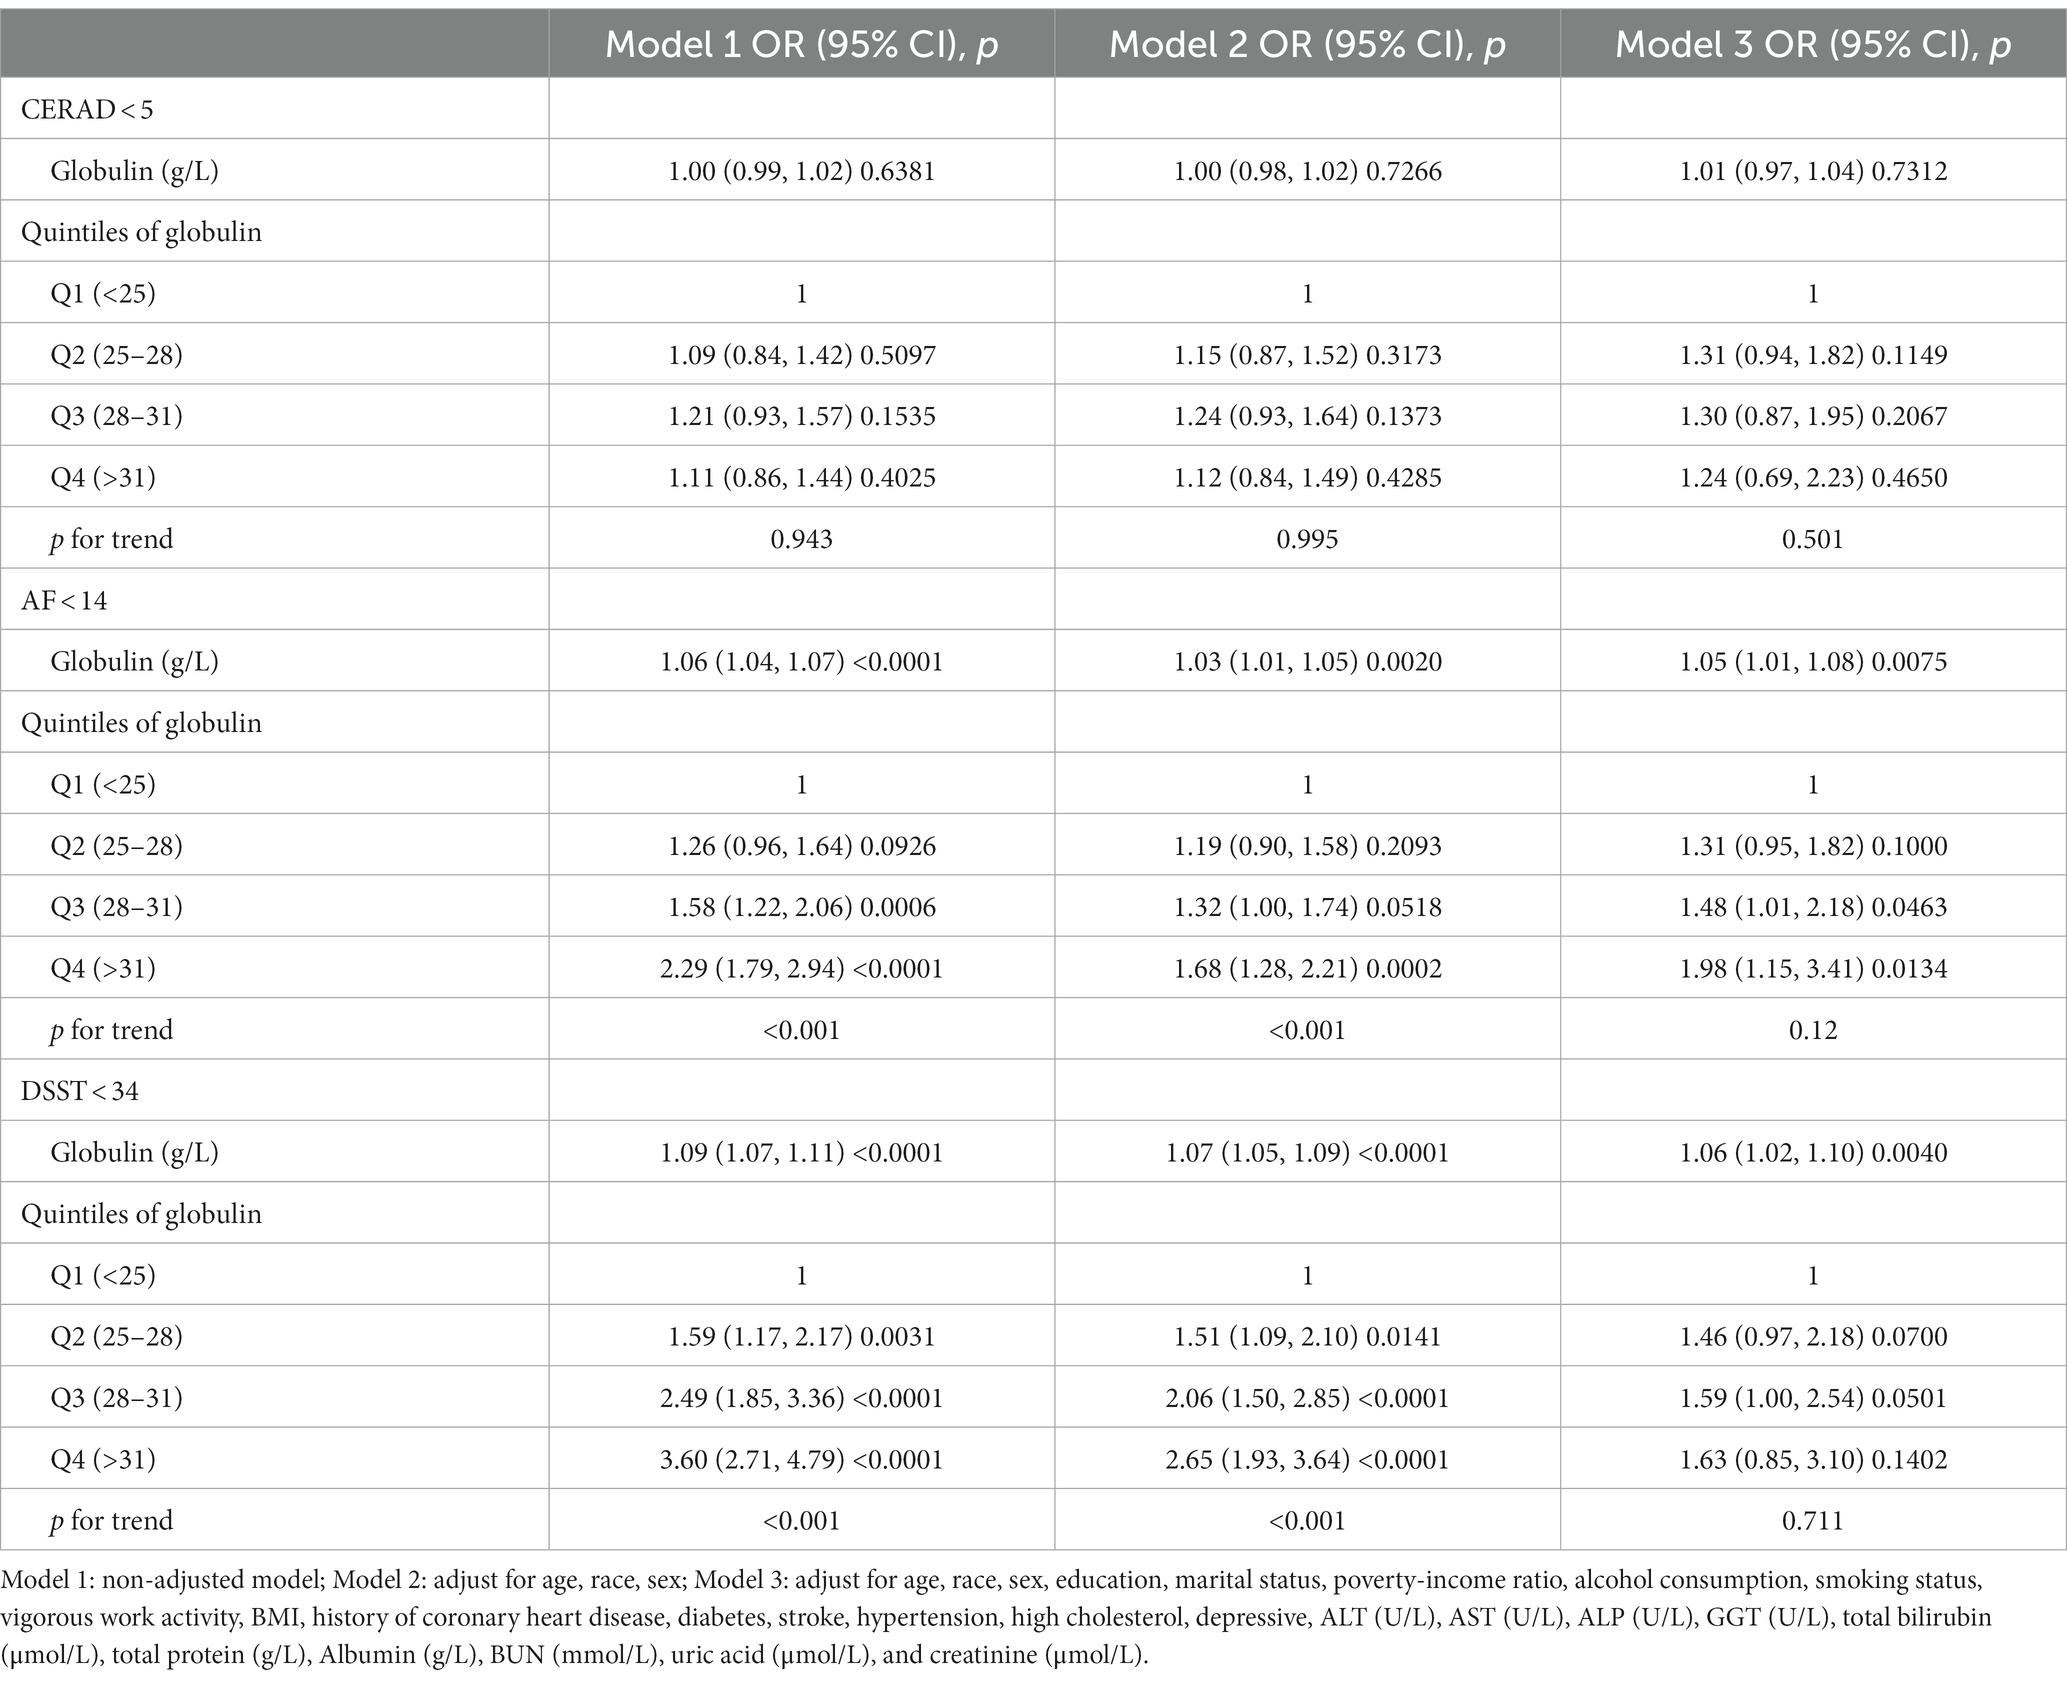
Table 2. Associations between serum globulin (g/L) and cognitive impairment (CERAD <5, AF <14, and DSST <34; n = 2,768), NHANES 2011–2014.
First, a statistically significant difference was not present in each model between serum globulin and cognitive impairment based on the CERAD test.
Second, a statistically significant difference was shown in each model between serum globulin and elevated risk of cognitive impairment based on the AF test. In the non-adjust model, the OR with 95% CI was 1.06 (1.04, 1.07), and AF in Q3-Q4 [Q3: OR = 1.58, 95% CI: 1.22–2.06, Q4: OR = 2.29, 95% CI: 1.79–2.94]. After adjusting for age, sex, and race, statistically significant differences existed between serum globulin and elevated risk of cognitive impairment [OR = 1.03, 95% CI: 1.01–1.05] and AF in Q4 [Q4: OR = 1.68, 95% CI: 1.28–2.21]. A fully adjusted model also showed a statistically significant difference between serum globulin and cognitive impairment [OR = 1.05, 95% CI: 1.01–1.08].
Third, statistically significant differences were identified in each model between serum globulin and elevated risk of cognitive impairment based on the DSST test [full adjustment, OR = 1.06, 95% CI: 1.02–1.10].
Identification of non-linear relationship
The GAM was conducted to assess whether there was a non-linear relationship between serum globulin and cognitive impairment (Figure 2). After full adjustment, results showed that the association between serum globulin and cognitive impairment was non-linear based on the CERAD and AF tests.
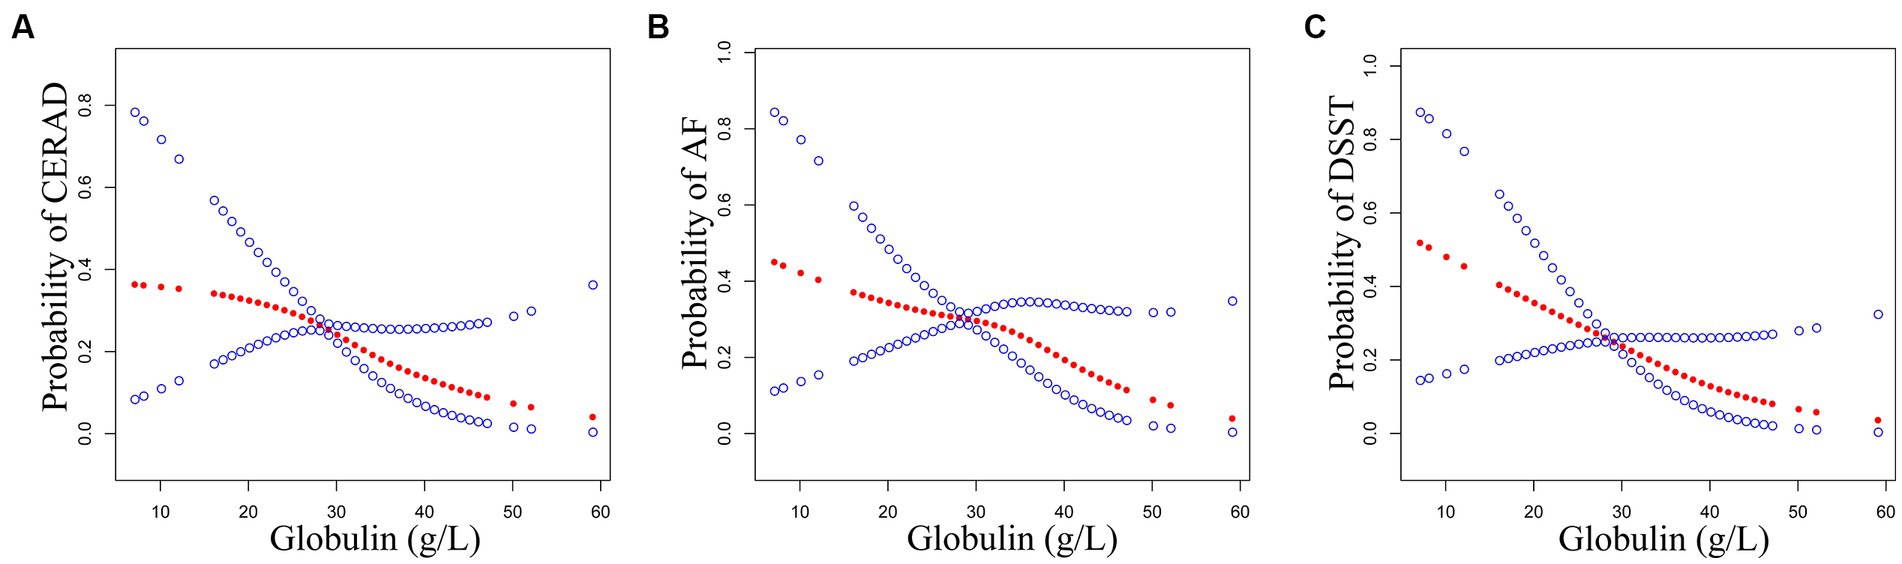
Figure 2. Association between serum globulin (g/L) and cognitive impairment. The probability of CERAD (A), AF (B), and DSST (C) represent the probability of cognitive impairment by GAM and smooth curve fit. The red points show a smooth curve fitting line and the blue points show a 95% confidence interval. The relationship adjusted for age, race, sex, education, marital status, poverty-income ratio, alcohol consumption, smoking status, vigorous work activity, BMI, history of coronary heart disease, diabetes, stroke, hypertension, high cholesterol, depression, ALT (U/L), AST (U/L), ALP (U/L), GGT (U/L), total bilirubin (μmol/L), total protein (g/L), Albumin (g/L), BUN (mmol/L), uric acid (μmol/L), and creatinine (μmol/L).
Adopting a weighted two-piecewise linear regression model and a recursive algorithm method, confirmed the turning point was 27 g/L based on the CERAD test (Table 3). On the left of the turning point or less than 27 g/L, the OR value and 95% CI were 1.07 and (1.00, 1.14; p = 0.0392), respectively. On the right of the inflection point or more than 27 g/L, the OR value and 95% CI were 0.98 and (0.94, 1.02), respectively.
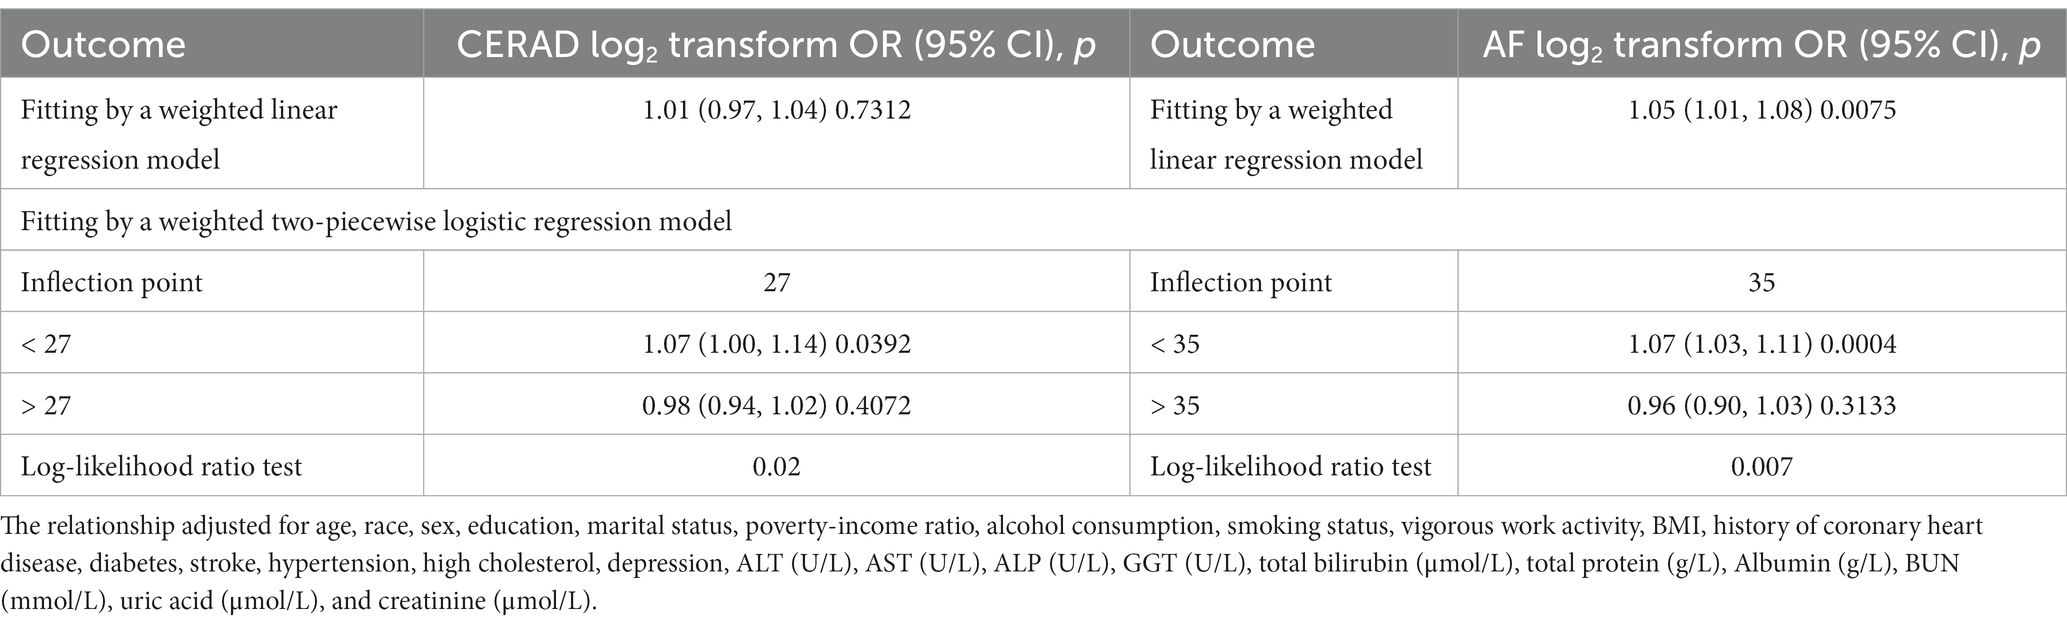
Table 3. Nonlinearity addressing by weighted two-piecewise linear model based on CERAD and AF tests.
Using a weighted two-piecewise linear regression model and a recursive algorithm method, data indicated that the inflection point was 35 g/L based on the AF test (Table 3). On the left of the turning point, OR with 95% CI were 1.07 and (1.03, 1.11; p = 0.0004). On the right of the turning point or more than 35 g/L, OR value and 95% CI were 0.96 and (0.90, 1.03), respectively.
Subgroup analyses outcomes
Table 4 presents the subgroup analysis and interaction results based on the CERAD, AF, and DSST tests.
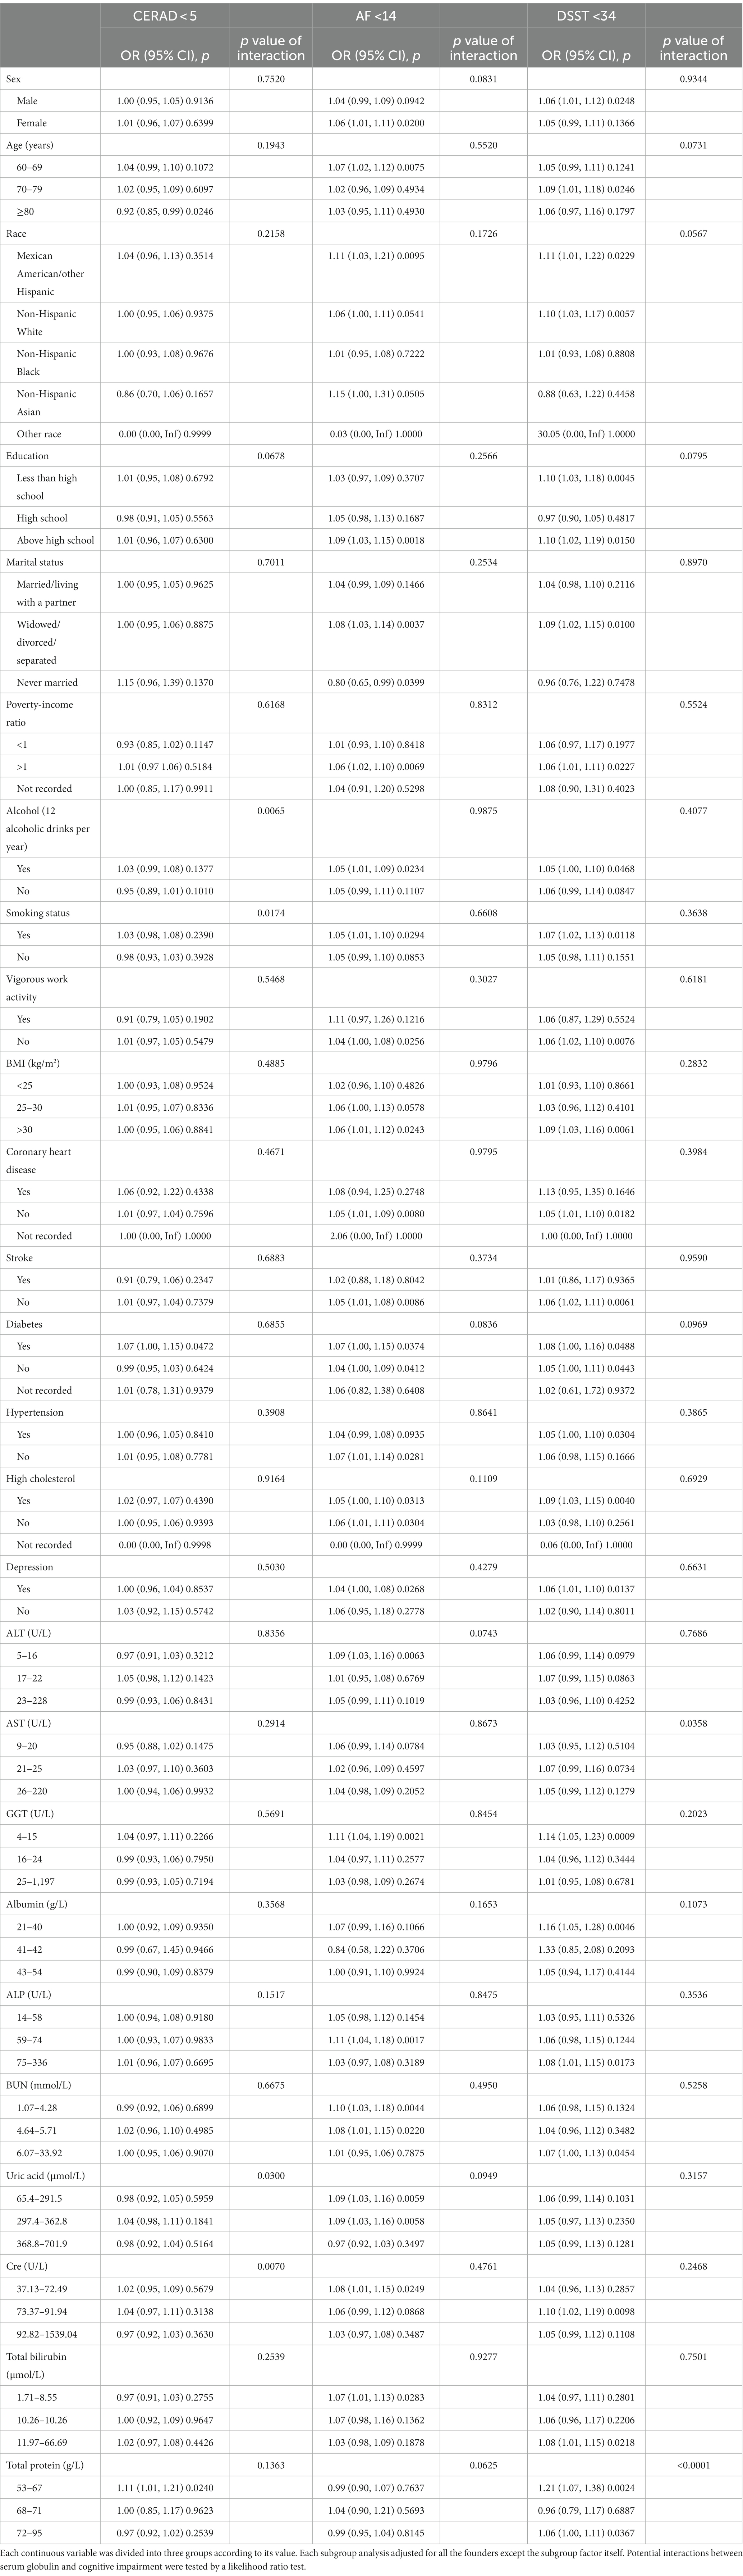
Table 4. Subgroup analysis of all variables and interaction tests.
First, interaction term results revealed a significant difference for smokers, alcohol users, and participants that reported high creatinine between serum globulin and cognitive impairment based on the CERAD test (all p for interaction <0.05). Subgroup analysis terms based on the CERAD test suggested that participants aged ≥80 years, those with diabetes, and 53–67 g/L total protein levels were associated with an increased risk of cognitive impairment (all p < 0.05).
Second, the interaction term between serum globulin and cognitive impairment based on the AF test indicated no significant interactions among all variables (all p for interaction >0.05). Moreover, subgroup analyses based on the AF test confirmed that participants who were aged 60–69 years old, women, or Mexican American/other Hispanic, educated above high school, widowed/divorced/separated, and never married, those with a poverty-income ratio > 1, those who consumed alcohol, performed no vigorous work activity, had no history of coronary heart disease or stroke, had diabetes, high cholesterol levels, depression, or those who had 4–15 U/L GGT, 59–74 U/L ALP, 1.07–5.71 mmol/L BUN, 65.4–362.8 μmol/L uric acid, 37.13–72.49 U/L creatinine, and 1.71–8.55 μmol/L total bilirubin had a significantly increased risk of cognitive impairment (all p < 0.05).
Third, interaction terms based on a DSST test between serum globulin and cognitive impairment were significant for total protein (p for interaction <0.05). Subgroup analysis terms based on the DSST test revealed that participants who were men, 70–79 years old, Mexican American/other Hispanic, Non-Hispanic White, educated to less than high school, educated above high school, widowed/divorced/separated, poverty-income ratio > 1, consumed alcohol, smoked, performed no vigorous work activity, had a BMI >30, had no coronary heart disease, had no stroke, had diabetes, had high cholesterol, had depression, or had 4–15 U/L GGT, 21–40 g/L albumin, 75–336 U/L ALP, 25–1,197 U/L GGT, 6.07–33.92 mmol/L BUN, 73.37–91.94 U/L creatinine, 11.97–66.69 μmol/L total bilirubin, 72–95 g/L total protein, and 53–67 g/L total protein had a significantly increased risk of cognitive impairment (all p < 0.05).
Discussion
To the best of our knowledge, this is the first study to use the public sample data from 2011 to 2014 in the NHANES database to understand the association between serum globulin and cognitive impairment. At the same time, this study also conducted a beneficial exploration of the correlation between liver function and cognitive function. After adjusting for all possible confounding factors, serum globulin was associated with an elevated risk of cognitive impairment in the AF and DSST tests. Moreover, we used GAM and the smooth curve fit model to verify that this association between serum globulin and cognitive impairment is non-linear. There is an obvious serum globulin threshold of 27 g/L based on the CERAD test and 35 g/L based on the AF test. Our study differs from most previous studies in that we are the first to demonstrate the association between serum globulin and cognitive impairment.
In 2018, Frith et al. applied NHANES data to confirm the effect of physical activity on cognitive function, and their results revealed that an elevated gamma gap existed in the relationship. Gamma gaps indicate high serum globulin concentrations. All data indirectly confirmed that globulin proteins may correlate with cognitive function (46). Another study demonstrated that lower serum globulin and a higher albumin/globulin ratio were associated with increased gray matter volume in the olfactory cortex and parahippocampal gyrus (29). Our results are consistent with those of previous studies. Maeda et al. reported that the serum albumin/globulin ratio was correlated with cognitive function in 1,827 Japanese older adults. However, serum albumin and globulin levels were not associated with cognitive function (31). Zhao et al. confirmed whether cognitive function was correlated to liver function. Data demonstrated that only serum ApoB activity, rather than serum globulin levels, may be associated with cognitive deficits (30). Another study revealed that the A/G ratio was the only factor that significantly lowered cognitive decline risk (27).
Compared with the recent literature, the present study has some main advantages. First, the large sample size may be more statistically significant in exploring the effect of serum globulin on cognitive impairment. This study included 2,768 older adults to better study the effect of serum globulin levels on cognitive function. Second, this study eliminated different categories of missing data to decrease the potential impact of missing data. Third, as many confounding factors as possible were included, including the participants’ chronic disease history and depression status, and three mainstream experiments were adopted to evaluate cognitive function. Finally, the non-linear relationship between serum globulin levels and cognitive impairment was verified using a smooth curve fitting model, and the serum globulin threshold level was confirmed via threshold analysis.
However, this study had some limitations, which might have affected its outcomes. First, a causal relationship between serum globulin and cognitive impairment is difficult to distinguish, which is determined via the inherent characteristics of cross-sectional studies. Second, the NHANES study population was limited to Americans, so the generalizability of our results is geographically limited. Third, some older adults with potential cognitive impairment might have been excluded due to their inability to complete the interviews for cognitive function assessment.
Conclusion
The association between serum globulin and cognitive impairment is non-linear. A threshold effect was confirmed between serum globulin levels and cognitive impairment. Larger prospective clinical trials such as cohort studies and Mendelian analysis based on the association between serum globulin and cognitive impairment are needed in the future to confirm the current results.
Data availability statement
The original contributions presented in the study are included in the article/supplementary material, further inquiries can be directed to the corresponding author.
Ethics statement
The studies involving humans were approved by Research Ethics Review Committee of the National Center for Health Statistics. The studies were conducted in accordance with the local legislation and institutional requirements. The participants provided their written informed consent to participate in this study. The manuscript presents research on animals that do not require ethical approval for their study.
Author contributions
JH and ZL planned and executed the studies, data analysis, and drafted the manuscript. RL processed and analysis the data. HZ and DH have made great efforts to revise the manuscript. WL conceived the item. JW facilitated design and analysis of the experiments. All authors contributed to the article and approved the submitted version.
Funding
The study was funded by the National Natural Science Foundation of China (81471197 and 81070950).
Conflict of interest
The authors declare that the research was conducted in the absence of any commercial or financial relationships that could be construed as a potential conflict of interest.
Publisher’s note
All claims expressed in this article are solely those of the authors and do not necessarily represent those of their affiliated organizations, or those of the publisher, the editors and the reviewers. Any product that may be evaluated in this article, or claim that may be made by its manufacturer, is not guaranteed or endorsed by the publisher.
Footnotes
References
1. Allen, DH, and Loughan, AR. Impact of cognitive impairment in patients with gliomas. Semin. Oncol. Nurs. (2018) 34:528–46. doi: 10.1016/j.soncn.2018.10.010
2. Boyle, PA, Wang, T, Yu, L, Wilson, RS, Dawe, R, Arfanakis, K, et al. The “cognitive clock”: a novel indicator of brain health. Alzheimers Dement. (2021) 17:1923–37. doi: 10.1002/alz.12351
3. Ballarín-Naya, L, Malo, S, and Moreno-Franco, B. Effect of physical exercise and diet based interventions on the evolution of cognitive impairment to dementia in subjects older than 45 years. a systematic review. Rev Esp Salud Publ. (2021) 95.
4. Abdullah, AH, Sharip, S, Rahman, AHA, and Bakar, L. Cognitive reserve in stroke patients. Psychiatry J. (2021) 10:444–52. doi: 10.1002/pchj.423
5. Nguyen, L, Murphy, K, and Andrews, G. Cognitive and neural plasticity in old age: a systematic review of evidence from executive functions cognitive training. Ageing Res. Rev. (2019) 53:100912. doi: 10.1016/j.arr.2019.100912
6. Bialystok, E . Bilingualism: pathway to cognitive reserve. Trends Cogn. Sci. (2021) 25:355–64. doi: 10.1016/j.tics.2021.02.003
7. Krug, A, Stein, F, and Kircher, T. Cognitive disorders in schizophrenia. Nervenarzt. (2020) 91:2–9. doi: 10.1007/s00115-019-00809-8
8. Revi, M . Alzheimer's Disease Therapeutic Approaches. Adv. Exp. Med. Biol. (2020) 1195:105–16. doi: 10.1007/978-3-030-32633-3_15
9. Warren, A . Behavioral and psychological symptoms of dementia as a means of communication: considerations for reducing stigma and promoting person-centered care. Front. Psychol. (2022) 13:875246. doi: 10.3389/fpsyg.2022.875246
10. Facal, D, Burgo, C, Spuch, C, Gaspar, P, and Campos-Magdaleno, M. Cognitive frailty: an update. Front. Psychol. (2021) 12:813398. doi: 10.3389/fpsyg.2021.813398
11. Song, Y, Wu, S, Zhou, K, and Liu, J. Editorial: cognitive neuro intelligence. Front. Comput. Neurosci. (2021) 15:718518. doi: 10.3389/fncom.2021.718518
12. Clare, L, Wu, YT, Teale, JC, Macleod, C, Matthews, F, Brayne, C, et al. Potentially modifiable lifestyle factors, cognitive reserve, and cognitive function in later life: a cross-sectional study. PLoS Med. (2017) 14:e1002259. doi: 10.1371/journal.pmed.1002259
13. Farokhi-Sisakht, F, Farhoudi, M, Sadigh-Eteghad, S, Mahmoudi, J, and Mohaddes, G. Cognitive rehabilitation improves ischemic stroke-induced cognitive impairment: role of growth factors. J. Stroke Cerebrovasc. Dis. (2019) 28:104299. doi: 10.1016/j.jstrokecerebrovasdis.2019.07.015
14. Grahek, I, Shenhav, A, Musslick, S, Krebs, RM, and Koster, EHW. Motivation and cognitive control in depression. Neurosci. Biobehav. Rev. (2019) 102:371–81. doi: 10.1016/j.neubiorev.2019.04.011
15. Vuralli, D, Ayata, C, and Bolay, H. Cognitive dysfunction and migraine. J Headache Pain. (2018) 19:109. doi: 10.1186/s10194-018-0933-4
16. Dong, X, Li, S, Chen, J, Li, Y, Wu, Y, and Zhang, D. Association of dietary ω-3 and ω-6 fatty acids intake with cognitive performance in older adults: National Health and nutrition examination Survey (NHANES) 2011-2014. Nutr. J. (2020) 19:25. doi: 10.1186/s12937-020-00547-7
17. Lövdén, M, Fratiglioni, L, Glymour, MM, Lindenberger, U, and Tucker-Drob, EM. Education and cognitive functioning across the life span. Psychol. Sci. Public Interest. (2020) 21:6–41. doi: 10.1177/1529100620920576
18. Morimoto, SS, Kanellopoulos, D, Manning, KJ, and Alexopoulos, GS. Diagnosis and treatment of depression and cognitive impairment in late life. Ann. N. Y. Acad. Sci. (2015) 1345:36–46. doi: 10.1111/nyas.12669
19. Piazza, M, Sagliocca, L, Tosone, G, Guadagnino, V, Stazi, MA, Orlando, R, et al. Sexual transmission of the hepatitis C virus and efficacy of prophylaxis with intramuscular immune serum globulin. A randomized controlled trial. Arch. Intern. Med. (1997) 157:1537–44. doi: 10.1001/archinte.1997.00440350037004
20. Shiraishi, K, Furukawa, S, Yagi, S, Mori, K, Ninomiya, T, Kawasaki, K, et al. Serum Globulin Is Associated with Endoscopic Findings and Mucosal Healing in Japanese Patients with Ulcerative Colitis. Dig. Dis. Sci. (2022) 67:233–40. doi: 10.1007/s10620-021-06834-5
21. Thomas, SE, Plumber, N, Venkatapathappa, P, and Gorantla, V. A review of risk factors and predictors for hemorrhagic transformation in patients with acute ischemic stroke. Int J Vasc Med. (2021) 2021:4244267. doi: 10.1155/2021/4244267
22. Zhong, LT, Wang, H, Liang, HQ, Su, MR, Liu, CD, and Wu, DH. An elevated pretreatment serum globulin level predicts a poor prognosis of nasopharyngeal carcinoma. Nan Fang Yi Ke Da Xue Xue Bao. (2016) 36:151–6.
23. Zhou, Q, Cao, H, Xu, Z, Lan, R, Chen, X, Wang, D, et al. Baseline serum globulin as a predictor of the recurrence of lone atrial fibrillation after radiofrequency catheter ablation. Anatol J Cardiol. (2017) 17:381–5. doi: 10.14744/AnatolJCardiol.2016.7393
24. Ziff, M, Brown, P, Lospalluto, J, Badin, J, and Mcewen, C. Agglutination and inhibition by serum globulin in the sensitized sheep cell agglutination reaction in rheumatoid arthritis. Am. J. Med. (1956) 20:500–9. doi: 10.1016/0002-9343(56)90134-6
25. Flanagan, EP, Mckeon, A, Lennon, VA, Boeve, BF, Trenerry, MR, Tan, KM, et al. Autoimmune dementia: clinical course and predictors of immunotherapy response. Mayo Clin. Proc. (2010) 85:881–97. doi: 10.4065/mcp.2010.0326
26. Kische, H, Gross, S, Wallaschofski, H, Grabe, HJ, Völzke, H, Nauck, M, et al. Associations of androgens with depressive symptoms and cognitive status in the general population. PLoS One. (2017) 12:e0177272. doi: 10.1371/journal.pone.0177272
27. Koyama, T, Kuriyama, N, Ozaki, E, Matsui, D, Watanabe, I, Miyatani, F, et al. Serum albumin to globulin ratio is related to cognitive decline via reflection of homeostasis: a nested case-control study. BMC Neurol. (2016) 16:253. doi: 10.1186/s12883-016-0776-z
28. Zheng, SN, Pan, L, Liao, AM, Hou, YC, Yu, GH, Li, XX, et al. Wheat embryo globulin nutrients ameliorate d-galactose and aluminum chloride-induced cognitive impairment in rats. Brain Res. (2021) 1773:147672. doi: 10.1016/j.brainres.2021.147672
29. Chen, J, Liu, S, Wang, C, Zhang, C, Cai, H, Zhang, M, et al. Associations of serum liver function markers with brain structure, function, and perfusion in healthy young adults. Front. Neurol. (2021) 12:606094. doi: 10.3389/fneur.2021.646817
30. Zhao, T, Zhai, C, Song, H, Wu, Y, Ge, C, Zhang, Y, et al. Methamphetamine-induced cognitive deficits and psychiatric symptoms are associated with serum markers of liver damage. Neurotox. Res. (2020) 37:67–76. doi: 10.1007/s12640-019-00115-w
31. Maeda, S, Takeya, Y, Oguro, R, Akasaka, H, Ryuno, H, Kabayama, M, et al. Serum albumin/globulin ratio is associated with cognitive function in community-dwelling older people: The Septuagenarians, Octogenarians, Nonagenarians Investigation with Centenarians study. Geriatr Gerontol Int. (2019) 19:967–71. doi: 10.1111/ggi.13751
32. Borrell, LN, and Talih, M. Examining periodontal disease disparities among U.S. adults 20 years of age and older: NHANES III (1988-1994) and NHANES 1999-2004. Public Health Rep. (2012) 127:497–506. doi: 10.1177/003335491212700505
33. Brownstein, NC, and Cai, J. Tests of trend between disease outcomes and ordinal covariates discretized from underlying continuous variables: simulation studies and applications to NHANES 2007-2008. BMC Med. Res. Methodol. (2019) 19:2. doi: 10.1186/s12874-018-0630-7
34. Liu, S, Pai, MP, and Lester, CA. Medication use among U.S. adults after bariatric surgery: a population-based analysis of NHANES 2015-2018. Diabetes Care. (2022) 45:e54–5. doi: 10.2337/dc21-2285
35. Mukherjee, S, Martins, D, Norris, KC, and Jenders, RA. A biomedical information system for retrieval and manipulation of NHANES data. Stud Health Technol Inform. (2013) 192:1148.
36. Rey-López, JP . Comment on: "Health Benefits of Light-Intensity Physical Activity: A Systematic Review of Accelerometer Data of the National Health and Nutrition Examination Survey (NHANES)". Sports Med. (2018) 48:747–8. doi: 10.1007/s40279-017-0826-8
37. Vandenbroucke, JP, Von Elm, E, Altman, DG, Gøtzsche, PC, Mulrow, CD, Pocock, SJ, et al. Strengthening the reporting of observational studies in epidemiology (STROBE): explanation and elaboration. PLoS Med. (2007) 4:e297. doi: 10.1371/journal.pmed.0040297
38. Myers, GL, Miller, WG, Coresh, J, Fleming, J, Greenberg, N, Greene, T, et al. Recommendations for improving serum creatinine measurement: a report from the Laboratory Working Group of the National Kidney Disease Education Program. Clin. Chem. (2006) 52:5–18. doi: 10.1373/clinchem.2005.0525144
39. Morris, JC, Heyman, A, Mohs, RC, Hughes, JP, Van Belle, G, Fillenbaum, G, et al. The consortium to establish a registry for alzheimer's disease (CERAD). Part I. clinical and neuropsychological assessment of Alzheimer's disease. Neurology. (1989) 39:1159–65. doi: 10.1212/wnl.39.9.1159
40. Sotaniemi, M, Pulliainen, V, Hokkanen, L, Pirttilä, T, Hallikainen, I, Soininen, H, et al. CERAD-neuropsychological battery in screening mild Alzheimer's disease. Acta Neurol. Scand. (2012) 125:16–23. doi: 10.1111/j.1600-0404.2010.01459.x
41. Prince, M, Acosta, D, Chiu, H, Scazufca, M, and Varghese, M. Dementia diagnosis in developing countries: a cross-cultural validation study. Lancet. (2003) 361:909–17. doi: 10.1016/S0140-6736(03)12772-9
42. Brody, DJ, Kramarow, EA, Taylor, CA, and Mcguire, LC. Cognitive performance in adults aged 60 and over: national health and nutrition examination survey, 2011-2014. Natl Health Stat Rep. (2019) 126:1–23.
43. Bailey, RL, Jun, S, Murphy, L, Green, R, Gahche, JJ, Dwyer, JT, et al. High folic acid or folate combined with low vitamin B-12 status: potential but inconsistent association with cognitive function in a nationally representative cross-sectional sample of US older adults participating in the NHANES. Am. J. Clin. Nutr. (2020) 112:1547–57. doi: 10.1093/ajcn/nqaa239
44. Fan, Y, Zhang, Y, Li, J, Liu, Y, Chang, H, Jiang, Y, et al. Association between healthy eating index-2015 and various cognitive domains in US adults aged 60 years or older: the National Health and Nutrition Examination Survey (NHANES) 2011-2014. BMC Public Health. (2021) 21:1862. doi: 10.1186/s12889-021-11914-2
45. Ge, H, Yang, T, Sun, J, and Zhang, D. Associations between dietary carotenoid intakes and the risk of depressive symptoms. Food Nutr. Res. (2020) 64:1–12. doi: 10.29219/fnr.v64.3920
Keywords: serum globulin, cognitive impairment, Consortium to Establish a Registry for Alzheimer’s disease (CERAD), animal fluency (AF), Digit Symbol Substitution Test (DSST), smooth curve fit, generalized additive models (GAM)
Citation: Huang J, Li R, Zhu H, Huang D, Li W, Wang J and Liu Z (2023) Association between serum globulin and cognitive impairment in older American adults. Front. Public Health. 11:1193993. doi: 10.3389/fpubh.2023.1193993
Edited by:
Chong Tian, Huazhong University of Science and Technology, ChinaReviewed by:
Qingxia Zhao, Chengdu University of Traditional Chinese Medicine, ChinaAlena Sidenkova, Ural State Medical University, Russia
Hong-bing Xiang, Huazhong University of Science and Technology, China
Copyright © 2023 Huang, Li, Zhu, Huang, Li, Wang and Liu. This is an open-access article distributed under the terms of the Creative Commons Attribution License (CC BY). The use, distribution or reproduction in other forums is permitted, provided the original author(s) and the copyright owner(s) are credited and that the original publication in this journal is cited, in accordance with accepted academic practice. No use, distribution or reproduction is permitted which does not comply with these terms.
*Correspondence: Zhirong Liu, bGl1emhpcjgwMTlAMTI2LmNvbQ==
†These authors have contributed equally to this work