 Tanya Singh1,2*
 Bin Jalaludin3,4
 Shakoor Hajat5
 Geoffrey G. Morgan6,7,8,9†
 Katrin Meissner1,2
 John Kaldor10
 Donna Green1,2Edward Jegasothy6,7
- 1Climate Change Research Centre, University of New South Wales, Sydney, NSW, Australia
- 2Australian Research Council Centre of Excellence for Climate Extremes, University of New South Wales, Sydney, NSW, Australia
- 3School of Population Health, University of New South Wales, Kensington, NSW, Australia
- 4Ingham Institute for Applied Medical Research, University of New South Wales, Sydney, NSW, Australia
- 5Centre on Climate Change and Planetary Health, London School of Hygiene and Tropical Medicine, London, United Kingdom
- 6School of Public Health, Faculty of Medicine and Health, University of Sydney, Camperdown, NSW, Australia
- 7University Centre for Rural Health, Faculty of Medicine and Health, University of Sydney, Lismore, NSW, Australia
- 8Healthy Environments and Lives (HEAL) National Research Network, Australian National University, Canberra, ACT, Australia
- 9Centre for Air Pollution, Energy and Health Research (CAR), Glebe, NSW, Australia
- 10Kirby Institute, University of New South Wales, Sydney, NSW, Australia
Introduction: Exposure to high ambient temperatures and air pollution has been shown to increase the risk of spontaneous preterm birth (sPTB). Less clear are the effects of cold and the joint effects of air pollution and temperature.
Methods: Using a Cox proportional hazard regression model, we assessed the risk of independent and combined short-term exposure to ambient daily mean temperature and PM2.5 associated with sPTB in the last week before delivery on overall sPTB (weeks 23–36) and three subtypes: extremely sPTB, very sPTB, and moderate-to-late sPTB for a birth cohort of 1,318,570 births from Australia (Jan 2001–Dec 2019), while controlling for chronic exposure (i.e., throughout pregnancy except the last week before delivery) to PM2.5 and temperature. The temperature was modeled as a natural cubic spline, PM2.5 as a linear term, and the interaction effect was estimated using a multiplicative term. For short-term exposure to temperature hazard ratios reported are relative to the median temperature (18.1°C).
Results: Hazard ratios at low temperature [5th percentile(11.5°C)] were 0.95 (95% CI: 0.90, 1.00), 1.08 (95% CI: 0.84, 1.4), 0.87 (95% CI: 0.71, 1.06), and 1.00 (95% CI: 0.94, 1.06) and greater for high temperature [95th percentile (24.5°C)]: 1.22 (95% CI: 1.16, 1.28), 1.27 (95% CI: 1.03, 1.57), and 1.26 (95% CI: 1.05, 1.5) and 1.05 (1.00, 1.11), respectively, for overall, extremely, very, and moderate-to-late sPTBs. While chronic exposure to PM2.5 had adverse effects on sPTB, short-term exposure to PM2.5 appeared to have a negative association with all types of sPTB, with hazard ratios ranging from 0.86 (95th CI: 0.80, 0.94) to 0.98 (95th CI: 0.97, 1.00) per 5 μg/m3 increase in PM2.5.
Discussion: The risk of sPTB was found to increase following acute exposure to hot and cold ambient temperatures. Earlier sPTB subtypes seemed to be the most vulnerable. This study adds to the evidence that short-term exposure to ambient cold and heat and longer term gestational exposure to ambient PM2.5 are associated with an elevated risk of sPTB.
Introduction
Exposure to both ambient temperature (low and high) and air pollution contributes to adverse birth outcomes such as low birth weight, stillbirth, and preterm birth (PTB) (1–6). Approximately 10.6% of deliveries worldwide are born preterm (7). These preterm babies are at risk of numerous health issues throughout their life course, and the families involved experience substantial economic and psychosocial burdens (8, 9). Preterm birth is defined as any live birth prior to 37 completed gestational weeks and is further categorized into extremely PTB (<28 weeks), very PTB (28–31 weeks), and moderate-to-late PTB (32–36 weeks) (10). These subcategories are important as decreasing gestational age is associated with increasing mortality, disability, intensity of neonatal care required due to complications, and, consequently, increasing expenditures (8, 11). Risk factors for each of these PTB subtypes can differ (8), and it is not clear which PTB subtypes are more susceptible to air pollution (12), temperature extremes, or their combination. Environmental factors have been linked to PTB. In addition to these, socio-economic, genetic, behavioral, infections, inflammation, prenatal complications (such as preeclampsia and gestational diabetes) and maternal factors, such as maternal age, short interpregnancy intervals, low maternal body-mass index, multiple pregnancies, and chronic conditions (such as diabetes and high blood pressure), also contribute. The precise etiology in most PTB cases, however, remains unclear (8, 9, 13).
Research on the associations between air pollution and ambient temperature with PTB highlights several issues and evidence gaps. For example, more studies focus on the effects of heat on PTB rather than on cold (6). This is despite more health issues being attributed to cold than to heat across a range of diverse settings (14). Moreover, the literature does not identify a clear period in utero when exposure to cold and heat (6, 15–17), or air pollution can lead to a PTB (2, 4, 5). Current evidence suggests there may be an adverse short-term effect of heat during the last gestational weeks or the week prior to delivery (1, 17). The evidence for susceptible exposure windows for adverse effects on PTB from cold and air pollution is less clear. Particulate matter ≤ 2.5 microns in aerodynamic diameter (PM2.5) is the most studied air pollutant due to its established causal link with cardiovascular and respiratory diseases, cancers, type 2 diabetes, and adverse birth outcomes (18, 19). For PM2.5, it has been suggested that exposure over the entire pregnancy, for longer periods, such as trimesters, and some specific gestational weeks is important (2, 5). Furthermore, to date, only three studies have assessed the synergistic effects of exposure to ambient air pollution and temperature (20–22). Two of these studies, one from Guangzhou, China (22), and the other one from California, USA (21), indicate that the risk of PTB to the combined exposure of air pollution and heat waves during the last gestational week before birth might be larger than the sum of the individual risks of these exposures. Such findings have important policy implications as they suggest that greater benefits could be achieved by tackling these factors simultaneously. The third study from Brisbane, Australia, conducted an effect modification analysis and found that the harmful effect of PM2.5 was greater at low and moderate temperatures than exposure at high temperatures (20).
New South Wales (NSW) is the most populous state in Australia. The majority of the state's population lives in a large metropolitan region with a temperate climate with hot summers and cold winters (23). Ambient PM2.5 levels in this region are generally low (24), although, increasingly, this population experiences weeks, or months, of hazardous levels of air pollution from wildfires (i.e., uncontrolled fires in nature areas, such as forests, grasslands, bushlands, and shrublands) and hazard reduction burns (also called controlled burns) (25, 26). Hazard reduction burns are a measure to reduce hazards from wildfires by fire management agencies (27).
It is valuable to study the independent and joint health effects of air pollution with temperature in this context, particularly as there appears to be no lower “safe” concentration level for most air pollutants (28–31) and to better understand these risks as the climate warms.
Our study examines the independent and synergistic effects of air pollution and temperature (low and high) in the week prior to birth on overall PTB and its subtypes in NSW, while accounting for “chronic” or longer term air pollution and temperature exposure, which is exposure from 1 week before delivery until conception. We chose to focus on the last gestational week before birth because previous research has highlighted the significance of heat during this period (1, 22) and the majority of studies have focused on this exposure timeframe for the interaction effect (21, 22). Additionally, we report individual effects for longer term PM2.5 exposure, as evidence for chronic exposure is more robust compared with other exposure durations (5).
Methods
Study area
The study area is the NSW Greater Metropolitan Region (GMR) which is the largest conurbation in Australia with a population of 6.2 million in 2020 (32). This region includes the cities of Sydney, Newcastle, and Wollongong, along with surrounding metropolitan areas (Supplementary Figure S1).
Birth cohort
The study population is all singleton live births to mothers residing in the study area between 1 January 2001 and 31 December 2019 (N = 1,354,919). Data for these births were retrieved from the NSW Perinatal Data Collection (PDC). The PDC contains all births reported in public and private hospitals and home births within NSW. It covers information on demographic, medical, and obstetric information about the mother; information on birth date, labor onset, delivery type, and condition of the infant (33). Gestational age is measured in completed weeks, based on the best clinical estimate. Births of <20 weeks' gestation or <400 g of birth weight are not included in the register.
Relevant attributes of the births included in this study were as follows: birth date, gestational age at birth (in weeks), labor onset [spontaneous vs. non-spontaneous (i.e., induced or no labor)], parity (1, 2, ≥3), maternal age at delivery (in years), and smoking status of the mother (smoked at any time during pregnancy vs. non-smoking during the entire pregnancy).
We used each mother's residential location at the time of birth, as their geographic location, represented by their statistical area level 2 (SA2). This is a spatial unit, part of the Australian Statistical Geography Standard (ASGS) 2011, developed by the Australian Bureau of Statistics (ABS), which provides hierarchical spatial divisions for the classification of data. SA2s across Australia have an average population of ~10,000 (ranging from 3,000 to 25,000) inhabitants (34). Our study area comprises 332 SA2s. The median size of a SA2 within the GMR is 9.20 km2 (range: 0.86–2,189 km2; interquartile range: 17.00). Notably, the very large SA2s[i.e., >95th percentile(181.95 km2)] have a very low population density (i.e., <42 people per km2, which is smaller than the 5th percentile of population density) (34).
We used maternal area-level socio-economic rank as a proxy for individual socio-economic status, which is an important predictor for PTB (35, 36) and associated with adverse exposure to environmental risk factors (37). We obtained data on the Index of Relative Socio-economic Disadvantage (IRSD), which ranks each SA2 in Australia according to the relative socio-economic disadvantage to characterize socio-economic status. Within the GMR, the SA2s were grouped by quintile of IRSD score.
To limit the potential for fixed cohort bias within our study, that is, the inclusion of a higher proportion of longer gestations at the beginning and a higher proportion of PTB at the end of the study period (38), we constrained the study population to pregnancies. We focussed on pregnancies with conception dates 22 weeks before the beginning of our birth cohort (i.e., 31 July 2000) and 44 weeks prior to the end of data collection (i.e., 6 February 2019) (39). This step reduced the number of pregnancies available for our analysis to 1,327,059 (97.94%). As the survival rate of premature births before 23 weeks is extremely low, and to follow international norms (11), we only included births that occurred after 22 gestational weeks (N = 1,326,168, 97.88%). Finally, we restricted our analysis to those participants for whom all maternal information was available. After exclusions, which were made a priori and of which several were overlapping, 1,318,570 (97.32%) births from the source population were eligible for the analysis. A flowchart in Supplementary Figure S2 illustrates the different exclusions undertaken to reach the final study population.
Air pollution and temperature data
Daily mean PM2.5 concentrations for each SA2 in the study region were obtained from the Centre for Air pollution, energy, and health Research Data Analysis Technology (CARDAT) platform for the study period from 1 January 2001 to 31 December 2019 (40). These data were derived from inverse distance-weighted (IWD) means of measurements from fixed-site PM2.5 monitors provided by the NSW Department of Planning and Environment (DPE). The SA2 means were population-weighted from estimates at a smaller spatial scale (statistical area level 1). A previous study, which used the same dataset, shows that the applied IDW method improves PM2.5 estimates compared with applying a mean of PM2.5 monitors (41).
We used the Australian Gridded Climate Data (AGCD v1.0.0) from the Australian Bureau of Meteorology (42) for the temperature data. This product provides a daily gridded dataset based on in situ measurements of minimum temperature (Tmin) and maximum temperature (Tmax) at 0.05° × 0.05° resolution (~5 × 5 km) (43). These grid cell temperatures were averaged over SA2 polygons. Daily average temperature (Tavg) was calculated by taking the average of the maximum temperature of the current day and the minimum temperature of the following night. Within our study area, the AGCD dataset is based on a dense monitoring network and provides reliable estimates (43, 44). There were no missing values for the time period considered in this study. The same dataset has been used by previous health studies in NSW (41, 45).
A time series of daily average temperature and daily mean PM2.5 was assigned to each pregnancy based on the mother's SA2 of residence. The focus of this study was the effect of short-term acute exposure in the week prior to delivery. To do this, we calculated a 1-week exposure average for each mother, considering the week just before giving birth and starting from the day before delivery. Lag 0 for Tavg was in this case the same day as the Tmax value.
Outcome
The primary outcomes of the study were gestational age at birth and overall spontaneous preterm births (sPTB, yes/no) and subtypes of sPTB (yes/no). In the PDC, gestational age was measured in completed gestational weeks, and for each birth, labor onset was indicated (spontaneous vs. non-spontaneous). We focused on sPTB because medically initiated PTBs are emergencies without a natural onset of labor and might have different underlying mechanisms compared with sPTB (13). With non-spontaneous PTB, there is no way of knowing whether the pregnancy would have otherwise ended in a term or preterm birth. Overall sPTB was defined as a spontaneous birth between 23 and 36 gestational weeks. The sPTB subtypes, extremely, very, and moderate-to-late sPTBs were defined as spontaneous births between 23 and 27 completed gestational weeks, 28 and 31 completed gestational weeks, and 32 and 36 completed gestational weeks, respectively.
Statistical analysis
Cox proportional hazard regression models were fitted to explore the associations between PM2.5 and Tavg, independently and synergistically, and overall sPTB, and its subtypes, during the last gestational week at risk, by treating sPTB as a time-to-event outcome. First, we assessed the individual effects of mean PM2.5 and Tavg in the last gestational week before delivery on sPTB after adjusting for all available confounders. We then assessed the potential synergistic effects of these two exposures on a multiplicative scale, by introducing a product term between the two variables in the model, while considering the same confounders as in the first step. We assessed the hazard for overall sPTB (model N = 1,318,570), and each sPTB subtype, leading to four different models. For extremely sPTB, we censored all births at week 28 (model N = 1,318,570). For very sPTB, we excluded all births <28 gestational weeks and censored births at week 32 (model N = 1,315,447). For moderate-to-late sPTB, we excluded all births prior to week 32 (model N = 1,309,274). Finally, for overall sPTB and moderate-to-late sPTB, all term births were censored at week 37, when they were not at risk for PTB anymore. In all models, non-spontaneous PTB [n = 32,295 (2.45%)] was considered “at risk” until birth and censored after birth (i.e., cause-specific proportional hazard model).
Covariates included in this study were selected a priori as potential confounders [see directed acyclic graph DAGitty (46); Supplementary Figure S3]. We controlled for maternal age, smoking status during pregnancy, parity, mother's SA2 IRSD ranked as quintiles, seasonality (month of conception), longer term trends (year of conception), and whether the birth took place during a weekday vs. weekend or public holiday. Because relatively younger and older mothers have been associated with adverse birth outcomes, we used a natural cubic spline with three degrees of freedom (df) to model a non-linear relationship with maternal age (20, 36, 47). To control for any long-term time trends, we included a natural cubic spline with two degrees of freedom for the year of conception (20, 36). Finally, to isolate the short-term effect of PM2.5 and temperature, we controlled for “chronic” exposure to PM2.5 and Tavg, which is exposure from 1 week before delivery until conception (hereafter termed longer term gestational exposure) (22). Pregnancy complications, such as preeclampsia and gestational diabetes, were not included as covariates in the models because they can be on the causal pathway of antenatal exposure to PM2.5 and temperature and birth outcomes (22, 48, 49).
The impact of short-term and longer term gestational PM2.5 on PTB was considered linear based on previous literature (4), with the hazard ratios (HRs) and 95% confidence intervals (CIs) calculated per 5-μg/m3 increase in PM2.5 concentration. Associations between ambient temperature and health outcomes often take a non-linear (a J- or U-shaped curve) exposure–response relationship (50). Therefore, both short-term and longer term gestational exposure to Tavg were included as natural cubic splines with three degrees of freedom. In this way, the potential increased risk at low and high temperatures could be considered. For temperature, we estimated HRs for sPTB at high (95th percentile, i.e., hot) and low (5th percentile, i.e., cold) temperatures, relative to the median of the weekly mean temperature (51). For the interaction effect of temperature with PM2.5 at low and high values (5th percentile and 95th percentile), the same median reference temperature as for the independent effect was used. The moderating effects of low and high temperatures on PM2.5 on the other hand were compared with the effects at the lowest mean weekly value of PM2.5.
To check for multicollinearity, correlations between the different exposure variables were estimated using Pearson's correlation.
We performed two sensitivity analyses to assess the robustness of our results. To check whether our results were sensitive to the selected short-term exposure window of 1 week and to make them more comparable with other studies that looked at longer exposure windows [e.g., (51, 52)], we chose a period of 4 weeks before birth (hereafter termed 4-week PM2.5 and 4-week Tavg). The longer term gestational exposure to PM2.5 and Tavg was adjusted accordingly (i.e., from 4 weeks before birth until the conception date). As the shape of the exposure–response function of the association of PM2.5 with PTB is unknown (53) and could be non-linear, especially at high PM2.5 concentration levels (54), we performed a sensitivity analysis in which the form of PM2.5 for the short-term exposure was non-linear by fitting a natural cubic spline with three degrees of freedom.
All analyses were performed in R (version 1.4.1717; R Development Core Team), and we used the “survival” (55), “smoothHR” (56), “splines” (57), and “visreg” (58) packages.
This research project was approved by the University of New South Wales Human Research Low Risk Ethics Advisory Committee Panel E, Reference Number: HC200817.
Results
Spontaneous preterm births
Among the 1,318,570 births included in our study population, 38,900 (2.95%) were overall sPTB, 2,001 (0.15%) were extremely sPTB, 3,059 (0.23%) were very sPTB, and 33,840 (2.57%) were moderate-to-late sPTB (Table 1). Mothers who were younger, smoked at any time during pregnancy, and first-time and at least third-time mothers were more likely to have an sPTB compared with all births. The risk of sPTB increased with increasing area-level socio-economic disadvantage of the mother.
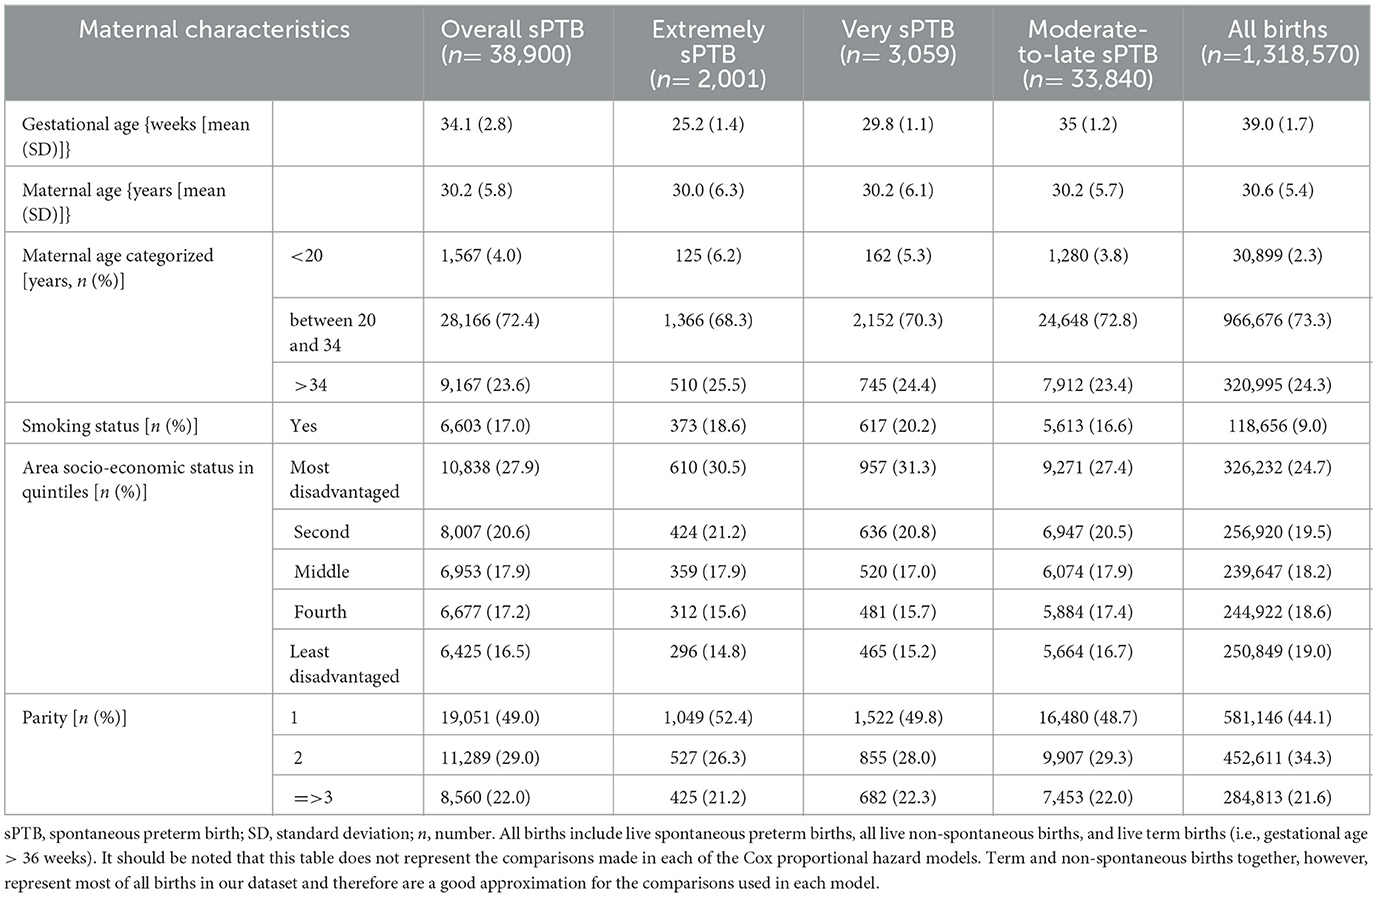
Table 1. Description of the study population (i.e., all mothers who gave a live birth within the Greater Metropolitan Region of New South Wales, Australia, between 1 January 2001 and 31 December 2019) by maternal characteristics and birth types.
Ambient PM2.5 and ambient temperature exposure
Mean PM2.5 in the week before delivery was similar across sPTB subtypes, including overall spontaneous sPTB (Table 2). The same was the case for longer term exposure to PM2.5, noting that all sPTB groups had a slightly lower mean and median exposure than all births. Mean Tavg exposure the week before birth and long-term gestational exposure were also very similar across all births and sPTB groups.
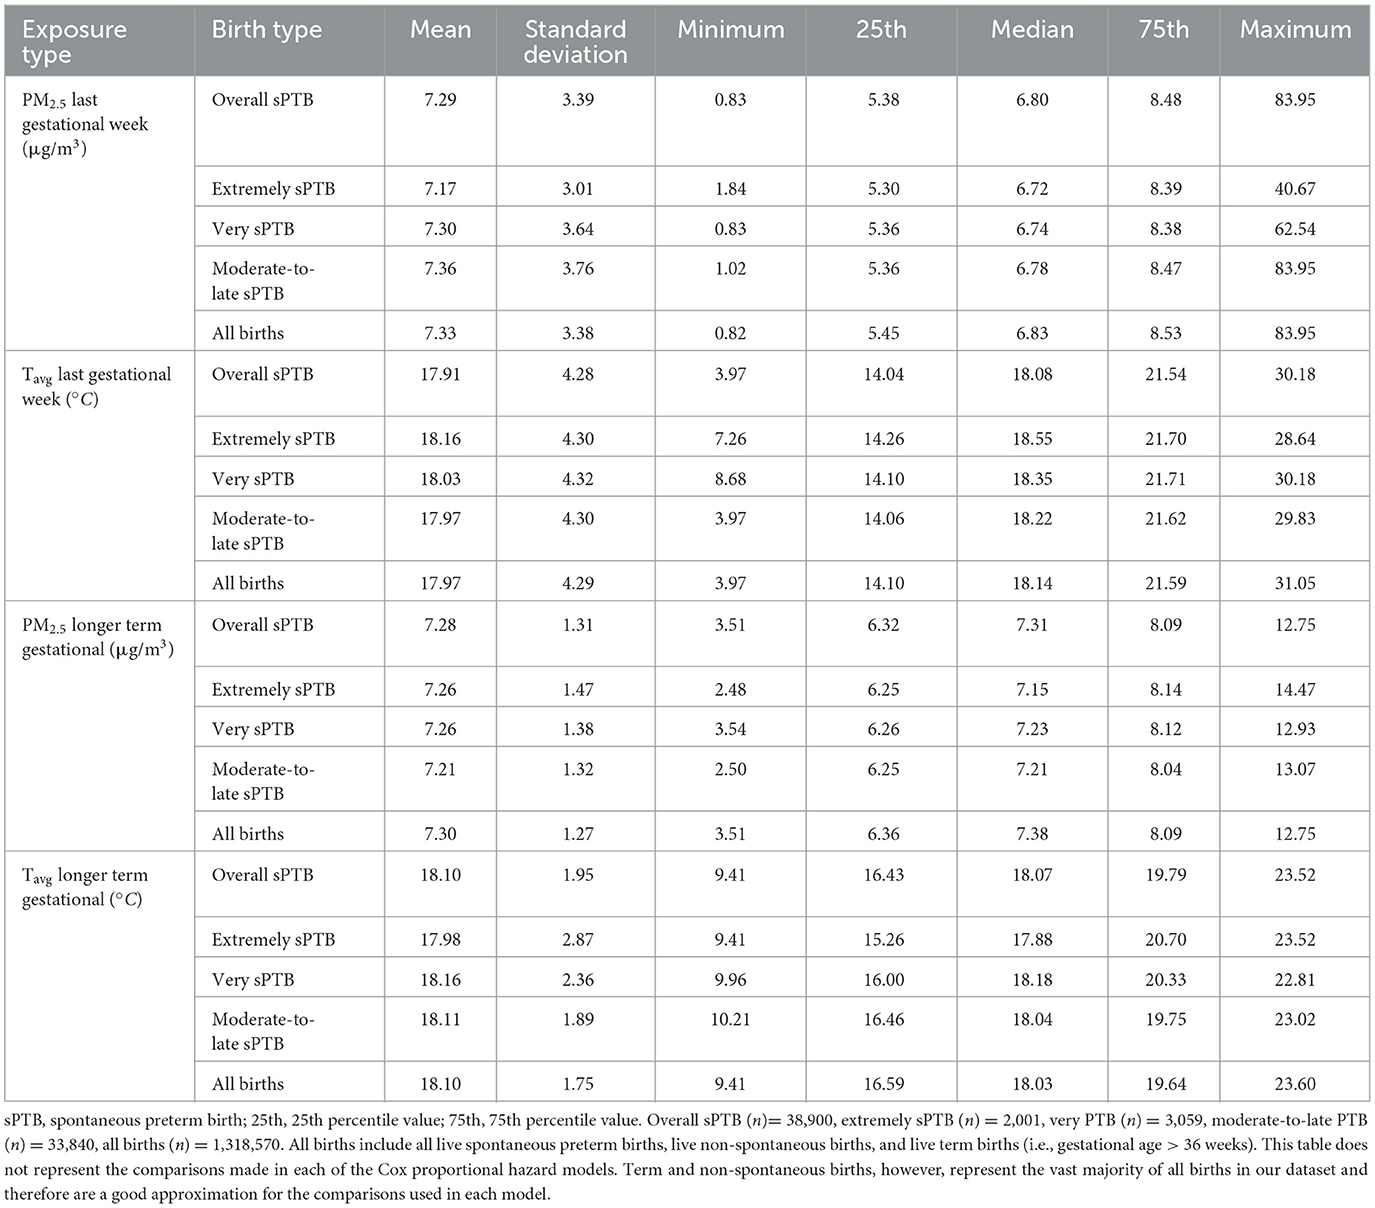
Table 2. Exposure to PM2.5 (μg/m3) and Tavg (°C) in the week prior to delivery and longer term gestational exposure (i.e., from conception till the week prior to delivery) by birth type for all live births in the Greater Metropolitan Region of New South Wales between 1 January 2001 and 31 December 2019.
Exposure to PM2.5 in the last gestational week before birth was slightly higher during winter (June–August) and summer (December–February) for all births, including sPTB, than in spring and autumn (Supplementary Table S1, see median and mean values). Pregnant women living in the inner suburbs of Sydney had on average the highest exposure to PM2.5 (Supplementary Figure S4), and mothers living in SA2s closer to the coast were exposed to higher temperatures during the last week of their pregnancies (Supplementary Figure S5).
There was no correlation between short-term PM2.5 and short-term Tavg exposure (r = 0.08). PM2.5 exposure the week before birth correlated weakly with longer term gestational PM2.5 exposure (r = 0.26), and Tavg the week before birth had a moderate negative correlation with longer term gestational Tavg (r = −0.43) (Supplementary Table S2).
Ambient PM2.5 and risk of sPTB
The relationship of longer term gestational exposure to PM2.5 with all sPTB groups was hazardous for increasing levels of PM2.5 (Supplementary Table S3). The HRs were 1.07 (95% CI: 1.02–1.12), 1.34 (95% CI: 1.10–1.64), 1.2 (95% CI: 1.02–1.43), 1.00 (95% CI: 0.95–1.06) per 5 μg/m3 increase in longer term gestational PM2.5 for overall, extremely, very, and moderate-to-late sPTBs, respectively. Short-term exposure to PM2.5, on the other hand, was associated negatively with overall and all sPTB subtypes (Figure 1; Supplementary Table S3). The HRs were 0.95 (95% CI: 0.94–0.97), 0.86 (95% CI: 0.79–0.94), 0.92 (95% CI: 0.87–0.99), 0.98 (95% CI: 0.97–1.00) per 5 μg/m3 increase in PM2.5 for overall, extremely, very, and moderate-to-late sPTBs, respectively (Supplementary Table S3).
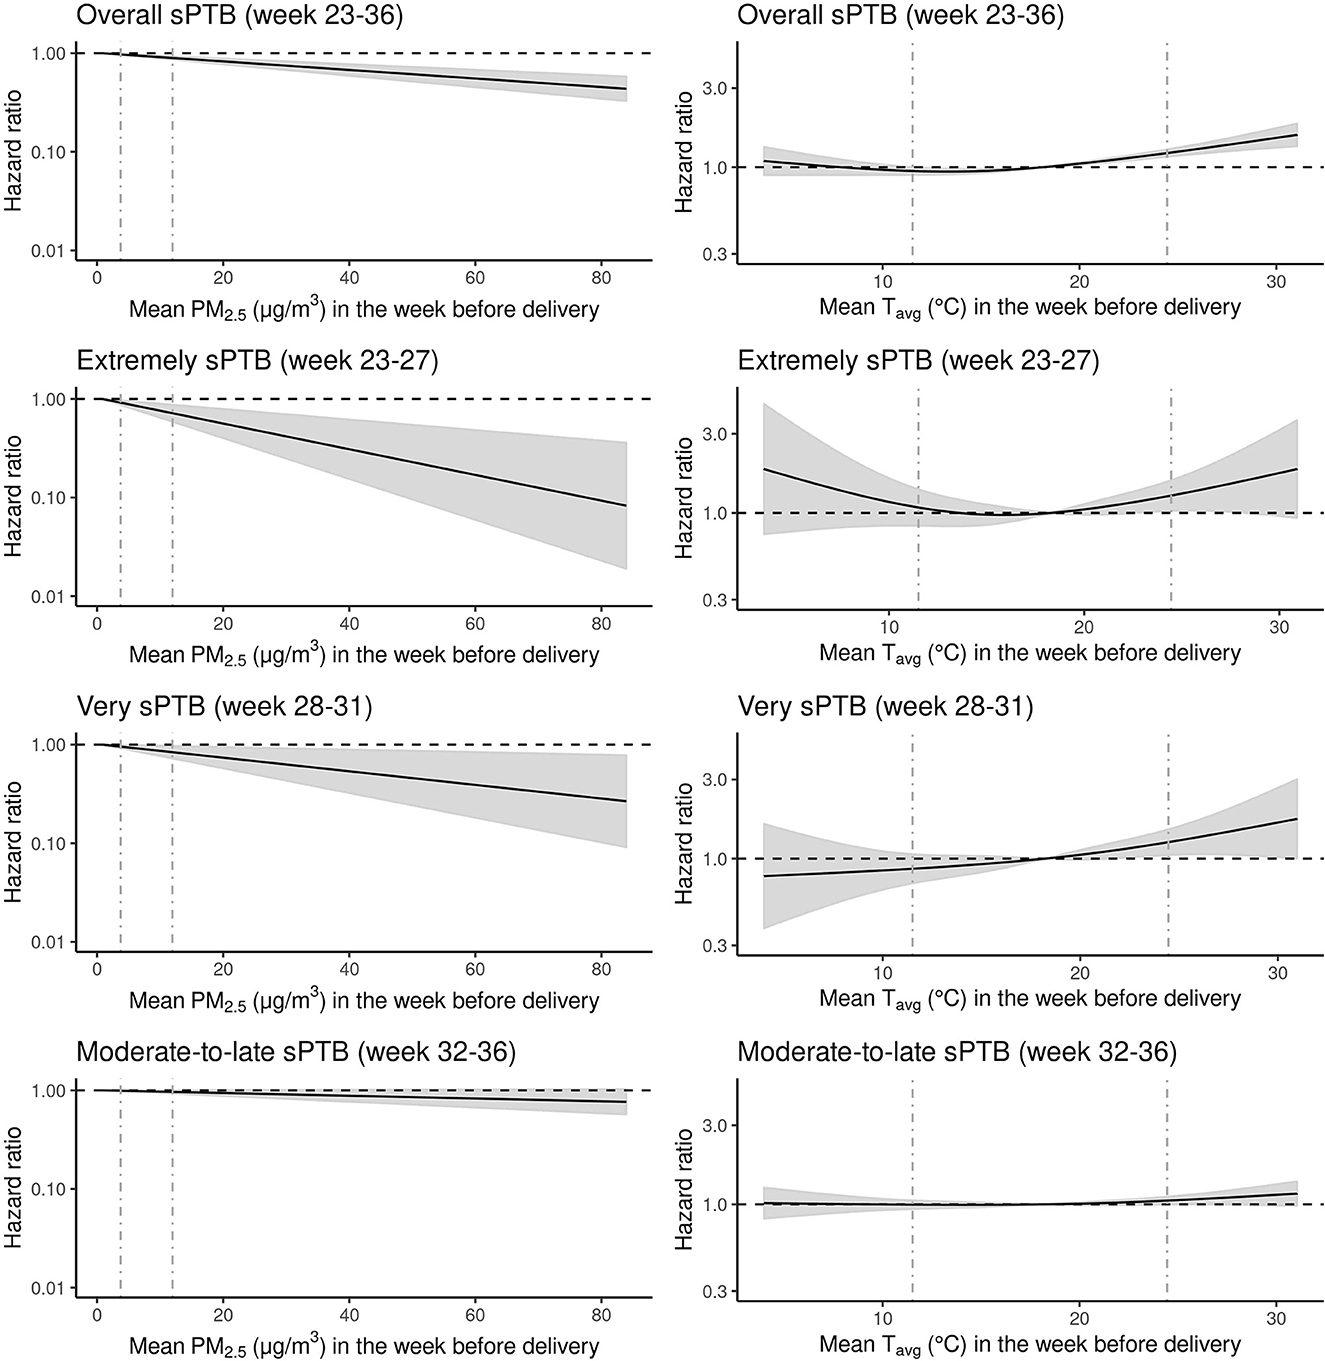
Figure 1. Hazard ratios (HRs) of spontaneous preterm birth (sPTB) associated with exposure to mean particulate matter equal to or <2.5 microns [PM2.5 (μg/m3)] and mean temperature Tavg (C°) the week before delivery for all live births (N = 1,318,570) in the Greater Metropolitan Region of New South Wales between 1 January 2001 and 31 December 2019 are shown with the black line. Gray areas around the black hazard ratio lines show 95% confidence intervals (CI). The vertical gray dashed lines represent the 5th and 95th percentile marks. The relationship between PM2.5 and sPTB was modeled as linear and for Tavg as a natural cubic spline with three degrees for freedom and median temperature (18.1 C°) as the reference point. All models were adjusted for year and month of conception, weekdays vs. weekends/holidays, maternal age, parity, smoking during pregnancy, area-level socio-economic status of the mother and exposure to longer term gestational Tavg and PM2.5 (i.e., exposure across the entire pregnancy except for the last week before delivery).
Ambient temperature and risk of sPTB
The relationship between overall, very, and moderate-to-late sPTBs and short-term exposure to Tavg indicated a J-shaped form (Figure 1; Supplementary Table S4). However, the exposure–response curve for very sPTB seemed almost linear. For extremely sPTB, the exposure–response relationship was U-shaped. The HR for overall sPTB at a lower temperature [5th percentile (11.5°C)] was 0.95 (95% CI: 0.90, 1.00) compared with the median temperature (18.14°C). For higher temperature [95th percentile (24.5°C)], the risk of sPTB increased to 1.22 (95% CI: 1.16, 1.29) compared with the reference. For extremely sPTB, the HR at low temperature was 1.08 (95% CI: 0.084, 1.39), and at high temperature was 1.27 (95% CI: 1.03, 1.57). For very sPTB, the HR was 0.87 (95% CI: 0.71, 1.06) for low and 1.26 (95% CI: 1.05, 1.50) for high temperatures. Finally, for the moderate-to-late sPTB subtype, the risk of sPTB was 1.00 (95% CI: 0.94, 1.06) and 1.14 (1.06, 1.2) at low- and high-temperature values, respectively, compared with the median temperature.
Two-way interaction between temperature and PM2.5 on risk of sPTB
There was an indication for increasing HRs (effect estimates converged toward 1.00) for the association between short-term PM2.5 and all sPTB groups as short-term mean temperature (Tavg) increased from the 5th (11.5°C) to the 95th (24.5°C) percentile (Table 3; Supplementary Figure S6). Apart from this pattern, temperature did not influence the association between short-term PM2.5 and sPTB, except for moderate-to-late sPTB. In all other cases, the confidence intervals contained the point estimate from the comparison group.
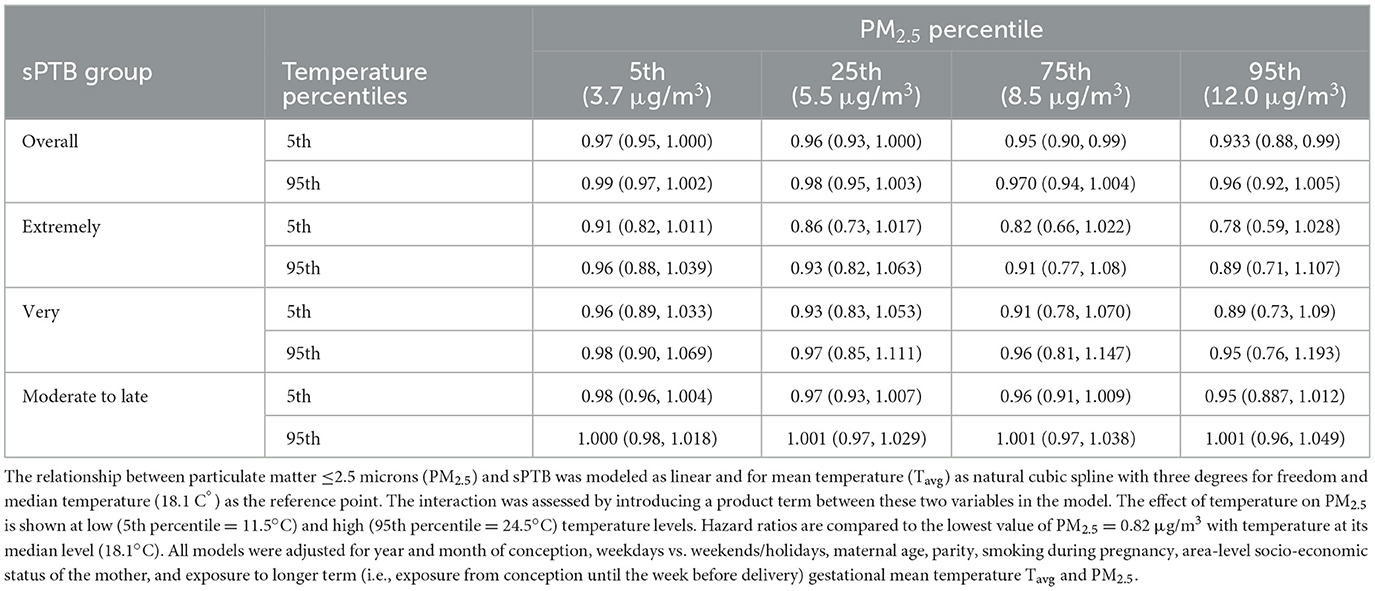
Table 3. Spontaneous preterm (sPTB) birth hazard ratios for the interaction effect between mean PM2.5 and mean Tavg in the week before delivery for all live births in the Greater Metropolitan Region of New South Wales between 1 January 2001 and 31 December 2019.
There was no clear pattern visible for the interaction effects of short-term exposure to PM2.5 on the association between short-term exposure to temperature and sPTB. For overall and extremely sPTB, HRs increased for cold and heat as PM2.5 increased from low (3.7 μg/m3) to high (12.0 μg/m3)values (5th vs. 95th percentile) (Table 4; Supplementary Figure S7). For very sPTB, the point estimates for Tavg showed a decreased risk at the 5th percentile level of PM2.5 and an increased risk for PM2.5 at the 95th percentile [from 0.75 (95% CI: 0.59, 0.97) to 1.05 (95% CI: 0.80, 1.35)]. Hazard ratios for moderate-to-late sPTB increased marginally with increasing PM2.5 values for hot temperatures. For all sPTB groups other than very sPTB at low temperatures and overall sPTB at high temperatures, confidence intervals for the joint effects overlapped and the confidence intervals contained the point estimate from the comparison group.
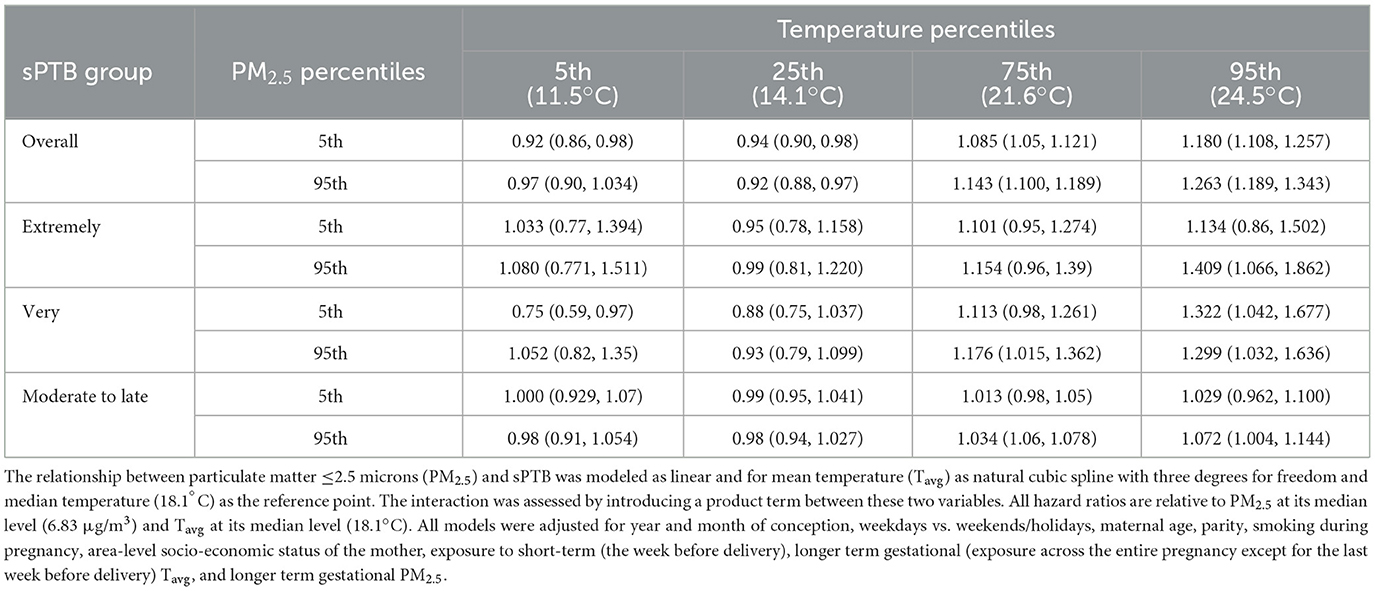
Table 4. Spontaneous preterm birth (sPTB) hazard ratios for the interaction effect between mean Tavg and mean PM2.5 in the week before delivery for all live births in the Greater Metropolitan Region of New South Wales between 1 January 2001 and 31 December 2019.
Sensitivity analyses
The decreased risk estimates between short-term exposure to PM2.5 and all sPTB groups remained consistent throughout almost all models tested in the sensitivity analysis (Supplementary Tables S5, S9). The one exception was for very sPTB with PM2.5 modeled as non-linear. In this model, HRs increased per unit increment in PM2.5 (μg/m3) until the 25th percentile, and thereafter, HRs started decreasing (Supplementary Table S9).
Similar J- and U-shaped relationships between temperature and different sPTB groups as in the main analysis reappeared in the sensitivity tests (Supplementary Tables S6, S10).
The interaction effect of temperature on PM2.5 was similar across most sPTB models in the main and sensitivity analysis—a slight increase in sPTB HRs at high-temperature values was observable compared with lower temperatures (Supplementary Tables S7, S11). In the 4-week exposure model though, for very sPTB, the HRs decreased as temperature increased.
Finally, concerning the effects of PM2.5 on temperature, all sensitivity models indicated increased HRs for the cold effects on sPTB when PM2.5 changed from the 5th percentile to the 95th percentile (Supplementary Tables S8, S12). The same was usually the case for the effects of increasing PM2.5 exposure on heat. The only exceptions were the 4-week exposure model for extremely and very sPTB—the heat HR decreased in this subtype with increasing short-term PM2.5 exposure.
Discussion
Key results
This population-based retrospective birth cohort study assessed the independent and combined short-term effects of ambient air pollution and temperature on sPTB while controlling for longer term gestational exposure.
Our study found that the risk of sPTB did not increase with increasing short-term PM2.5 exposure. However, in this low ambient air pollution environment, longer term gestational exposure to PM2.5 was associated with a small increase in the risk of sPTB. The risk of sPTB was also found to increase following acute exposure to low and high ambient temperatures.
Short-term cold and heat effects of temperature on sPTB were higher in the presence of higher acute PM2.5 pollution levels.
Investigation of effects by different subtypes of sPTB found that the risk of earlier (extremely and very preterm) sPTBs was more strongly associated with increased acute heat exposure. Furthermore, extremely sPTB was also most susceptible to acute cold effects.
Strengths
To the best of our knowledge, this is the first study to estimate the short-term joint effects of cold and heat with air pollution on sPTB. Other studies have either assessed only the effects of short-term exposure to heat waves and air pollution (21, 22) or the longer term interaction effect (20). We used a large and high-quality birth cohort dataset, including 19 years of data from the most populous region in Australia. As this study specifically aimed to assess whether short-term environmental exposures could trigger labor, we only considered sPTB as the main outcome in our study. This is important because the underlying mechanisms for which environmental exposures affect pregnancies might be different for sPTB and medically initiated PTB (13). Few other studies have been able to censor (or exclude) non-spontaneous PTB in their analysis. By applying a Cox proportional hazards model, as opposed to other common methods such as time series or case-crossover studies, we accounted for the increased likelihood of giving birth as pregnancy progresses. We considered all three PTB subtypes in our analysis, which many other studies have not been able to do due to their lack of statistical power. Compared to many other Australian studies on PTB [e.g., (36, 59–61)], we had a more spatially resolved outdoor exposure assessment for temperature because we did not rely solely on weather station data; rather, we used a gridded dataset to assign more precise exposures in each geographical location at an SA2 level.
Limitations
We controlled for area-level socio-economic status, rather than individual-level socio-economic status, which may result in residual confounding. Furthermore, as we did not consider stillbirths, we might have introduced live birth bias into our study. This is a selection bias that can occur if the exposure of interest influences the chances for live births, and if at the same time, there are some other common causes for preterm births and stillbirths which were not considered in a study (39). Another way of how we might have introduced live birth bias is through the depletion of susceptible pregnancies, which occurs if the exposure of interest results in an early pregnancy loss amongst pregnancies that would have otherwise resulted in preterm births (39). However, any such bias would have biased our associations toward null because it preferentially depletes pregnancies exposed to the risk factor studied.
Interpretation
Although biologically plausible, research has not yet explicitly studied the biological pathway of independence (62–64) and joint effects of temperature and air pollution on PTB. Particulate matter and low and high temperatures may have synergistic effects because they act on common pathophysiological pathways (65). Heat, cold, and PM exposure have been associated with oxidative stress, systemic inflammation, and elevated blood viscosity, which all, in turn, cascade into a chain of processes in the body, which can trigger labor (16, 49, 63). Furthermore, the thermoregulatory system responds to heat stress by increasing sweating, minute ventilation, and cardiac output, all of which tend to increase the uptake and distribution of air pollutants in the body and alter the physiological response to toxic agents possibly increasing predisposition to air pollution (65–67). Cold and air pollution has been linked to maternal hypertensive diseases during pregnancy an important cause of PTB (2, 68–70). Furthermore, cold reduces respiratory mucociliary function and consequently obstructs the clearance of fine particles (71, 72).
Our results broadly concur with similar studies from a range of locations worldwide on the risk of PTB and short-term exposure to cold or hot ambient temperatures. It is noteworthy that some of the studies investigating both cold and heat exposures only found an adverse risk association with heat. For instance, a study from the Southern District of Israel with a semi-arid climate that assessed exposure to low and high temperatures by gestational weeks in a Cox proportional hazard analysis found that late PTB (after week 31) was associated with the 5th temperature quintile relative to the middle quintile [HR = 1.31 (95% CI: 1.11, 1.56)]. There was no association with lower temperature quintiles or earlier PTB (73). A recent study from 2022, which assessed temperature effects in NSW, Australia, found an increased association between overall sPTB and only high temperatures. In their time-series analysis, the cumulative effect of the relative risk of sPTB for mean daily temperature over a lag of 7 days was 1.16 (95% CI: 1.08, 1.20) at the 95th percentile (25°C) compared to the median temperature (17°C) (74). This study did not find any cold effects, whereas, in our study, we do find some adverse effects of extreme cold on overall, extremely, and moderate-to-late sPTBs. However, the hazardous effects of heat were more pronounced and clearer. A reason for this could be the temperate climate with warm summers and no extreme winters in the GMR of NSW. In such a context, cold-related health effects can be lower (75, 76). Importantly, it is worth noting that other studies have reported cold effects. For example, a study based in subtropical Guangzhou, China, assessed the association with temperature for several time windows in a survival analysis and found an association with an increase in risk for PTB for cold and heat for 4 weeks before birth (51). Compared to the median temperature, the HR for cold was 1.13 (95% CI: 1.07, 1.9) and for heat 1.08 (95% CI: 1.02, 1.3) in that study.
Our study suggests that the risk for sPTB did not increase with increasing short-term exposure to PM2.5. This is consistent with the negative and null findings of other studies in similar populations. One study from Sydney, Australia, which assessed the relationship between air pollution exposure 1–3 months before birth found a negative association between PM2.5 and overall PTB (52). The odds ratio for the 1-month relationship was 0.98 (95%. CI: 0.96–1.00). A study from Brisbane, Australia, assessed the short-term effect (up to 3 days) before birth. Similarly, to the previous study, it found a statistically non-significant reduced cumulative odds ratio (effect estimates not reported) for PM2.5 exposure and overall PTB (47). A negative relationship with PM2.5 exposure up to a lag of 6 days was also reported in studies outside of Australia. A study from Canada in 24 cities reported in their Cox proportional hazard analysis that per 7.4 μg/m3 increase in PM2.5 at lag 6 an HR of 0.998 (95% CI: 0.987, 1.008) (77). It is noteworthy that this and the prior two Australian studies were conducted in relatively low air pollution environments, and they did not control for longer term gestational exposure to PM2.5 as in our study. Two other studies from Guangzhou, China, where ambient air pollution is higher [e.g., from 1 September 2006 to 11 July 2013: 70.4 μg/m3 (SD: 60.6 μg/m3); 52], included mutual adjustments for short-term and longer term PM2.5 exposure (22, 54) and both of these studies found a positive, but not significant, association between short-term PM2.5 and PTB. For example, one of these two studies applied a time-series analysis and found for the longer term effect a 3.16% (95% CI: 1.95%, 4.39%) increase per 10-μg/m3 increment in PM2.5. While for the acute relationship, a much lower effect with 0.19% (95% CI: −0.26%, 0.65%) per 10-μg/m3 increment in PM2.5 was found (54).
Systematic reviews show that the evidence on the adverse effects of PM2.5 on PTB is the strongest for entire pregnancy exposures (2, 5). Considering our results and the evidence from other studies, it might be that PM2.5 exposure does not have any considerable short-term acute effects on sPTB compared with longer term gestational exposure. For sPTB, there might be a more indirect mechanism between PM2.5 and the way labor is triggered, requiring cumulative exposure to PM2.5, rather than acute exposure, whereas temperature may contribute in an acute manner.
Only three other studies have assessed the joint effects of air pollution and temperature on PTB. Two of these studies assessed the synergistic effects between heat waves and air pollution in California, USA, and Guangzhou, China, by assessing relative excess risk due to interaction (RERI) (21, 22). The Guangzhou study did not find any significant association for the joint effect; however, there was an indication that effects for less intense heat waves in combination with PM2.5 exposure were larger than expected [i.e., synergistic; positive additive interactions (RERI > 0)] and the joint effects with more extreme heat waves had negative additive interaction (RERIs < 0), possibly due to heat-mitigating behaviors occurring during extreme heat. The Californian study on the other hand found a positive additive interaction (RERI > 0) between some of their heat wave indicators and PM2.5 exposure (21). The third study from Brisbane, Australia, found that the hazardous effect of PM2.5 was greater at moderate and low temperatures than at high temperatures, potentially indicating some heat mitigating behaviors on hot days like in the Guangzhou study (20). We found some notable patterns for a two-way interaction between short-term exposure to temperature and air pollution; however, the moderating effects were mostly rather weak and not always persistent. The confidence intervals were often wide or contained the effect estimates of the comparison group.
Our main and sensitivity analysis showed that the cold and heat HRs for extremely and the heat HRs for very sPTB were higher than moderate-to-late sPTB, indicating potential susceptibility to temperature already at earlier stages of the pregnancy. Furthermore, extremely and very sPTBs had larger HRs for longer term gestational PM2.5 exposure. These two subtypes were also more reactive to the joint effects of temperature and PM2.5. Concerning which preterm subtype is more vulnerable to temperature and air pollution exposure, non-environmental factors, such as infections and lifestyles, rather than environmental factors, may play an increasingly important role in earlier preterm births, such as extremely and very PTB (78, 79). However, for later PTB, such as moderate-to-late PTB environmental stressors are more likely to contribute (78, 79). Whereas, some studies confirm this hypothesis for the heat effects (22, 73), others find like in our study that earlier PTB is more susceptible [e.g., (51)]. Further studies are needed to elucidate the most vulnerable subtypes, as decreasing gestational age is associated with increasing mortality and health complications (8).
Evidence on which exposure window during pregnancy is susceptible to temperature and air pollution exposure is mixed (2, 4–6, 15–17). In this study, we chose to focus on ambient PM2.5 and ambient temperature in the last gestational week before birth due to the existing evidence of heat on PTB during this period. The susceptible time window for each sPTB subtype from each individual environmental stressor—cold, heat, and air pollution—may, however, differ, and this needs to be considered by future studies, including their lagged and cumulative effects, and the nature of the joint effects.
Conclusion
The literature does not provide consistent guidance on which window during pregnancy is most vulnerable to temperature and PM2.5 exposure. This study adds to the evidence that short-term exposure to ambient cold and heat and longer term gestational exposure to ambient PM2.5 is associated with an elevated risk of sPTB. The short-term hazardous effects were more pronounced and evident for heat than for cold. Like other studies in a low air pollution setting, we did not find any evidence of the hazardous effects of short-term exposure to PM2.5.
Different preterm subtypes are differently susceptible to the independent and joint effects of exposure to ambient air pollution and temperature. Earlier sPTB subtypes seemed to be the most sensitive to the environmental risk exposures assessed in this study.
Data availability statement
The data analyzed in this study is subject to the following licenses/restrictions: the data needs to be requested specifically from the New South Wales Ministry of Health. The authors of this manuscript are not allowed to share the data with a third party. Requests to access these datasets should be directed to the New South Wales Ministry of Health.
Ethics statement
The studies involving humans were approved by University of New South Wales Human Research Low Risk Ethics Advisory Committee Panel E (Reference Number: HC200817). The studies were conducted in accordance with the local legislation and institutional requirements. Written informed consent for participation was not required from the participants or the participants' legal guardians/next of kin in accordance with the national legislation and institutional requirements.
Author contributions
TS contributed to conceptualization, methodology, software, writing—original draft preparation, and formal analysis. BJ contributed to resources and writing—review and editing. SH was involved in methodology and writing—review and editing. GM contributed to writing—review and editing. KM and DG were involved in supervision and writing—review and editing. JK contributed to supervision and methodology. EJ contributed to supervision, resources, methodology, and writing—review and editing. All authors contributed to the article and approved the submitted version.
Acknowledgments
The authors thank the NSW Ministry of Health for providing access to the Perinatal Data Collection. This research includes computations using the computational cluster Katana supported by Research Technology Services at the University of New South Wales, Sydney.
Conflict of interest
The authors declare that the research was conducted in the absence of any commercial or financial relationships that could be construed as a potential conflict of interest.
Publisher's note
All claims expressed in this article are solely those of the authors and do not necessarily represent those of their affiliated organizations, or those of the publisher, the editors and the reviewers. Any product that may be evaluated in this article, or claim that may be made by its manufacturer, is not guaranteed or endorsed by the publisher.
Supplementary material
The Supplementary Material for this article can be found online at: https://www.frontiersin.org/articles/10.3389/fpubh.2023.1220797/full#supplementary-material
References
1. Chersich MF, Pham MD, Areal A, Haghighi MM, Manyuchi A, Swift CP, et al. Associations between high temperatures in pregnancy and risk of preterm birth, low birth weight, and stillbirths: systematic review and meta-analysis. BMJ. (2020) 371:m3811. doi: 10.1136/bmj.m3811
2. Klepac P, Locatelli I, Korosec S, Kunzli N, Kukec A. Ambient air pollution and pregnancy outcomes: a comprehensive review and identification of environmental public health challenges. Environ Res. (2018) 167:144–59. doi: 10.1016/j.envres.2018.07.008
3. Siddika N, Balogun HA, Amegah AK, Jaakkola JJK. Prenatal ambient air pollution exposure and the risk of stillbirth: systematic review and meta-analysis of the empirical evidence. Occup Environ Med. (2016) 73:573–81. doi: 10.1136/oemed-2015-103086
4. Stieb DM, Chen L, Eshoul M, Judek S. Ambient air pollution, birth weight and preterm birth: a systematic review and meta-analysis. Environ Res. (2012) 117:100–11. doi: 10.1016/j.envres.2012.05.007
5. Sun X, Luo X, Zhao C, Chung Ng RW, Lim CED, Zhang B, et al. The association between fine particulate matter exposure during pregnancy and preterm birth: a meta-analysis. BMC Pregn Childbirth. (2015) 15:300. doi: 10.1186/s12884-015-0738-2
6. Zhang Y, Yu C, Wang L. Temperature exposure during pregnancy and birth outcomes: an updated systematic review of epidemiological evidence. Environ Pollut. (2017) 225:700–12. doi: 10.1016/j.envpol.2017.02.066
7. Chawanpaiboon S, Vogel JP, Moller A-B, Lumbiganon P, Petzold M, Hogan D, et al. Global, regional, and national estimates of levels of preterm birth in 2014: a systematic review and modelling analysis. Lancet Global Health. (2019) 7:e37–46. doi: 10.1016/S2214-109X(18)30451-0
8. Blencowe H, Cousens S, Oestergaard MZ, Chou D, Moller A-B, Narwal R, et al. National, regional, and worldwide estimates of preterm birth rates in the year 2010 with time trends since 1990 for selected countries: a systematic analysis and implications. Lancet. (2012) 379:2162–72. doi: 10.1016/S0140-6736(12)60820-4
9. Petrou S. Economic consequences of preterm birth and low birthweight. BJOG. (2003) 110(Suppl. 20):17–23. doi: 10.1046/j.1471-0528.2003.00013.x
10. World Health Organisation. WHO: recommended definitions, terminology and format for statistical tables related to the per-inatal period and use of a new certificate for cause of perinatal deaths. Modifications recommended by FIGO as amended October 14, 1976. Acta Obstet Gynecol Scand. (1977) 56:247–53. doi: 10.3109/00016347709162009
11. Vogel JP, Chawanpaiboon S, Moller AB, Watananirun K, Bonet M, Lumbiganon P. The global epidemiology of preterm birth. Best Pract Res Clin Obstet Gynaecol. (2018) 52:3–12. doi: 10.1016/j.bpobgyn.2018.04.003
12. Wang Q, Benmarhnia T, Zhang H, Knibbs LD, Sheridan P, Li C, et al. Identifying windows of susceptibility for maternal exposure to ambient air pollution and preterm birth. Environ Int. (2018) 121:317–24. doi: 10.1016/j.envint.2018.09.021
13. Goldenberg RL, Culhane JF, Iams JD, Romero RD, et al. Epidemiology and causes of preterm birth. Lancet. (2008) 371:75–84. doi: 10.1016/S0140-6736(08)60074-4
14. Gasparrini A, Guo Y, Hashizume M, Lavigne E, Zanobetti A, Schwartz J, et al. Mortality risk attributable to high and low ambient temperature: a multicountry observational study. Lancet. (2015) 386:369–75. doi: 10.1016/S0140-6736(14)62114-0
15. Bruckner TA, Modin B, Vågerö D. Cold ambient temperature in utero and birth outcomes in Uppsala, Sweden, 1915–1929. Ann Epidemiol. (2014) 24:116–21. doi: 10.1016/j.annepidem.2013.11.005
16. Kloog I. Air pollution, ambient temperature, green space and preterm birth. Curr Opin Pediatr. (2019) 31:237–43. doi: 10.1097/MOP.0000000000000736
17. Strand LB, Barnett AG, Tong S. The influence of season and ambient temperature on birth outcomes: a review of the epidemiological literature. Environ Res. (2011) 111:451–62. doi: 10.1016/j.envres.2011.01.023
18. Health Effects Institute. State of Global Air 2020. (2020). Available from: http://www.stateofglobalair.org (accessed March 10, 2023).
19. Sang S, Chu C, Zhang T, Chen H, Yang X. The global burden of disease attributable to ambient fine particulate matter in 204 countries and territories, 1990–2019: a systematic analysis of the Global Burden of Disease Study 2019. Ecotoxicol Environ Saf. (2022) 238:113588. doi: 10.1016/j.ecoenv.2022.113588
20. Chen G, Guo Y, Abramson MJ, Williams G, Li S. Exposure to low concentrations of air pollutants and adverse birth outcomes in Brisbane, Australia, 2003-2013. Sci Total Environ. (2018) 622–3:721–6. doi: 10.1016/j.scitotenv.2017.12.050
21. Sun Y, Ilango SD, Schwarz L, Wang Q, Chen J-C, Lawrence JM, et al. Examining the joint effects of heatwaves, air pollution, and green space on the risk of preterm birth in California. Environ Res Lett. (2020) 15:104099. doi: 10.1088/1748-9326/abb8a3
22. Wang Q, Li B, Benmarhnia T, Hajat S, Ren M, Liu T, et al. Independent and combined effects of heatwaves and PM25 on preterm birth in Guangzhou, China: a survival analysis. Environ Health Perspect. (2020) 128:17006. doi: 10.1289/EHP5117
23. Australian Government Bureau of Meteorolog. Climate Classification Maps. (2016). Available from: http://www.bom.gov.au/jsp/ncc/climate_averages/climate-classifications/index.jsp?maptype=kpngrp#maps (accessed December 20, 2022).
24. NSW Government. Air Quality Study for the NSW Greater Metropolitan Region. Sydney (2020). Available from: https://www.environment.nsw.gov.au/-/media/OEH/Corporate-Site/Documents/Air/air-quality-study-nsw-greater-metropolitan-region-200488.pdf (accessed December 16, 2022).
25. Bryant C. Understanding Bushfire: Trends in Deliberate Vegetation Fires in Australia. (2008). Available from: https://www.aic.gov.au/publications/tbp/tbp27 (accessed November 24, 2022).
26. Canadell JG, Meyer CP, Cook GD, Dowdy A, Briggs PR, Knauer J, et al. Multi-decadal increase of forest burned area in Australia is linked to climate change. Nat Commun. (2021) 12:6921. doi: 10.1038/s41467-021-27225-4
27. Dawkins R. Why Hazard Reduction Burning is no Smokescreen. (2021). Available from: https://www.csiro.au/en/news/all/articles/2021/october/hazard-reduction-burn (accessed August 12, 2022).
28. The Lancet Planetary Health. The air that we breathe. Lancet Planet Health. (2022) 6:e1. doi: 10.1016/S2542-5196(21)00357-0
29. Walter CM, Schneider-Futschik EK, Lansbury NL, Sly PD, Head BW, Knibbs LD. The health impacts of ambient air pollution in Australia: a systematic literature review. Intern Med J. (2021) 51:1567–79. doi: 10.1111/imj.15415
30. World Health Organization. WHO Global Air Quality Guidelines: Particulate Matter (PM2. 5 and PM10), Ozone, Nitrogen Dioxide, Sulfur Dioxide and Carbon Monoxide. Geneva: World Health Organization (2021).
31. Zosky G, Porta Cubas A, Morgan G, Tham R, Heyworth J, Marks G. There Is No ‘Safe' Level of Air Pollution: Implications for Australian policy. University of Tasmania. Report (2021). Available online at: https://hdl.handle.net/102.100.100/494858
32. Australian Bureau of Statistics. Regional Population. Statistics About the Population for Australia's Capital Cities and Regions. (2021). Available from: https://www.abs.gov.au/statistics/people/population/regional-population/latest-release#data-download (accessed March 14, 2022).
33. Centre for Epidemiology and Evidence. New South Wales Mothers and Babies 2020. (2021). Available from: https://www.health.nsw.gov.au/hsnsw/Publications/mothers-and-babies-2020.pdf (accessed March 10, 2021).
34. Australian Bureau of Statistics. Australian Statistical Geography Standard (ASGS): Volume 1 - Main Structure and Greater Capital City Statistical Areas. (2016). Available from: http://www.abs.gov.au/ausstats/abs@.nsf/lookup/by%20subject/1270.0.55.001~july%202016~main%20features~statistical%20area%20level%202%20(sa2)~10014#:~:text=Statistical%20Areas%20Level%202%20(SA2,Australia%20without%20gaps%20or%20overlaps (accessed March 14, 2022).
35. Kramer MS, Séguin L, Lydon J, Goulet L. Socio-economic disparities in pregnancy outcome: why do the poor fare so poorly? Paediatr Perinat Epidemiol. (2000) 14:194–210. doi: 10.1046/j.1365-3016.2000.00266.x
36. Strand LB, Barnett AG, Tong S. Maternal exposure to ambient temperature and the risks of preterm birth and stillbirth in Brisbane, Australia. Am J Epidemiol. (2012) 175:99–107. doi: 10.1093/aje/kwr404
37. Hajat A, MacLehose RF, Rosofsky A, Walker KD, Clougherty JE. Confounding by socioeconomic status in epidemiological studies of air pollution and health: challenges and opportunities. Environ Health Perspect. (2021) 129:065001. doi: 10.1289/EHP7980
38. Strand LB, Barnett AG, Tong S. Methodological challenges when estimating the effects of season and seasonal exposures on birth outcomes. BMC Med Res Methodol. (2011) 11:49–49. doi: 10.1186/1471-2288-11-49
39. Neophytou AM, Kioumourtzoglou M-A, Goin DE, Darwin KC, Casey JA. Educational note: addressing special cases of bias that frequently occur in perinatal epidemiology. Int J Epidemiol. (2020) 50:337–45. doi: 10.1093/ije/dyaa,252
40. Van Buskirk J, Hanigan I. Bushfire Specific PM25 Surface at ABS SA1 for Sydney GMR 2006-2020. (2021). Available from: https://cloudstor.aarnet.edu.au/plus/f/5638670382 (accessed December 16, 2022).
41. Jegasothy E, Hanigan IC, Van Buskirk J, Morgan GG, Jalaludin B, Johnston FH, et al. Acute health effects of bushfire smoke on mortality in Sydney, Australia. Environ Int. (2023) 171:107684. doi: 10.1016/j.envint.2022.107684
42. Australian Bureau of Meteorology. Australian Gridded Climate Data (AGCD)/AWAP; v1.0.0 Snapshot (1900-01-01 to 2020-06-30). (2020). Available from: http://www.bom.gov.au/metadata/catalogue/19115/ANZCW0503900567?template=full (accessed December 20, 2022).
43. Jones DA, Wang W, Fawcett R. High-quality spatial climate data-sets for Australia. Aust Meteorol Oceanogr J. (2009) 58:233. doi: 10.22499/2.5804.003
44. Perkins SE, Alexander LV. On the measurement of heat waves. J Clim. (2013) 26:4500–17. doi: 10.1175/JCLI-D-12-00383.1
45. Chaston TB, Broome RA, Cooper N, Duck G, Geromboux C, Guo Y, et al. Mortality burden of heatwaves in Sydney, Australia is exacerbated by the urban heat island and climate change: can tree cover help mitigate the health impacts? Atmosphere. (2022) 13:714. doi: 10.3390/atmos13050714
46. Textor J, van der Zander B, Gilthorpe MS, Liskiewicz M, Ellison GT. Robust causal inference using directed acyclic graphs: the R package 'dagitty'. Int J Epidemiol. (2016) 45:1887–94. doi: 10.1093/ije/dyw341
47. Li S, Guo Y, Williams G. Acute impact of hourly ambient air pollution on preterm birth. Environ Health Perspect. (2016) 124:1623–9. doi: 10.1289/EHP200
48. Pereira G, Haggar F, Shand AW, Bower C, Cook A, Nassar N. Association between pre-eclampsia and locally derived traffic-related air pollution: a retrospective cohort study. J Epidemiol Community Health. (2013) 67:147–52. doi: 10.1136/jech-2011-200805
49. Samuels L, Nakstad B, Roos N, Bonell A, Chersich M, Havenith G, et al. Physiological mechanisms of the impact of heat during pregnancy and the clinical implications: review of the evidence from an expert group meeting. Int J Biometeorol. (2022) 66:1505–13. doi: 10.1007/s00484-022-02301-6
50. Deschenes O. Temperature, human health, and adaptation: a review of the empirical literature. Energy Econ. (2014) 46:606–19. doi: 10.1016/j.eneco.2013.10.013
51. He J-R, Liu Y, Xia X-Y, Ma W-J, Lin H-L, Kan H-D, et al. Ambient temperature and the risk of preterm birth in Guangzhou, China (2001–2011). Environ Health Perspect. (2016) 124:1100–6. doi: 10.1289/ehp.1509778
52. Jalaludin B, Mannes T, Morgan G, Lincoln D, Sheppeard V, Corbett S. Impact of ambient air pollution on gestational age is modified by season in Sydney, Australia. Environ Health. (2007) 6:16. doi: 10.1186/1476-069X-6-16
53. Landrigan PJ, Fuller R, Acosta NJR, Adeyi O, Arnold R, Basu N, et al. The Lancet Commission on pollution and health. Lancet. (2018) 391:462–512. doi: 10.1016/S0140-6736(17)32345-0
54. Guan T, Xue T, Gao S, Hu M, Liu X, Qiu X, et al. Acute and chronic effects of ambient fine particulate matter on preterm births in Beijing, China: a time-series model. Sci Total Environ. (2019) 650(Pt 2):1671–7. doi: 10.1016/j.scitotenv.2018.09.279
55. Therneau TM. A Package for Survival Analysis in R. (2020). Available from: https://CRAN.R-project.org/package=survival (accessed March 10, 2022).
56. Araujo A, Meira-Machado L. smoothHR: Smooth Hazard Ratio Curves Taking a Reference Value (2013). Available online at: https://cran.r-project.org/web/packages/smoothHR/smoothHR.pdf
58. Breheny P, Burchett W. Visualization of regression models using visreg. R J. (2017) 9:56–71. doi: 10.32614/RJ-2017-046
59. Li S, Chen G, Jaakkola J, Williams G, Guo Y. The impacts of ambient temperature on stillbirth and preterm birth: Brisbane, 1994-2013. In: ISEE Conference Abstracts. (Sydney, NSW) (2018).
60. Li S, Chen G, Jaakkola JJK, Williams G, Guo Y. Temporal change in the impacts of ambient temperature on preterm birth and stillbirth: Brisbane, 1994-2013. Sci Total Environ. (2018) 634:579–85. doi: 10.1016/j.scitotenv.2018.03.385
61. Wang J, Williams G, Guo Y, Pan X, Tong S. Maternal exposure to heatwave and preterm birth in Brisbane, Australia. BJOG. (2013) 120:1631–41. doi: 10.1111/1471-0528.12397
62. Holder B. Peer review report for: a protocol for an observational cohort study of heat strain and its effect on fetal wellbeing in pregnant farmers in the Gambia [version 2; peer review: 2 approved]. Wellcome Open Res. (2020) 5:32. doi: 10.21956/wellcomeopenres.17328.r38292
63. Konkel L. Taking the heat: potential fetal health effects of hot temperatures. Environ Health Perspect. (2019) 127:102002. doi: 10.1289/EHP6221
64. Schifano P, Asta F, Dadvand P, Davoli M, Basagana X, Michelozzi P. Heat and air pollution exposure as triggers of delivery: a survival analysis of population-based pregnancy cohorts in Rome and Barcelona. Environ Int. (2016) 88:153–9. doi: 10.1016/j.envint.2015.12.013
65. Li J, Woodward A, Hou X-Y, Zhu T, Zhang J, Brown H, et al. Modification of the effects of air pollutants on mortality by temperature: a systematic review and meta-analysis. Sci Total Environ. (2017) 575:1556–70. doi: 10.1016/j.scitotenv.2016.10.070
66. Gordon CJ. Role of environmental stress in the physiological response to chemical toxicants. Environ Res. (2003) 92:1–7. doi: 10.1016/S0013-9351(02)00008-7
67. Gordon CJ, Johnstone AFM, Aydin C. Thermal stress and toxicity. Compr Physiol. (2011) 4:995–1016. doi: 10.1002/cphy.c130046
68. Canals M, Figueroa DP, Miranda JP, Sabat P. Effect of gestational and postnatal environmental temperature on metabolic rate in the altricial rodent, Phyllotis darwini. J Therm Biol. (2009) 34:310–4. doi: 10.1016/j.jtherbio.2009.04.003
69. Lin Y, Hu W, Xu J, Luo Z, Ye X, Yan C, et al. Association between temperature and maternal stress during pregnancy. Environ Res. (2017) 158:421–30. doi: 10.1016/j.envres.2017.06.034
70. Wadhwa PD, Garite TJ, Porto M, Glynn L, Chicz-DeMet A, Dunkel-Schetter C, et al. Placental corticotropin-releasing hormone (CRH), spontaneous preterm birth, and fetal growth restriction: a prospective investigation. Am J Obstet Gynecol. (2004) 191:1063–9. doi: 10.1016/j.ajog.2004.06.070
71. Carder M, McNamee R, Beverland I, Elton R, Van Tongeren M, Cohen GR, et al. Interacting effects of particulate pollution and cold temperature on cardiorespiratory mortality in Scotland. Occup Environ Med. (2008) 65:197–204. doi: 10.1136/oem.2007.032896
72. Williams R, Rankin N, Smith T, Galler D, Seakins P. Relationship between the humidity and temperature of inspired gas and the function of the airway mucosa. Crit Care Med. (1996) 24:1920–9. doi: 10.1097/00003246-199611000-00025
73. Spolter F, Kloog I, Dorman M, Novack L, Erez O, Raz R. Prenatal exposure to ambient air temperature and risk of early delivery. Environ Int. (2020) 142:105824. doi: 10.1016/j.envint.2020.105824
74. Jegasothy E, Randall DA, Ford JB, Nippita TA, Morgan GG. Maternal factors and risk of spontaneous preterm birth due to high ambient temperatures in New South Wales, Australia. Paediatr Perinat Epidemiol. (2022) 36:4–12. doi: 10.1111/ppe.12822
75. Longden T. Measuring temperature-related mortality using endogenously determined thresholds. Clim Change. (2018) 150:343–75. doi: 10.1007/s10584-018-2269-0
76. Longden T. Temperature-related mortality and climate change in Australia. Lancet Planet Health. (2019) 3:e121. doi: 10.1016/S2542-5196(19)30016-6
77. Stieb DM, Lavigne E, Chen L, Pinault L, Gasparrini A, Tjepkema M. Air pollution in the week prior to delivery and preterm birth in 24 Canadian cities: a time to event analysis. Environ Health. (2019) 18:1. doi: 10.1186/s12940-018-0440-8
78. Moutquin J-M. Classification and heterogeneity of preterm birth. BJOG Int J Obstet Gynaecol. (2003) 110:30–3. doi: 10.1046/j.1471-0528.2003.00021.x
Keywords: ambient temperature, air pollution, perinatal, preterm birth, survival analysis, environmental health, environmental epidemiology
Citation: Singh T, Jalaludin B, Hajat S, Morgan GG, Meissner K, Kaldor J, Green D and Jegasothy E (2023) Acute air pollution and temperature exposure as independent and joint triggers of spontaneous preterm birth in New South Wales, Australia: a time-to-event analysis. Front. Public Health 11:1220797. doi: 10.3389/fpubh.2023.1220797
Received: 25 May 2023; Accepted: 23 October 2023;
Published: 30 November 2023.
Edited by:
Ciro Fernando Bustillo LeCompte, Toronto Metropolitan University, CanadaReviewed by:
Xiao-Wen Zeng, Sun Yat-sen University, ChinaWorradorn Phairuang, Kanazawa University, Japan
Carmen Rubio, Manuel Velasco Suárez National Institute of Neurology and Neurosurgery, Mexico
Copyright © 2023 Singh, Jalaludin, Hajat, Morgan, Meissner, Kaldor, Green and Jegasothy. This is an open-access article distributed under the terms of the Creative Commons Attribution License (CC BY). The use, distribution or reproduction in other forums is permitted, provided the original author(s) and the copyright owner(s) are credited and that the original publication in this journal is cited, in accordance with accepted academic practice. No use, distribution or reproduction is permitted which does not comply with these terms.
*Correspondence: Tanya Singh, dGFueWEuc2luZ2hAdW5zdy5lZHUuYXU=
†Present address: Geoffrey G. Morgan, Centre for Safe Air, National Health and Medical Research Council Centre of Excellence, University of Tasmania, Hobart, TAS, Australia