 Aklilu Habte
 Aiggan Tamene
 Legesse Tesfaye
- School of Public Health College of Medicine and Health Sciences, Wachemo University, Hosanna, Ethiopia
Background: Existing studies in the Sub-Saharan African (SSA) region have focused mainly on the frequency of postnatal visits, with little emphasis on the adequacy of care provided during visits. Hence, this study aimed to investigate the magnitude of receiving an adequate number of World Health Organization-recommended contents of care during the immediate postpartum visit, and its predictors in SSA countries.
Methods: The appended women file of the most recent (2016–2021) standardized Demographic and Health Survey report of eighteen Sub-Saharan African countries with a weighted sample of 56,673 women was used for the study. The influence of each predictor on the uptake of adequate postnatal care has been examined using multilevel mixed-effects logistic regression. Significant predictors were reported using the adjusted odds ratio (aOR) with their respective 95% confidence intervals (95% CI).
Results: The pooled prevalence of adequate postnatal care service uptake was found to be 42.94% (95% CI: 34.14, 49.13). Living in the southern sub-region (aOR = 3.08 95% CI: 2.50, 3.80), institutional delivery (aOR = 3.15; 95% CI: 2.90, 3.43), early initiation of ANC (aOR = 1.74; 95% CI: 1.45, 2.09), quality of antenatal care (aOR = 1.59; 95% CI: 1.42, 1.78), Caesarean delivery (aOR = 1.59; 95% CI: 1.42, 1.78), autonomy in decision-making (aOR = 1.30; 95% CI: 1.11, 1.39), high acceptance toward wife beating attitude (aOR = 0.83; 95% CI: 0.73, 0.94), and reading newspapers (aOR = 1.37; 95% CI: 1.21, 1.56) were identified as predictors of receiving adequate postnatal services during the immediate postpartum period.
Conclusion: The findings revealed low coverage of adequate postnatal care service uptake in the region. The Federal Ministry of Health and healthcare managers in each country should coordinate their efforts to develop interventions that promote women’s empowerment to enhance their autonomy in decision-making and to reduce attitudes towards wife beating. Healthcare providers ought to strive to provide skilled delivery services and early initiation of antenatal care.
Introduction
The days and weeks following childbirth, known as the postnatal period, are essential in the lives of both mothers and newborns (1). This is a critical time for women and newborns. Major physical, social, and emotional changes occurred during this period; nonetheless, it is typically the most neglected period on the maternal and childcare continuum (2). The majority of maternal and neonatal deaths occur within the first 42 days, with over half of postpartum maternal deaths occurring within the first 24 h (3) and 66% occurring within the first week (4). In 2013, 2.8 million newborns died in their first month of life, with one million dying on the first day (5).
Despite an increase in the number of maternal and child health programs and global maternal health efforts, the risk of both maternal and neonatal death after childbirth remains high in developing countries (6). Almost all (99%) maternal and newborn mortality occur in developing countries, with South Asia and Sub-Saharan Africa (SSA) exhibiting the highest rates. Tragically, it is projected that 390 women will die in childbirth for every 100,000 live births in Sub-Saharan Africa by 2030 (7). This is more than five times the 2030 SDG target of fewer than 70 maternal deaths per 100,000 live births, and significantly higher than the European average of thirteen deaths per 100,000 live births in 2017 (7, 8). The increment in morbidity and death is typically the result of a lack of appropriate, suitable, or timely care during that period (9).
Preterm birth, birth asphyxia, and sepsis account for more than 75% of all neonatal deaths, while postpartum haemorrhage and infections account for 80% of maternal deaths (10). All of these are avoidable and manageable causes if high-quality care is provided during the early and early postpartum period (10, 11). Postnatal Care (PNC) is a constellation of services provided to the mother and newborn throughout the first 42 days of life, starting as soon as the expulsion of the placenta (11). It is crucial for the woman and her newborn to recognize and treat health problems during the postpartum period, as well as to provide information to the mother about her and her newborn’s health (3). In addition, the services provided during this period have significance in preventing physical and mental deterioration in post-natal mothers. An array of services provided during this pivotal period are promoting healthy behaviours such as breastfeeding, assessment and treatment of maternal and neonatal danger signs via proper cord examination and cleaning, measurement of newborn body temperature, and referral service to advanced care (11–13).
Integration of PNC with the existing health system is a practicable and viable solution for reducing the high burden of preventable maternal and neonatal morbidity and achieving maternal health-related Sustainable Development Goal (SDG) targets (14). Despite this only 48% of women in SSA had skilled delivery services, less than half received PNC contact within 2 days of childbirth, and only 13% of women who gave birth at home received postpartum visits within 2 days of delivery (4, 12). This means that PNC is one of the most neglected services among all reproductive and child health interventions.
Through a technical consultation process, the World Health Organization (WHO) recently updated global recommendations on the timing and content of PNC for women and newborns with a particular emphasis on resource-constrained settings in low-and middle-income countries (LMIC) (11). Regardless of where childbirth takes place, the WHO recommends that all mothers and newborns receive four postpartum visits: the first within the first 24 h, followed by the second, third, and fourth visits within 3–4, 7–14, and 42 days following child birth, respectively (11). Receiving adequate postnatal care, which includes clinical and non-clinical maternal and newborn care, health promotion, and health systems interventions, is one of the quality indicators in maternal health service provision and it plays a significant role in lowering preventable deaths in the postpartum period (15). However, existing studies in the SSA region (16–18) have focused mainly on the frequency of PNC visits, with little emphasis on the contents of care provided during visits.
Hence, this study aimed at investigating the magnitude of receiving an adequate care during PNC visits, and its predictors at the individual and community levels. The findings of this study will help policymakers, programme managers, and service providers in devising intervention plans by acting on individual and community-level variables that hinder the uptake of basic PNC packages. This, in turn, will reduce maternal and newborn deaths, enhance health outcomes, and promote community-based health systems and women-centered maternity care in the region.
Methods
Data source, population, and study period
The most recent Demographic and Health Surveys (2016–2021) data from eighteen Sub-Saharan African countries were used for this study. The DHS is a nationwide representative survey that collects data relating to basic maternal and child health indicators. The current dataset has been created by appending women files (IR) together, which is proper for most woman-level analyses based on fertility, contraception, and prenatal, intrapartum, and postpartum service uptake. The current study covered countries having recent standardized DHS reports from 2016 to 2021 containing complete information on the relevant variables. Only women of reproductive age who had at least one PNC visit were included. A total of a weighted sample of 56,673 women of reproductive age who gave birth in the last 2 years preceding the survey were included in the analysis (Table 1).

Table 1. List of the SSA countries included in the analysis with their respective weighted sample size, 2016–2021.
Data collection tool and procedures
Using standardized questionnaires developed in each country’s official language, the data were collected through face-to-face interviews with trained data collectors. To select study participants, the DHS employs a two-stage stratified sampling technique. The first stage entailed selecting enumeration areas (EAs) and listing households within those EAs using the most recent population and housing census data from each country as a sampling frame. In the second stage, households were selected using an equal probability sampling technique. The Demographic and Health Survey Sampling and Household Listing Manual developed by ICF International goes over the thorough sampling technique implemented during DHS (19).
Measurement of variables of the study
The outcome variable of the current study was the receipt of adequate PNC services during the immediate postpartum period. Per WHO recommendation, the following five components were used to assess the receipt of adequate PNC service: the newborn’s cord was inspected, the newborn’s temperature was measured, the mother was counseled about newborn danger signs, breastfeeding counseling, and an observation of a breastfeeding session (11). The services obtained during the immediate PPP were assessed using the following questions: “During the first 2 days, did the health provider examine the newborn’s cord?,” “During the first 2 days, did the health provider measure the newborn’s temperature?…” If a mother said “Yes,” the response was labeled as 1, otherwise as 0. During the same childbirth, a single mother can respond that cord care was given to her newborn or that her newborn’s temperature was taken numerous times, but all response was recorded as a single service. A composite index of PNC service items was generated based on the responses, which is a tally of the number of key elements of PNC received. The variable had a minimum value of zero, indicating that none of the above-mentioned services were received, and a maximum value of five, indicating that the woman received all services during PPP. When a woman got all five service items, she was deemed to have received adequate services during PPP (15).
Explanatory variables
Following a review of relevant studies, individual and community-level factors that are supposed to influence the receipt of adequate postnatal care service were extracted from the data (Table 2).
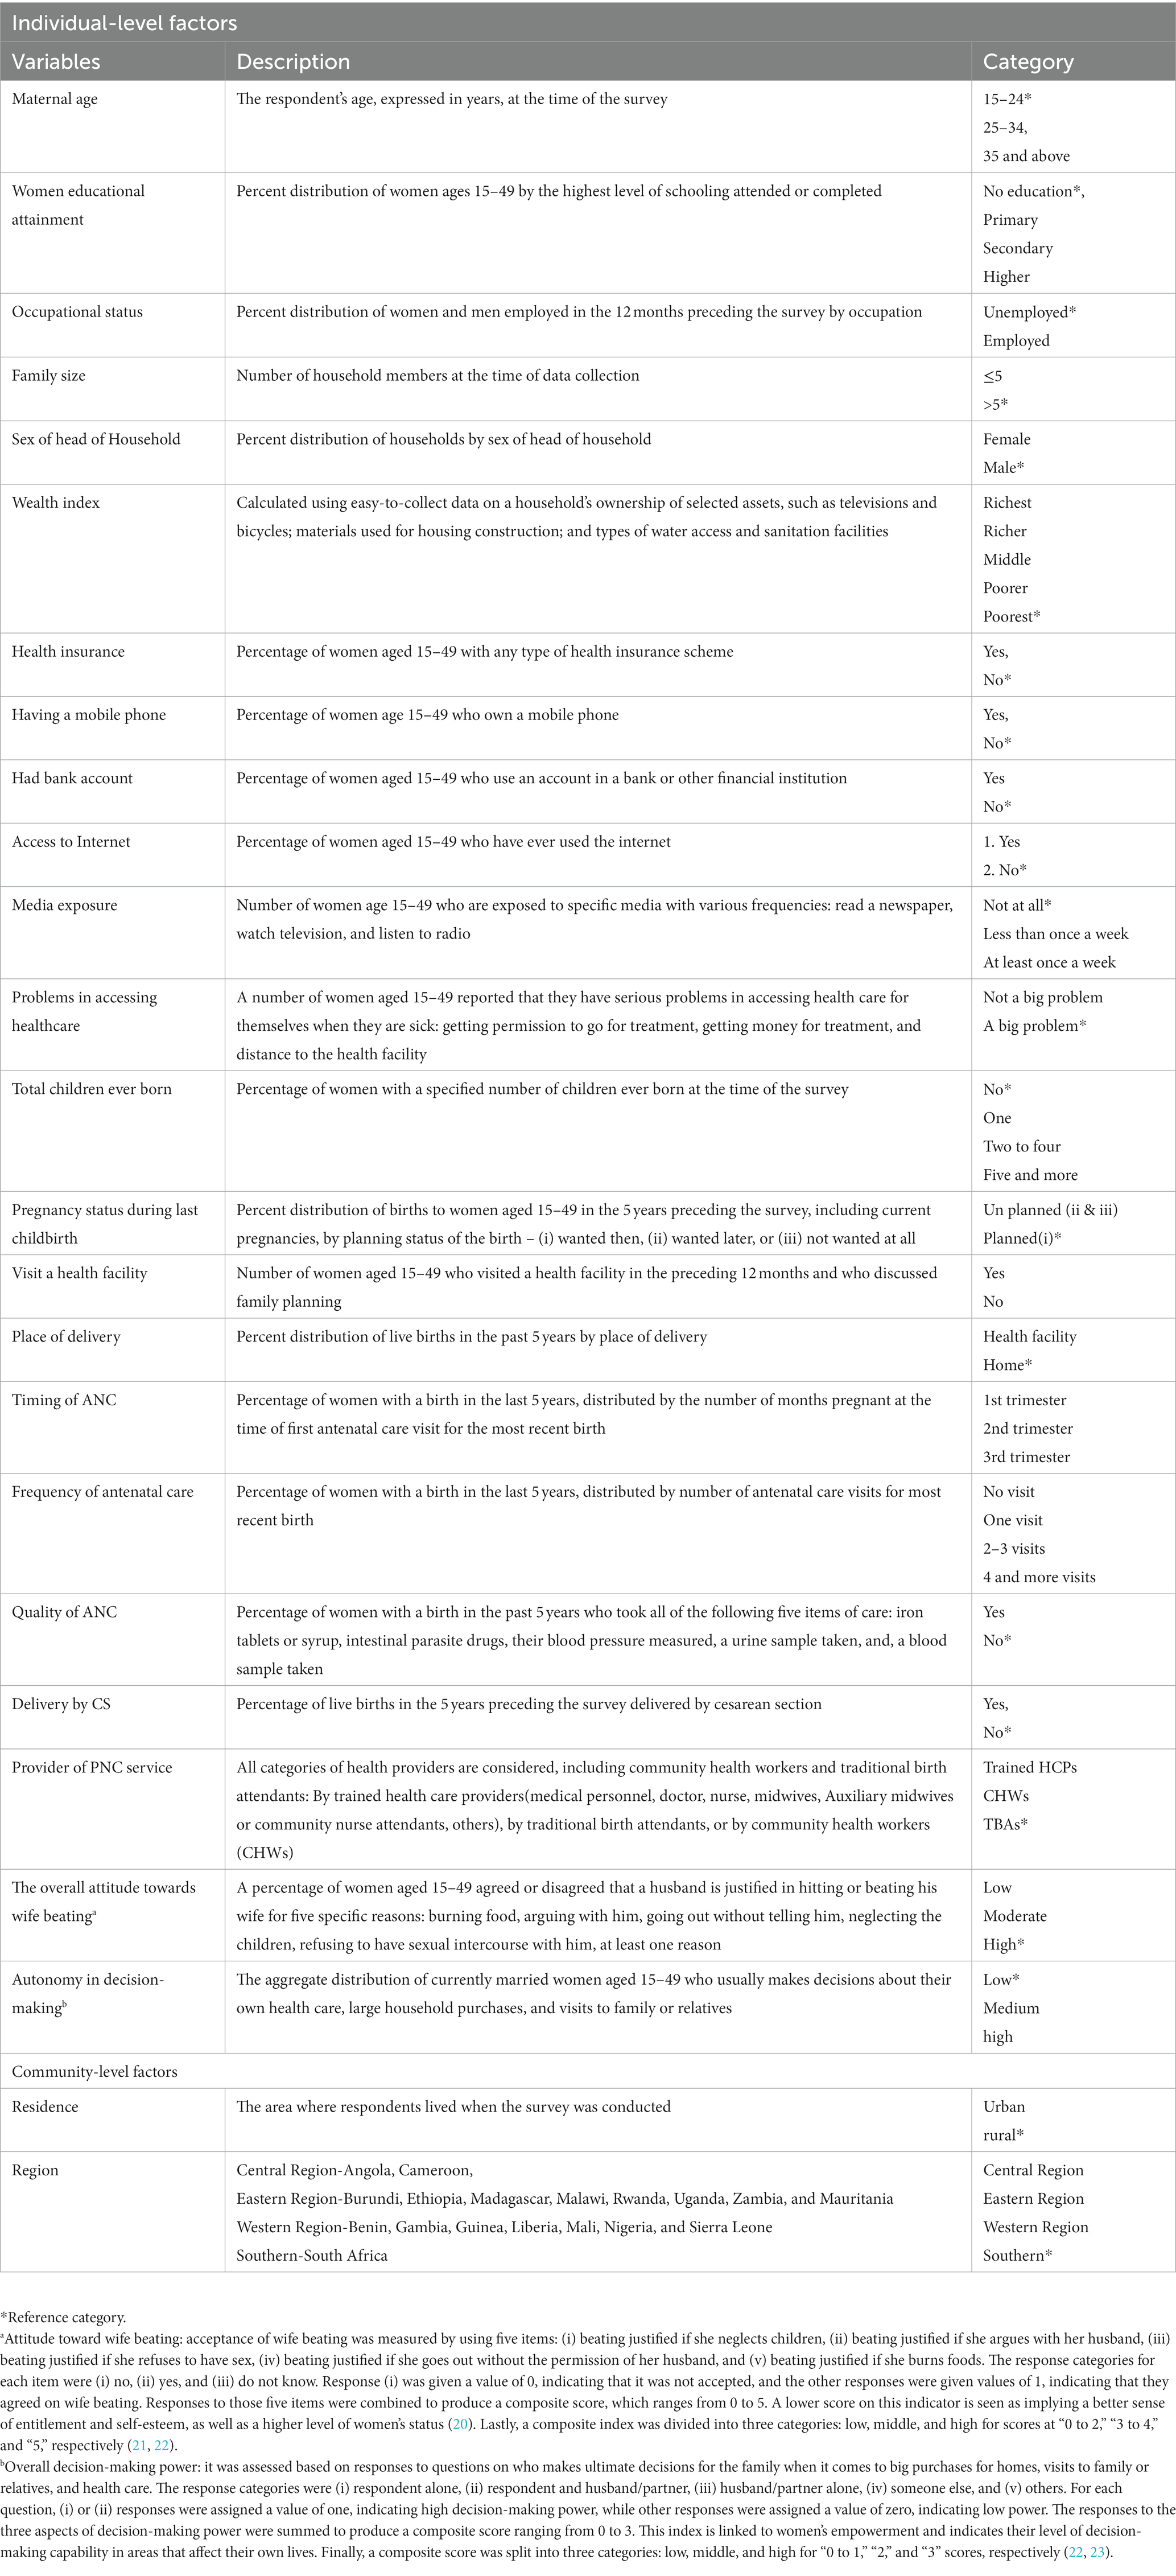
Table 2. List of factors that affect the uptake of adequate PNC services during the immediate postpartum period in SSA countries, 2016–2021.
Data management and statistical analyses
The most recent DHS reports from 18 SSA countries were appended, recoded, cleaned, and analyzed using STATA version 16.0. Weighting was done to ensure the statistical representativeness of the survey and to come up with robust statistical estimates. Descriptive statistics such as frequencies, percentages, and the mean of the covariates across the outcome variables were computed to figure out the characteristics of the respondents. Using random meta-analysis, the pooled prevalence of adequate PNC service usage was estimated.
Multilevel analyses
Because the DHS data is hierarchical, it defied assumptions of ordinary regression such as independence of observations and equal variance. This implies that the between-cluster variability needs to be considered, and so advanced models like multilevel mixed-effect regression analyses were employed to handle those issues. Running a multilevel analysis upon such hierarchical data allows for minimal biased parameter estimates.
Statistical model building and selection
Fixed effects (measures of association)
Since a receipt of adequate PNC is an outcome variable that is categorized as Yes = 1 or No = 0, a multilevel mixed-effect logistic regression model was fitted. First, a multilevel bivariable logistic regression analysis was carried out to examine the relationship between each predictor and receipt of adequate PNC, and variables with value of p < 0.25 were entered into a multilevel multivariable mixed-effect logistic regression. In the multilevel multivariable logistic regression model, adjusted odds ratios (aOR) with a 95% CI were used to identify significant predictors of adequate PNC uptake. The Variance Inflation Factor (VIF) was estimated to check for the presence of multicollinearity between the variables, and it found that there was no significant multicollinearity (the VIF ranged from 1.02 to 6.40, with a mean of 1.62).
Random effects (measures of variation)
Four distinct models were fitted to identify significant predictors. Model-I is a null model (with no covariates), Model II (contains only individual-level factors), Model-III (contains only community-level factors), and Model-IV (a full model comprising both individual-and community-level factors).
Intra-class correlation coefficient (ICC), median odds ratio (MOR), and proportional change in variance (PCV) metrics were computed for measures of variation.
ICC is a measure of the degree of heterogeneity of not having full PCV between clusters, and it was determined using:
where Var(b) is the estimated variance each model and Var(w) is a predicted individual variance component, which is π2/3 ≈ 3.29.
The PCV was used to evaluate the contribution of individual-and/or community-level factors to the overall variation in the null model, and it was determined by:
where, Va is the variance of the initial model (null model) and Vb = variance of the subsequent models (models 2, 3, and 4).
Model fitness
Model comparability and fitness were based on Deviance = −2 * Log Likelihood (LL), Akaike’s information criteria (AIC), and Schwarz’s Bayesian Information Criterion (BIC). The model with the lowest AIC and deviance was selected for the final interpretation of the findings.
Results
Socio-demographic and obstetric characteristics of respondents
This study was based on a weighted sample of 56,673 women of reproductive age in SSA countries who gave birth within 2 years preceding the survey. Nearly half (48.1%) and more than one-third (37.4%) of respondents were from western and eastern sub-regions, respectively. Nigeria, Malawi, and Gambia all contributed considerably to the sample size, with 16.0, 10.5, and 10.3%, respectively. The mean (±SD) age of respondents was 29.17(±7.21) years, with the majority (46.3%) being between the ages of 25 and 34. The majority (58.2%) of respondents were rural residents. There was a statistically significant difference in the receipt of adequate PNC across women’s educational levels, sub-regions, place of residence, sex of head of household, and the total number of children ever born (p < 0.001) (Table 3).
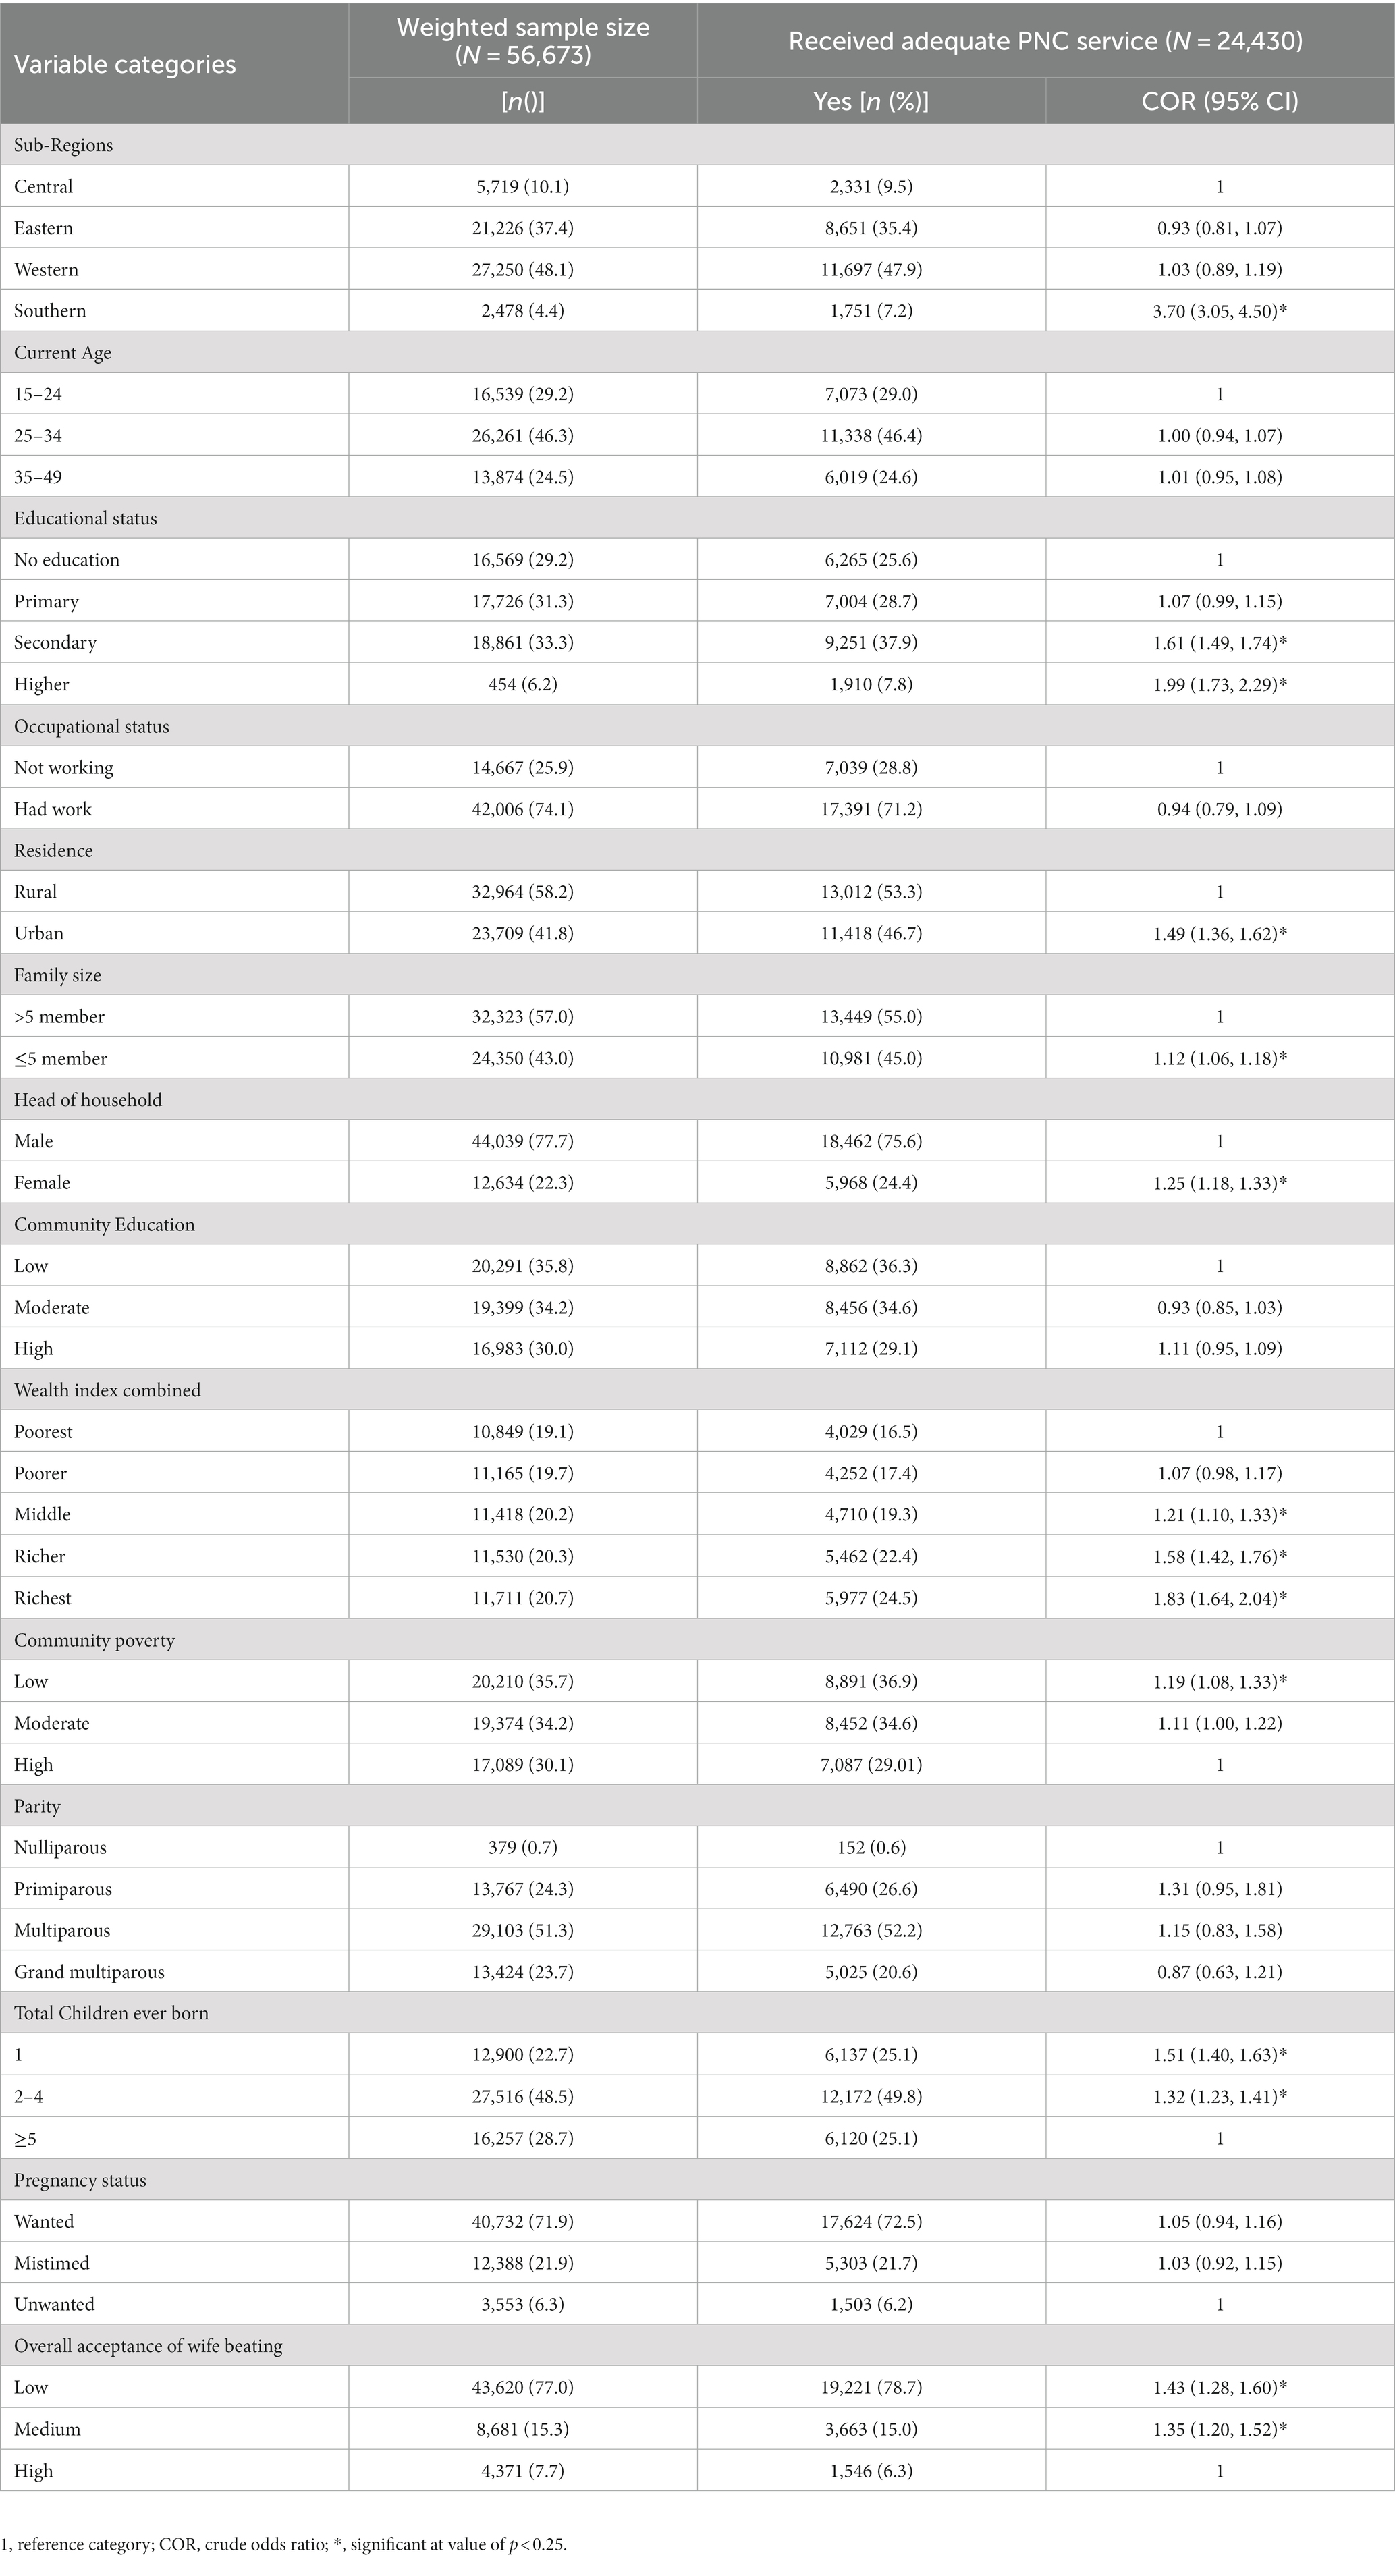
Table 3. The receipt of adequate services during immediate postpartum period across socio-demographic and obstetric characteristics of women in SSA countries, 2016–2021.
Health service-related characteristics of respondents
Almost three-quarters (73.1%) of women had their last childbirth in a health facility. In terms of ANC service utilization, 40.1% of women received their 1st ANC visit during the first trimester, whereas just 6.4% received four or more ANC visits. Only one-third (33.0%) of women received all of the WHO-recommended items of care during their most recent ANC visits (Figure 1). Almost half of all women (47.7%) were non-autonomous in decision-making. Lack of money, distance to health facilities, and inability to get permission have been identified as important barriers to receiving healthcare services by 45.7, 34.4, and 13.6% of women, respectively. Of women, 82.3, 38.2, and 51.2% had never watched television, never read a newspaper, and never listened to the radio, respectively. Only 5.6% of women were enrolled in any type of health insurance scheme (Table 4).
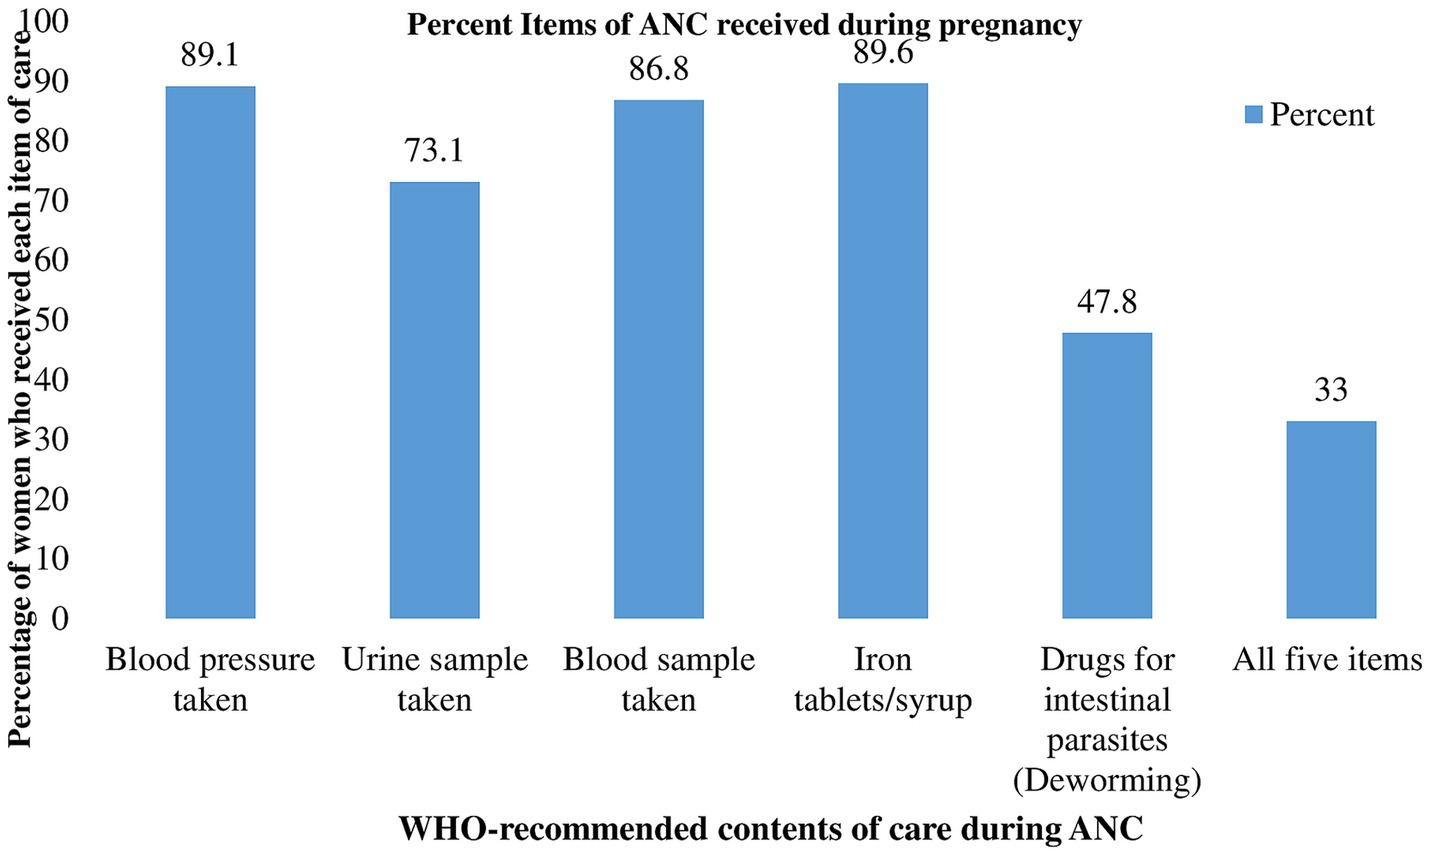
Figure 1. Percentage distribution of the WHO-recommended contents of ANC received during the most recent pregnancy in SSA, 2016–2021.
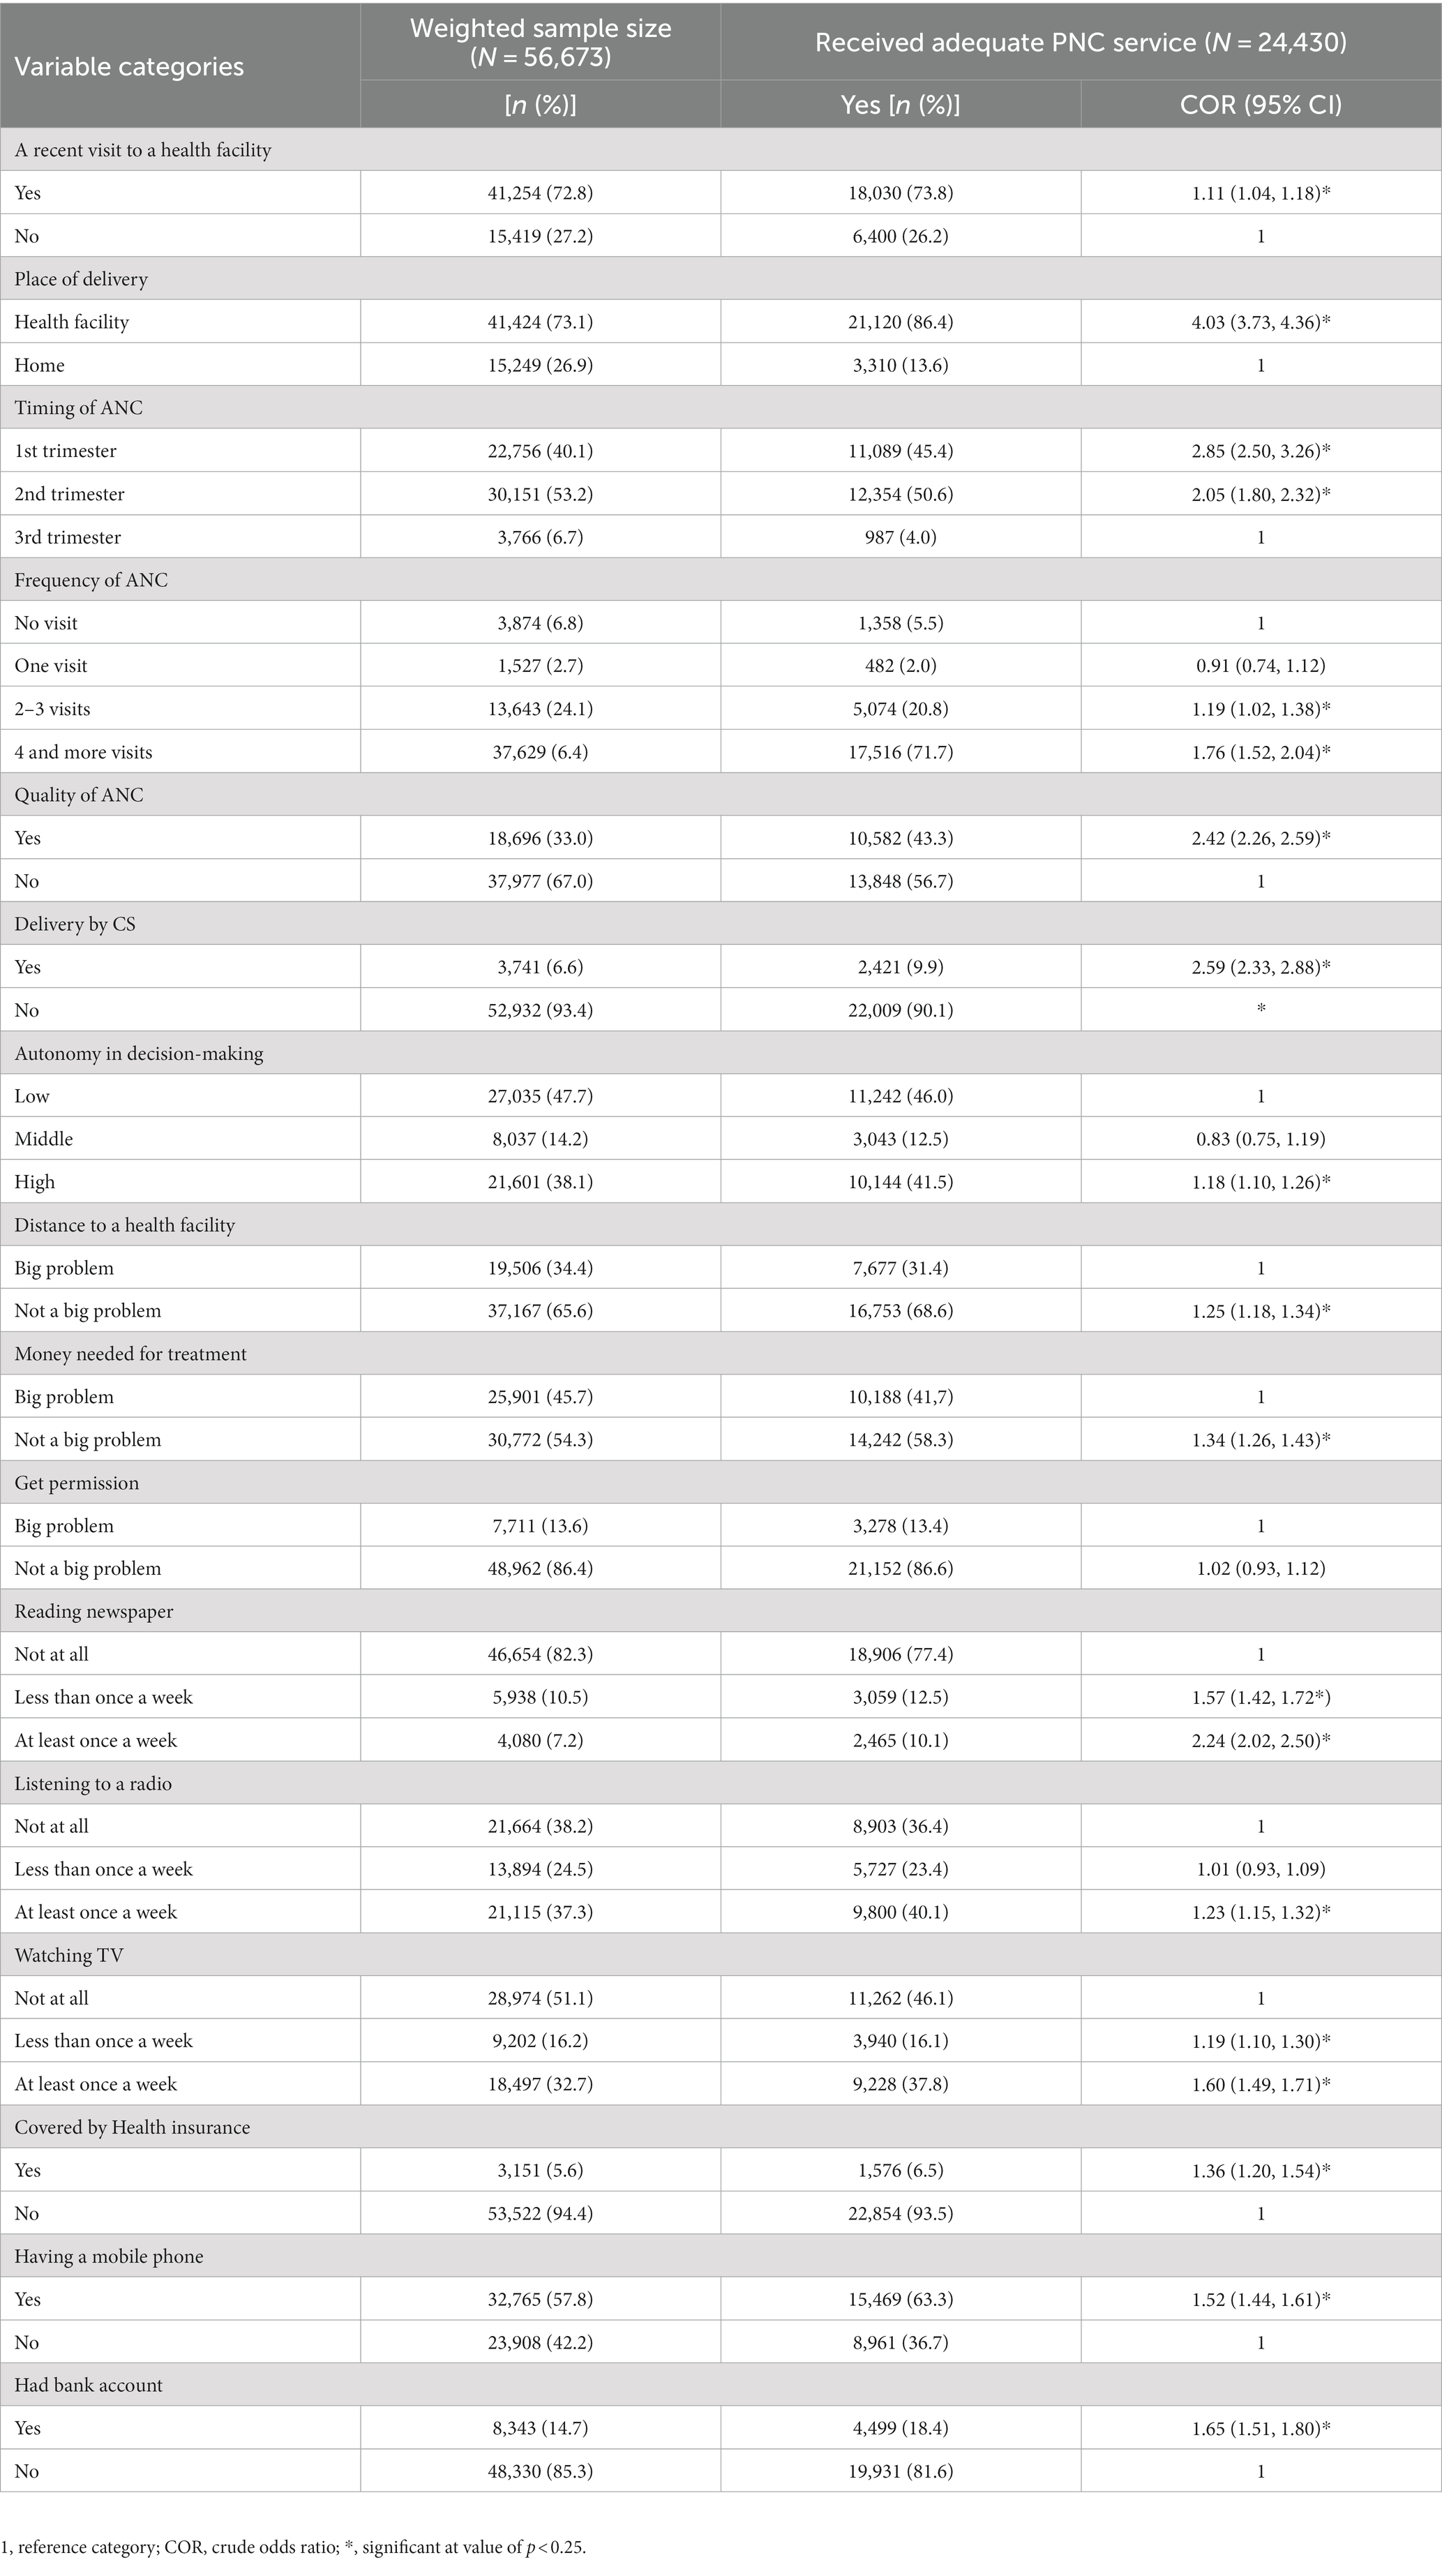
Table 4. The receipt of adequate services during immediate postpartum period across health service-related characteristics women in SSA countries, 2016–2021.
The uptake of adequate PNC in SSA countries
The pooled prevalence of adequate postnatal care service uptake in SSA countries was 42.94% [95% CI: 34.14, 49.13]. The proportion of women receiving adequate postnatal care services was high in the southern (72.9%) and western (46.88%) sub regions, and lowest in the eastern (33.9%) one. South Africa (72.9%) and Burundi (10.80%) had the highest and lowest proportions of adequate PNC service uptake, respectively (Figure 2). Regarding the individual contents of care, the majority of women (79.9%) received at least one of the five essential contents of care. 9.2 and 13.9% of women received three and four items of care, respectively (Figure 3). The majority of women received cord examination, breastfeeding counseling, and newborn body temperature measurement, with 69.0, 66.8, and 65.2%, respectively, (Figure 4).

Figure 2. A forest plot depicts the country and regional prevalence of adequate PNC in SSA countries, 2016–2021.
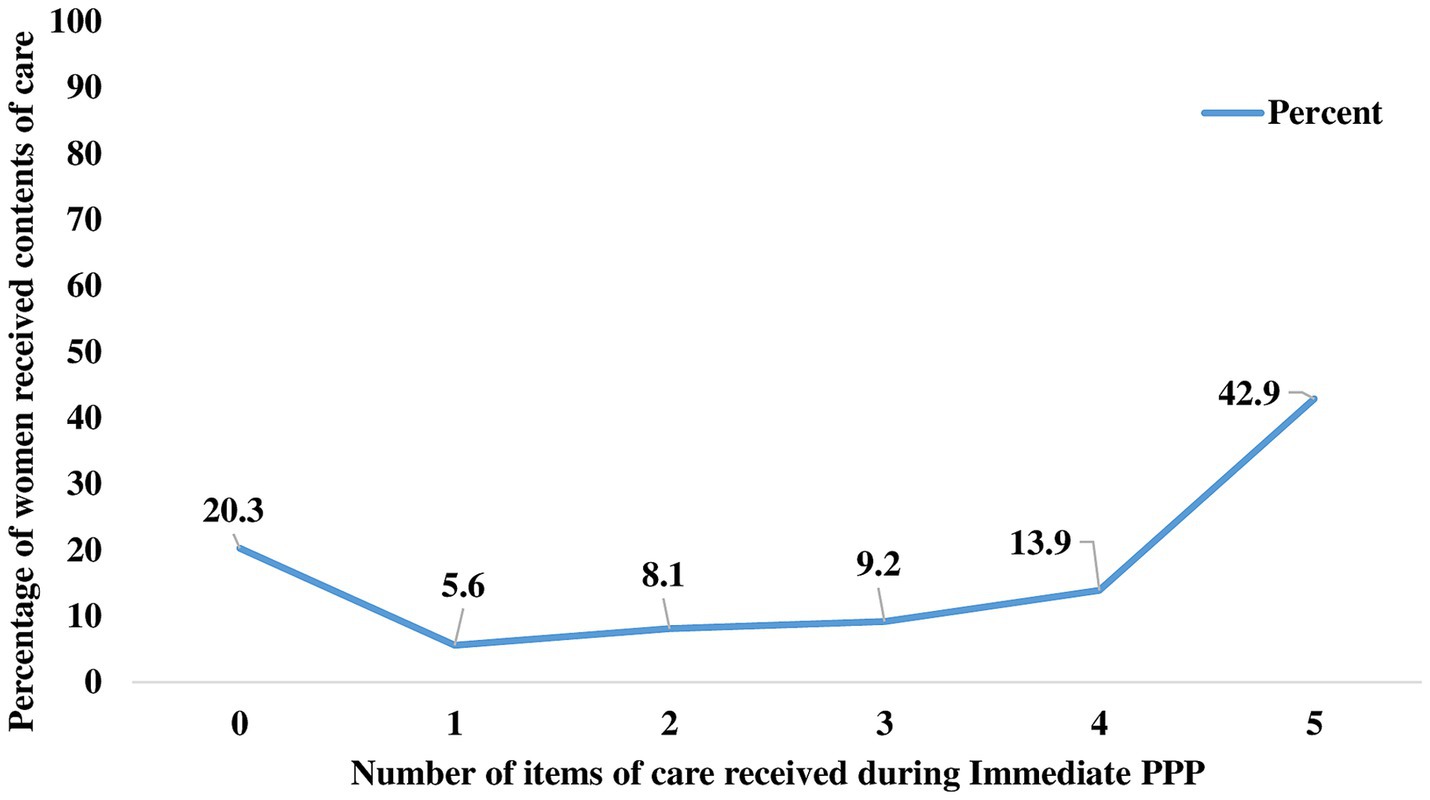
Figure 3. Number of contents of care received by women during the immediate PPP in SSA countries, 2016–2021.
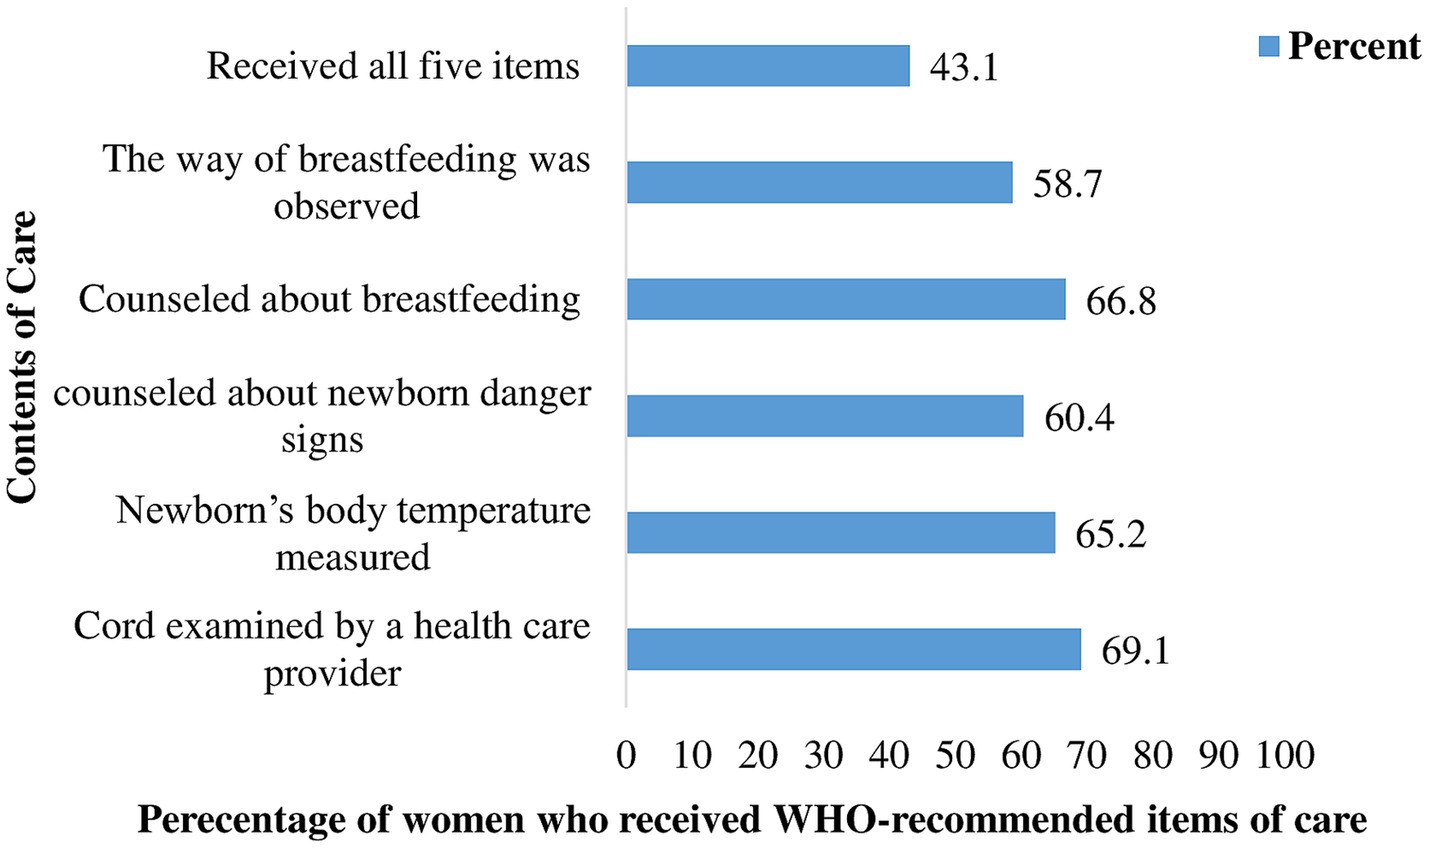
Figure 4. Percentage distribution of each item of care received by women in SSA, 2016–2021.
Random effect estimates (measures of variation)
The random effect estimates have been determined by fitting five models (Model I (null model), Model II, Model III, and Model IV). The null model showed significant variability in the likelihood of adequate PNC uptake among SSA countries (σ2 = 0.49, p < 0.001). ICC of 0.129 in the null model, implied that the difference within clusters contributed 12.9% of the total variation in the uptake of adequate PNC services. The proportional change in variance (PCV) in the full model was 23.9%, showing that both individual-and community-level factors explained 40.81% of the observed variation in the null model (Table 5).

Table 5. Results of a multivariable mixed-effect multivariable logistic regression to identify the determinants of adequate PNC service uptake in SSA countries, 2016–2021.
Fixed effect analysis
Determinants of adequate PNC visits: a multilevel-multivariable logistic regression
In a multilevel multivariable logistic regression analysis, variables namely, living in a southern sub-region, low acceptance of wife beating, reading newspapers, place of delivery, the timing of ANC, autonomy in decision-making, quality of ANC, and delivery by CS were identified as significant predictors of receiving adequate PNC services (see Figure 4).
Women residing in the southern region had 3.08 times higher odds of receiving adequate PNC during early PPP than women living in the central region (aOR = 3.08 95% CI: 2.50, 3.80). Timing and quality of ANC were also identified as significant predictors of adequate PNC service uptake. As compared to women who started their first prenatal visit in the third trimester, the odds of receiving adequate PNC were 1.74 (aOR = 1.74; 95% CI: 1.45, 2.09) and 1.53 (aOR = 1.53; 95% CI: 1.27, 1.83) times higher for those who commenced in the first and second trimesters, respectively. Similarly, women who gave birth in health facilities had a 3.15 (aOR = 3.15; 95% CI: 2.90, 3.43) times higher likelihood of receiving adequate PNC than those who gave birth at home. The odds of receiving adequate PNC services increased by 59% (aOR = 1.59; 95% CI: 1.42, 1.78) for women who delivered via CS versus spontaneous vaginal delivery (SVD). Women with high acceptance of wife-beating were 17% less likely to receive adequate PNC service than women with low acceptance (aOR = 0.83; 95% CI: 0.73, 0.94). Women who read newspapers at least once a week had 1.37 times a chance of receiving adequate PNC than women who never read (aOR = 1.37; 95% CI: 1.21, 1.56). Having the highest decision-making autonomy increased the likelihood of receiving adequate PNC service by 30% (aOR = 1.30; 95% CI: 1.11, 1.39) (Table 5).
Discussion
According to the World Health Organization’s vision for quality of care, countries should shift their focus from focusing solely on coverage of maternal health services to offering essential elements of care during each service delivery (24). The current study used the most recent demographic health surveys to analyze the level of adequate service uptake during the early postpartum period and its predictors in SSA countries. The findings indicate that less than half (42.94%) of women in the region received adequate PNC services. Overall, the adequacy of service uptake use is still too low to accomplish the expected reduction in maternal and newborn mortality and morbidity (24). This might be due to several factors, including a lack of community awareness about the contents of care and their importance, a shortage of healthcare providers, poor road infrastructure, transport challenges, and inadequate medical supplies, all of which are prevailing within the region (25–27). Therefore, governments and other stakeholders in the health system must enhance their efforts to improve both access to and the quality of PNC services. To do this, they should work on increasing community awareness, lowering healthcare costs (by facilitating access to transportation), strengthening home visits, along with enhancing the quality of care at service delivery points and encouraging pregnant women to give birth at health facilities (28–30).
The study examined the influence of factors at the individual and community levels. Accordingly, receiving adequate PNC service was significantly associated with living in a southern sub-region, low acceptance of wife beating, reading newspapers, place of delivery, the timing of ANC, autonomy in decision-making, and quality of ANC.
The subregion in which the women resided was shown to be associated with receipt of adequate PNC, those women in the Southern subregion being more likely to receive it than those in the Central region. This may be partially explained by differences in socioeconomic and cultural conditions that may impede access to healthcare facilities and cause disparities in the use of maternal health services. Given the context of this study, the southern region is represented by South Africa, which is known for its strong economic standing and may account for the uptake of adequate PNC services. This result is consistent with previous studies relating geographic disparities to PNC use in various low-and middle-income countries (15, 31–33).
Timing and quality of ANC were identified as significant predictors of adequate PNC and this was supported by studies conducted in India, Rwanda, Sierra Lion, Zambia, Malawi, and Nigeria (15, 31, 34–37). This could be explained by the fact that if a woman begins prenatal visits early (1st Trimester), she is more likely to receive the desired frequency of visits and counseling sessions. This may result in having enough information about PNC, its value, contents, and when and where to receive it, all of which raise the likelihood that she will receive adequate service (15, 38). Additionally, those women would have easy access to information about potential complications during the postpartum period and their related danger signs, all of which would boost their health-seeking behavior, and raise the possibility of receiving adequate services (39).
Birth at a health facility was also found to be positively associated with receiving adequate PNC service. This was in tandem with studies conducted in Low and Middle-income Countries (40), Indonesia (41), Kenya (42), Uganda (43), and Ethiopia (44). This could be due to healthcare providers informing mothers about the subsequent PPV at home, supported by birth notification following delivery to community health workers to give postpartum care at home visits, as documented by several African countries (44–46). Additionally, they have more chances to get information about the advantages and availability of PNC services at the community level during their stay at maternity wards, which also increases the uptake of adequate PNC (47).
The odds of receiving adequate PNC is found to be higher among women who gave their last birth by Caesarean section(CS) and this was supported by findings of studies conducted in Ethiopia (47). This may be because almost all of the women who underwent CS stayed at a healthcare center for at least 48–72 h, and as reported in many studies, this increased the likelihood that they would receive adequate PNC (44, 48, 49). Furthermore, the women themselves become more wary of postoperative complications, which would also raise their health-seeking behavior. However, it should be stressed that healthcare providers should take into account any potential hazards of CS in the woman’s future life, and they should do so in the context of strong clinical indications (50). In other words, non-medical justifications for CS delivery should be discouraged to the acceptable level advised by WHO (5–15%) (51) to tackle the possible health hazards following the procedure.
Women who exhibited high autonomy in decision-making power had higher odds of receiving adequate PNC services and this was in tandem with studies conducted in LMICs (52), Bangladesh (23), Nepal (53), and Ethiopia (13). This may be because as women attain greater autonomy in their mobility, household purchases, and healthcare decisions, they are less likely to face restraints from their husbands or other family members and are therefore more likely to use MNCH services (54). Women in the SSA region, where a patriarchal society is prevalent, are known to have a gross power imbalance when it comes to maternal and child health service usage because they lack the final say in important decisions that have an impact on their health and well-being (52, 55). Hence, regional and national government agencies have to collaborate in their effort to enhance women’s autonomy through initiatives like education, job opportunities, and finance that boost their ability for independence and decision-making.
When compared to their counterparts, women who were exposed to newspapers and magazines had a greater chance of receiving adequate PNC. Women who have access to this media outlet may also be more well-educated, come from a good socioeconomic background, reside close to health facilities, and have higher levels of health literacy, all of which may increase the likelihood that they will receive adequate postnatal services (15, 34, 56). Thus, media organizations and maternal health service programs should collaborate to ensure that women can access media platforms with adequate and comprehensive maternal health information.
Finally, having a high acceptance toward wife beating was also found to be negatively associated with the receipt of adequate PNC service. This was in line with other studies conducted in Bangladesh, Palestine, Albania, and Ethiopia (20, 57–59). This may be the case because a woman who perceives such violence to be “highly justifiable” will likely be aware of her lessened entitlement, confidence, and status as well as how this may negatively reflect on her sense of empowerment to access maternal health services (60, 61). Violence against women has drastically increased over the past few decades from being seen as a private or family issue to being seen as a social and public health concern with serious effects on health and the uptake of reproductive health services (62). The availability of services is frequently given top priority in most programs and interventions in SSA countries. However, studies indicate that merely having an accessible service scheme does not ensure that women will use it unless the government works to empower women and boost their self-esteem so that they can resist the societal dominance of gender stereotypes (22, 62).
The current study has strengths as well as drawbacks. Firstly, this is the first study in the SSA region to examine the adequacy of PNC services received during immediate PPP by focusing on the contents of care. Secondly, using multilevel mixed-effect models, the effects of individual-and community-level factors on the uptake of adequate PNC have been examined both separately and collectively for better parameter estimates. This is essential for creating effective interventions. Finally, the most recent nationally representative datasets from 18 SSA nations have been used, and this makes it easy to generalize our findings to all women in the region. Despite the aforementioned strengths, there are some limitations in the study. Due to the cross-sectional nature of the study, it can be difficult to deal with social desirability and recall bias and also difficult to establish the cause-and-effect relationship between outcomes and exposures.
Conclusion
The results showed low coverage of adequate PNC service in SSA countries, indicating that the WHO recommendation for positive postpartum experiences was not implemented satisfactorily. Living in the southern sub-region, institutional delivery, early initiation of ANC, delivery by CS, autonomy in decision-making, attitude towards wife-beating, and reading newspapers were identified as predictors of receipt of adequate PNC service. The Federal Ministry of Health and healthcare managers in each country should enhance their efforts to devise interventions that promote women’s empowerment to enhance their autonomy in decision-making and reduce attitudes towards wife beating. Healthcare providers ought to strive to provide skilled delivery services and early initiation of ANC, along with comprehensive education about the value of receiving adequate PNC service.
Data availability statement
Publicly available datasets were analyzed in this study. This data can be found at: https://www.dhsprogram.com.
Ethics statement
The requirement of ethical approval was waived for the studies involving humans because ICF International granted permission. The studies were conducted in accordance with the local legislation and institutional requirements. The participants provided their written informed consent to participate in this study..
Author contributions
AH: Conceptualization, Formal analysis, Methodology, Project administration, Resources, Software, Validation, Writing – original draft, Writing – review & editing. AT: Formal analysis, Methodology, Writing – review & editing. LT: Methodology, Writing – review & editing.
Funding
The author(s) declare that no financial support was received for the research, authorship, and/or publication of this article.
Acknowledgments
We would like to acknowledge the Demographic Health Survey program office for allowing us to access all the relevant DHS data for this study.
Conflict of interest
The authors declare that the research was conducted in the absence of any commercial or financial relationships that could be construed as a potential conflict of interest.
Publisher’s note
All claims expressed in this article are solely those of the authors and do not necessarily represent those of their affiliated organizations, or those of the publisher, the editors and the reviewers. Any product that may be evaluated in this article, or claim that may be made by its manufacturer, is not guaranteed or endorsed by the publisher.
Abbreviations
AIC, Akaike’s information criterion; aIRR, adjusted incidence rate ratio; ANC, antenatal care; aOR, adjusted odds ratio; DHS, demographic and health survey; EA, enumeration area; ICC, intra class correlation coefficient; MOR, median odds ratio; PCV, proportional change in variance; PNC, postnatal care; PPP, postpartum period; PPV, postpartum visits; SSA, Sub-Saharan Africa.
References
1. Sines, E. Postnatal care: a critical opportunity to save mothers and newborns. Policy perspectives on newborn. Health. (2007) 1:1–8.
2. Finlayson, K, Crossland, N, Bonet, M, and Downe, S. What matters to women in the postnatal period: a meta-synthesis of qualitative studies. PLoS One. (2020) 15:e0231415. doi: 10.1371/journal.pone.0231415
3. Lawn, J, Kinney, M, and Blencowe, H. Every newborn. An executive summary for the Lancet’s series. Lancet. (2014) 384:1–8. doi: 10.1111/j.1467-842X.1999.tb01239.x
4. Lawn, JE, Blencowe, H, Oza, S, You, D, Lee, ACC, Waiswa, P, et al. Every newborn: progress, priorities, and potential beyond survival. Lancet. (2014) 384:189–205. doi: 10.1016/S0140-6736(14)60496-7
5. Division, U.N.C.s.F.W.H.O.-n.T.W.B.U.N.P., The Inter-agency Group for Child Mortality Estimation (UN IGME). Levels and trends in child mortality. Report 2013. USA: UNICEF New York (2013).
6. Musarandega, R, Machekano, R, Munjanja, SP, and Pattinson, R. Methods used to measure maternal mortality in sub-Saharan Africa from 1980 to 2020: a systematic literature review. Int J Gynecol Obstet. (2022) 156:206–15. doi: 10.1002/ijgo.13695
7. World Health Organization, Africa’s advances in maternal, infant mortality face setbacks: WHO report, Available at: https://www.afro.who.int/news/africas-advances-maternal-infant-mortality-face-setbacks-who-report#:~:text=In%20sub-Saharan%20Africa%2C%20it,2030%2C%20the%20Atlas%202022%20reports, (2022).
8. Organization, W.H, Atlas of African health statistics 2022: health situation analysis of the WHO African region. (2022): World Health Organization. Regional Office for Africa. https://www.afro.who.int/publications/atlas-african-health-statistics-2022-health-situation-analysis-who-african-region-0
9. Cooke, M, and Barclay, L. Are we providing adequate postnatal services? Aust N Z J Public Health. (2009) 23:210–2.
10. Singh, K, Brodish, P, and Haney, E. Postnatal care by provider type and neonatal death in sub-Saharan Africa: a multilevel analysis. BMC Public Health. (2014) 14:941. doi: 10.1186/1471-2458-14-941
11. World Health Organization, WHO recommendations on postnatal care of the mother and newborn, (2013). Available at: https://apps.who.int/iris/bitstream/handle/10665/97603/?sequence=1
12. Organization, W.H., S.P.o. Research, and R.T.i.H. Reproduction, WHO recommendations on maternal and newborn care for a positive postnatal experience. 2022: World Health Organization, (2022).
13. Habte, A, and Dessu, S. Determinants of frequency and contents of postnatal care among women in Ezha District, southern Ethiopia, 2020: based on WHO recommendation. Int J Women’s Health. (2021):13. doi: 10.2147/IJWH.S291731
14. Yaya, S, and Ghose, B. Global inequality in maternal health care service utilization: implications for sustainable development goals. Health Equity. (2019) 3:145–54. doi: 10.1089/heq.2018.0082
15. Kawuki, J, Gatasi, G, and Sserwanja, Q. Prevalence of adequate postnatal care and associated factors in Rwanda: evidence from the Rwanda demographic health survey 2020. Arch Publ Health. (2022) 80:1–11. doi: 10.1186/s13690-022-00964-6
16. Rwabufigiri, BN, Mukamurigo, J, Thomson, DR, Hedt-Gautier, BL, and Semasaka, JPS. Factors associated with postnatal care utilisation in Rwanda: a secondary analysis of 2010 demographic and health survey data. BMC Pregnancy Childbirth. 16:16. doi: 10.1186/s12884-016-0913-0
17. Tessema, ZT, Yazachew, L, Tesema, GA, and Teshale, AB. Determinants of postnatal care utilization in sub-Saharan Africa: a meta and multilevel analysis of data from 36 sub-Saharan countries. Ital J Pediatr. (2020) 46:1–11. doi: 10.1186/s13052-020-00944-y
18. Esopo, K, Derby, L, and Haushofer, J. Interventions to improve adherence to antenatal and postnatal care regimens among pregnant women in sub-Saharan Africa: a systematic review. BMC Pregnancy Childbirth. (2020) 20:1–12. doi: 10.1186/s12884-020-02992-y
19. ICF International. (2012). Demographic and health survey sampling and household listing manual. MEASURE DHS, Calverton, Maryland, U.S.A.: ICF International, Available at: https://www.dhsprogram.com/pubs/pdf/DHSM4/DHS6_Sampling_Manual_Sept2012_DHSM4.pdf
20. Khan, MN, and Islam, MM. Women’s attitude towards wife-beating and its relationship with reproductive healthcare seeking behavior: a countrywide population survey in Bangladesh. PLoS One. (2018) 13:e0198833. doi: 10.1371/journal.pone.0198833
21. Oyediran, KA. Explaining trends and patterns in attitudes towards wife-beating among women in Nigeria: analysis of 2003, 2008, and 2013 demographic and health survey data. Genus. (2016) 72:1–25. doi: 10.1186/s41118-016-0016-9
22. Asaolu, IO, Alaofè, H, Gunn, JKL, Adu, AK, Monroy, AJ, Ehiri, JE, et al. Measuring women's empowerment in sub-Saharan Africa: exploratory and confirmatory factor analyses of the demographic and health surveys. Front Psychol. (2018) 9:994. doi: 10.3389/fpsyg.2018.00994
23. Ghose, B, Feng, D, Tang, S, Yaya, S, He, Z, Udenigwe, O, et al. Women’s decision-making autonomy and utilisation of maternal healthcare services: results from the Bangladesh demographic and health survey. BMJ Open. (2017) 7:e017142. doi: 10.1136/bmjopen-2017-017142
24. Sacks, E, and Langlois, ÉV. Postnatal care: increasing coverage, equity, and quality. Lancet Glob Health. (2016) 4:e442–3. doi: 10.1016/S2214-109X(16)30092-4
25. Bala, ET, and Roets, L. Challenges in postnatal care provision in Ethiopia. Front Publ Health. (2022) 10:922933. doi: 10.3389/fpubh.2022.922933
26. Sserwanja, Q, Musaba, MW, Mutisya, LM, Olal, E, and Mukunya, D. Continuum of maternity care in Zambia: a national representative survey. BMC Pregnancy Childbirth. (2021) 21:604. doi: 10.1186/s12884-021-04080-1
27. Nishimwe, C, Mchunu, GG, and Mukamusoni, D. Community-based maternal and newborn interventions in Africa: systematic review. J Clin Nurs. (2021) 30:2514–39. doi: 10.1111/jocn.15737
28. Camara, BS, Delamou, A, Grovogui, FM, de Kok, BC, Benova, L, el Ayadi, AM, et al. Interventions to increase facility births and provision of postpartum care in sub-Saharan Africa: a scoping review. Reprod Health. (2021) 18:1–22. doi: 10.1186/s12978-021-01072-4
29. Thomson, DR, Amoroso, C, Atwood, S, Bonds, MH, Rwabukwisi, FC, Drobac, P, et al. Impact of a health system strengthening intervention on maternal and child health outputs and outcomes in rural Rwanda 2005–2010. BMJ Glob Health. (2018) 3:e000674. doi: 10.1136/bmjgh-2017-000674
30. Wang, P, Connor, AL, Guo, E, Nambao, M, Chanda-Kapata, P, Lambo, N, et al. Measuring the impact of non-monetary incentives on facility delivery in rural Zambia: a clustered randomised controlled trial. Tropical Med Int Health. (2016) 21:515–24. doi: 10.1111/tmi.12678
31. Sserwanja, Q, Nuwabaine, L, Kamara, K, and Musaba, MW. Prevalence and factors associated with utilisation of postnatal care in Sierra Leone: a 2019 national survey. BMC Public Health. (2022) 22:12494. doi: 10.1186/s12889-022-12494-5
32. Mukonka, PS, Mukwato, PK, Kwaleyela, CN, Mweemba, O, and Maimbolwa, M. Household factors associated with use of postnatal care services. Afr J Midwifery Womens Health. (2018) 12:189. doi: 10.12968/ajmw.2018.12.4.189
33. Langlois, ÉV, Miszkurka, M, Zunzunegui, MV, Ghaffar, A, Ziegler, D, and Karp, I. Inequities in postnatal care in low-and middle-income countries: a systematic review and meta-analysis. Bull World Health Organ. (2015) 93:259–270G. doi: 10.2471/BLT.14.140996
34. Bwalya, BB, Mulenga, MC, and Mulenga, JN. Factors associated with postnatal care for newborns in Zambia: analysis of the 2013-14 Zambia demographic and health survey. BMC Pregnancy Childbirth. (2017) 17:418. doi: 10.1186/s12884-017-1612-1
35. Khaki, JJ, and Sithole, L. Factors associated with the utilization of postnatal care services among Malawian women. Malawi Med J. (2019) 31:2. doi: 10.4314/mmj.v31i1.2
36. Somefun, OD, and Ibisomi, L. Determinants of postnatal care non-utilization among women in Nigeria. BMC Res Notes. (2016) 9:e1823. doi: 10.1186/s13104-015-1823-3
37. Singh, R, et al. Utilization of maternal health services and its determinants: a cross-sectional study among women in rural Uttar Pradesh, India. J Health Popul Nutr. (2019) 38:1–12. doi: 10.1186/s41043-019-0173-5
38. Geremew, AB, Boke, MM, and Yismaw, AE. The effect of antenatal care service utilization on postnatal care service utilization: a systematic review and meta-analysis study. J Pregnancy. (2020) 2020:1–7. doi: 10.1155/2020/7363242
39. Mon, AS, Phyu, MK, Thinkhamrop, W, and Thinkhamrop, B. Utilization of full postnatal care services among rural Myanmar women and its determinants: a cross-sectional study. F1000Research. (2018) 7:15561. doi: 10.12688/f1000research.15561.1
40. Munabi-Babigumira, S, Glenton, C, Lewin, S, Fretheim, A, and Nabudere, H. Factors that influence the provision of intrapartum and postnatal care by skilled birth attendants in low- and middle-income countries: a qualitative evidence synthesis. Cochrane Database Syst Rev. (2017) 2018:1558. doi: 10.1002/14651858.CD011558.pub2
41. Titaley, CR, Dibley, MJ, and Roberts, CL. Factors associated with non-utilisation of postnatal care services in Indonesia. J Epidemiol Community Health. (2009) 63:827–31. doi: 10.1136/jech.2008.081604
42. Akunga, D, Menya, D, and Kabue, M. Determinants of postnatal care use in Kenya. Afr Popul Stud. (2014) 28:1447–59. doi: 10.11564/28-3-638
43. Atuhaire, R, Atuhaire, LK, Wamala, R, and Nansubuga, E. Interrelationships between early antenatal care, health facility delivery and early postnatal care among women in Uganda: a structural equation analysis. Glob Health Action. (2020) 13:1830463. doi: 10.1080/16549716.2020.1830463
44. Tiruneh, GT, Worku, A, Berhane, Y, Betemariam, W, and Demissie, M. Determinants of postnatal care utilization in Ethiopia: a multilevel analysis. BMC Pregnancy Childbirth. (2020) 20:1–12. doi: 10.1186/s12884-020-03254-7
45. Guenther, T, Nsona, H, Makuluni, R, Chisema, M, Jenda, G, Chimbalanga, E, et al. Home visits by community health workers for pregnant mothers and newborns: coverage plateau in Malawi. J Glob Health. (2019) 9:808. doi: 10.7189/jogh.09.010808
46. Tomlinson, M, Rotheram-Borus, MJ, Doherty, T, Swendeman, D, Tsai, AC, Ijumba, P, et al. Value of a mobile information system to improve quality of care by community health workers. South Afr J Inf Manag. (2013) 15:528. doi: 10.4102/sajim.v15i1.528
47. Limenih, MA, Endale, ZM, and Dachew, BA. Postnatal care service utilization and associated factors among women who gave birth in the last 12 months prior to the study in Debre Markos town, northwestern Ethiopia: a community-based cross-sectional study. Int J Reproduc Med. (2016) 2016:7095352. doi: 10.1155/2016/7095352
48. Kumar, P, and Dhillon, P. Length of stay after childbirth in India: a comparative study of public and private health institutions. BMC Pregnancy Childbirth. (2020) 20:1–13. doi: 10.1186/s12884-020-2839-9
49. Ponsiglione, AM, Trunfio, TA, Amato, F, and Improta, G. Predictive analysis of hospital stay after caesarean section: a single-center study. Bioengineering. (2023) 10:440. doi: 10.3390/bioengineering10040440
50. Caughey, AB, Cahill, AG, Guise, JM, and Rouse, DJ. Safe prevention of the primary cesarean delivery. Am J Obstet Gynecol. (2014) 210:179–93. doi: 10.1016/j.ajog.2014.01.026
51. Organization, W.H., UNFPA, UNICEF and Mailman School of Public Health. Averting maternal death and disability (AMDD)(2009) monitoring emergency obstetric care a handbook. https://www.unfpa.org/sites/default/files/pub-pdf/obstetric_monitoring.pdf
52. Osamor, PE, and Grady, C. Women’s autonomy in health care decision-making in developing countries: a synthesis of the literature. Int J Women’s Health. (2016) 8:191–202. doi: 10.2147/IJWH.S105483
53. Amatya, R, Tipayamongkholgul, M, Suwannapong, N, and Tangjitgamol, S. Matters of gender and social disparities regarding postnatal care use among Nepalese women: a cross-sectional study in Morang District. Health Equity. (2023) 7:271–9. doi: 10.1089/heq.2022.0186
54. Mumtaz, S, Bahk, J, and Khang, Y-H. Current status and determinants of maternal healthcare utilization in Afghanistan: analysis from Afghanistan demographic and health survey 2015. PLoS One. (2019) 14:e0217827. doi: 10.1371/journal.pone.0217827
55. Simona, S, et al. The influence of contextual factors on maternal healthcare utilization in sub-Saharan Africa: a scoping review of multilevel models. medRxiv. (2022) 3:22272437. doi: 10.1101/2022.03.15.22272437
56. Aboagye, RG, Seidu, AA, Ahinkorah, BO, Cadri, A, Frimpong, JB, Hagan, JE, et al. Association between frequency of mass media exposure and maternal health care service utilization among women in sub-Saharan Africa: implications for tailored health communication and education. PLoS One. (2022) 17:e0275202. doi: 10.1371/journal.pone.0275202
57. Dhaher, EA, Mikolajczyk, RT, Maxwell, AE, and Krämer, A. Attitudes toward wife beating among Palestinian women of reproductive age from three cities in West Bank. J Interpers Violence. (2010) 25:518–37. doi: 10.1177/0886260509334409
58. Sado, L, Spaho, A, and Hotchkiss, DR. The influence of women’s empowerment on maternal health care utilization: evidence from Albania. Soc Sci Med. (2014) 114:169–77. doi: 10.1016/j.socscimed.2014.05.047
59. Adane, B, Fisseha, G, Walle, G, and Yalew, M. Factors associated with postnatal care utilization among postpartum women in Ethiopia: a multi-level analysis of the 2016 Ethiopia demographic and health survey. Arch Publ Health. (2020) 78:1–10. doi: 10.1186/s13690-020-00415-0
60. Wado, YD. Women’s autonomy and reproductive health-care-seeking behavior in Ethiopia. Women Health. (2018) 58:729–43. doi: 10.1080/03630242.2017.1353573
61. Musa, A, Chojenta, C, Geleto, A, and Loxton, D. The associations between intimate partner violence and maternal health care service utilization: a systematic review and meta-analysis. BMC Womens Health. (2019) 19:1–14. doi: 10.1186/s12905-019-0735-0
Keywords: postnatal care, adequate postnatal care, multilevel analysis, determinants, Sub-Saharan Africa
Citation: Habte A, Tamene A and Tesfaye L (2023) Towards a positive postnatal experience in Sub-Saharan African countries: the receipt of adequate services during the immediate postpartum period: a multilevel analysis. Front. Public Health. 11:1272888. doi: 10.3389/fpubh.2023.1272888
Edited by:
Suksham Jain, Government Medical College and Hospital, IndiaReviewed by:
Lizeth Roets, University of South Africa, South AfricaJames Orwa, Aga Khan University, Kenya
Copyright © 2023 Habte, Tamene and Tesfaye. This is an open-access article distributed under the terms of the Creative Commons Attribution License (CC BY). The use, distribution or reproduction in other forums is permitted, provided the original author(s) and the copyright owner(s) are credited and that the original publication in this journal is cited, in accordance with accepted academic practice. No use, distribution or reproduction is permitted which does not comply with these terms.
*Correspondence:Aklilu Habte, YWtsaWx1aGFidGU1N0BnbWFpbC5jb20=