 Jintao Li†
 Kui Xiang
- The National Hospital of Enshi Tujia and Miao Autonomous Prefecture, Enshi, Hubei, China
Objective: Oxidative Balance Score (OBS) is an index affecting the oxidative stress of dietary and lifestyle factors. We aimed to explore the association of OBS with prostate specific antigen (PSA) among older males.
Methods: A total of 5,136 samples were collected in this study to investigate the relationship between OBS and PSA from the National Health and Nutrition Examination Survey. Logistic regression models and restricted cubic spline were used to assess the associations between OBS and PSA.
Results: Compared with the Q1 group, the odds ratios for the association between OBS and PSA were 1.005 (1.003, 1.009), 1.003 (1.001, 1.006), and 1.001 (0.978, 1.022) for Q2, Q3, and Q4, respectively. In the age-specific analyses, the association was significant among individuals aged 65 years old and over: the odds ratios for the association between OBS and PSA were 1.019 (1.005, 1.028), 1.028 (1.018, 1.039), and 1.038 (1.022, 1.049) for Q2, Q3, and Q4, respectively. But it was not significant among individuals aged less than 65 years old: the odds ratios for the association between OBS and PSA were 1.016 (0.995, 1.026), 1.015 (0.985, 1.022), and 0.988 (0.978, 1.016) for Q2, Q3, and Q4, respectively. The restricted cubic splines also indicated a nonlinear relationship between OBS and PSA among individuals aged 65 years old and over (Poverall = 0.006, Pnonlinear = 0.021).
Conclusion: Our findings provide evidence that OBS is positively associated with higher levels of PSA among older adults. Further large-scale prospective cohort studies are needed to verify our findings.
Introduction
Prostate cancer (PC) is the third most common cancer worldwide and one of the most common malignancies among men, alongside lung and colon tumors, resulting in an estimated 161,360 new cases of prostate cancer and 26,730 deaths in the United States in 2017 (1–3). Since the promotion of serum prostate-specific antigen (PSA) screening and the development of prostate biopsy in the late 1980s, the number of confirmed cases of prostate cancer increased significantly (4, 5). The incidence of prostate cancer reached a peak in 1992, decreased between 1992 and 1995, and then increased at a rate of about 1% per year (6). According to the latest studies, prostate cancer has become the second most common malignant tumor among male tumors, with an estimated 165, 000 newly diagnosed cases and 29,000 deaths in 2018 (7, 8).
Prostate-specific antigen (PSA) has become an indispensable tumor marker for the diagnosis of prostate cancer and has been widely used for disease monitoring, staging and diagnosis, and early diagnosis, in addition to being an immunohistochemical marker (9). Serum levels are also affected by factors such as age, prostate size, and ethnicity (10). The change of the prostate surrounding environment is also the main factor affecting the serum.
The occurrence and advancement of PC have been linked to oxidative stress, which is an imbalance between the antioxidant defense system’s generation and scavenging of reactive oxygen species (ROS) (11). Numerous dietary elements and lifestyle choices have been linked to oxidative stress. An individual’s oxidative/antioxidant state was evaluated using the Oxidative Balance Score (OBS), which was calculated by adding up the pro- and antioxidant components of dietary and lifestyle factors (12). OBS has been shown to be useful in treating a number of chronic conditions, such as hypertension and gastric reflux. Its ability to measure diet and lifestyle choices that may have a negative impact on health was particularly valuable in epidemiological research (13–15). It is unknown, however, if OBS and PSA are related.
Therefore, we carried out a cross-sectional investigation into the relationship between OBS and PSA in the current study. Based on data from National Health and Nutrition Examination Surveys, the study was carried out among adult US citizens.
Methods
Study population
Data for the study were gathered using questionnaires, interviews, physical examinations, and laboratory testing from the National Health and Nutrition Examination Surveys (NHANES 2003–2010) (16). An online description of NHANES can be found at https://wwwn.cdc.gov/nchs/nhanes/analyticguidelines.aspx. The National Center for Health Statistics Institutional Review Board approved the study, and written informed consent was obtained from each participant. First included in our study were 17,902 individuals with OBS data aged equal to or more than 20 years old from continuous NHANES (2003–2010) datasets. Women (n = 9,402), individuals without a PSA (n = 2,246), those without an OBS, and any missing basic data (n = 1,118) were also eliminated. Ultimately, our research encompassed 5,136 people in total. The study’s flowchart is shown in Supplementary Figure S1.
Definition of OBS
Based on prior information about the relationship between nutrients or lifestyle factors and OS, 16 nutrients and four lifestyle factors were screened to calculate OBS, of which five were pro-oxidants and 15 were antioxidants (17, 18). Of these, 16 nutrients were calculated from the mean of the various ingredients from the nutrition interviews on day 1 and day 2 to calculate the quantile as the scoring threshold. Supplementary Table S1 shows the distribution scheme of OBS components. We divided the other components into three groups by sex-specific quantiles. The antioxidants were assigned to one-third of the group at points 0 to 2. The point distribution of the pro-oxidant was reversed, with 0 points representing the highest quantile and 2 points representing the lowest. Finally, the OBS scores of each participant were summed to get the final OBS value of each participant.
Assessment of PSA
The most prevalent non-cutaneous cancer in males is prostate cancer, and total PSA testing has been identified as a tumor marker for cancer detection, diagnosis, and therapy. For men 40 years of age and above, the survey measures total prostate-specific antigen (PSA). Blood samples were subjected to PSA immunoassays utilizing the Hybritech test (Beckman Coulter, Fullerton, CA). A paramagnetic particle coated with a second mouse monoclonal anti-PSA antibody and a mouse monoclonal anti-PSA alkaline phosphatase conjugate were placed into a reaction vessel together with a second sample. While the monoclonal anti-PSA adjuvant interacts with several antigenic sites on the sample PSA, the PSA in the sample binds to the monoclonal anti-PSA immobilized on the solid phase. The amount of light produced is directly correlated with the PSA levels in the sample. The typical PSA level was 0–4 ng/mL (19).
Covariates
Face-to-face interviews were used to gather information on age, gender, education levels, race, and ethnicity (Mexican American, Other Hispanic, Non-Hispanic White, Non-Hispanic Black, and others), family income-poverty ratios (PIR), smoking, and drinking. Physical examinations were used to determine body mass index (BMI). Weight (in kilos) divided by height (in meters squared) yielded the BMI. PIR was computed by dividing family (or individual) income by the survey year’s specific poverty guidelines, which differed according to the household size and the area. Lower PIR indicated a higher degree of poverty, whereas a ratio of one indicated the same income and level of poverty. Those who had smoked at least 100 cigarettes in their lifetime were considered smokers. Individuals who had ingested one or more alcoholic beverages throughout the preceding year were identified as current drinkers.
Statistical analysis
For continuous variables, the mean (SD) was reported, and for categorical variables, the numbers (percentages) represented the basic features of the participants. For categorical or continuous variables, the T test or the Chi-square test was used. Four distinct scenarios were employed in logistic regression models to evaluate the relationships between OBS and PSA. Additionally, limited cubic splines were employed to evaluate the link between OBS and PSA’s dose and response. Age, BMI, sex, education, race/ethnicity, marital status, PIR, drinking and smoking habits, diabetes, hypertension, and marriage were among the covariates. Furthermore, age has been identified as a primary risk factor for PSA. Consequently, stratified analyses based on age—that is, age < 65 and age ≥ 65—were used to examine the relationship between OBS and PSA. Software from SAS Institute Inc., Cary, NC, version 9.4 was used for all statistical analyses. p < 0.05 was used as the threshold for significance in the two-sided statistical tests.
Results
The basic characteristics of the subjects are presented in Table 1. A total of 5,136 participants were included in our study; the number of OBS in different quartiles was 1,290, 1,358, 1,214, and 1,194, respectively. And the mean PSA was 1.67, 1.84, 1.68, and 2.07, respectively. We found that all variables except for hypertension were statistically significant between different quartiles of OBS (p = 0.475). The characteristics of the subjects aged below 65 and equal to and over 65 are presented in Supplementary Tables S2, S3; the results were similar to the total population.
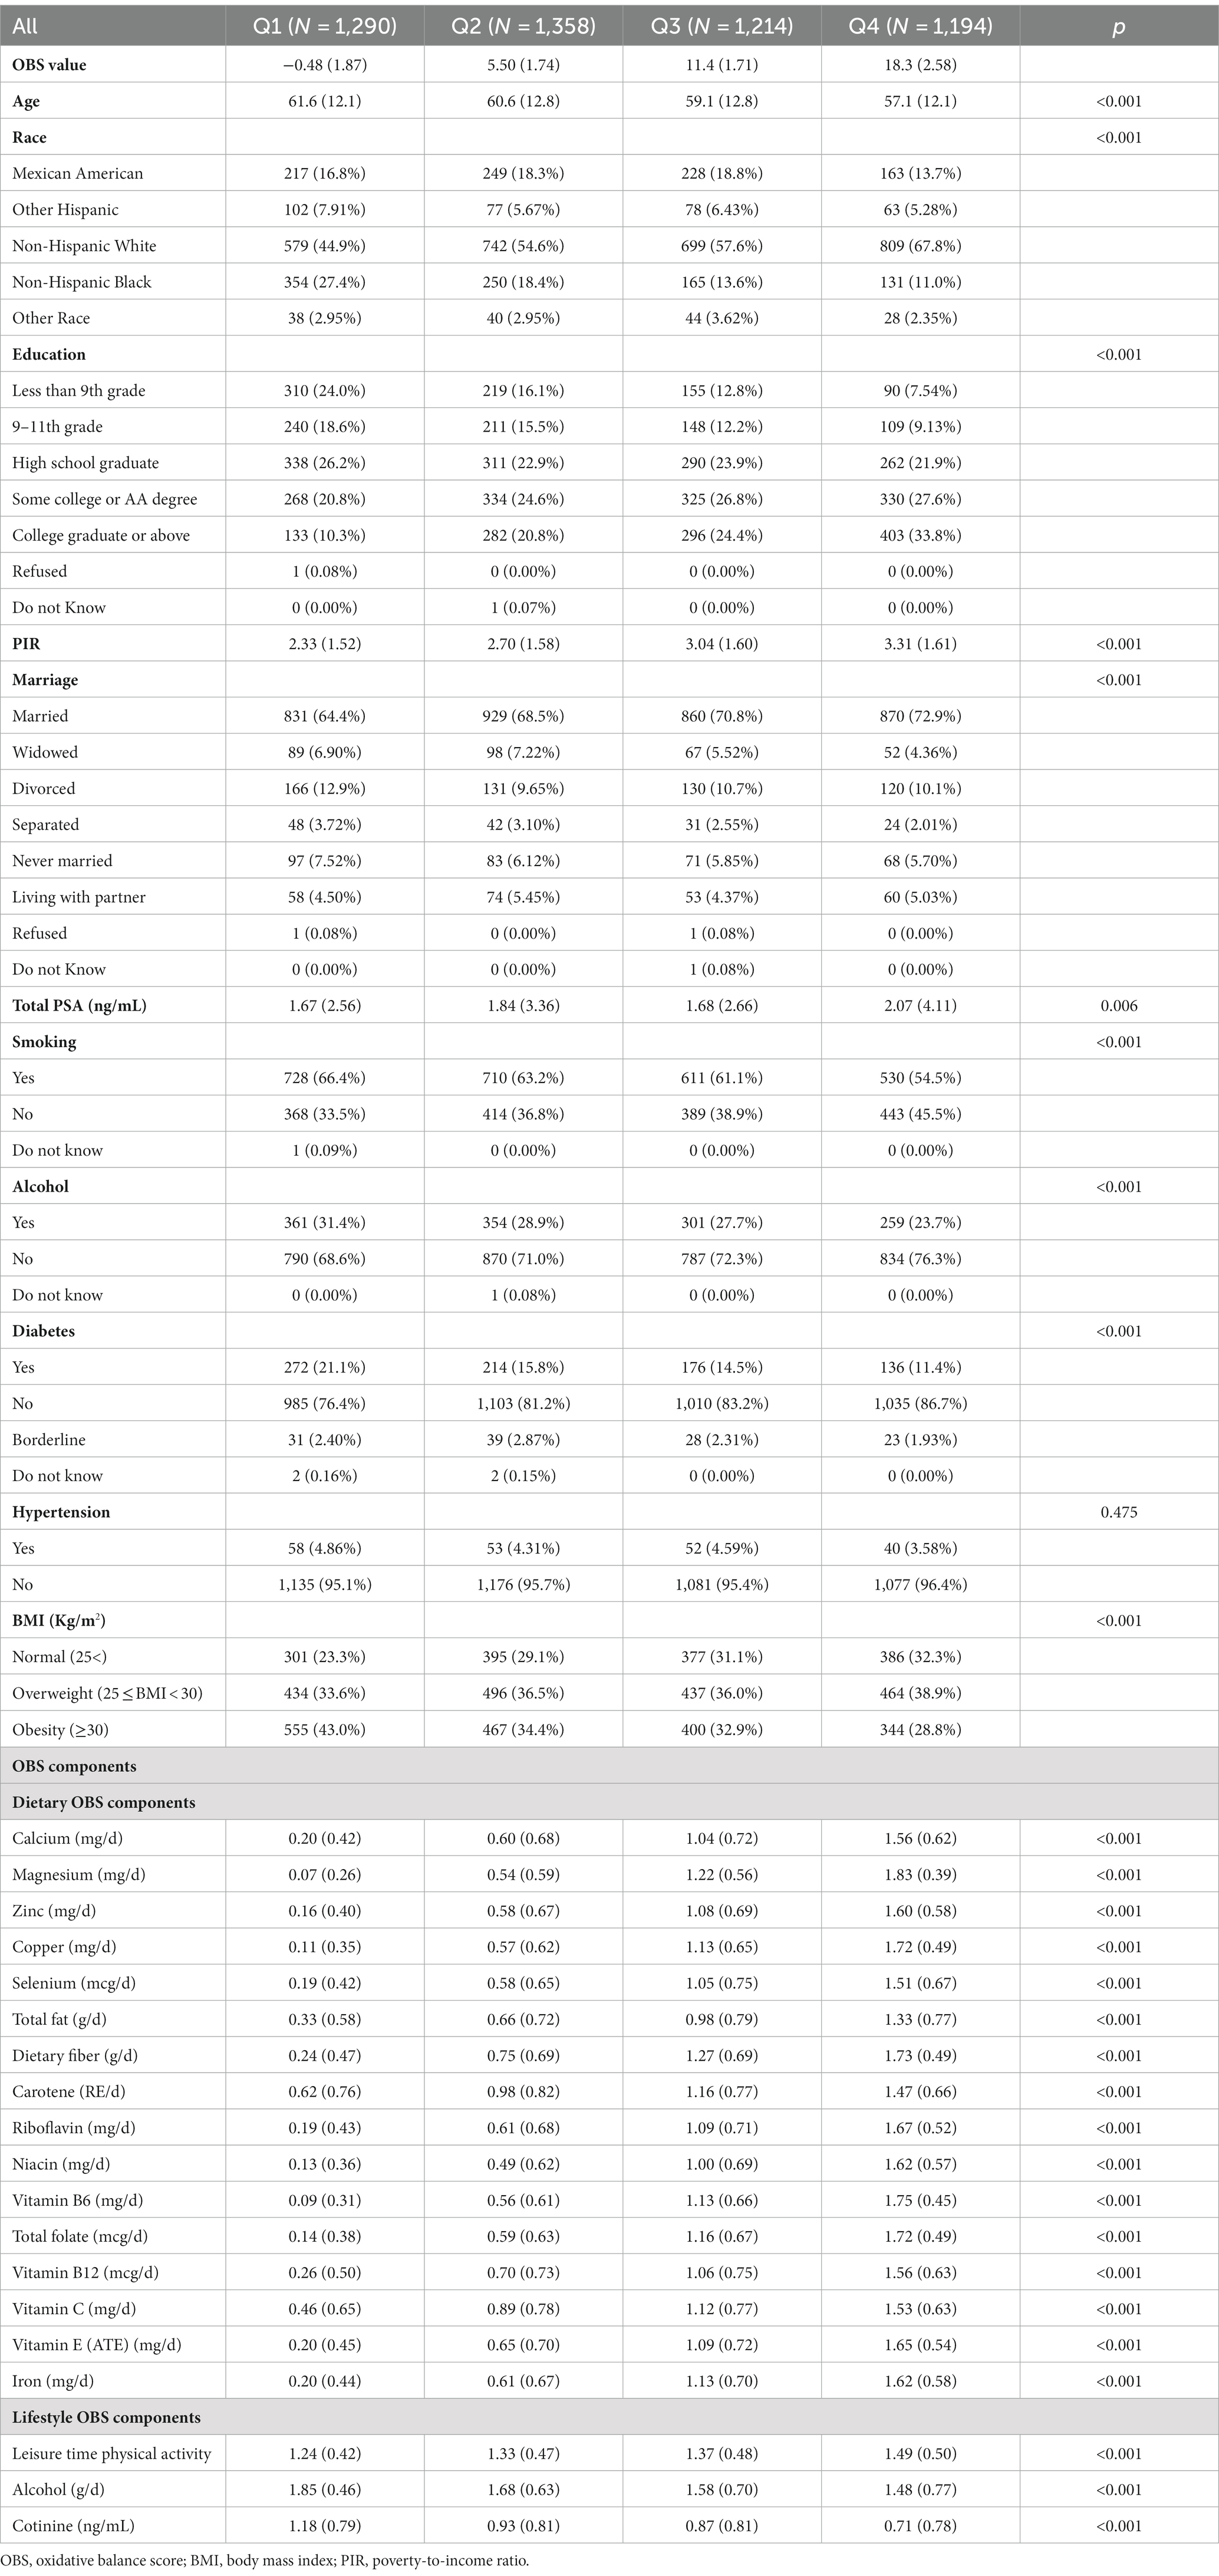
Table 1. The baseline characteristics of included samples by quartiles of the OBS.
The association between the OBS and PSA is presented in Table 2. Compared with the quartile 1 group, the odds ratios for the association between OBS and PSA were 1.005 (1.003, 1.009), 1.003 (1.001, 1.006), and 1.001 (0.978, 1.022) for quartile 2, quartile 3, and quartile 4, respectively, after adjusting for other covariates. In the age-specific analyses, the association was significant among individuals 65 years old and over, not among individuals aged less than 65 years old. For individuals aged 65 years old and over, the odds ratios for the association between OBS and PSA were 1.019 (1.005, 1.028), 1.028 (1.018, 1.039), and 1.038 (1.022, 1.049) for Q2, Q3, and Q4, respectively, after adjusting for other covariates. For individuals aged less than65 years old, the odds ratios for the association between OBS and PSA were 1.016 (0.995, 1.026), 1.015 (0.985, 1.022), and 0.988 (0.978, 1.016) for Q2, Q3, and Q4, respectively.
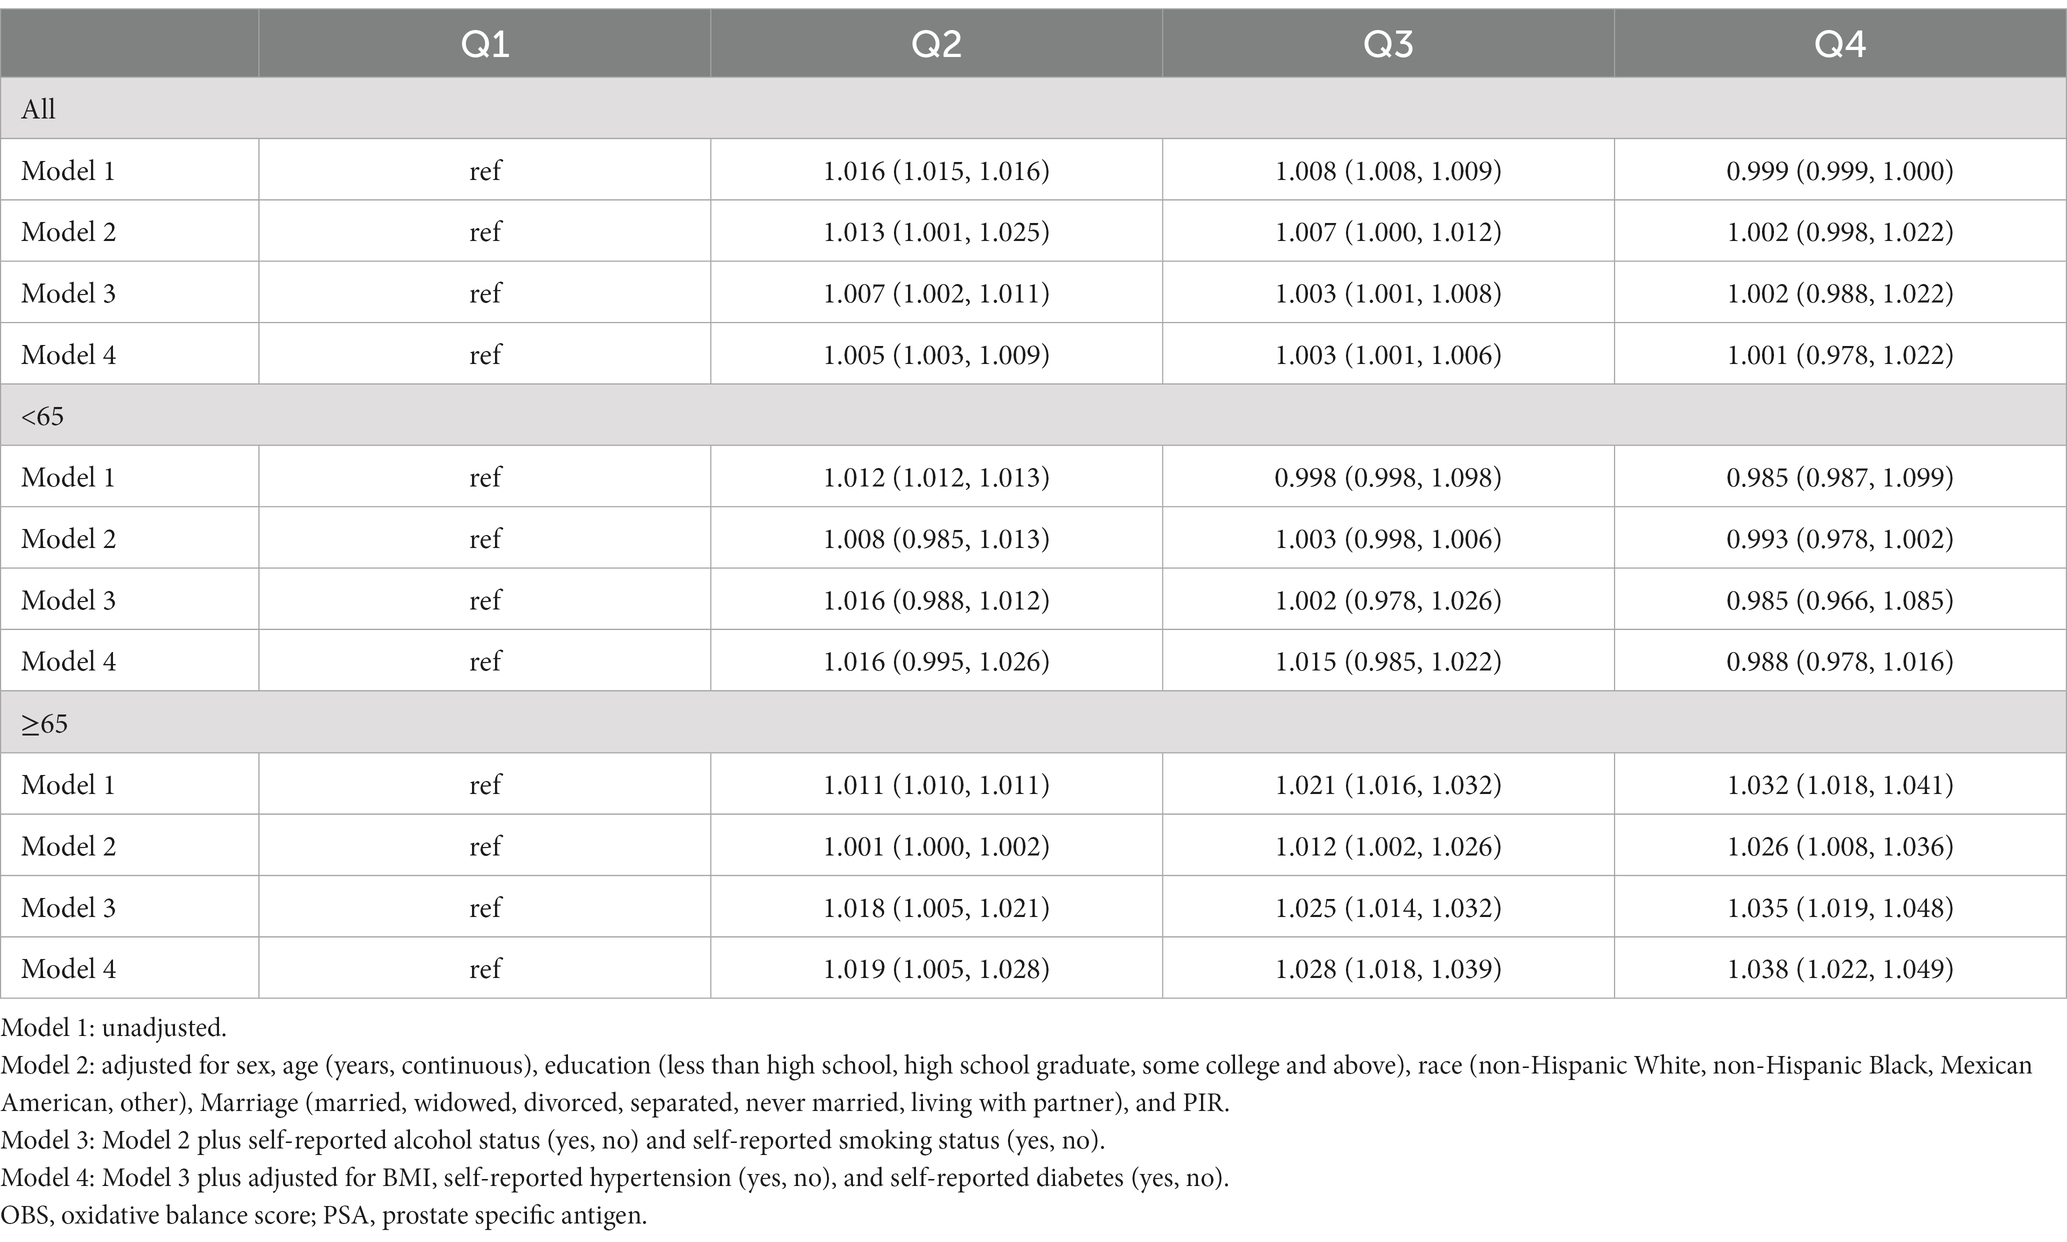
Table 2. Odds ratio for the association between the OBS and PSA.
In addition, we also assessed the dose–response relationship between OBS and PSA. We found a non-linear relationship between OBS and PSA in the total population (Figure 1, P overall = 0.020, P nonlinear = 0.007) and, in the age-specific analyses, it was significant among individuals aged 65 years and older (Figure 2, P overall = 0.006, P nonlinear = 0.021), not among individuals aged below 65 years old (Figure 3, P overall = 0.274, P nonlinear = 0.153).
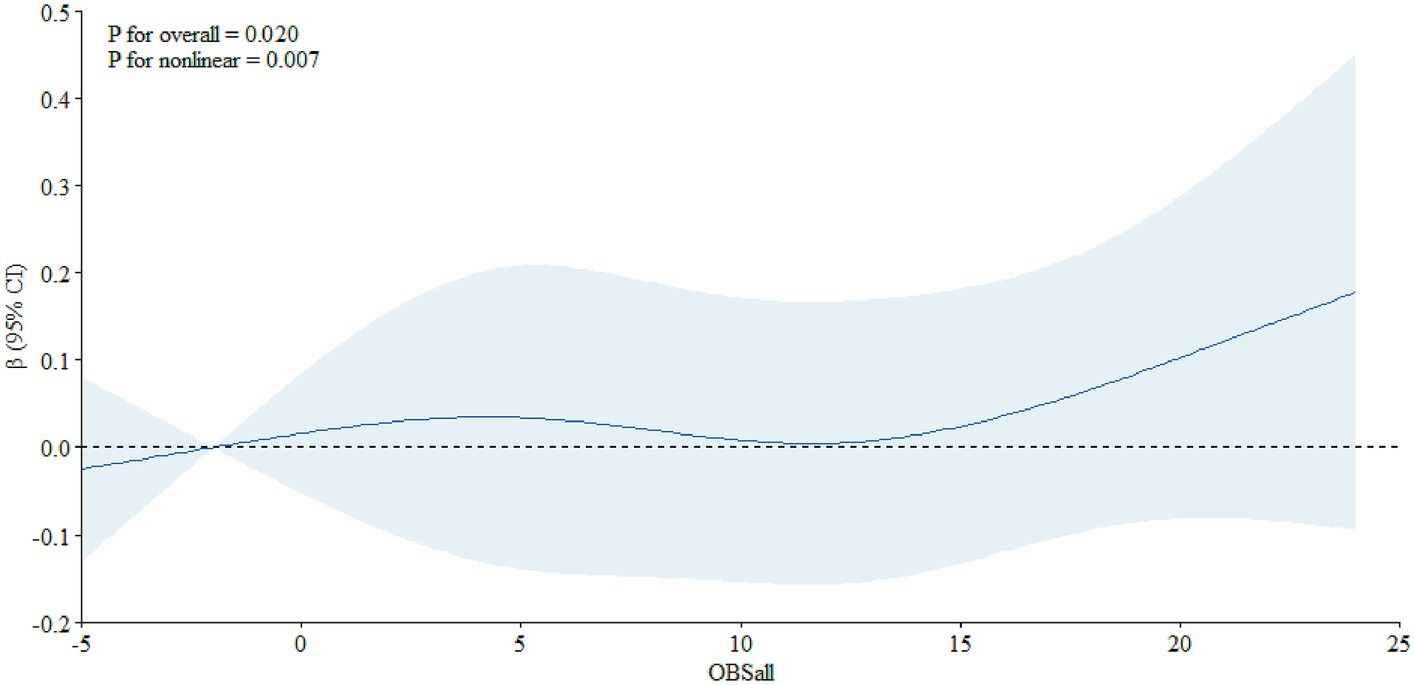
Figure 1. The dose–response relationship between the OBS and PSA among all the participants.
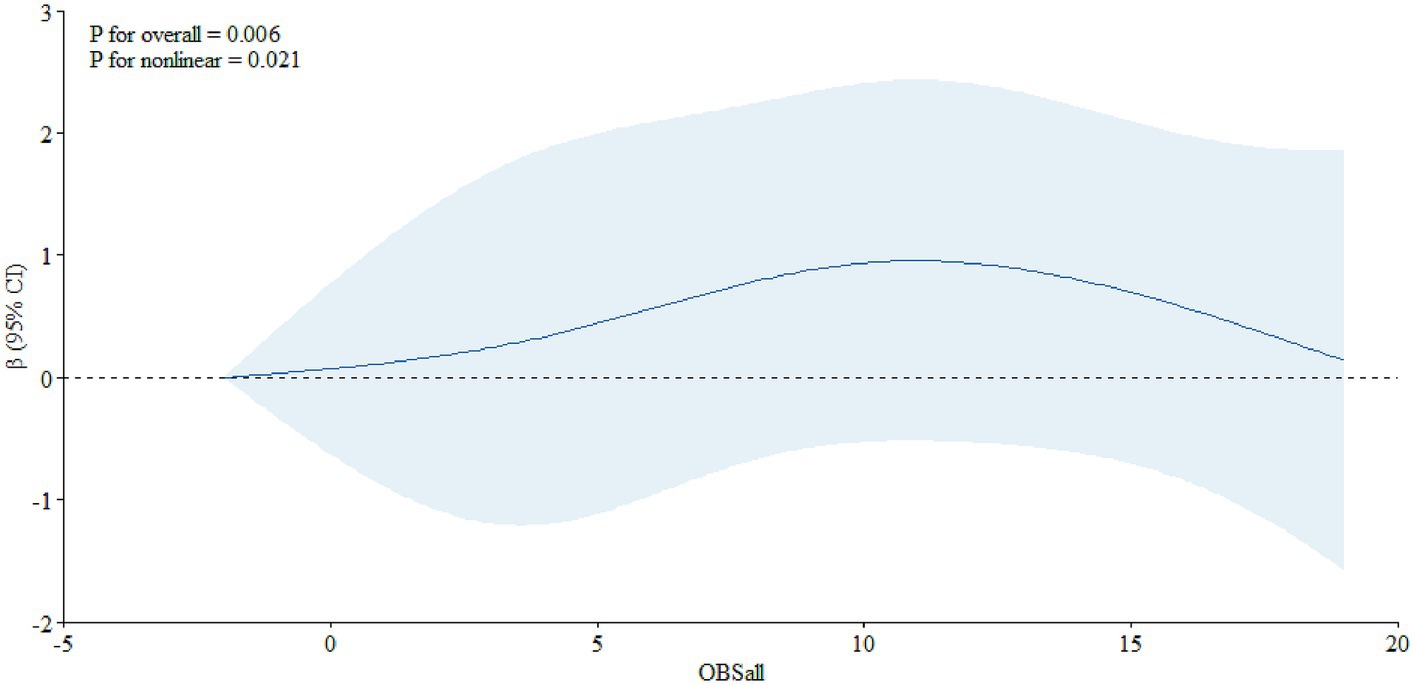
Figure 2. The dose–response relationship between the OBS and PSA among individuals aged 65 years and over.
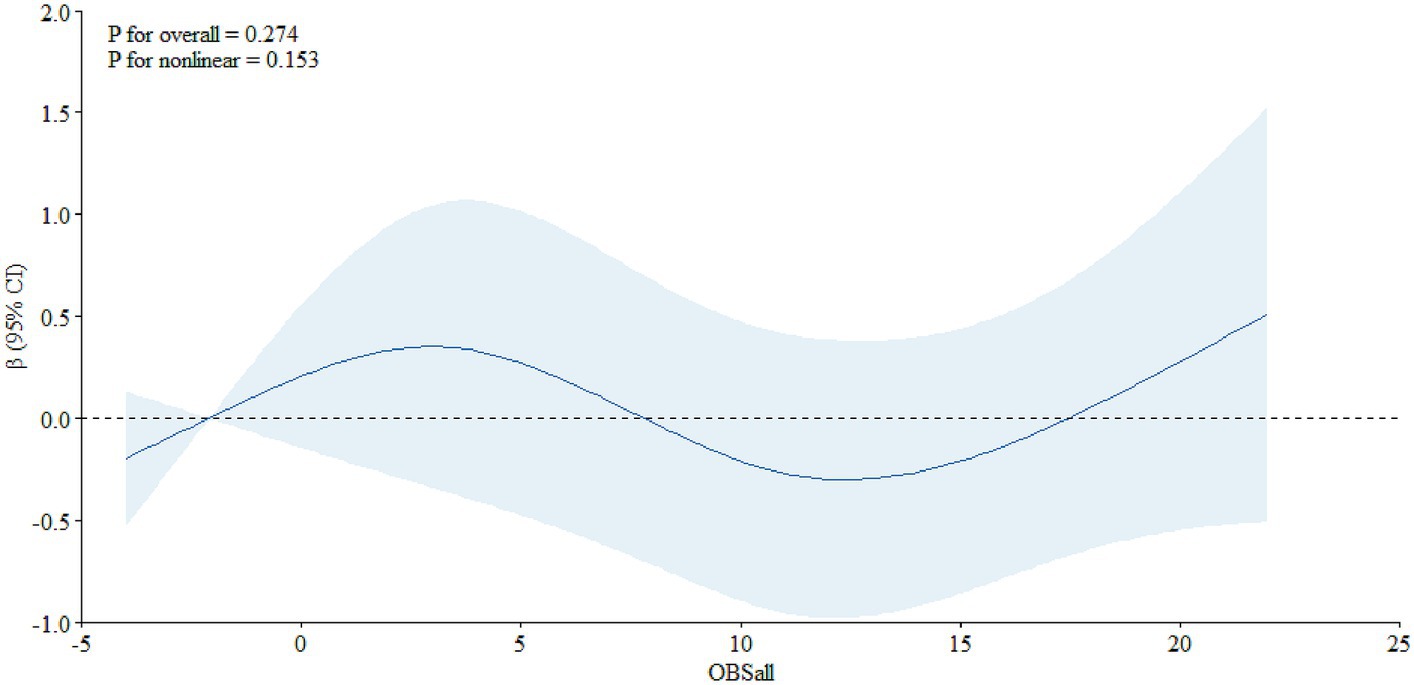
Figure 3. The dose–response relationship between the OBS and PSA among individuals aged less than 65.
Discussion
In the present study, we found that OBS was positively associated with PSA among older adults, after adjusting for other covariates. Meanwhile, we also explored the dose–response relationship between them and found a non-linear relationship between OBS and PSA among older adults.
The results of the study have important implications for both public health and clinical settings, as PC is not only a public health issue but also an important clinical disease. It indicated that physicians should pay attention to reducing oxidative stress, which may be helpful to reduce the level of PSA, and then reduce the occurrence of PC. And from a public health perspective, adequate antioxidant food intake may be helpful for the prevention of PC for men, especially for older adults.
In the subgroup analysis, we found that the association was significant among individuals aged 65 years old and older, but it was not significant among those aged below 65 years old. We believe several factors may contribute to this phenomenon. First, studies have shown that the level of oxidative stress would increase with the increase of age, as the process of aging in the human body itself is accompanied by oxidation of the body (20, 21). Secondly, when the human body is aging, the organ function of the body gradually declines and the absorption capacity of antioxidant is weakened, which could result in the high level of oxidative stress (22, 23).
The mechanism underlying the positive association between OBS and PSA is unclear. The process of oxidative stress is usually induced by the elevation of cellular ROS, and immune function, oxidative metabolism, and mitochondrial bioenergetics could continuously generate ROS (24, 25). It is usually in hypochlorous acid, hydroxyl radical, superoxide anion, and other substances related with cell growth, differentiation, and death (26). Previous studies have reported that several complex cell signaling pathways are involved in the progression and incidence of PC with animal models and cell culture experiments (27). Actually, several factors could cause oxidative free radicals, including delaying the recruitment of p53 and regulating androgens and inflammation (28). And studies have indicated that the increase of ROS accumulation and production in prostate cancer cells was related with serum androgens (29).
There are a few more restrictions that must be mentioned. Firstly, as the study is only cross-sectional, a causal relationship between OBS and PSA cannot be established. Second, we were unable to completely rule out the possibility of unassessed confounders even after adjusting for a variety of plausible risk factors in our investigation. Thirdly, as this study only included adult US citizens, care should be taken when extrapolating the results to other demographics.
Conclusion
In the present study, we found that OBS is positively associated with PSA among older adults, and a nonlinear relationship could also be found between OBS and PSA. Further large-scale prospective cohort studies are needed to verify our findings and explore the association between OBS and PSA.
Data availability statement
The original contributions presented in the study are included in the article/Supplementary material, further inquiries can be directed to the corresponding author.
Author contributions
JL: Formal analysis, Methodology, Writing – original draft. CY: Methodology, Validation, Visualization, Writing – original draft. KX: Conceptualization, Software, Supervision, Writing – review & editing.
Funding
The author(s) declare financial support was received for the research, authorship, and/or publication of this article. The study was supported by Hubei Provincial Health Commission 2018–2019 Traditional Chinese Medicine Research Project (No. ZY2019Q021). The funder did not play any role in the study design; in the collection, analysis, and interpretation of data; in the writing of the report; nor in the preparation, review, or approval of the manuscript.
Acknowledgments
We thank the study group of the National Health and Nutrition Examination Survey.
Conflict of interest
The authors declare that the research was conducted in the absence of any commercial or financial relationships that could be construed as a potential conflict of interest.
Publisher’s note
All claims expressed in this article are solely those of the authors and do not necessarily represent those of their affiliated organizations, or those of the publisher, the editors and the reviewers. Any product that may be evaluated in this article, or claim that may be made by its manufacturer, is not guaranteed or endorsed by the publisher.
Supplementary material
The Supplementary material for this article can be found online at: https://www.frontiersin.org/articles/10.3389/fpubh.2023.1336657/full#supplementary-material
References
1. Zhao, XY, and Feldman, D. The role of vitamin D in prostate cancer. Steroids. (2001) 66:293–300. doi: 10.1016/S0039-128X(00)00164-1
2. Kanaan, Y, and Copeland, RL. The link between vitamin D and prostate cancer. Nat Rev Cancer. (2022) 22:435. doi: 10.1038/s41568-022-00493-y
3. Pernar, CH, Ebot, EM, Wilson, KM, and Mucci, LA. The epidemiology of prostate cancer. Cold Spring Harb Perspect Med. (2018) 8:a030361. doi: 10.1101/cshperspect.a030361
4. Thederan, I, Chandrasekar, T, Tennstedt, P, Knipper, S, Kuehl, L, Tilki, D, et al. Circulating vitamin D and selenium levels and outcome in prostate cancer patients: lessons from the MARTINI-lifestyle cohort. Eur Urol Focus. (2021) 7:973–9. doi: 10.1016/j.euf.2020.12.005
5. Maksymchuk, OV, and Kashuba, VI. Altered expression of cytochrome P450 enzymes involved in metabolism of androgens and vitamin D in the prostate as a risk factor for prostate cancer. Pharmacol Rep. (2020) 72:1161–72. doi: 10.1007/s43440-020-00133-y
6. Chen, W, Zheng, R, Baade, PD, Zhang, S, Zeng, H, Bray, F, et al. Cancer statistics in China, 2015. CA Cancer J Clin. (2016) 66:115–32. doi: 10.3322/caac.21338
7. Wang, F, Wang, C, Xia, H, Lin, Y, Zhang, D, Yin, P, et al. Burden of prostate cancer in China, 1990–2019: findings from the 2019 global burden of disease study. Front Endocrinol. (2022) 13:853623. doi: 10.3389/fendo.2022.853623
8. Zhang, H, Huang, D, Zhang, Y, Wang, X, Wu, J, and Hong, D. Global burden of prostate cancer attributable to smoking among males in 204 countries and territories, 1990–2019. BMC Cancer. (2023) 23:92. doi: 10.1186/s12885-023-10552-8
9. Remmers, S, Bangma, CH, Godtman, RA, Carlsson, SV, Auvinen, A, Tammela, TLJ, et al. Relationship between baseline prostate-specific antigen on cancer detection and prostate cancer death: long-term follow-up from the European randomized study of screening for prostate Cancer. Eur Urol. (2023) 84:503–9. doi: 10.1016/j.eururo.2023.03.031
10. Heijnsdijk, EAM, and de Koning, HJ. Wise prostate-specific antigen testing means a limited, risk-adjusted, and personal approach. Eur Urol. (2023) 84:359–60. doi: 10.1016/j.eururo.2023.05.022
11. Gan, X, Nie, M, Cai, S, Liu, Y, Zhang, F, Feng, X, et al. Dankasterone a induces prostate cancer cell death by inducing oxidative stress. Eur J Pharmacol. (2023) 957:175988. doi: 10.1016/j.ejphar.2023.175988
12. Hernández-Ruiz, Á, García-Villanova, B, Guerra-Hernández, EJ, Carrión-García, CJ, Amiano, P, Sánchez, MJ, et al. Oxidative balance scores (OBSs) integrating nutrient, food and lifestyle dimensions: development of the NutrientL-OBS and FoodL-OBS. Antioxidants (Basel). (2022) 11:300. doi: 10.3390/antiox11020300
13. Hernández-Ruiz, Á, García-Villanova, B, Guerra-Hernández, E, Amiano, P, Ruiz-Canela, M, and Molina-Montes, E. A review of a priori defined oxidative balance scores relative to their components and impact on health outcomes. Nutrients. (2019) 11:774. doi: 10.3390/nu11040774
14. Lee, JH, Son, DH, and Kwon, YJ. Association between oxidative balance score and new-onset hypertension in adults: a community-based prospective cohort study. Front Nutr. (2022) 9:1066159. doi: 10.3389/fnut.2022.1066159
15. Kim, J, Lee, J, Choi, IJ, Kim, YI, and Kim, J. Gastric cancer risk is reduced by a predominance of antioxidant factors in the oxidative balance: a hospital-based case-control study in Korea. Epidemiol Health. (2022) 44:e2022089. doi: 10.4178/epih.e2022089
16. Chen, Z, Yu, L, Li, W, Zhang, H, Huang, X, Chen, W, et al. Association of vitamins with hearing loss, vision disorder and sleep problem in the US general population. Environ Sci Pollut Res Int. (2023) 30:53876–86. doi: 10.1007/s11356-023-26164-5
17. Zhang, W, Peng, SF, Chen, L, Chen, HM, Cheng, XE, and Tang, YH. Association between the oxidative balance score and telomere length from the National Health and nutrition examination survey 1999–2002. Oxidative Med Cell Longev. (2022) 2022:1–11. doi: 10.1155/2022/1345071
18. Lei, X, Xu, Z, and Chen, W. Association of oxidative balance score with sleep quality: NHANES 2007–2014. J Affect Disord. (2023) 339:435–42. doi: 10.1016/j.jad.2023.07.040
19. Wei, C, Chen, Y, Yang, Y, Ni, D, Huang, Y, Wang, M, et al. Assessing volatile organic compounds exposure and prostate-specific antigen: National Health and nutrition examination survey, 2001–2010. Front Public Health. (2022) 10:957069. doi: 10.3389/fpubh.2022.957069
20. Xia, F, Li, Q, Luo, X, and Wu, J. Machine learning model for depression based on heavy metals among aging people: a study with National Health and nutrition examination survey 2017–2018. Front Public Health. (2022) 10:939758. doi: 10.3389/fpubh.2022.939758
21. Wen, P, Zheng, B, Zhang, B, Ma, T, Hao, L, and Zhang, Y. The role of ageing and oxidative stress in intervertebral disc degeneration. Front Mol Biosci. (2022) 9:1052878. doi: 10.3389/fmolb.2022.1052878
22. Ebert, T, Tran, N, Schurgers, L, Stenvinkel, P, and Shiels, PG. Ageing – oxidative stress, PTMs and disease. Mol Asp Med. (2022) 86:101099. doi: 10.1016/j.mam.2022.101099
23. Rolt, A, and Cox, LS. Structural basis of the anti-ageing effects of polyphenolics: mitigation of oxidative stress. BMC Chem. (2020) 14:50. doi: 10.1186/s13065-020-00696-0
24. Wang, K, Xia, F, Li, Q, Luo, X, and Wu, J. The associations of weekend warrior activity patterns with the visceral adiposity index in US adults: repeated cross-sectional study. JMIR Public Health Surveill. (2023) 9:e41973. doi: 10.2196/41973
25. Li, W, Feng, X, Zhang, H, Wang, YX, Zeng, Q, Liu, C, et al. Association of shift work with oxidative stress and alteration of fasting plasma glucose level in Chinese adults. Obesity (Silver Spring). (2023) 31:2505–14. doi: 10.1002/oby.23845
26. Tan, BL, Norhaizan, ME, and Liew, WP. Nutrients and oxidative stress: friend or foe? Oxidative Med Cell Longev. (2018) 2018:1–24. doi: 10.1155/2018/9719584
27. Long, MD, Singh, PK, Russell, JR, Llimos, G, Rosario, S, Rizvi, A, et al. The miR-96 and RARγ signaling axis governs androgen signaling and prostate cancer progression. Oncogene. (2019) 38:421–44. doi: 10.1038/s41388-018-0450-6
28. Tan, BL, and Norhaizan, ME. Oxidative stress, diet and prostate cancer. World J Mens Health. (2021) 39:195–207. doi: 10.5534/wjmh.200014
Keywords: oxidative balance score, prostate specific antigen, older adults, NHANES, association
Citation: Li J, Yang C and Xiang K (2024) Association between oxidative balance score and prostate specific antigen among older US adults. Front. Public Health. 11:1336657. doi: 10.3389/fpubh.2023.1336657
Edited by:
Dongming Wang, Huazhong University of Science and Technology, ChinaCopyright © 2024 Li, Yang and Xiang. This is an open-access article distributed under the terms of the Creative Commons Attribution License (CC BY). The use, distribution or reproduction in other forums is permitted, provided the original author(s) and the copyright owner(s) are credited and that the original publication in this journal is cited, in accordance with accepted academic practice. No use, distribution or reproduction is permitted which does not comply with these terms.
*Correspondence: Kui Xiang, eGlhbmdrdWllc3ptenl5QDE2My5jb20=
†These authors share first authorship