 Adrianna M. Powers1
 Margaret M. DeAngelis
 Changyong Feng
 Karen Allison
- 1New York Medical College, Valhalla, NY, United States
- 2University of San Francisco, San Francisco, CA, United States
- 3University at Buffalo, Buffalo, NY, United States
- 4University of Rochester, Rochester, NY, United States
When thinking about major health concerns in the U.S. and around the world, eye care ranks lower compared to cardiovascular disease, cancer, and diabetes. However, people do not think about the direct connection between diabetes and eye health. Untreated diabetes can lead to visual impairments such as blindness or difficulty seeing. Studies have found that eye health associated with nutrition, occupational exposure, diabetes, high blood pressure, and heart disease are some of the known risk factors. This study aimed to identify the potential risk factors that are associated with visual impairment (VI). The data used for this analysis were obtained from the Centers for Disease Control and Prevention (CDC) - Behavioral Risk Factor Surveillance System (BRFSS) from 2018 to 2021. We found important characteristics, such as the U.S. region, general health perception, employment status, income status, age, and health insurance source, that are associated with VI. Our study confirmed that the common demographical factors including age, race/ethnicity, the U.S. region, and gender are associated with VI. The study also highlights associations with additional risk factors such as health insurance source, general health perceptions, employment status, and income status. Using this information, we can reach out to communities with large numbers of individuals experiencing vision challenges and help educate them on prevention and treatment protocols, thereby effectively addressing VI and blindness challenges within our communities, neighborhoods, and finally, the broader society.
Introduction
Visual impairment (VI) is a worldwide issue that greatly impacts the quality of life and decreases life expectancy in the aging population (1). According to Assi et al. (2), a billion people worldwide struggle with VI and blindness although these conditions can be prevented or slowed with treatment. If we educate the public on the conditions that can make a person more susceptible to vision loss and the treatments that can prevent or slow their progression, this may result in blindness and decreasing rates of VI (3). The risk factors involved in influencing VI or blindness can be socioeconomic, biological, or demographic (4).
This study focuses on ophthalmological health and the utilization of eye health care. Eye care has been neglected as a routine health procedure over the years. People neither understand nor are educated on the importance of an annual eye examination, especially when they have diseases, such as diabetes, which can greatly affect vision. According to Besagar et al. (5), “visual impairment is one of the most common disabilities in the U.S., with ~32 million U.S. adults exhibiting blindness or other difficulty seeing despite use of glasses or contact lenses.” VI is becoming more prevalent, yet this trend has largely been ignored. The risk factors that can lead to VI include socioeconomic status (SES), genetics, accessibility to health care, and other diseases/comorbidities. When someone becomes visually impaired, their everyday life is greatly affected. They may lose their independence and a sense of purpose, leading to a decrease in their overall mental and physical health (5). Previous studies have shown that those who are in low SES have a substantially higher disease burden (6). Individuals with low SES are characterized by having low levels of education, income, and occupational status. These attributes are commonly found among marginalized groups. Being part of the low SES class also entails limited access to healthcare and a lack of knowledge regarding health-related issues. Since these individuals rely on state insurance, their options for doctors and medical care are restricted. Additionally, due to financial constraints, they often cannot afford to consult a doctor or purchase medication when they fall ill. In contrast, individuals in high SES groups have a greater awareness of the importance of eye health (3). These findings demonstrate that health disparities play a huge role in the level of health literacy and overall understanding of health care. In a recent study conducted by the American Academy of Ophthalmology (AAO), a mere 19% of respondents could name the three main causes of blindness, which are diabetic retinopathy, glaucoma, and age-related macular degeneration (3). Social determinants of health (SDOH) encompass various factors, such as economic stability, educational access and quality, access to quality healthcare, a safe neighborhood and built environment, and the overall social community, which have also shown a relationship with overall health. These determinants disproportionately impact individuals from lower SES and marginalized groups, who often face multiple challenges in these areas. The impact of SDOH can vary across states, with some states being more affected than others based on the level of government support in implementing beneficial programs. Individuals with a low SES face challenges in accessing adequate healthcare due to a lack of insurance or being underinsured. Consequently, they are more vulnerable to experiencing advanced stages and complications of diseases such as diabetes and glaucoma. A synopsis of the three main causes of blindness will be described in the following paragraph.
Diabetic retinopathy (DR) affects a third of those who have been diagnosed with diabetes, and the prevalence of DR continues to grow as the duration of diabetes lengthens (7). DR affects about 8 million Americans yet only 50% of people with diabetes receive the necessary annual eye examination (8). Two major risk factors for the development of DR are hyperglycemia and hypertension (7). DR is asymptomatic in its early stage and can be detected via eye dilation and retinal evaluation during an annual eye examination (9), which helps diagnose DR at the early stage and decreases the number of people who become blind by 94% (8). In the working-age population, 75% of people with type 1 diabetes and 50% of people with type 2 diabetes will develop DR (9). In the aging population, retinal changes, such as a decrease in blood flow, retinal thinning, and microglial changes, can make them more vulnerable to severe retinal damage from oxidative and ischemia changes (9). The prevalence of DR in adults with diabetes in the U.S. is 29% (7). In the U.S., the 10-year incidence of retinopathy is 74% at the baseline, 64% develop severe retinopathy, and 17% develop proliferative DR (7). Fairless et al. indicated that ethnicity and sociodemographic elements play a significant role in developing diabetic retinopathy.
Glaucoma is a chronic progressive optic neuropathy that causes damage to the optic nerve head (ONH) and the retinal nerve fiber layer (RNFL) (10). The damage is caused by increased pressure in the eye leading to VI and blindness. Approximately 3 million people in the U.S. have glaucoma, making it a major cause of irreversible vision loss in the U.S. (10). Many people have a very general idea of what glaucoma is but are not aware of its causes. Genetics, immune system disorders (sarcoidosis, rheumatoid arthritis, and lupus), certain infectious diseases (herpes and toxoplasmosis), endocrine disorders (diabetes), steroids, and low blood pressure are all factors contributing to the development or progression of glaucoma (10). Glaucoma can be treated, and its progression can be restricted when detected early. Annual eye examinations can facilitate the early detection of glaucoma. During eye exams, the IOP is measured, gonioscopy is performed, and perimetry and other testing are conducted to further monitor the disease (10). A previous study found that in 2017, 3,973,400 people were diagnosed with glaucoma; of this, 16,200 people were between the ages of 18–39 years; 235,100 were between the ages of 40–64 years; 3,000,300 were between the ages of 65–84 years; and 721,900 were 85 years and older (11). The crude annual prevalences of glaucoma diagnosis by race/ethnicity were as follows: 29.76% black non-Hispanics, 22.74% Asians, 19.80% Hispanics, 18.04% North American Natives, and 17.50% white non-Hispanics (11). The literature also noted the glaucoma prevalence in blacks was 6.1% compared to 2.8% in whites (12).
Age-related macular degeneration (ARMD) is a major cause of irreversible VI in older adult people; in the early stages, it is asymptomatic, while in later stages, severe vision loss frequently occurs (13). The prevalence of early ARMD to progress late ARMD is 5% over a 5-year period with an increase of 15% over a 15-year period (13). ARMD has multiple risk factors such as age, ocular dysfunction, systemic diseases, diet, smoking, genetics, and environmental factors (13). Advanced ARMD is considered rare before the age of 55 years and is more common in those who are 75 years and older (14).
Both glaucoma and diabetic retinopathy are eye diseases that can be prevented and/or successfully treated when detected early, thereby reducing the amount of vision loss in patients. There are many barriers to people seeking necessary health care and most do not seek care until their health starts to decline and changes become alarming For most diseases/illnesses, precautionary screening is not attainable or is not sought due to factors such as cost, insurance status, poor patient-physician communication, lack of trust, absence of symptoms, and no perceived need for examination (8). These factors are among the various barriers that interfere with people seeking care. Fairless and Nwanyanwu (8) categorized these barriers into seven categories: vision status (noticeable changes in vision before the person seeks an eye exam), competing concerns (employment schedule, childcare, and other health issues), emotional context (fear of negative news or procedures), resource availability (insurance coverage, cost, and transportation), in-clinic experiences (patient-physician interactions), cues to action (primary care referrals to other health providers and appointment reminders), and knowledge-creating experiences (information about diseases/illnesses from doctor, family, and friends, as well as misinformation). In 2020–2021, another barrier was the COVID-19 pandemic, which impacted the availability and delivery of healthcare (15). Ophthalmologic diagnosis relies heavily on physical examinations and imaging that cannot be performed via telemedicine which has become the new way of seeking health care during the pandemic (15). These barriers significantly contribute to the steady increase in several illnesses and diseases being experienced today.
The purpose of this study was to examine the potential risk factors of those who are VI using the BRFSS web analysis tool from 2018 to 2021. The BRFSS is a health-related telephone survey that collects data about U.S. residents regarding their health-related risk behaviors, chronic health conditions, and the use of prevention services. It collects data from all 50 states including the District of Columbia and the three U.S. territories (16). We will examine demographics, socioeconomic status, a personal reflection on health, insurance status, and several other characteristic traits. Other studies have suggested that these characteristics need to be further examined to observe which factors are more associated with visual impairment. Learning about these characteristics helps in the tailoring of interventions and education-based learning for patients and physicians.
Methods
The data used for this study were obtained from CDC's BRFSS web-enabled analysis tool from 2018 to 2021. This database is a health-related telephone survey that collects data about U.S. residents (approximately 400,000 random interviews in a year). A list of all U.S. telephone numbers, both landlines and cellular lines, is placed into a system that randomly picks a phone number to call (17). The phone interviews lasted for about 25 min per call. It collects data from U.S. residents related to health-related risk behaviors, chronic health conditions, and the use of preventive services (17). The full protocol for the BRFSS can be found on the CDC's website which will explain each step they took to develop the data used in this study (17). From the phone interview questionnaire, we specified variables of interest in the categories of demographic information, socioeconomic status, eye care health, and diabetic information after going through all the questions asked in the questionnaire. This includes variables such as “sex,” “race/ethnicity,” “[in the] past year needed to see a doctor but could not because of cost,” “how long has it been since you visited a doctor for a routine checkup,” “level of education,” “employment status,” “annual income,” “type of insurance coverage,” “ten-level age category,” “three-categories of body mass index,” “language identifier,” “region,” and “region classification.” These variables were chosen based on the literature review and previous knowledge of the topic. From this, we identified the variables that previous studies have found significant and then chose other variables that may also be associated with eye care utilization.
We then had to do some variable modifications and group the variables to allow for clear analysis. All modifications were made with scientific proof of validity. For example, the states were listed by name. We classified them into four regions, namely, Northeast, Midwest, South, and West as shown in Figure 1. This classification enabled us to determine whether the geographical location is associated with VI and can later aid in targeting these areas for intervention and prevention strategies. Once all variables were ready for analysis, descriptive analysis was performed.
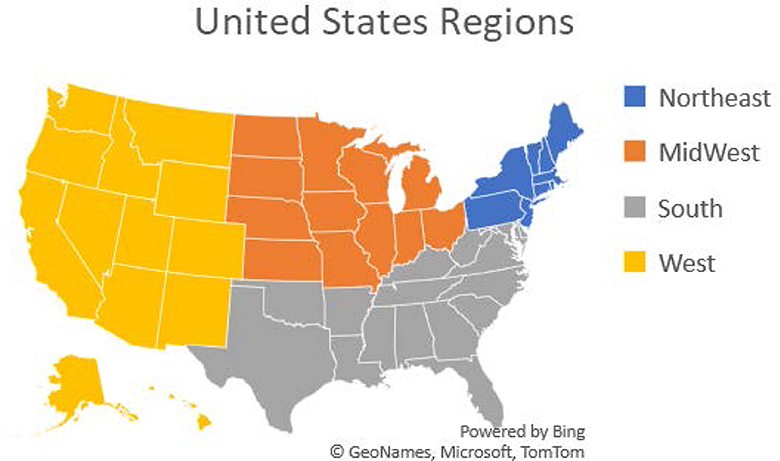
Figure 1. United States regions: the Northeast, Midwest, South, and West. Puerto Rico and Guam were also included.
Descriptive analysis included 27 variables as follows: “region,” “sex,” “private residency,” “general health,” “physical health,” “health care coverage,” “personal doctor,” “medical cost,” “checkups,” “blood pressure medication,” “diabetes,” “education level,” “housing status,” “employment,” “income level,” “blindness,” “high blood pressure/ diabetes testing,” “diabetes/retinopathy,” “pre-diabetic,” “visit diabetes doctor,” “type of insurance coverage,” “race/ethnicity,” “provider of majority of care,” “age,” “BMI,” “language,” and “region classification” for each year from 2018 to 2021. These 27 variables were selected as variables of interest for further analysis to find an association with VI.
Next, we performed a weighted bivariate analysis to examine the association between the response variable (Blindness “are you blind or have serious difficulties seeing, even when wearing glasses?”) and the selected 17 explanatory variables from the 27 variables of the descriptive analysis: “region,” “sex,” “general health,” “personal doctor,” “medical cost,” “checkups,” “blood pressure medication,” “diabetes,” “education level,” “employment,” “income level,” “type of insurance coverage,” “race/ethnicity,” “age,” “BMI,” “language,” and “region classification.” These variables were selected based on significance levels and confidence intervals. There was a weighted total of 6,269,897 individuals who responded “yes” that they are blind or have severe difficulties seeing over the 4 years. The final step of this study was a multiple logistic regression analysis using PROC SURVEYLOGISTIC. In this step, reference groups were chosen for each explanatory variable. This was accomplished by taking the response/category with the lowest total percentage from each explanatory variable and assigning it as the reference group. This multiple logistic regression analysis was used to study the association between the occurrence of the disease (responding “yes” to the blindness variable) and the demographic and clinical risk factors (explanatory variables). The significance level was set at 0.05. All analyses were implemented with SAS 9.4 (SAS Institute, Inc., Cary, NC).
Results
Variables responses were classified into specific categories per variable for analysis purposes. Recoding was performed to reduce the varied responses into general response categories (Table 1). This enables a more accurate analysis of each explanatory variable. The responses that were missing (“.”) or classified as “do not know/ not sure,” “refused,” or “blank” were not used in the analysis. All data were weighted to account for these missing responses.
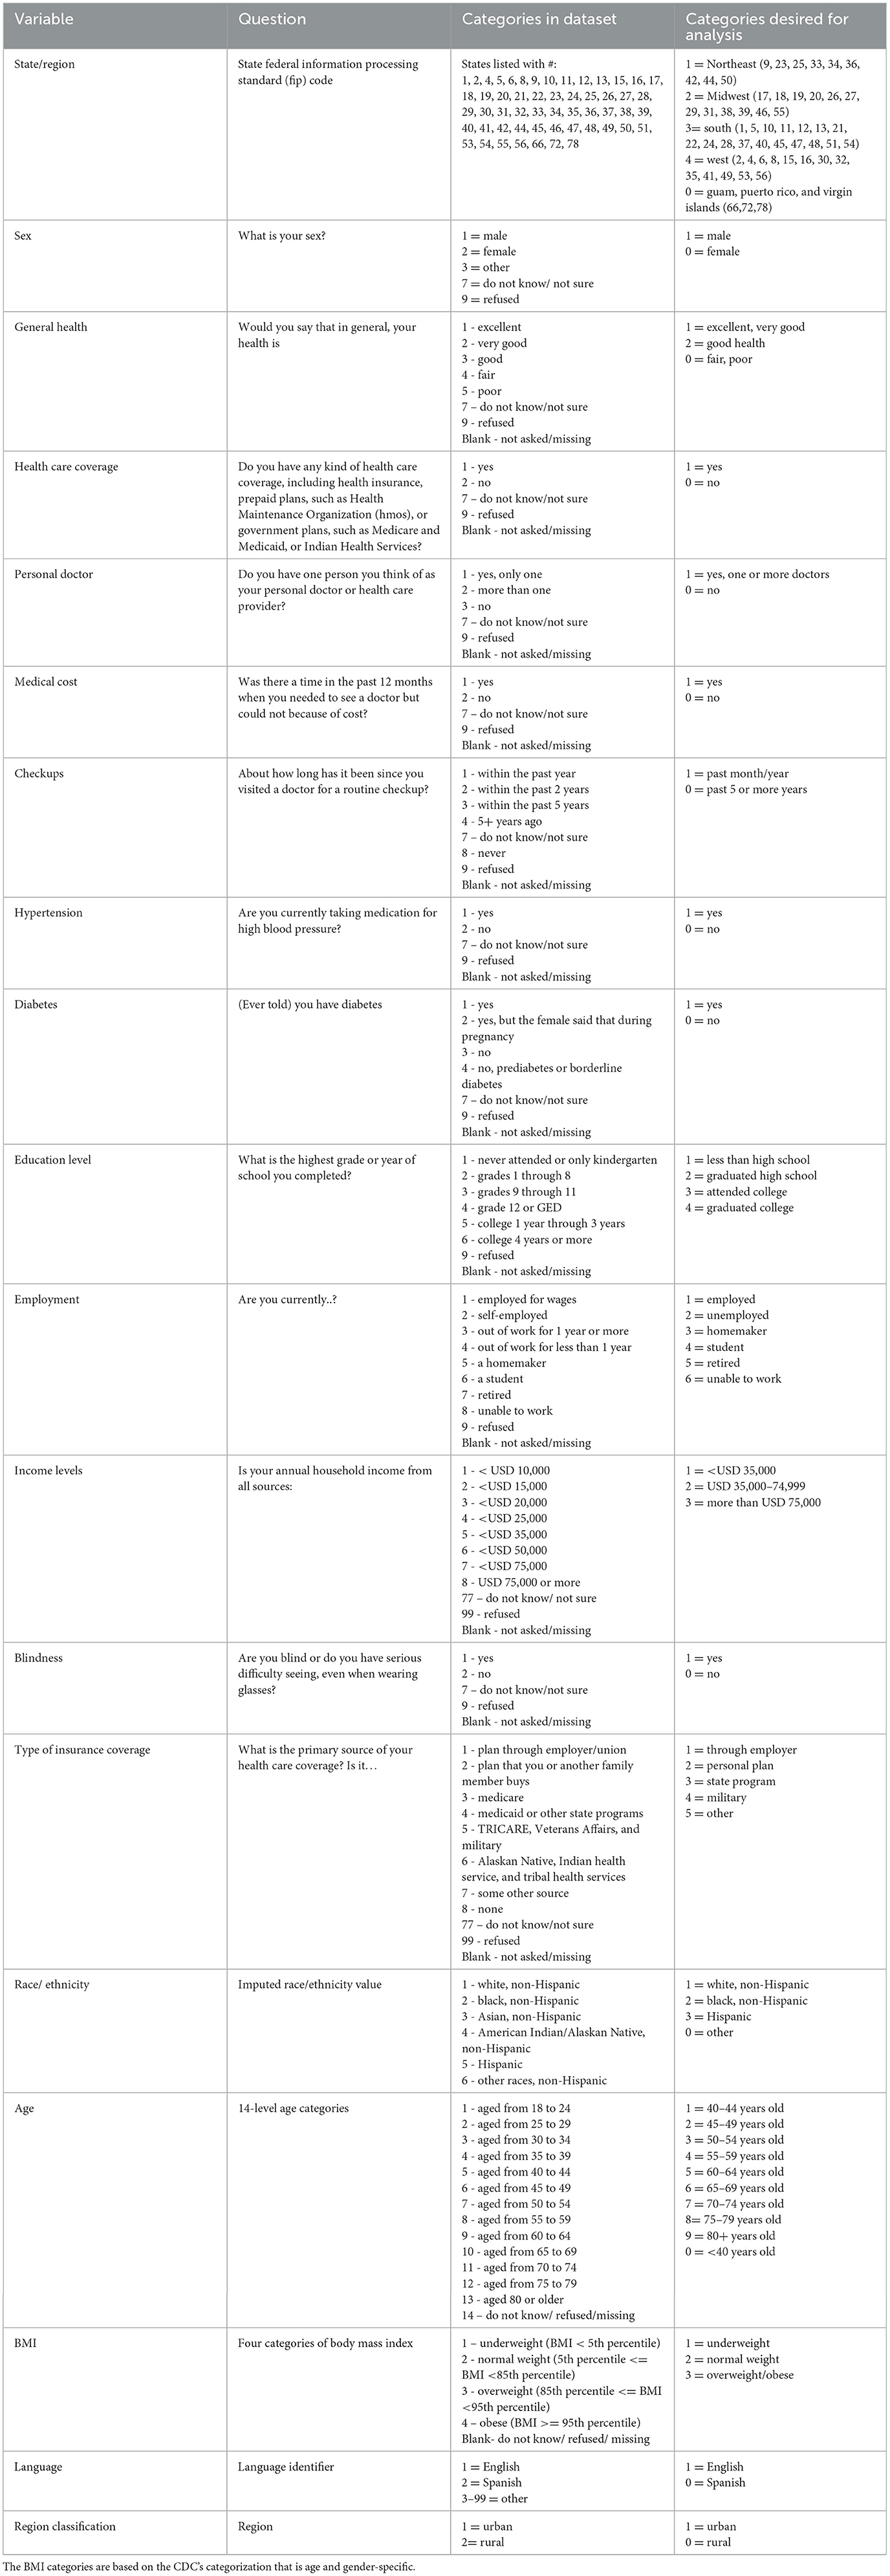
Table 1. The variables are chosen for the analysis with their assigned codes for analysis purposes.
The main insurance plans are defined as HMOs, PPOs, Medicare, and Medicaid. HMOs provide care through an approved network of doctors and require referrals for specialist doctors. They provide cheaper care with co-pays. However, the only downside is that out-of-network care will not be covered and everything will have to be paid out of pocket. In a PPO, you can see doctors who are in-network or out-of-network, and referrals are not needed. The downside is the cost of coverage which is more expensive than HMO plans. Medicare plans are federal health insurance for anyone over 65 years of age and those who are under 65 years with disabilities and certain conditions. Medicaid is a joint federal and state program that provides some health coverage to those who have low income and limited resources. Income qualifications depend on the number of people in the household and the state you reside in.
An analysis of the yearly data revealed that the highest percentage of those with VI had the following characteristics: they were from the South, female, lived in a private residence, reported their health as excellent or very good, had health insurance, had a primary care physician and had routinely visited them, were white non-Hispanic, were < 40 years, had hypertension, etc. The results of the descriptive analysis are shown in Table 2. This gives an overview of the general characteristics of the surveyed population for each year.
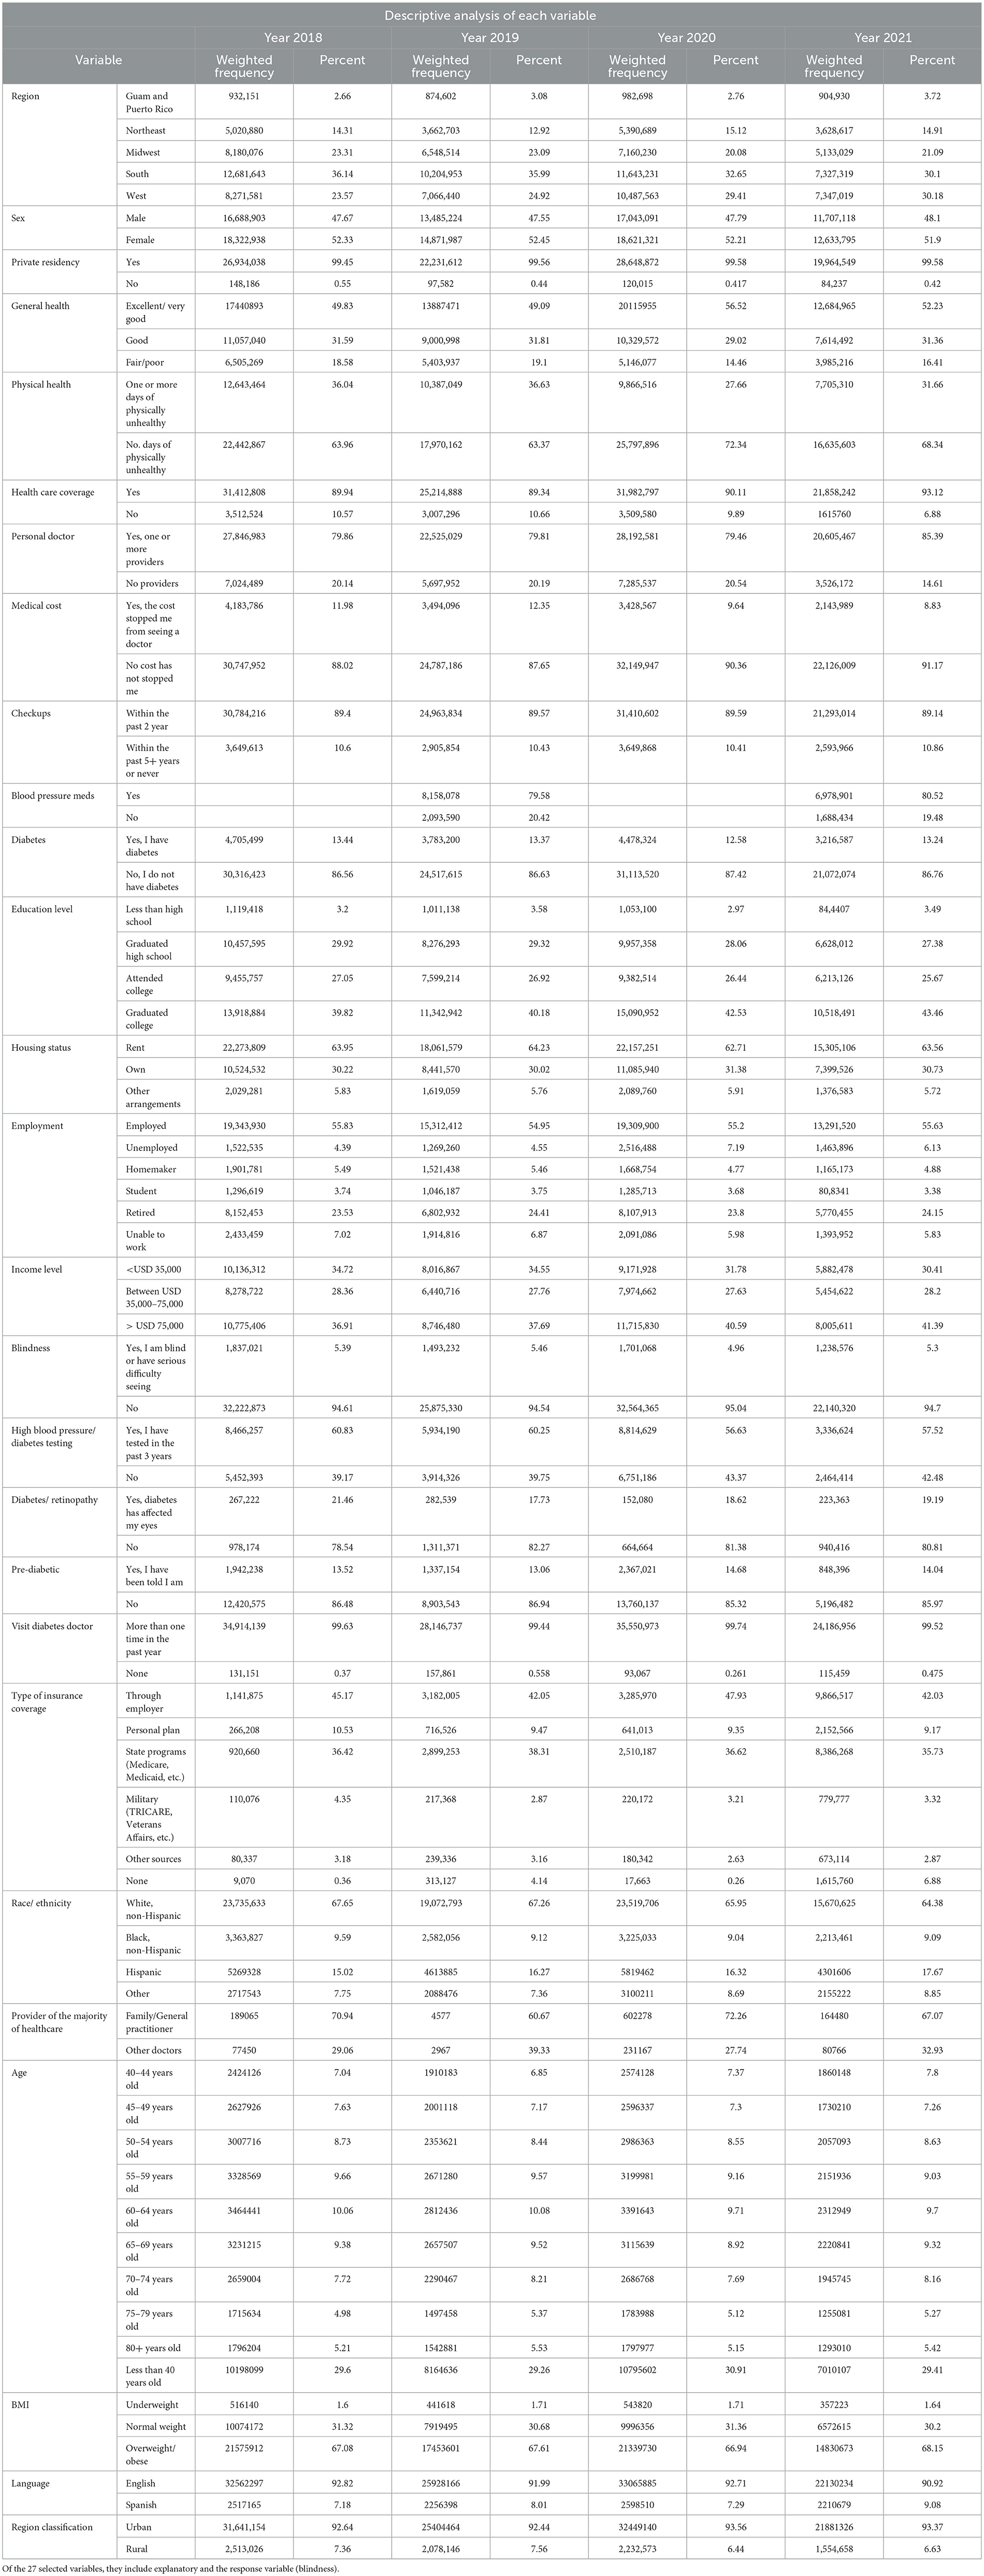
Table 2. Univariate analysis of 27 selected variables from the yearly BRFSS datasets.
After running a univariate analysis to pick the most significant variables, we performed a bivariate analysis of the response variable (blindness) and each of the 17 explanatory variables. From this analysis, it can be seen that the major characteristics of people who are blind/have difficulty seeing are those that are from the South, their general health is fair/poor, have had checkups in the past 2 years, have never been told that they have diabetes, graduated high school, make < USD 35,000 a year, have state health insurance, are white/non-Hispanic, are overweight/obese, speak English, and live in an urban area. These results are shown in Table 3.
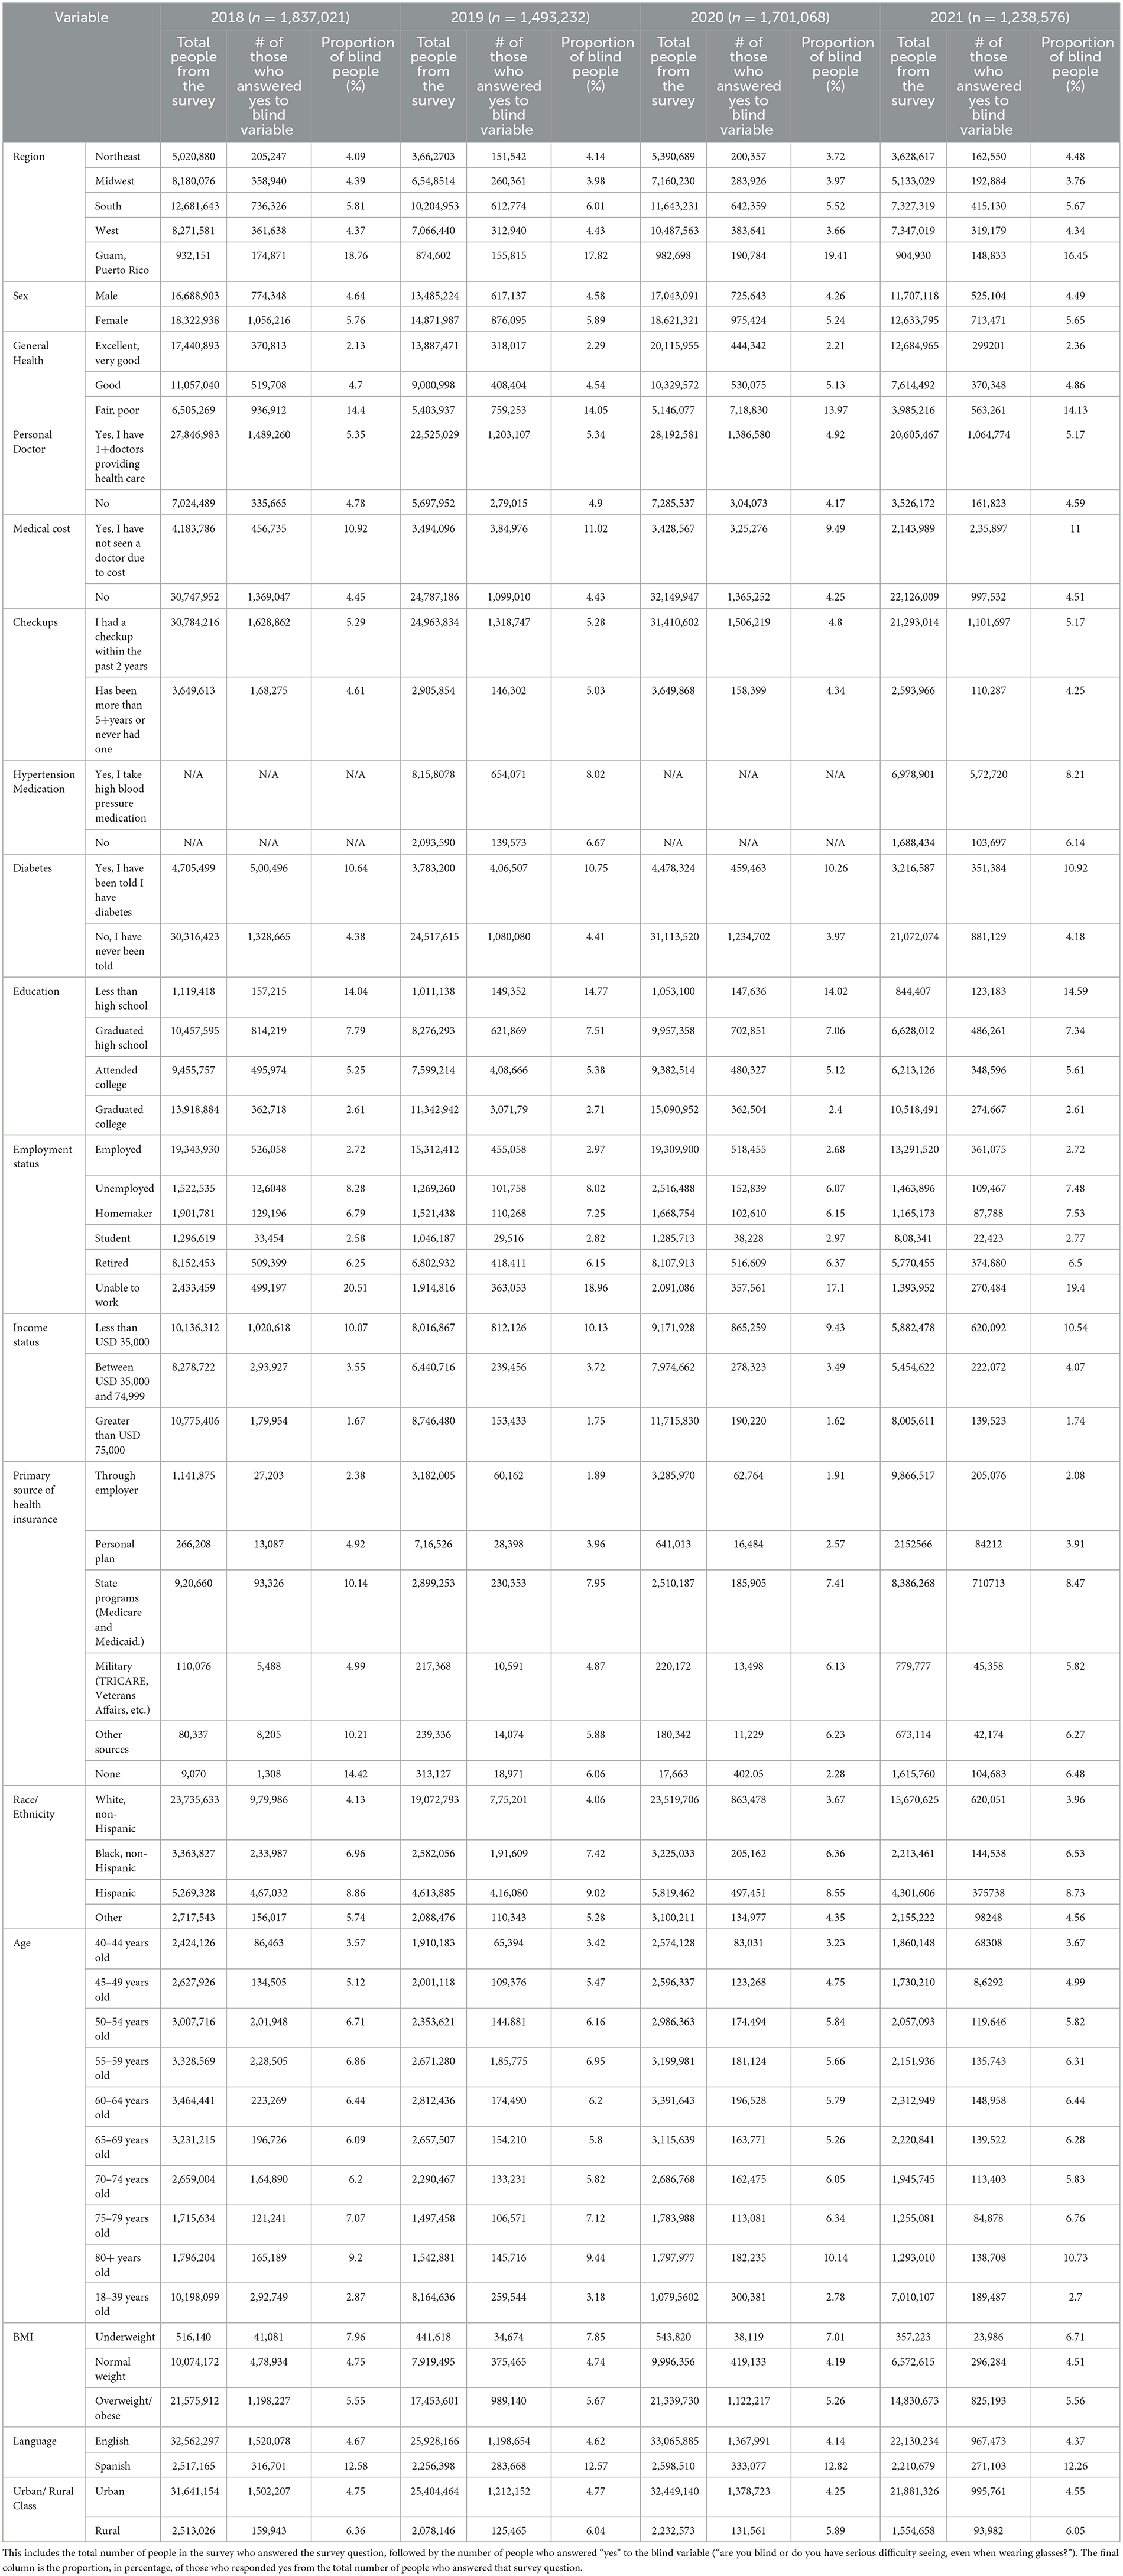
Table 3. The bivariate survey logistic regression of the response variable (blindness) and each explanatory variable by year.
In Figure 2, six explanatory variables were chosen to illustrate the importance of looking at the characteristics of those who are VI. From this analysis, we can infer which groups are more likely to have VI based on those who answered the Centers for Disease Control and Prevention BRFSS. The variables selected were “state,” “general health,” “BMI,” “income status,” “type of insurance,” and “age”.
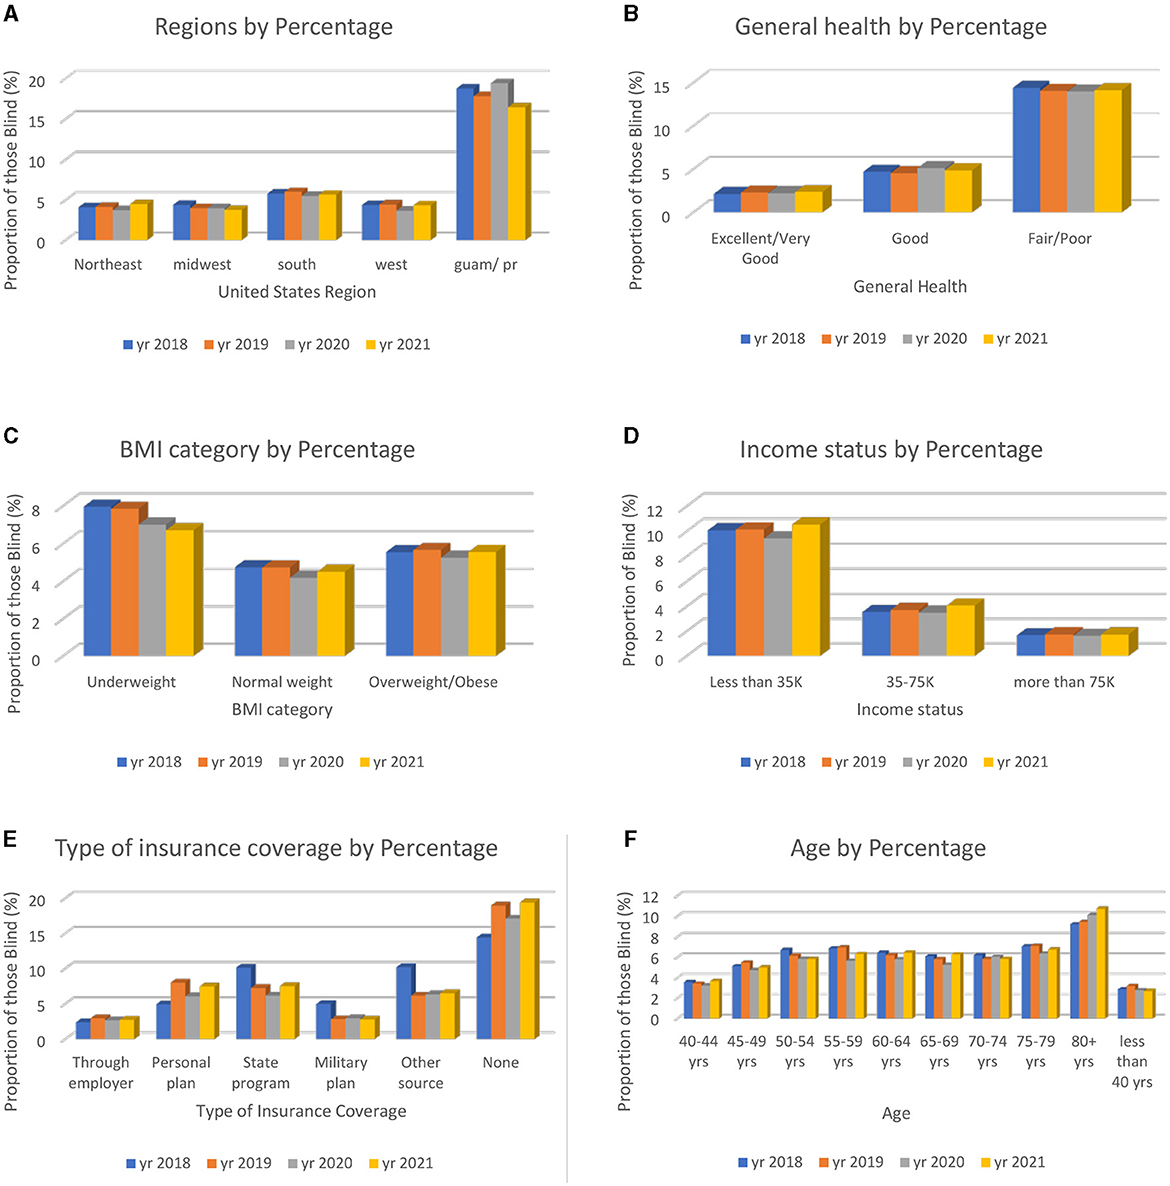
Figure 2. Six explanatory variables chosen from the bivariate analysis to show the characteristics of those who answered “yes” to blindness or having serious difficulty seeing, even with glasses. The total percentages of the combined data (2018–2021) are presented. (A) Total percentage of those who are VI based on geographic location state. (B) Total percentage of those who are VI based on personal health rating. (C) Total percentage of those who are VI based on BMI categories. (D) Total percentage of those who are VI based on income status. (E) Total percentage of those who are VI based on insurance source type. (F) Total percentage of those who are VI based on age.
For the multiple logistic regression analysis (Table 4), the reference group for each explanatory variable was as follows: “state”: Northeast, “sex”: male, “general health”: excellent/very good, “personal doctor”: no, “medical cost”: yes, “checkups”: never/ within past 5+ years, “diabetes”: yes, “education level”: less than high school, “employment”: student, “income level”: >75,000 a year, “type of insurance coverage”: military, “race/ethnicity”: Black, “age”: < 40 years old, “BMI”: underweight, “language”: Spanish, and “region classification”: rural. This analysis included point estimates, 95% confidence intervals, and p-values to show the association between the explanatory variables and the response variables based on the various levels in the explanatory variables. The significance level of p < 0.05 was used to determine significance in this study.
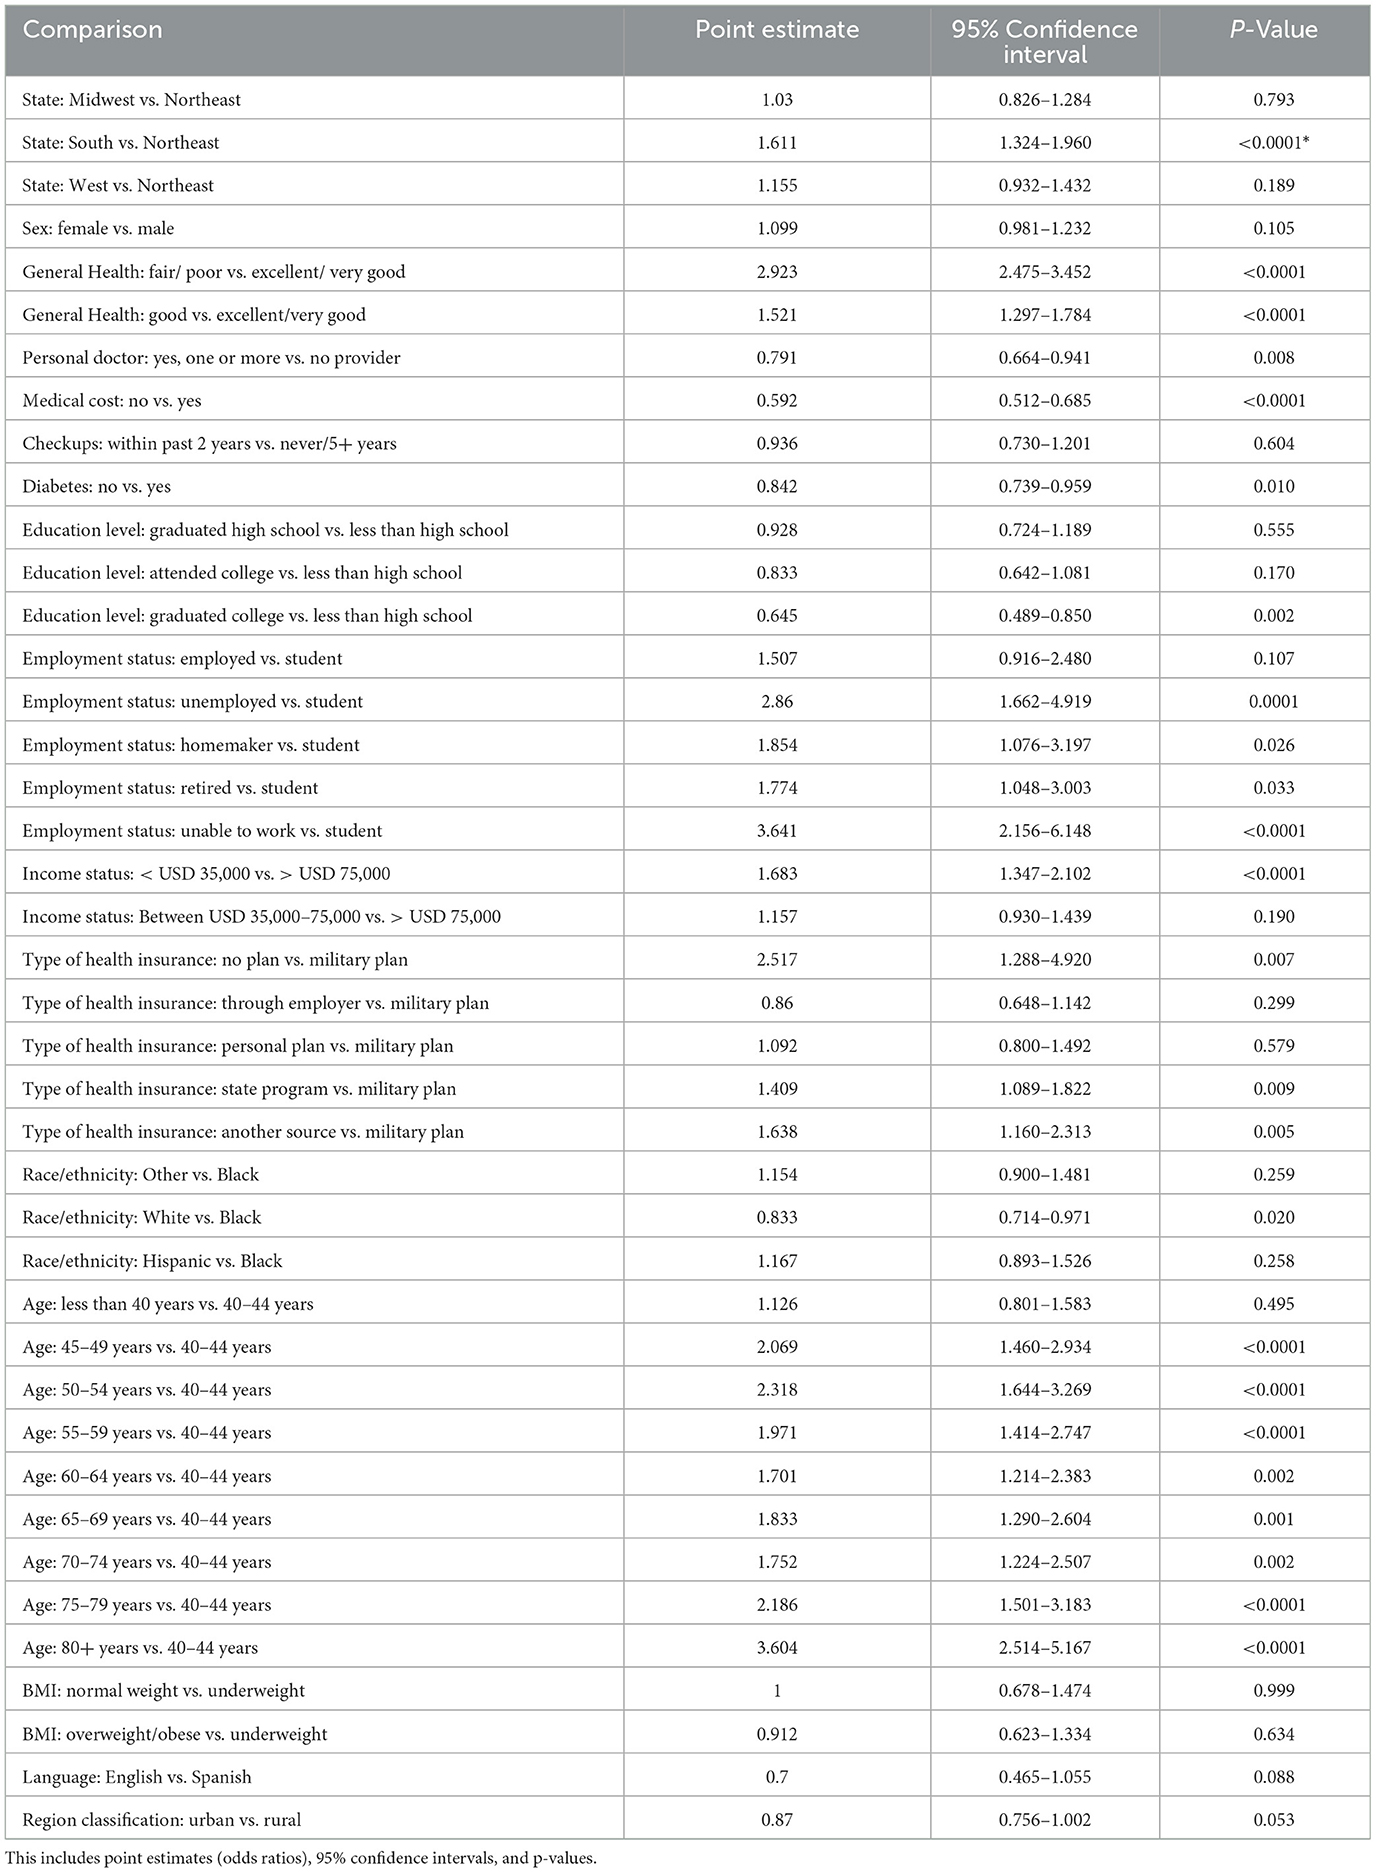
Table 4. Multiple logistic regression analysis of explanatory variables in association with the response variable (blindness).
The factors listed above have an association with blindness or having serious difficulty seeing based on their odds ratio. When the odds ratio is higher than 1, that factor is considered a risk factor. The descriptive and bivariate and multivariate regression analyses provide a key understanding of the characteristics of someone who is blind or has serious difficulty seeing, even when wearing glasses. We gathered the frequencies, percentages, confidence intervals, point estimates, and p-values to gain a full understanding of the socioeconomic status, demographics, and health status of individuals who answered “yes” to the question “are you blind or do you have serious difficulties seeing, even when wearing glasses?”
Discussion
There have been studies on eye health and the factors affecting the utilization of eye care services. The evidence from previous studies suggests that VI is associated with a low quality of life and compromised physical, emotional, and social wellbeing (1, 2, 11). Another study found that ophthalmic health is associated with SDOHs and that VI is associated with many disparities in eye care (education, genetics, etc.) and barriers to health care access (transportation, reliable doctors, and income) (5). These studies show that social determinants (race, income, geographic location, sex, employment, and healthcare coverage source) have a large impact on the quality of eye care services and the access to eye care services and health as they all have found a significant relationship to VI. Groups including racial and ethnic minorities, low SES individuals, and uninsured individuals receive ophthalmic screening, preventative care, and treatments at lower rates and lower standards (5). Race and ethnicity play a huge role in the type of health care one may receive, yet minorities and marginalized individuals are more susceptible to diseases that can, in turn, impact their eye health if left untreated. Halawa et al. (6) discussed the barriers to access to health care for racial minorities which are low levels of health insurance coverage, geographic locations, access to high quality care, and systemic racial differences in care. People who access proper care encounter other barriers such as high treatment costs, the need for regular follow-ups, and interactions with other health sectors (financial, pharmaceutical, providers, and counseling), all of which reduce overall patient cooperation and compliance (attending follow-ups and taking medication properly) (1).
We must find a way to create better treatment options and make follow-up care accessible. To treat those with VI, it is important to do so at the early stages to reduce the severity of vision loss. Comprehensive eye care (CEC) is a holistic new approach that encompasses treatment, prevention, promotion, and rehabilitation for blindness (1). CEC is a way to decrease the number of people who are diagnosed with an eye disease causing blindness or progressive vision loss. To this end, we need to educate patients and physicians on the comorbidities, groups who have higher chances of developing eye diseases, and available interventions depending on the disease such as cataract surgery, corrective lenses, and anti-VEGF therapy, which have been shown to improve the quality of life for 150 million people worldwide (2). To implement these interventions, we must encourage people to undergo annual screenings regardless of whether or not experiencing visual changes. More financial support should be spent on education for the public. The U.S. spends most of its funds on pharmaceuticals, high-volume/high-margin procedures, CT and MRI imaging, and administration costs that makeup two-thirds of the difference in healthcare costs between the U.S. and other developed countries (18). If the spending was minimized in these four areas, we could then create a more preventative initiative, such as pop-up clinics, to allow minorities and those in the low SES to obtain free and easily accessible eye screenings, which could decrease the rate of vision loss in the U.S. and make us a healthier nation.
It is critical to prevent the occurrence of diseases that can impact eye health by ensuring that all social groups are equally educated about them. This can be one of the only ways to truly decrease the number of people who lose vision due to health issues that could have been prevented by increasing the level of health literacy. All social groups should be equally educated about diseases they have that can affect the health of the eyes, as well as the characteristics/factors that can increase the risk of developing eye diseases. Health literacy is delivered in many forms including print literacy (written information), oral literacy (verbally informed), and numeracy (statistical data) (3). Multiple forms need to be available to reach every person in a way that can be informative. For example, a blind individual cannot read information unless it is braille so they must be able to listen to it, or someone who is deaf needs to be able to read the information. In the U.S. 76% of adults have an education level less than a high school degree and 59% of older adult (65+ years old) are below or at the base level (3). We must make efforts to reach all individuals so there are no disparities in health education based on race, education level, age, and geographic location. It has been found that “low health literacy is associated with increased hospitalizations, increased emergency care use, lower rates of mammography and influenza vaccination, decreased ability to take medications appropriately, decreased ability to understand labels, and higher mortality among older adult” (3) patients and physicians. We can address these issues and foster a healthier and more knowledgeable society.
The multiple logistic regression analysis identified some risk factors that have a significant effect on the occurrence of the disease: coming from a Southern state (OR 1.611 p < 0.0001 CI 1.324–1.960), general health classified as fair/poor (OR 2.923 p < 0.0001 CI 2.475–3.452), employment status of unable to work (OR 1.683 p < 0.0001 CI 1.347–2.102), income status of less than USD 35,000 a year (OR 1.683 p < 0.0001 CI 1.347–2.102), no insurance coverage (OR 2.517 p 0.0069 CI 1.288–4.920), and between the ages of 50–54 years old (OR 2.318 p < 0.0001 CI 1.644–3.269), the data are shown in Table 5. From this analysis, we identified six variables that are known to be relevant in those who are blind/have difficulty seeing. The odds ratios were not only < 1 but the p-values were significant as α was >0.05 and the confidence intervals did not include 1. We found significant variables that define the high-risk population and indicate the characteristic traits of those who are more vulnerable to suffering from vision loss.

Table 5. The explanatory variables are significantly associated with VI.
BRFSS is not without limitations. Sampling bias, stemming from non-response and under coverage of certain population groups, alongside reliance on self-reported data, introduces potential sources of error. Furthermore, the cross-sectional nature of the survey restricts its ability to elucidate temporal trends or establish causal relationships. Additionally, the survey's scope may not fully capture all determinants of health outcomes, necessitating caution in interpretation. Acknowledging these limitations highlights the importance of complementing BRFSS data with other research methodologies and data sources to obtain a more nuanced understanding of public health dynamics.
Conclusion
In this study, geographical location, perceived health status, employment status, income status, source of health insurance, and age of the individual were associated with blindness or having serious difficulties seeing. Those who live in Southern states, with no insurance, have an income level below poverty, and are of retirement age have the highest odds of suffering from VI. The factors listed above have an association with blindness or having serious difficulty seeing based on their odds ratio. When the odds ratio is higher than 1, that factor is considered a risk factor. The odds ratios are shown in Figure 3. We must study these factors further to learn the exact causal pathways that can influence whether a person becomes blind or has serious difficulty seeing so that we can reduce the number of people who suffer from visual impairment. These risk factors can guide the future development of interventions by ensuring that the individuals in risk groups are targeted along with the rest of the population.
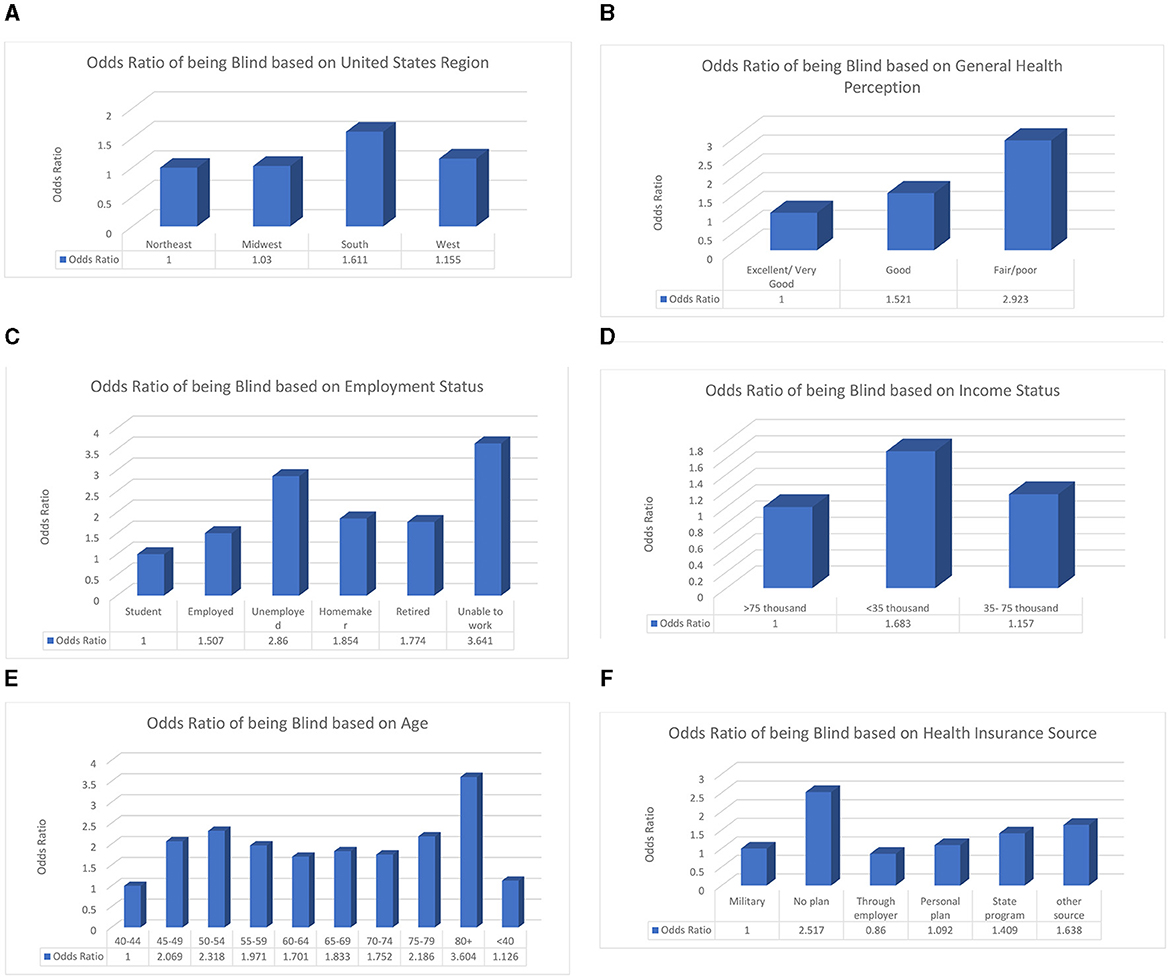
Figure 3. The explanatory variables are significantly associated with having difficulty seeing or being blind. The reference groups are shown as the first bar in each graph and have an odds ratio of 1. (A) Odds ratio of having visual impairments based on geographic location. (B) Odds ratio of having visual impairments based on general health perception. (C) Odds ratio of having visual impairments based on employment status. (D) Odds ratio of having visual impairments based on income status. (E) Odds ratio of having visual impairments based on age. (F) Odds ratio of having visual impairments based on health insurance source.
These odds ratios show that certain groups are at a higher risk of visual impairment due to socioeconomic, biological, or demographic factors, as well as other factors that need to be examined. Future studies should delve more in depth into how medical costs, education status, and body mass index vary among at-risk populations based on different levels. Another important direction is investigating the coverage provided by the main insurance companies regarding eye care in terms of examinations, procedures, medications, regulations, and deductibles. This study showed that patients using government insurance have a greater chance of blindness than those who have private insurance.
Data availability statement
The original contributions presented in the study are included in the article/supplementary material, further inquiries can be directed to the corresponding author.
Author contributions
AP: Writing—review & editing, Investigation, Software. KA: Writing—review & editing, Conceptualization, Data curation, Formal analysis, Funding acquisition, Methodology. DP: Formal analysis, Investigation, Methodology, Project administration, Software, Supervision, Writing—review & editing. MD: Formal analysis, Software, Validation, Writing—review & editing. CF: Data curation, Formal analysis, Investigation, Software, Supervision, Writing—review & editing.
Funding
The author(s) declare that no financial support was received for the research, authorship, and/or publication of this article.
Conflict of interest
The authors declare that the research was conducted in the absence of any commercial or financial relationships that could be construed as a potential conflict of interest.
Publisher's note
All claims expressed in this article are solely those of the authors and do not necessarily represent those of their affiliated organizations, or those of the publisher, the editors and the reviewers. Any product that may be evaluated in this article, or claim that may be made by its manufacturer, is not guaranteed or endorsed by the publisher.
References
1. Cicinelli MV, Marmamula S, Khanna RC. Comprehensive eye care—Issues, challenges, and way forward. Indian J Ophthalmol. (2020) 68:316–23. doi: 10.4103/ijo.IJO_17_19
2. Assi L, Chamseddine F, Ibrahim P, Sabbagh H, Rosman L, Congdon N, et al. A global assessment of eye health and quality of life: a systematic review of systematic reviews. JAMA Ophthalmol. (2021) 139:526–41. doi: 10.1001/jamaophthalmol.2021.0146
3. Capó H, Edmond JC, Alabiad CR, Ross AG, Williams BK, Briceño CA, et al. The importance of health literacy in addressing eye health and eye care disparities. Ophthalmology. (2022) 129:e137–45. doi: 10.1016/j.ophtha.2022.06.031
4. Ulldemolins A, Lansigh V, Valencia L, Cater M, Eckert K. Social inequalities in blindness and visual impairment: a review of social determinants. Ind J Opthalmol. (2012) 60:368–75. doi: 10.4103/0301-4738.100529
5. Besagar S, Yonekawa Y, Sridhar J, Finn A, Padovani-Claudio DA, Sternberg P, et al. Association of socioeconomic, demographic, and health care access disparities with severe visual impairment in the US. JAMA Ophthalmol. (2022) 140:1219–26. doi: 10.1001/jamaophthalmol.2022.4566
6. Halawa OA, Kolli A, Oh G, Mitchell WG, Glynn RJ, Kim DH, et al. Racial and socioeconomic differences in eye care utilization among medicare beneficiaries with glaucoma. Ophthalmology. (2022) 129:397–405. doi: 10.1016/j.ophtha.2021.09.022
7. Ding J, Wong TY. Current epidemiology of diabetic retinopathy and diabetic macular edema. Curr Diab Rep. (2012) 12:346–54. doi: 10.1007/s11892-012-0283-6
8. Fairless E, Nwanyanwu K. Barriers to and facilitators of diabetic retinopathy screening utilization in a high-risk population. J Racial Ethnic Health Disp. (2019) 6:1244–9. doi: 10.1007/s40615-019-00627-3
9. Leley SP, Ciulla TA, Bhatwadekar AD. Diabetic retinopathy in the aging population: a perspective of pathogenesis and treatment. Clin Inter Aging. (2021) 16:1367–78. doi: 10.2147/CIA.S297494
10. Stein JD, Khawaja AP, Weizer JS. Glaucoma in adults—screening, diagnosis, and management: a review. JAMA. (2021) 325:164–74. doi: 10.1001/jama.2020.21899
11. Allison K, Patel D, Alabi O. Epidemiology of glaucoma: the past, present, and predictions for the future. Cureus. (2020) 12:e11686. doi: 10.7759/cureus.11686
12. Allison K, Greene L, Lee C, Patel D. Uncovering disparities in vision health in rural vs urban areas: Is there a difference? Med Res Arch. (2023) 11:3664. doi: 10.18103/mra.v11i3.3664
13. Chen X, Rong SS, Xu Q, Tang FY, Liu Y, Gu H, et al. Diabetes mellitus and risk of age-related macular degeneration: a systemic review and meta-analysis. PLoS ONE. (2014) 9:e108196. doi: 10.1371/journal.pone.0108196
14. Gheorghe A, Mahdi L, Musat O. Age-related macular degeneration. Rom J Ophthalmol. (2015) 59:74–7.
15. Elam AR, Sidhom D, Ugoh P, Andrews CA, De Lott D, Woodward LB, et al. Disparities in eye care utilization during the COVID-19 pandemic. Am J Ophthalmol. (2022) 233:163–70. doi: 10.1016/j.ajo.2021.07.024
16. CDC- BRFSS FAQs. (2018). Available online at: https://www.cdc.gov/brfss/about/brfss_faq.htm (accessed January 26, 2018).
17. CDC. BRFSS Annual Survey Data. (2022). Available online at: https://www.cdc.gov/brfss/annual_data/annual_data.htm (accessed July 26, 2022).
Keywords: diabetic retinopathy, glaucoma, eye care utilization, quality of life, health disparities, risk factors
Citation: Powers AM, Patel D, DeAngelis MM, Feng C and Allison K (2024) Risk factors affecting the utilization of eye care services evaluated by the CDC's behavior risk factor surveillance system from 2018 to 2021. Front. Public Health 12:1335427. doi: 10.3389/fpubh.2024.1335427
Received: 08 November 2023; Accepted: 21 May 2024;
Published: 10 June 2024.
Edited by:
Trine Fink, Aalborg University, DenmarkReviewed by:
Aneta Grochowska, University of Applied Sciences in Tarnow, PolandSiti Nurliyana Abdullah, University of Brunei Darussalam, Brunei
Copyright © 2024 Powers, Patel, DeAngelis, Feng and Allison. This is an open-access article distributed under the terms of the Creative Commons Attribution License (CC BY). The use, distribution or reproduction in other forums is permitted, provided the original author(s) and the copyright owner(s) are credited and that the original publication in this journal is cited, in accordance with accepted academic practice. No use, distribution or reproduction is permitted which does not comply with these terms.
*Correspondence: Karen Allison, S2FyZW5fQWxsaXNvbkB1cm1jLnJvY2hlc3Rlci5lZHU=