 Jing Deng
 Qianwen Song3
 Dexun Li
- 1School of Hospital Economics and Management, Anhui University of Chinese Medicine, Hefei, China
- 2Key Laboratory of Philosophy and Social Science of Anhui Province on Data Science and Traditional Chinese Medicine Innovation and Development, Anhui University of Chinese Medicine, Hefei, China
- 3Office of Chengdu Shuangliu District Maternal and Child Health Hospital, Chengdu, China
Background: The coordination of health service supply and regional economy is an integral path to promote China’s prosperity.
Methods: Based on the coupling mechanism of health service supply and regional economy, we sampled the data from 30 provinces in China from 2009 to 2021 in this study and constructed the evaluation index system. Additionally, we calculated the coupling coordination degree (HED) of the two through the coupling coordination degree model. We further used the kernel density estimation, Moran’s I index, and spatial β convergence model to assess the dynamic evolution trends, spatial aggregation effect, and spatial convergence characteristics of coupling coordination.
Conclusion: (1) HED in China showed a rising trend during the study period but with large regional differences, forming a gradient distribution pattern of “high in the east and low in the west.” (2) The results of Kernel density estimation show that HED has formed a gradient differentiation phenomenon within each region in China. (3) HED has modeled spatial clustering characteristics during the study period, with high-value clusters mainly appearing in the eastern region and low-value clusters appearing in the northwestern region. (4) There are absolute β-convergence and conditional β-convergence trends in HED in China and the three major regions during the study period, but there is an obvious regional heterogeneity in the control factors. The research provides a reference for accurately implementing policies according to different levels of health service supply and economic development, in addition to narrowing the regional differences of the coupling coordination between the regional economy and health service supply.
1 Introduction
Following China’s economic reforms, the country’s economy has witnessed rapid growth. This, however, has led to regional economic disparities due to differences in geographic locations and resource possession, resulting in a pattern where eastern and southern regions economically outpace the western and northern ones (1). Simultaneously, China faces pronounced disparities in health service supply that are attributed to uneven regional economic progression and variances in local health financial subsidies (2). With China’s advancing economy and an aging population, the demand for healthcare services is increasing. Despite this, China’s per-capital healthcare resources still fall behind developed countries like the United Kingdom, the United States, and Japan, presenting a persistent challenge in healthcare service capacity. Notably, the 14th Five-Year Plan (3) highlights the importance of coordinating regional economic development with healthcare service levels for sustainable national growth. It has been found that the regional economy has a positive stimulating effect on improving the level of health service provision (4). First, the level of economic development affects the input of total medical resources, since the larger the regional economic aggregate, the more resources will be invested in medical and health services (5). Second, the layout of economic development also affects the layout of health resources, where the higher the level of economic development, the stronger the attraction of health resources (6). Third, the level of economic development affects the level of medical and health service capacity, where the residents’ demand for health service supply rises alongside economic development, which in turn promotes the active improvement of medical service capacity (7). Health service supply plays the role of guarantor for national economic and social development as its capacity has a positive effect on the population’s health. A healthy population from a better health service supply translates a healthy workforce that improves the nation’s labor productivity, which promotes economic development (8). In other words, healthcare expenditure promotes economic development. The improvement of health service supply capacity needs to be accompanied by government funding and residents’ health consumption expenditure. The funding patterns of which have been shown in studies as able to promote economic growth (9). Therefore, exploring the coordinated relationship and future trends between health service supply and China’s regional economy is vital for country’s development.
Scholars have employed various research methodologies to investigate the bidirectional relationship between the regional economy and health service supply in diverse regions. Research has demonstrated that when health service supply and the regional economy develop in a synergistic, interactive, and synchronized fashion (10), they significantly contribute to the prosperity and development of a region (11).
The coupled coordination degree model effectively unveils interactions between systems and is thus widely utilized in regional economic research (12, 13). Existing literature on the coupling and coordination between health service provision and regional economy primarily explores various regional coupling relationships and their spatial linkages. Notably, scholars have delved into this coupled system relationship from national, regional, provincial, and municipal perspectives. For instance, Liu et al. (14) analyzed this relationship within China’s health and economic systems using the coupled coordination model. Similarly, Zhou et al. (15) investigated the Yangtze River Delta’s health and economic coupling, finding a strong correlation with the region’s economic development. Ma (16) focused on Shandong Province to study this relationship from a provincial viewpoint, while Chi et al. (17) measured the coupled coordination between health and economy at the county level in China.
Furthermore, spatial analysis tools like Moran’s I index, LISA analysis, geo-detector, and fixed-effects models have been employed to gauge the spatial relationship of this coupled coordination. Gong et al. (18) utilized the Moran index and LISA to analyze China’s spatial state of coupled coordination between health and economy. Hui Tang et al. (19) applied geographic probes for a similar study in China, and Li et al. (20) used coupled fixed-effects models to examine the relationship in Central China.
Although these studies have explored the interrelationship between health service provision and regional economy at different spatial scales, focusing mainly on the characteristics of the spatial and temporal distribution of coupling and the presence or absence of spatial correlation, these studies lack further research on the spatial spillover effects of HED. To address this gap, this study examines 30 Chinese provinces using the coupling coordination degree model to analyze the coordination level between China’s health service supply and regional economy. The dynamic characteristics of the coupling’s development are analyzed using the kernel density method. Moreover, Moran’s I index is utilized to verify spatial correlation (21). Finally, this paper employs spatial β-convergence models to explore the spatial spillover effects of influencing factors.
The potential marginal contributions of this study are as follows: (1) It investigates the dynamic evolution and spatial distribution patterns of HED in China and its three major regions, focusing on spatial patterns and agglomeration. (2) The study uses kernel density estimation to elucidate the dynamic development process of HED across different regions. (3) Employing the conditional β-convergence model, it highlights the regional variances in factors influencing HED, providing a robust scientific basis for precise and localized coordination of health service supply and economic development.
2 Methods
2.1 Indicator selection
This study selected indicators pertinent to health service supply capacity from China’s 14th Five-Year Plan and Healthy China 2030 Strategy (22). Building on existing research and the health industry’s characteristics, four secondary indicators and nine tertiary indicators were chosen. These include human resources for health (23, 24), physical resources for health (25, 26), health service efficiency (27, 28), and disease prevention and control (29, 30), forming an evaluation system to assess China’s health service supply level (31). Health human resources and physical facilities reflect per capita healthcare resource supply, indicating a region’s healthcare service capacity. Health service efficiency measures the operational status of health institutions and is a crucial aspect of regional healthcare capacity. Disease prevention and control not only mirror the effectiveness of local healthcare but also depict the impact of economic and social factors on the healthcare environment (32).
The number of medical institutions, the number of beds, and health personnel are the basis of medical resources and can intuitively reflect the supply capacity of medical services. In this study, licensed or assistant doctors, registered nurses, hospitals, and beds were selected as the level-three indicators to measure the supply level of medical and health services based on the number of beds per 1,000 population. Consultation volume and hospitalization volume are the key indicators reflecting the status of healthcare service utilization and influencing factors (33), in this study, the number of outpatient visits to healthcare institutions, the number of patient hospitalizations, and the average number of outpatient visits undertaken by physicians per day were selected as the tertiary indicators to measure the status of healthcare services. The morbidity and mortality rates of infectious diseases reflect the effectiveness of public health services in epidemic prevention in a region (34). In this study, the morbidity and mortality rates of class A and class B infectious diseases were selected as indicators of disease prevention and control.
Furthermore, the regional economy is analyzed not just in terms of size but also the economic structure’s rationality and socio-economic vitality. Drawing on existing literature (35–39) and adhering to principles of scientific rigor, representativeness, and accessibility (35), the study selects eight indicators across economic scale, structure, and socio-economic dimensions for a comprehensive evaluation.
Overall, economic aggregate is an important indicator of the development level of a regional economic scale, which can represent a country or region’s economic strength. In this study, Gross Domestic Product (GDP), local general public budget revenue, fixed asset investment and other indicators are chosen to measure the regional economic aggregate (40). Economic structure is of great significance to the sustainable development of the economy as an adaptable one helps to improve the overall efficiency and competitiveness of the economic system and promotes the healthy development of the economy. This study chooses the proportion of secondary and tertiary industries in GDP and employment to indicate the rationality of regional economic structure (41). Social economy is an indicator that measures the benefits and results of economic activities, which can represent the economic vitality of a country or region and the consumption capacity of residents. This study selects the per capita disposable income of the residents and the total consumption of retail goods in the society to represent the social economy of the region (42).
The chosen indicators for assessing health service supply and regional economic evaluation are presented in Table 1.
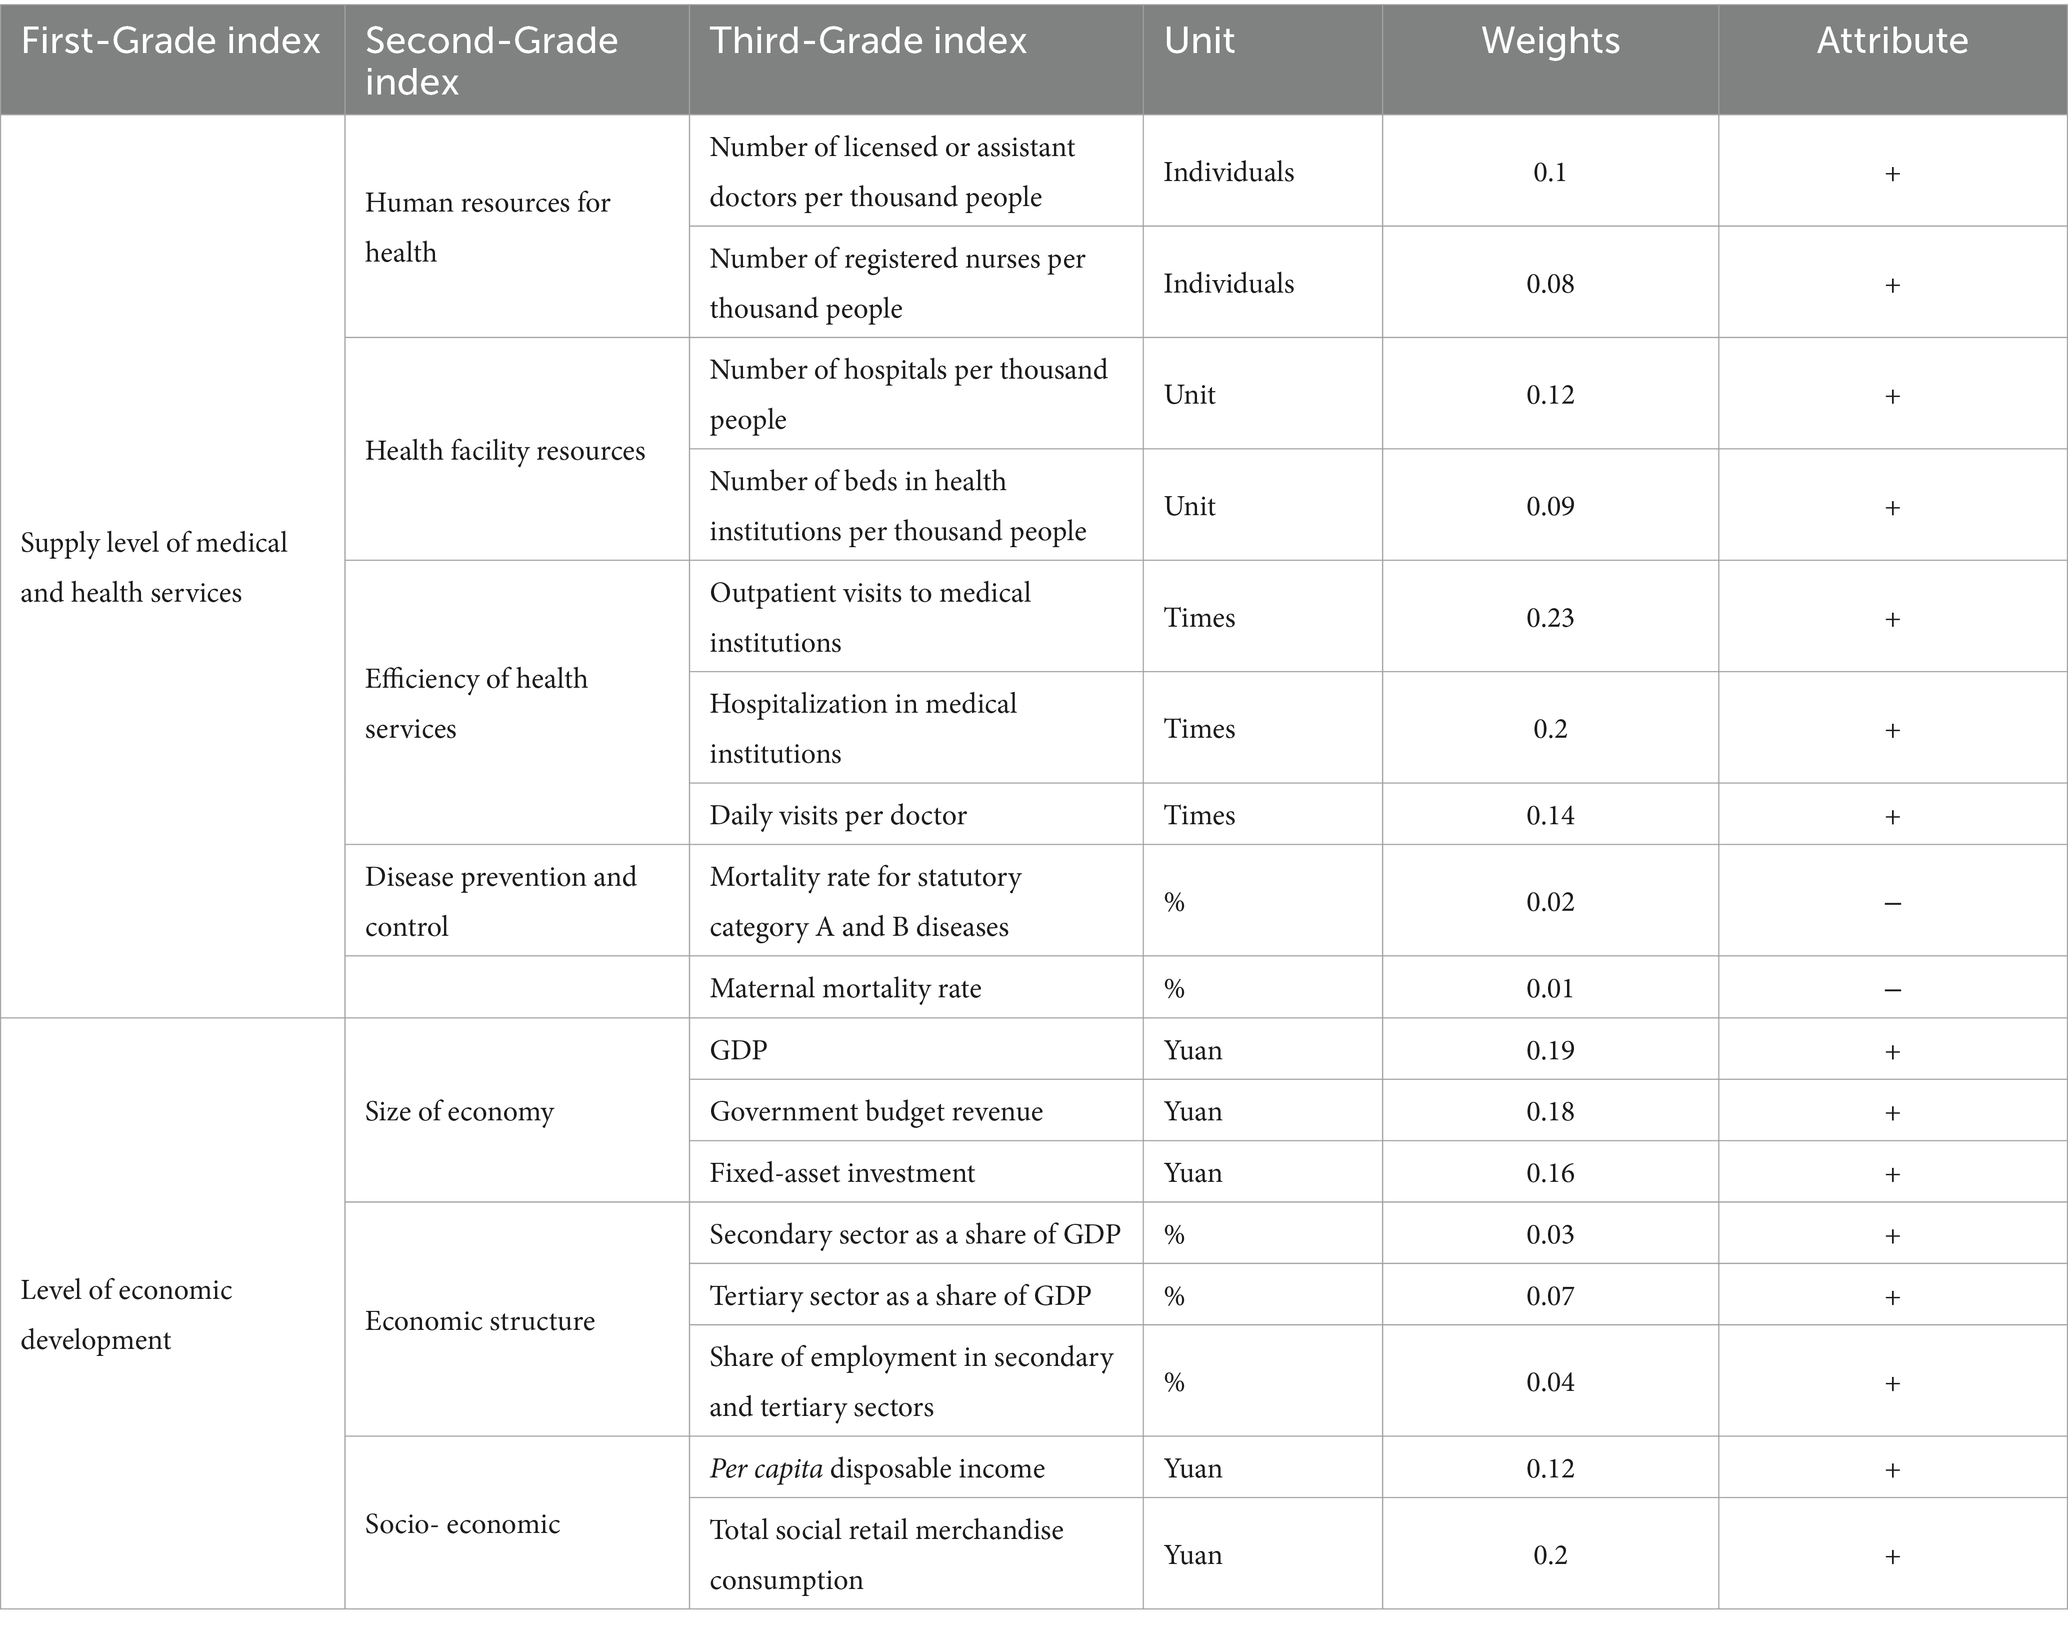
Table 1. Evaluation index system of China’s HED.
2.2 Data sources
Data on the numbers of doctors, nurses, beds, hospitals, outpatient visits, hospitalization cases, daily visits per doctor, mortality rate for statutory category A and B diseases, and mortality rate in the level of health service supply subsystem are from the China Health Statistics Yearbook (2009–2022) (43). Data on the economy size and socioeconomic data in the level of economic development subsystem are all from the China Statistical Yearbook (2009–2022) (44). The secondary structure sector as a share of GDP and tertiary sector as a share of GDP in Economic structure are from the China Statistical Yearbook (2009–2022). The share of employment in secondary and tertiary sectors is from the China Labor Statistics Yearbook (2009–2022) (45).
In terms of regional division, this study adopts the criteria of China’s Seventh Five-Year Plan for the division of China’s three major economic zones (Table 2). This criterion is included in the commonly used regional division by the Chinese Bureau of Statistics.
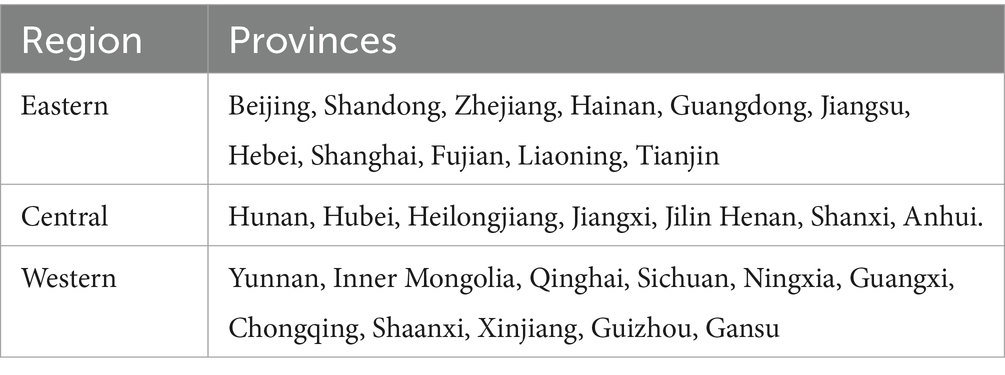
Table 2. Distribution of the three major regions in China.
2.3 Entropy value method
2.3.1 Subsystem score calculation
2.3.1.1 Standardization of indicator data
To mitigate the impact of varying index scales on measurement results, the original data are standardized using the extreme deviation method (46). Equations (1) and (2) are the dimensionless processof positive and negative indicators respectively.
Where is the standardized value of the ith jth indicator, Vij is the value of the jth indicator in item i and m is one of the indicators studied (47).
2.3.1.2 Calculation of subsystem scores
After normalizing the data, the subsystem score can be calculated (48). Equation (3) will be used to calculate the value of ith subsystem.
Where (i = 1, 2) is the number of indicators in the ith subsystem, and i = 1 and 2 denote the health care service provision subsystem and the economic development level subsystem, respectively (49).
2.3.2 Coupling coordination degree model
2.3.2.1 Coupling model
The concept of “coupling,” originally derived from physics, refers to the phenomenon of two or more systems or modes of motion influencing each other through interaction to the point of synergy (50). The concept of coupling has also been gradually incorporated into research in the socio-economic field and has been widely applied to research areas such as urban economy/industry, economy/health, and environment/industry (51–56). Regional economy and health service supply are two correlating systems that can influence each other so this paper will utilize the coupling model to measure the interaction between the two.
Drawing on the capacity coupling coefficient model in physics, a coupling degree model consisting of two subsystems of health care service supply and economic development level was established using the following Equation (4):
Where C denotes HED, C∈ [0,1]; denotes the health care service provision subsystem; and denotes the level of economic development.
2.3.2.2 Coupled coordination degree model
However, the coupling model cannot always reflect the synergistic effect between the level of health service provision and the regional economy. To address this, this study also refers to the Coupled Coordination Degree Model proposed by Liao Chongbin (57) to assess the degree of coupling and coordination between health service supply capacity and regional economic development.
Further building upon the coupling degree, a coupling coordination degree model was set up to measure the degree of coordination of the interactive coupling between the two systems of medical and health service supply and the level of economic development, using the following Equation (5):
Where D denotes HED; T denotes the comprehensive reconciliation index of the health care service supply subsystem and the economic development level, reflecting the overall synergy or contribution between these systems; a, b is the coefficient to be determined. This study believes that the health care service supply is equally important to the level of economic development and the two should be mutually reinforcing, so take a = b = 0.5 (58).
Based on the results of related research (59) and the characteristics of the data in this study, D was categorized into seven basic types (see Table 3).
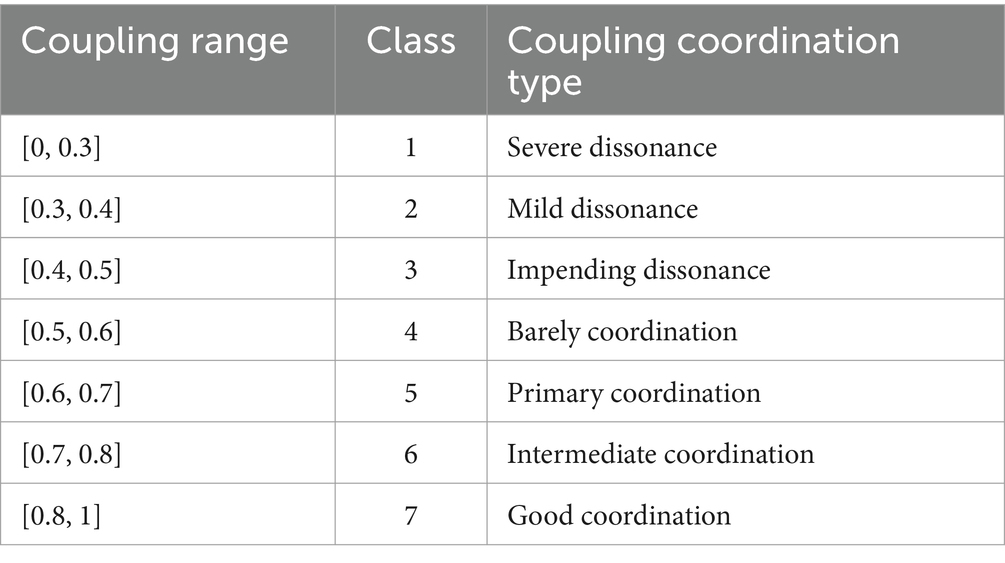
Table 3. The types and classes of HED.
2.3.3 Kernel density estimation method
As a nonparametric method, kernel density estimation (KDE) has the advantages of strong robustness and weak model dependence. The KDE method can analyze the regional difference characteristics of the observed objects from the characteristics of the distribution pattern, change trend and ductility of the observed objects (60). Therefore, it has been widely used in the study of regional differences when measuring economic development, health service supply, and health level of the population (61–64).
Therefore, in order to better analyze the characteristics of HED development in different regions of China, we used the KDE method (65) to analyze the distribution dynamics and trends of HED with the following Equation (6):
Where N is the number of samples, h is the bandwidth, and x is the mean.
2.3.4 Spatial autocorrelation
Spatial autocorrelation analysis is often used to determine if there are interdependencies between variables distributed between the same regions. It is also used to measure if there is spatial aggregation between variables (66, 67). This paper employs the global Moran index and local Moran index to assess spatial correlation and agglomeration, respectively (68).
2.3.4.1 Global
The global Moran index can judge the spatial distribution characteristics between variables from the significance level. In which the positive significance sign implies that there is a centralized distribution characteristics between variables, and negative significance characteristics represent the dispersed characteristics. The size of the global Moran index can also determine the size of the spatial association between variables, where the closer the positive value is to 1, the stronger the concentration and the closer the negative value is to −1, the stronger the dispersion (69).
Here, is the observed value of region i and is the observed value of region j, is the spatial weight matrix with spatial adjacency of 1. I(d) > 0 is the spatial positive correlation, which indicates that there is significant spatial clustering of HED.
2.3.4.2 LISA index
To compensate for the fact that global Moran’s I cannot pinpoint the exact spatial location where aggregation or anomalies occur, the local spatial autocorrelation pattern of HED was analyzed using the Local Indicator of Spatial Association (LISA) (70). Local Indicators of Spatial Association (LISA) was used to measure the degree to which the values of spatial unit variables are similar (positive correlation) or different (negative correlation) from the values of neighboring units. Additionally, it can be also used to identify “hot spots” to test the heterogeneity of the data (71) using the following Equation (7):
Where and are normalized for observations in regions i and j. Here > 0 indicates that HED in this region is less different from the neighboring regions. Meanwhile, < 0 indicates that there is a significant difference in HED in this region.
2.3.5 Spatial beta convergence model
β convergence is based on the growth theory from the neoclassical school of economics, which believes that the HED of backward regions has a faster growth rate and will gradually catch up with the HED of developed regions and that the HHED of each region will converge to a stable, uniform state as time goes by Barro and Martin (72). β-convergence includes absolute convergence and conditional convergence, where conditional β-convergence means that the HED of each region converges to its respective steady-state level after considering the different effects of other initial endowments (73). Additionally, it has been shown that there is a spatial correlation between both regional economy and health service supply (74), so it is necessary to include spatial factors in the consideration of HED and spatial correlation in the convergence test. Since the traditional convergence model has not yet considered the spatial effects that exist in different regions, the adjacent weight spatial weight matrix is selected, and the dynamic spatial SAR, SEM, and SDM models are also introduced for spatial convergence analysis (72). The constructed model is as follows Equations (9–11):
Where is the observation of the region in period t, represents an independent and identically distributed residual term, and is the error term with spatial autocorrelation, and β represents the strength of the convergence process, is a constant term. is the spatial autoregression coefficient, is spatial autocorrelation coefficient of error item, and is the spatial lag coefficient of. Additionally, is the element in spatial weight matrix, denotes the spatial interaction of , and represent province and time-fixed effects. is the coefficient of control variable. is the spatial lag coefficient of control variable (75, 76). is the control variable, mainly financial self-sufficiency rate (SELF) (77, 78), urbanization rate (URB) (79, 80), openness to the outside world (OPEN) (81, 82), transportation accessibility (TRAF) (83, 84), and the level of science, technology and innovation (THNC) (85, 86), The definitions and data sources for these variables are shown in Table 4. If <0, it means that there is convergence. v is the rate of convergence. V is calculated from Equation (12).
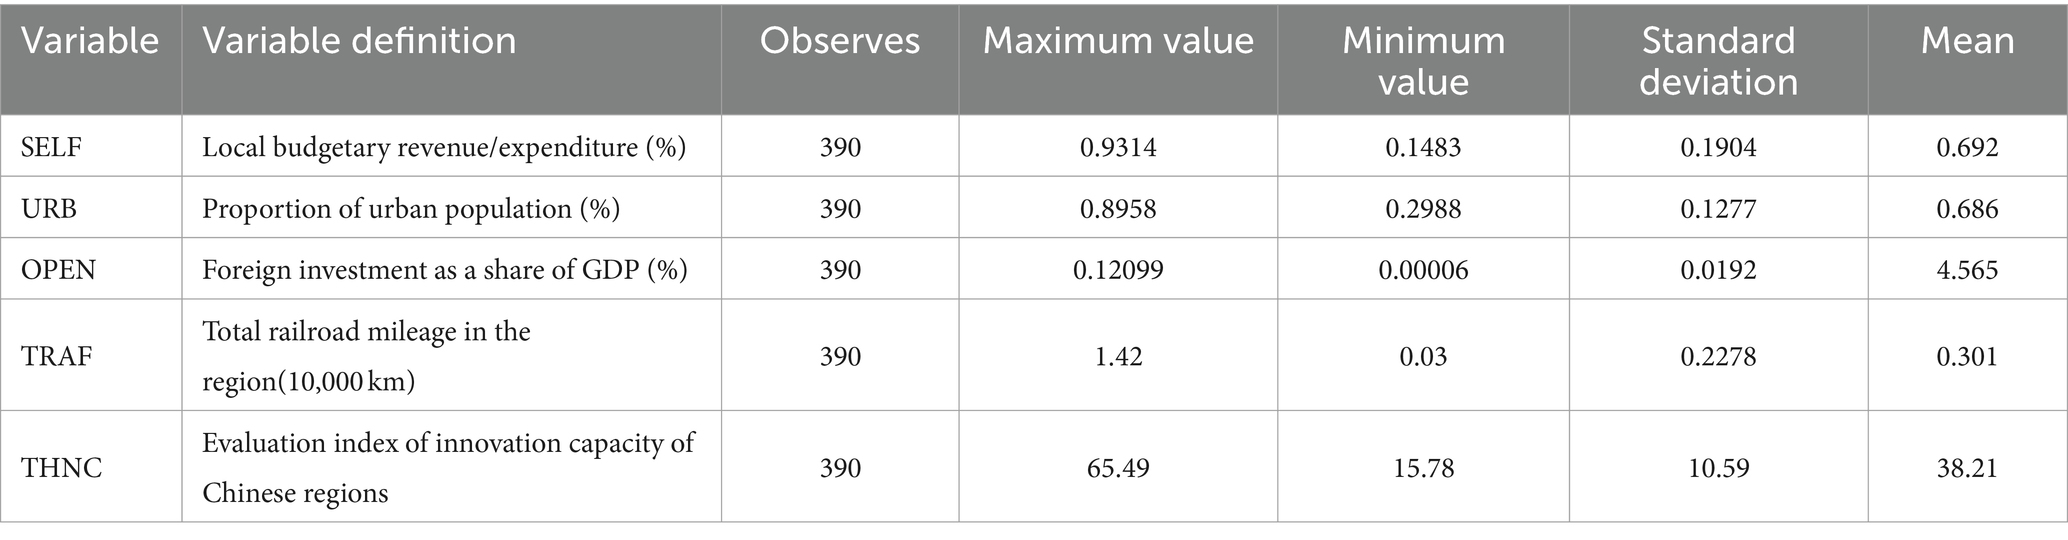
Table 4. Definition and descriptive statistics of control variables.
3 Results
3.1 Spatial and temporal evolution of HED
Table 5 illustrates a continuous year-by-year increase in China’s HED’s mean, rising from 0.402 in 2009 to 0.601 in 2021. This progress signifies a transition from a state of near disharmony to one of basic coordination in healthcare systems. This transformation can be primarily attributed to China’s rapid economic development over the past decade. Simultaneously, the rapid expansion of the regional economy has led to a significant upsurge in the provision of healthcare services. Notably, Guangdong Province and Jiangsu Province exhibit the highest levels of coordination, while Qinghai Province and Ningxia Province exhibit the lowest degrees of coordination.
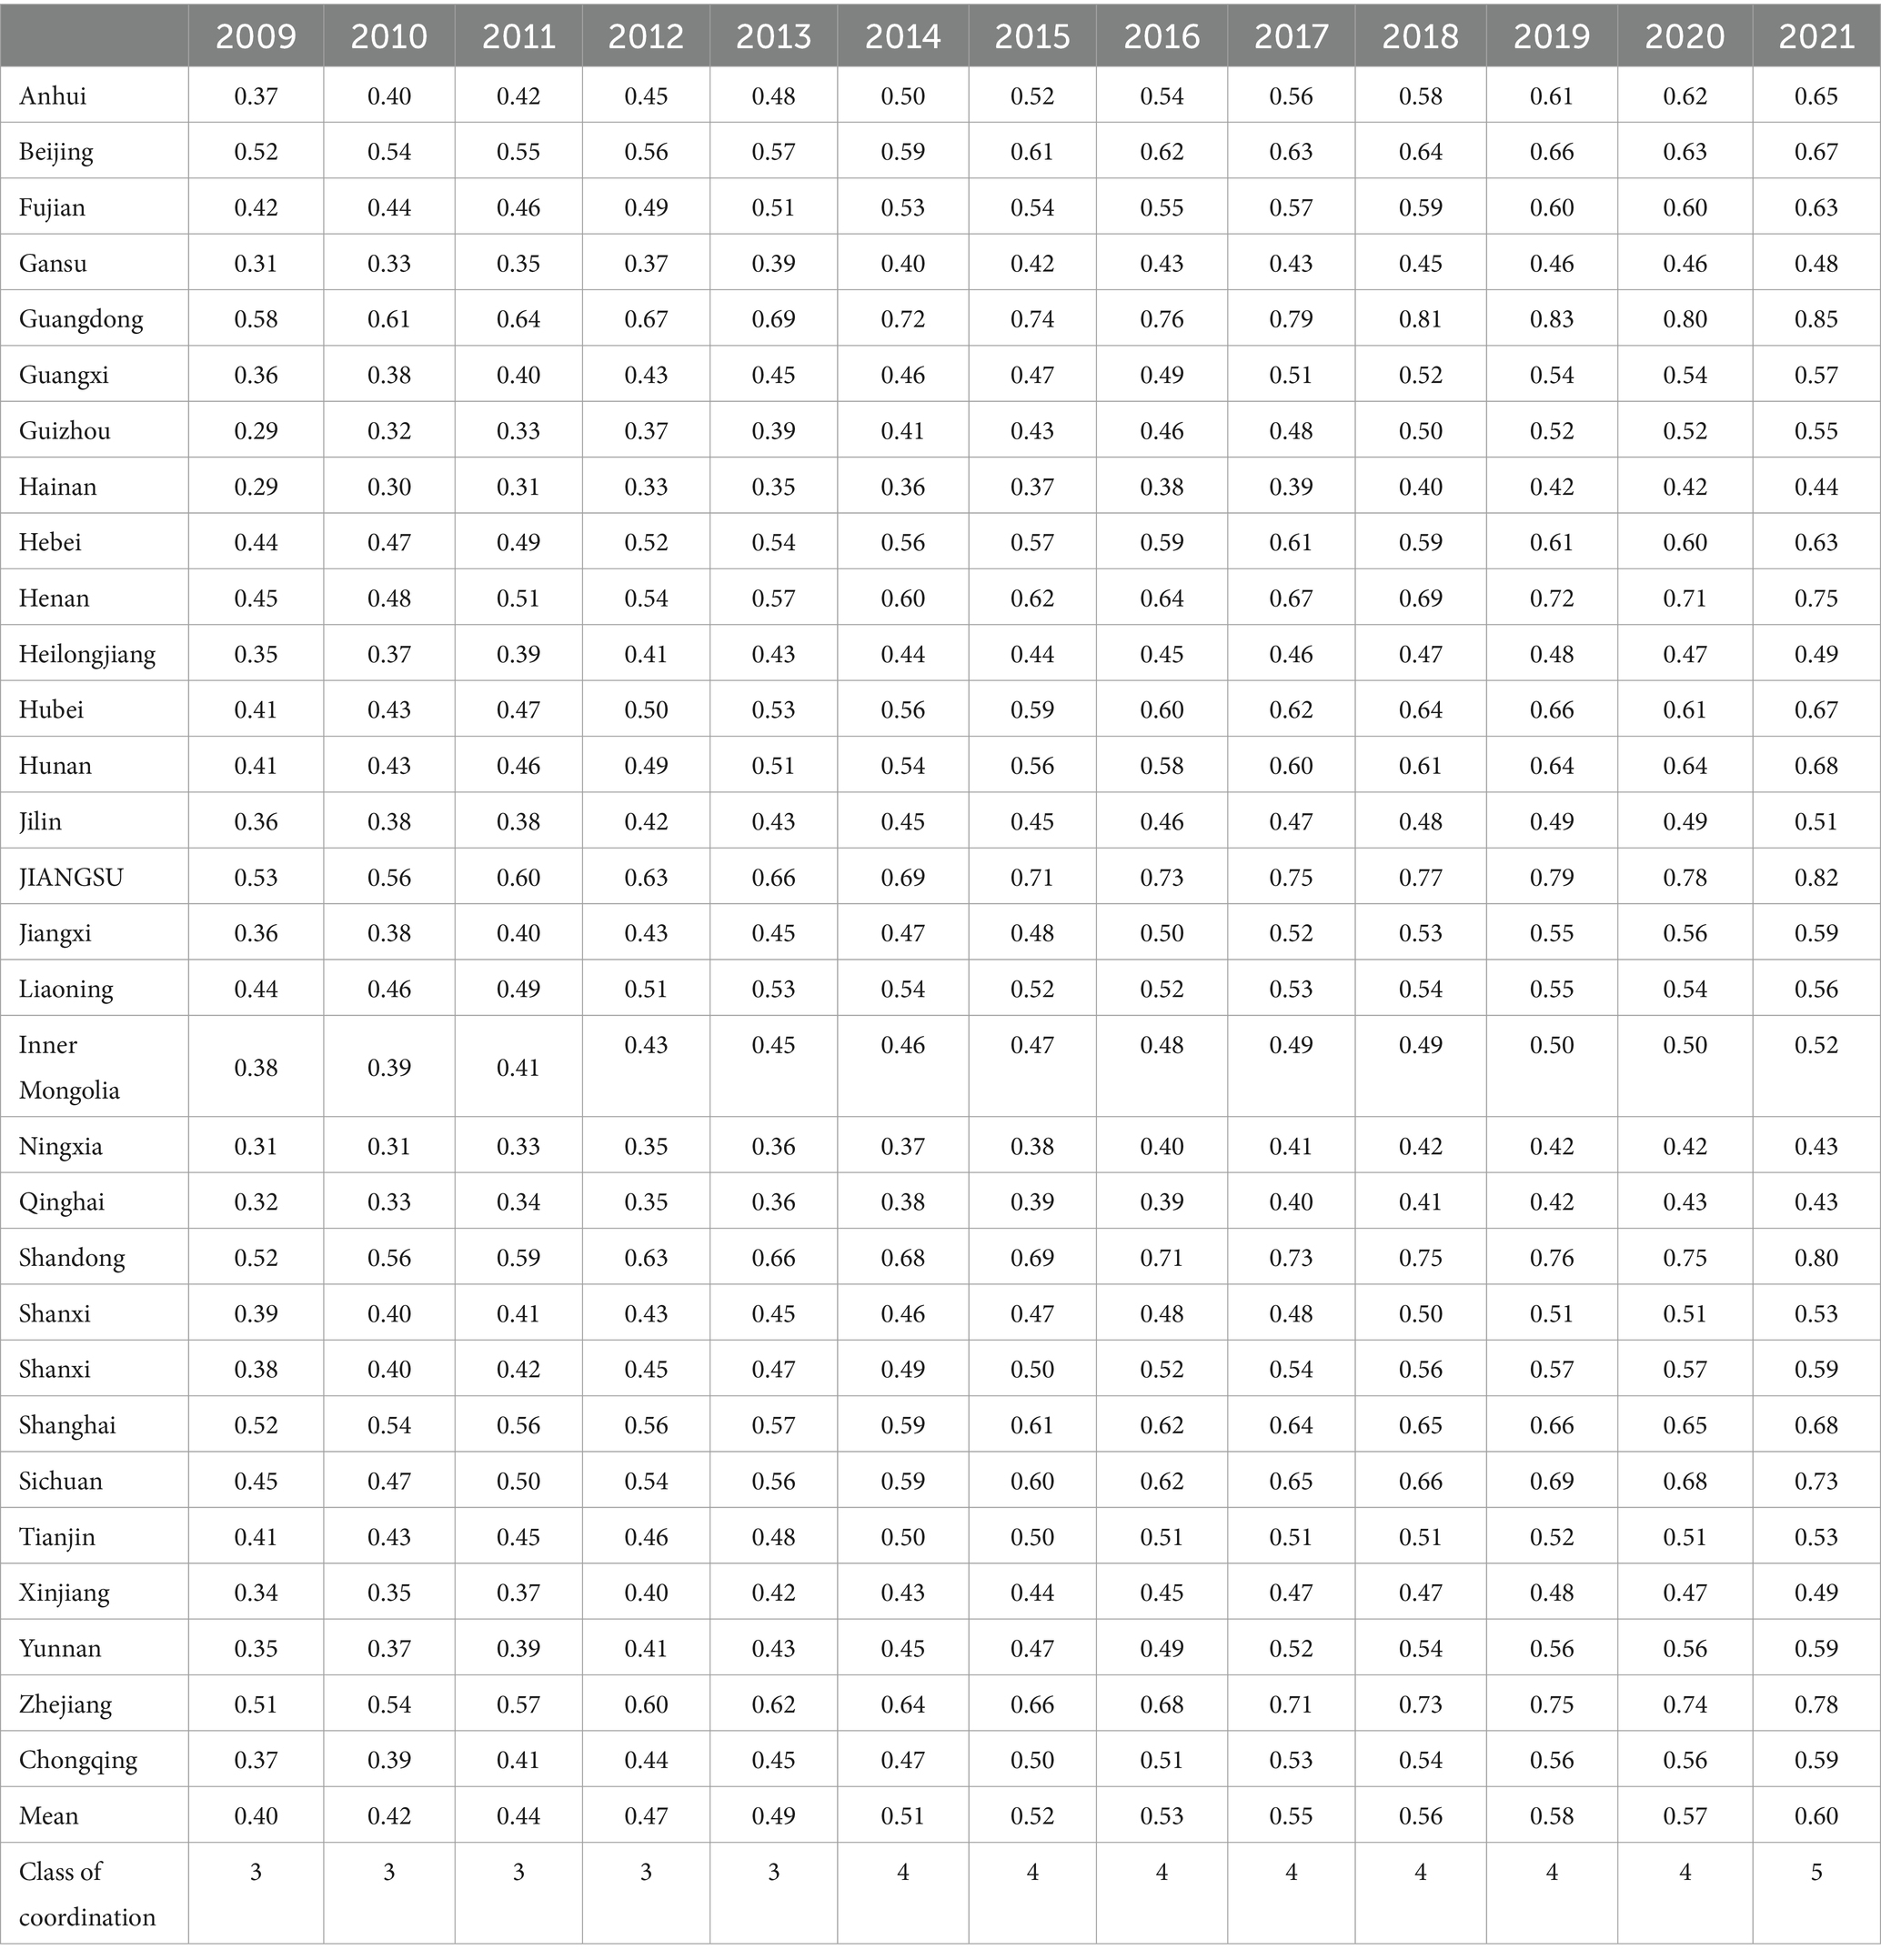
Table 5. Value of HED in China from 2009 to 2021.
3.2 Spatial and temporal distribution of HED
Based on the HED in 2009, 2015, and 2021, the spatial distribution and trend maps of HED in China were produced by ArcGIS software (Figure 1).
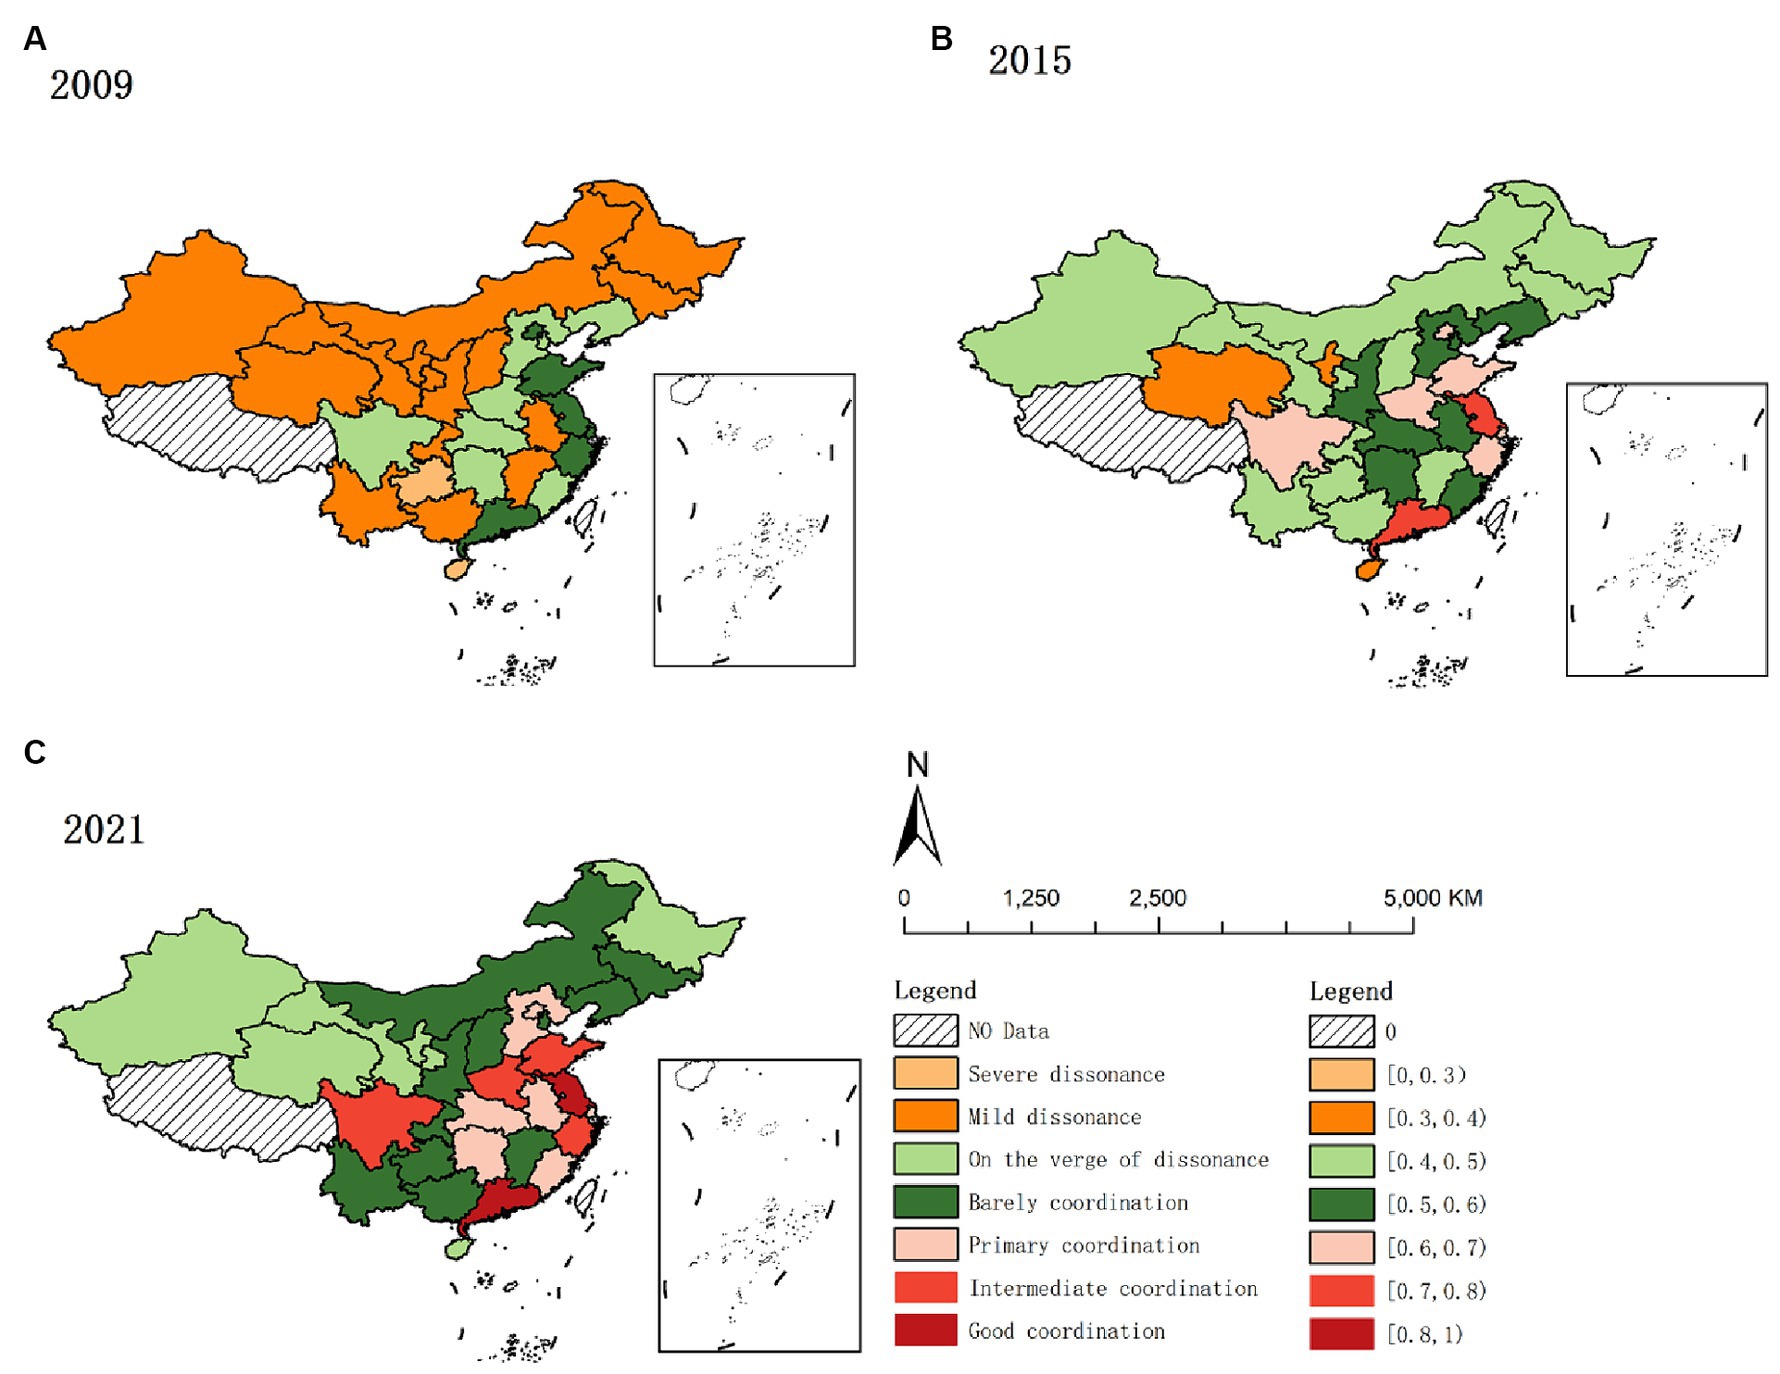
Figure 1. Spatial and temporal distribution of HED from 2009 to 2021. (A) 2009. (B) 2015. (C) 2021.
As depicted in Figure 1, high-value areas predominantly converge in the eastern region. The eastern region, compared to others, exhibits a superior economic status, a more balanced industrial structure, and a greater appeal for resources like labor and capital. These enhanced economic conditions facilitate increased investment in healthcare, improving service provision. Concurrently, improved medical services contribute to health protection and support for socio-economic development, fostering a positive interplay between economic and health outcomes. Additionally, the region’s stronger economy tends to positively influence neighboring areas, culminating in the coordinated enhancement of both medical services and the regional economy in the eastern region.
Low-value areas predominantly exist in China’s western provinces like Gansu, Qinghai, Ningxia, and Xinjiang. The western region faces dual disadvantages in geographical and economic aspects compared to other regions. Economically overshadowed by the more prosperous eastern provinces, these western provinces experience slower economic development. Concurrently, the weaker infrastructure and scarcity of medical resources contribute to slower health service delivery and economic growth. Additionally, the western provinces face harsher natural environments than the east-central region, leading to a higher demand for medical services (87). However, limited by their economic constraints, they struggle to provide adequate healthcare, resulting in a lag in coordinating medical service supply with regional economic development compared to other regions.
3.3 Kernel density curve estimates
To further investigate the dynamic evolution characteristics of HED, MATLAB software was used to perform the kernel density estimation. The results are shown in Figure 2.
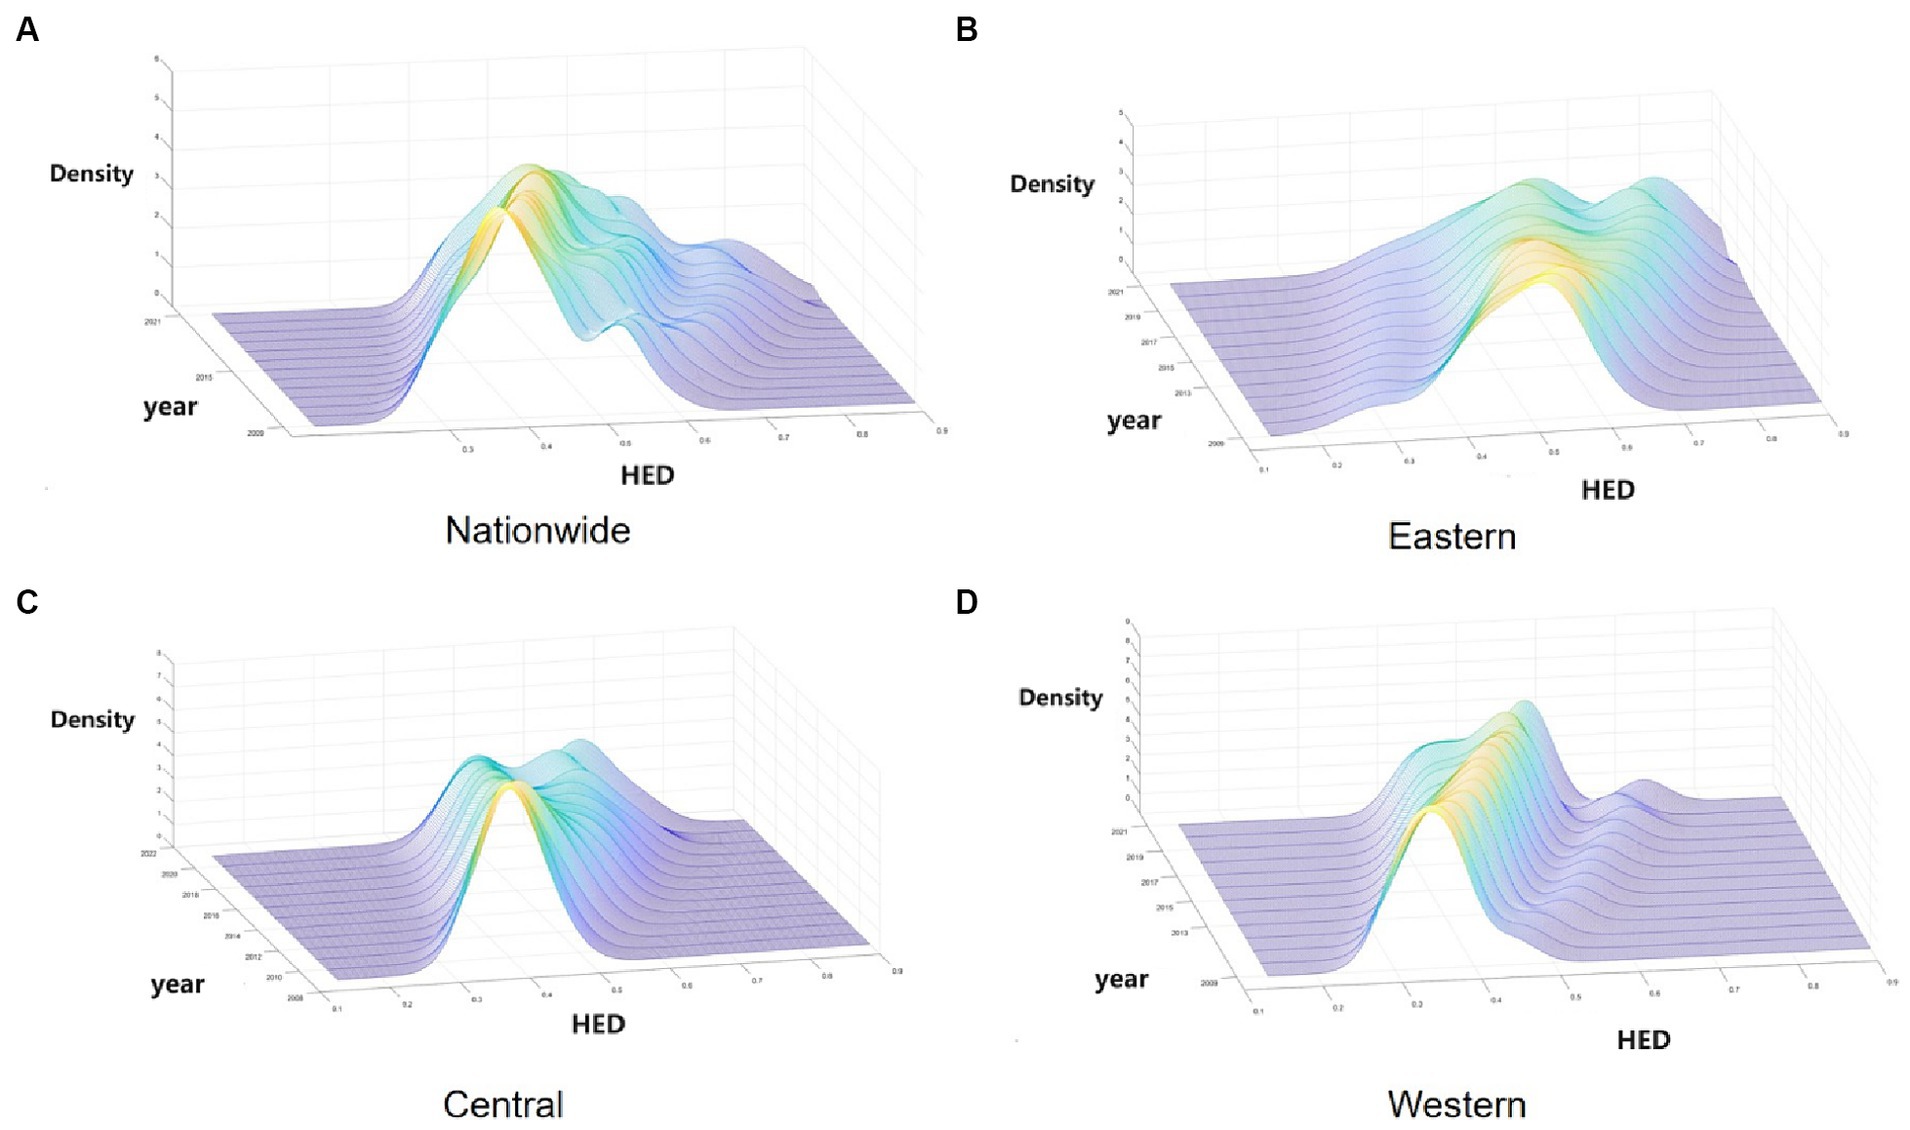
Figure 2. Kernel density estimation of HED in China from 2009 to 2021. (A) Nationwide. (B) Eastern. (C) Central. (D) Western.
As depicted in Figure 2, Figure 2A illustrates the dynamic evolution of China’s HED distribution during the survey period. Initially, the distribution’s center point progressively shifts rightward, indicating an increase in the HED. Subsequently, the distribution curve’s main peak height decreases while its width expands, suggesting a growing disparity between provinces. Thirdly, the countrywide distribution curve exhibits “right-dragging” and ongoing expansion, reflecting a widening gap between higher (e.g., Guangdong, Jiangsu) and lower (e.g., Xinjiang, Ningxia) provinces. Finally, regarding multi-peak pattern distribution, the overall trend is a “one main and two side” multi-peak configuration, indicating a notable gradient effect across China.
Secondly, Figure 2B reveals the dynamic evolution of the HED distribution in the eastern region. Initially, the east’s distribution center shifts rightward, signifying a gradual rise in HED. Subsequently, a decrease in the distribution curve’s main peak height suggests increased regional variation. Finally, from the polarization point of view, the bimodal distribution of kernel density distribution in the eastern region is gradually increasing, indicating its increasing multiploidization trend.
Thirdly, Figure 2C illustrates the dynamic evolution of the HED distribution in the central region. Initially, the curve’s center shifting rightward suggests a gradual increase in the central region’s HED. Subsequently, the continuous decline of the central distribution’s main peak reflects growing variation within the region. Finally, the curve’s evolution from “single-peaked” to a bimodal distribution in the central region indicates emerging multiploidization.
Fourthly, Figure 2D displays the dynamic evolution of the HED distribution in the western region. Initially, the western region’s coupling coordination exhibits a yearly increasing trend. Subsequently, the western region’s main peak is notably higher and narrower compared to other regions, indicating smaller absolute differences between its provinces. Finally, the western region’s shift from a single-peak to a developing double-peak curve indicates a gradual emergence of multiploidization.
Overall, China’s HED shows a rising trend, but due to the differences in the economic development rate of each province and the differences in the supply capacity of health services, the disparity in HED values within different regions is gradually becoming significant, which is manifested in the strengthening of the trend of multipolarity and the increasing of intra-regional disparities within the regions, which will also affect the balanced development of China’s overall HED.
3.4 Spatial pattern evolution of HED
3.4.1 Global spatial pattern
Given the theoretical spatial correlation between health service supply and regional economy, spatial econometric analysis was conducted. Stata17 software calculated global Moran’s I index for 2019–2021, with results displayed in Table 6. Table 6 shows that the global Moran’s I for HED are all positive and at least 10% level of significance, indicating a significant spatial positive correlation for HED. The global Moran’s index for China’s HED increased from 0.15 to 0.252 between 2009 and 2021, indicating an evolving trend from weak to strong spatial dependence and increasingly significant spatial agglomeration in China’s HED. This may be related to China’s successive regional integration policies, such as the Yangtze River Economic Belt, the Yellow River Basin Plan and the Yangtze River Delta Integration, which have facilitated the cross-regional flow of resource factors and strengthened the economic links between regions in China. In addition, China’s high-speed railroad has been developed rapidly since 2009, narrowing the cost of transportation between regions and facilitating the flow of factors between regions (83), which has strengthened the economic and health sector links between regions.
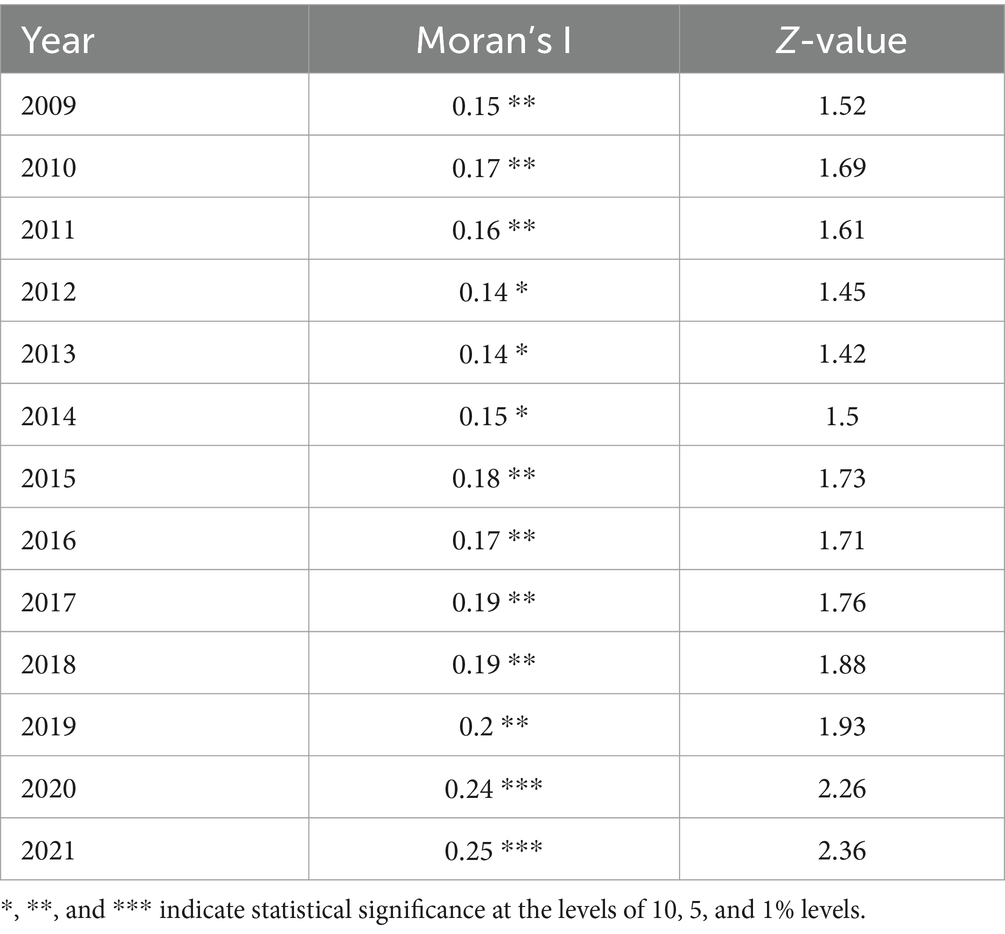
Table 6. Moran’s I for HED from 2009 to 2021.
3.4.2 Local spatial differentiation
LISA maps reflect local spatial connections between a regional unit and its neighbors, exploring spatial agglomeration characteristics of HED in each province, city, and autonomous region. Cross-sectional data from 2009, 2013, 2017, and 2021 were utilized to create LISA maps with ArcGIS software, assessing HED agglomeration and the distribution of hot and cold spots to identify potential spillover effects. The classifications include: High-High, where regions with high coordination are encircled by similar regions; Low-High, where low coordination regions are surrounded by high coordination areas; Low-Low, where low coordination regions are encompassed by others at the same level; and High-Low, where high coordination regions are surrounded by low coordination areas.
1. High-High: Figure 3 reveals two key trends in the HH region from 2009 to 2021: an expanding scope and a southward shift. In 2009, Liaoning and Shandong were HH-type, but by 2013, they lost significance, while Anhui, Hunan, and Fujian emerged as HH, likely influenced by the spatial spillover from adjacent dominant provinces, leading to increased HED in neighboring regions. This increase in HED can be attributed to the spatial spillover effect from neighboring dominant provinces. Overall, provinces in this category are predominantly situated in the eastern coastal region and along the middle and lower Yangtze River Economic Belt, central to China’s economic development. These provinces not only exhibit increasing coordination between health service supply and economic development but also are expected to develop interconnected and mutually beneficial relationships with adjacent provinces and regions.
2. Low-High: In 2009, this category included Tianjin, Anhui, and Jiangxi. By 2021, Anhui shifted from LH to HH, Tianjin became insignificant, and Jiangxi remained LH. This could be attributed to Jiangxi’s regional economy lagging behind neighboring provinces like Jiangsu and Zhejiang, resulting in a greater siphoning effect (88). Additionally, Jiangxi’s weak economic linkages with adjacent provinces (68) mean the siphoning effect outweighs the spillover effect, leading to MHSS and its regional economy trailing behind its neighbors. Anhui Province, on the other hand, due to its active integration into the Yangtze River Delta region, has fully embraced the transfer of industries in the YRD region and the diffusion effect of technology expansion in the field of health, realizing the simultaneous enhancement of the economy and the supply of health services.
3. Low-Low: From 2009 to 2021, the LL-type area predominantly encompassed Xinjiang, Ningxia, and Qinghai, with this pattern persisting throughout the period. These provinces, characterized by complex topography, slower economic growth, limited health service capacity, and fewer connections with eastern dominant regions, less exposed to spatial spillovers from high levels of HED, formed the collapse zone in China’s HED during the study period (89). In addition, this to a certain extent reflects the gap between the HED between China’s regions, the external effect of the cross-regional is not strong, the region has a certain degree of spillover effect, with a higher HED of the region can be driven to a certain extent by the development of neighboring regions, for this reason for the northwestern region, should be considered to create a high HED of the province, driven by the northwestern region of the synergistic development.
4. High-Low: From 2009 to 2013, Sichuan Province was the sole region classified as HL. Provinces in this category benefit from coordinated development in healthcare service capacity and regional economy, relative to their neighbors, and exert a driving influence. Sichuan exited the H-L category in 2017, primarily due to increased coupling and coordination in surrounding provinces and cities, and its move away from the HL.
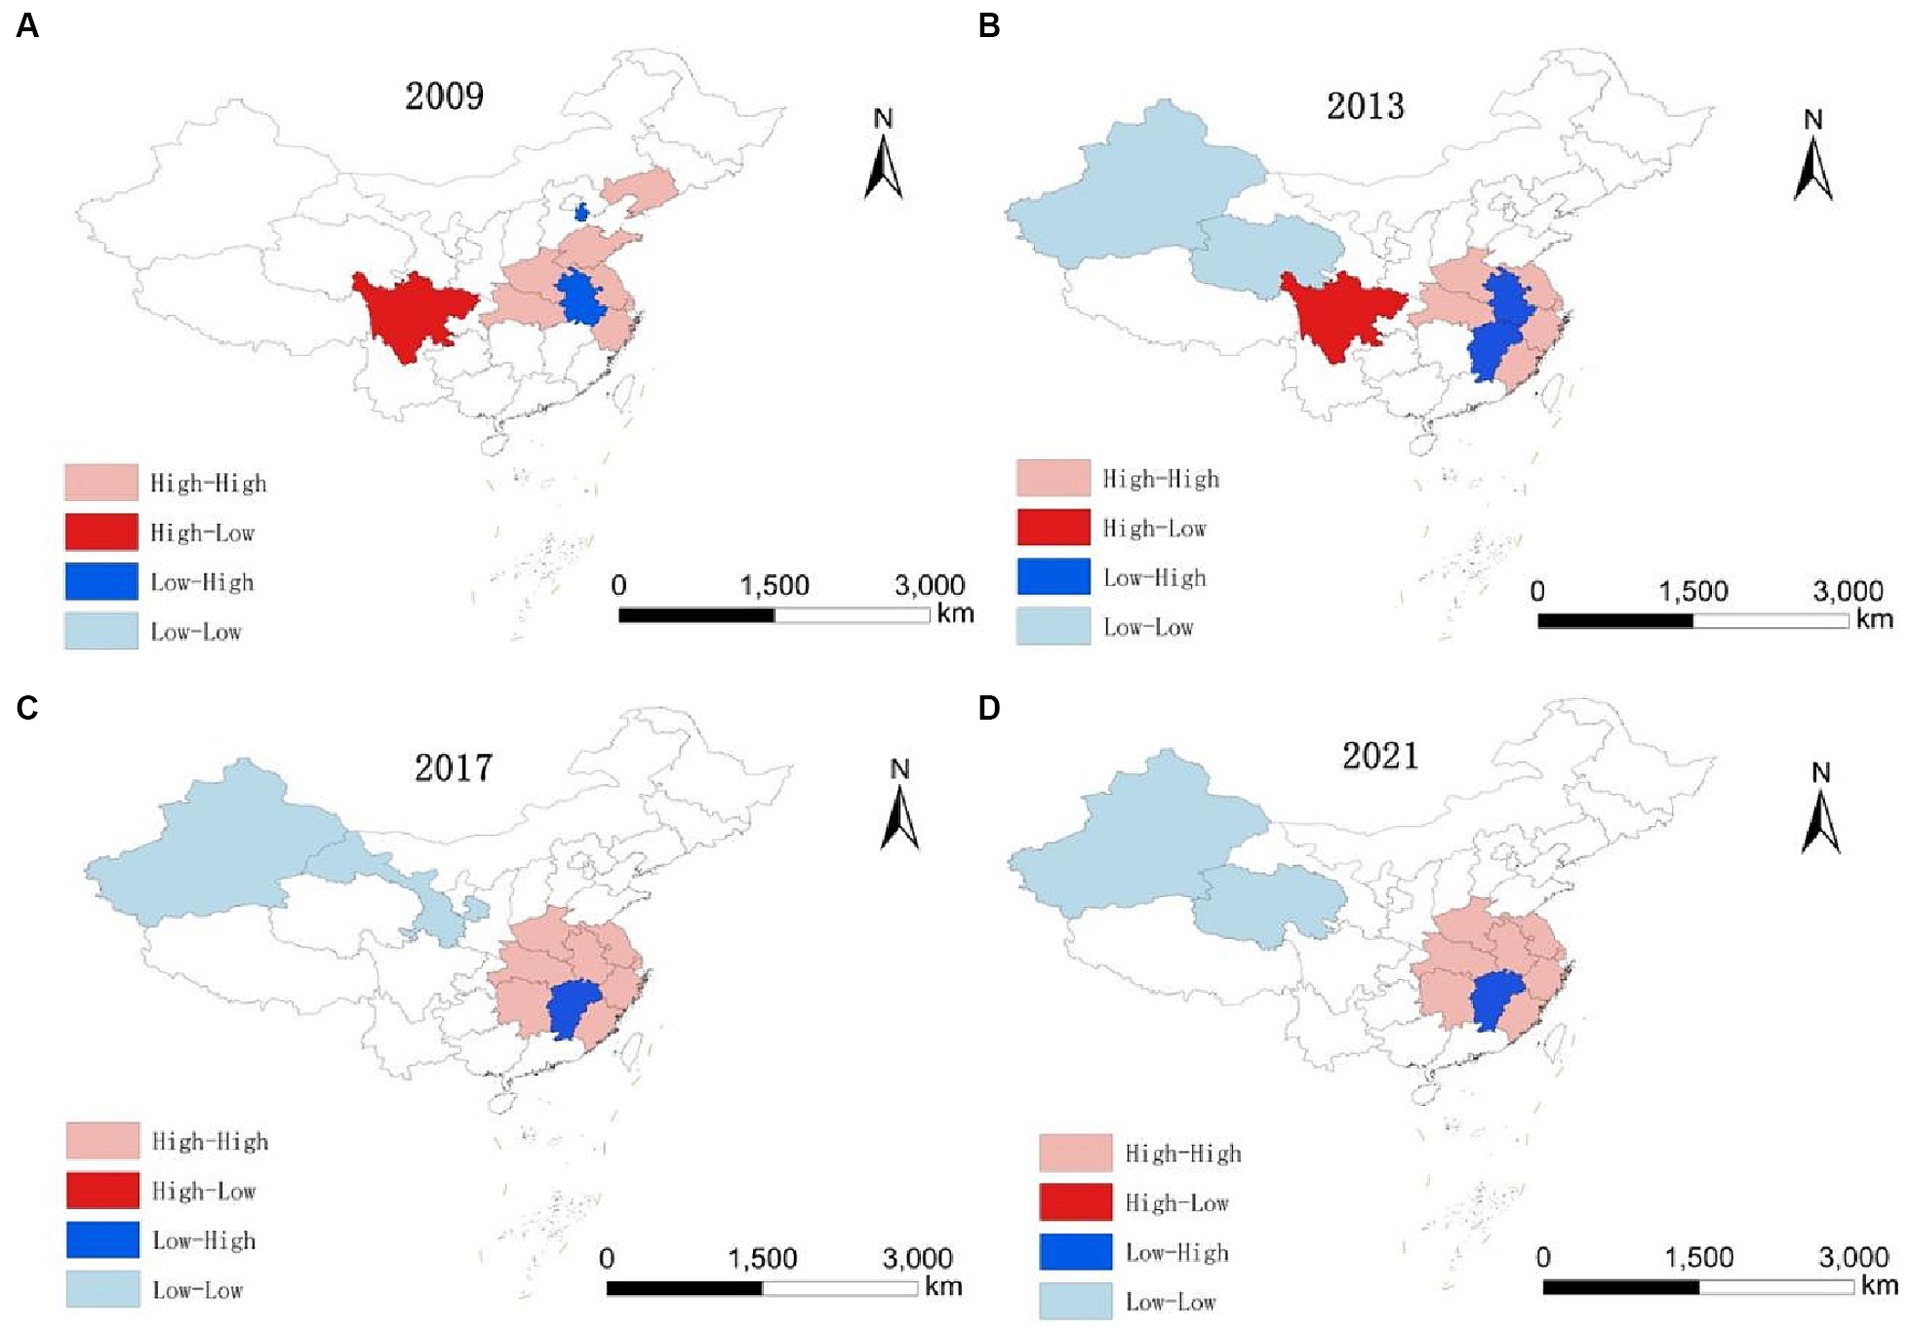
Figure 3. LISA evolution of HED from 2009 to 2021. (A) 2009. (B) 2013. (C) 2017. (D) 2021.
3.5 Convergence characteristics of HED
3.5.1 Absolute β convergence
Given the potential for varied spatial effect patterns in coupling coordination across regions, the LM test is initially applied to ascertain the presence of spatial autocorrelation in the absolute β-convergence of HED nationally and in the three regions, followed by the Hausman test, the LR test, and the Wald test to identify the most suitable spatial modeling approach.
Table 7 presents the absolute β-convergence test outcomes for HED across the nation and its three major regions. Absolute β-convergence is significant both nationally and in all individual regions. Each region’s β is negative, meeting the 1% significance threshold, suggesting a nationwide and regional trend of absolute β convergence in HED. This implies that over time, regions initially lagging in HED will grow faster than their advanced counterparts, eventually leading to uniform HED. Additionally, convergence speeds vary across regions. Nationally, the convergence rate stands at 0.015%, with a convergence period of 448.5816. Regionally, the eastern, central, and western regions exhibit convergence rates of 1.16, 1.88, and 2.09%, respectively. The western region demonstrates a markedly higher convergence rate and shorter period compared to others, whereas the eastern region lags behind the central and western regions in both aspects. This aligns with earlier analyses indicating that the eastern region’s mixed high and low coupling, alongside significant internal disparities, leads to a multipolar trend and slower convergence rate.
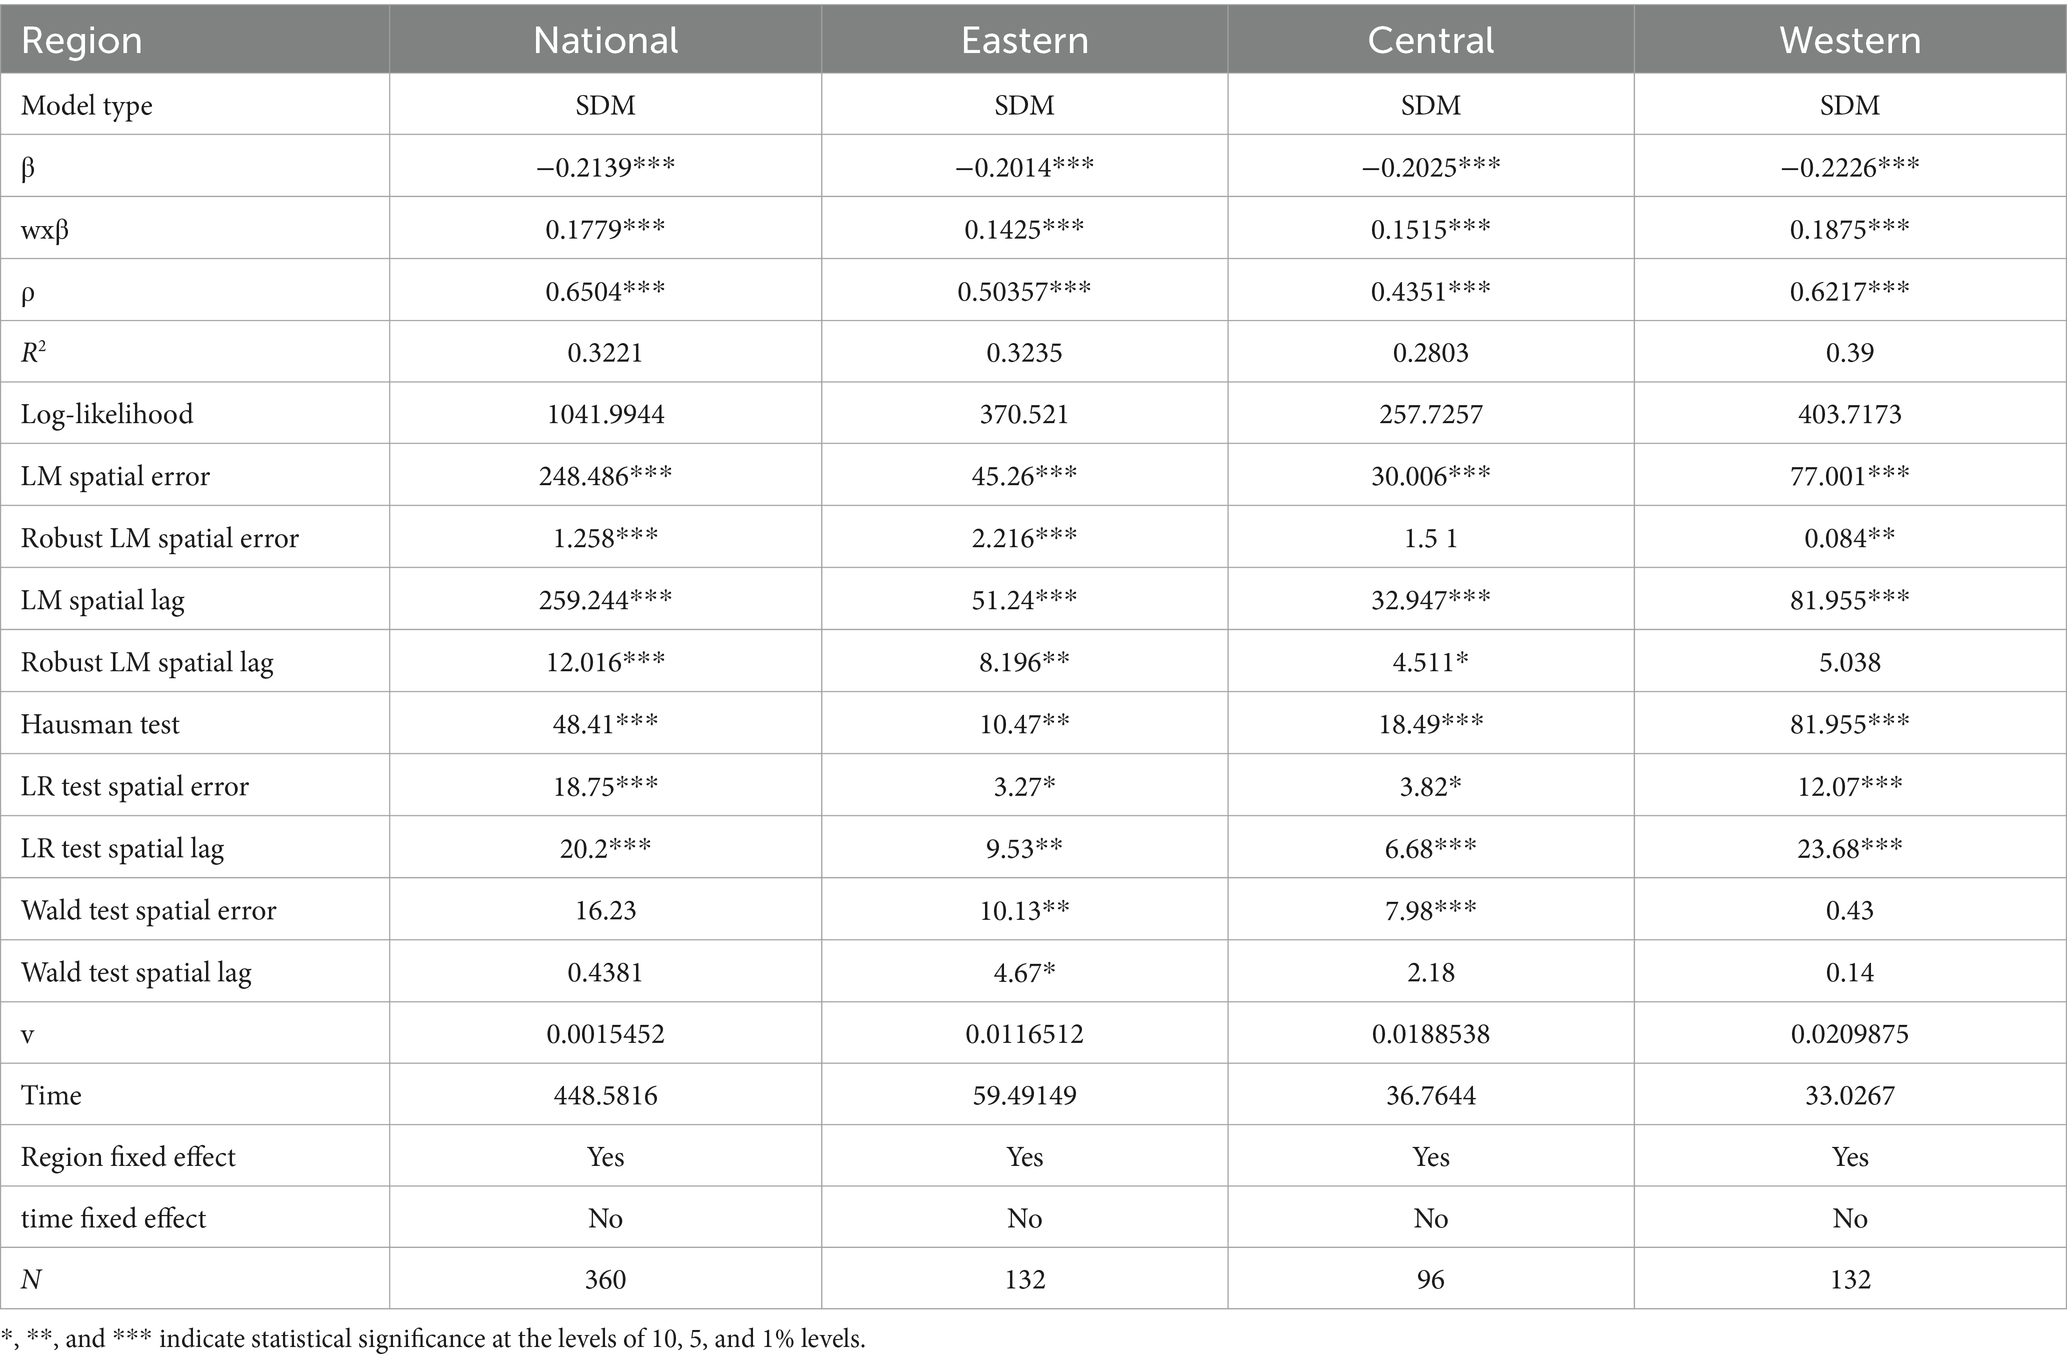
Table 7. Absolute B convergence characteristics of HED in China.
3.5.2 Conditional β convergence
To assess conditional β-convergence in China’s HED, the model incorporates control variables, with results detailed in Table 8. The selection of spatial econometric models for various regions follows the same process as in the absolute β-convergence analysis and is not reiterated here. The results indicate that conditional β-convergence is present in both the national and the three majors regional HEDs. Specifically, the national and regional convergence coefficients β are significantly negative at the 1% confidence level. This suggests that, despite considering external factors like financial self-sufficiency, urbanization, openness, accessibility, and scientific innovation, the HED in these areas continues to converge. Furthermore, the conditional convergence of HED both nationally and regionally exceeds the absolute convergence rate, affirming the scientific validity of the chosen control variables. Lastly, spatial spillover effects are observed nationwide and across all three regions, where enhancements in regional HED positively influence neighboring areas.
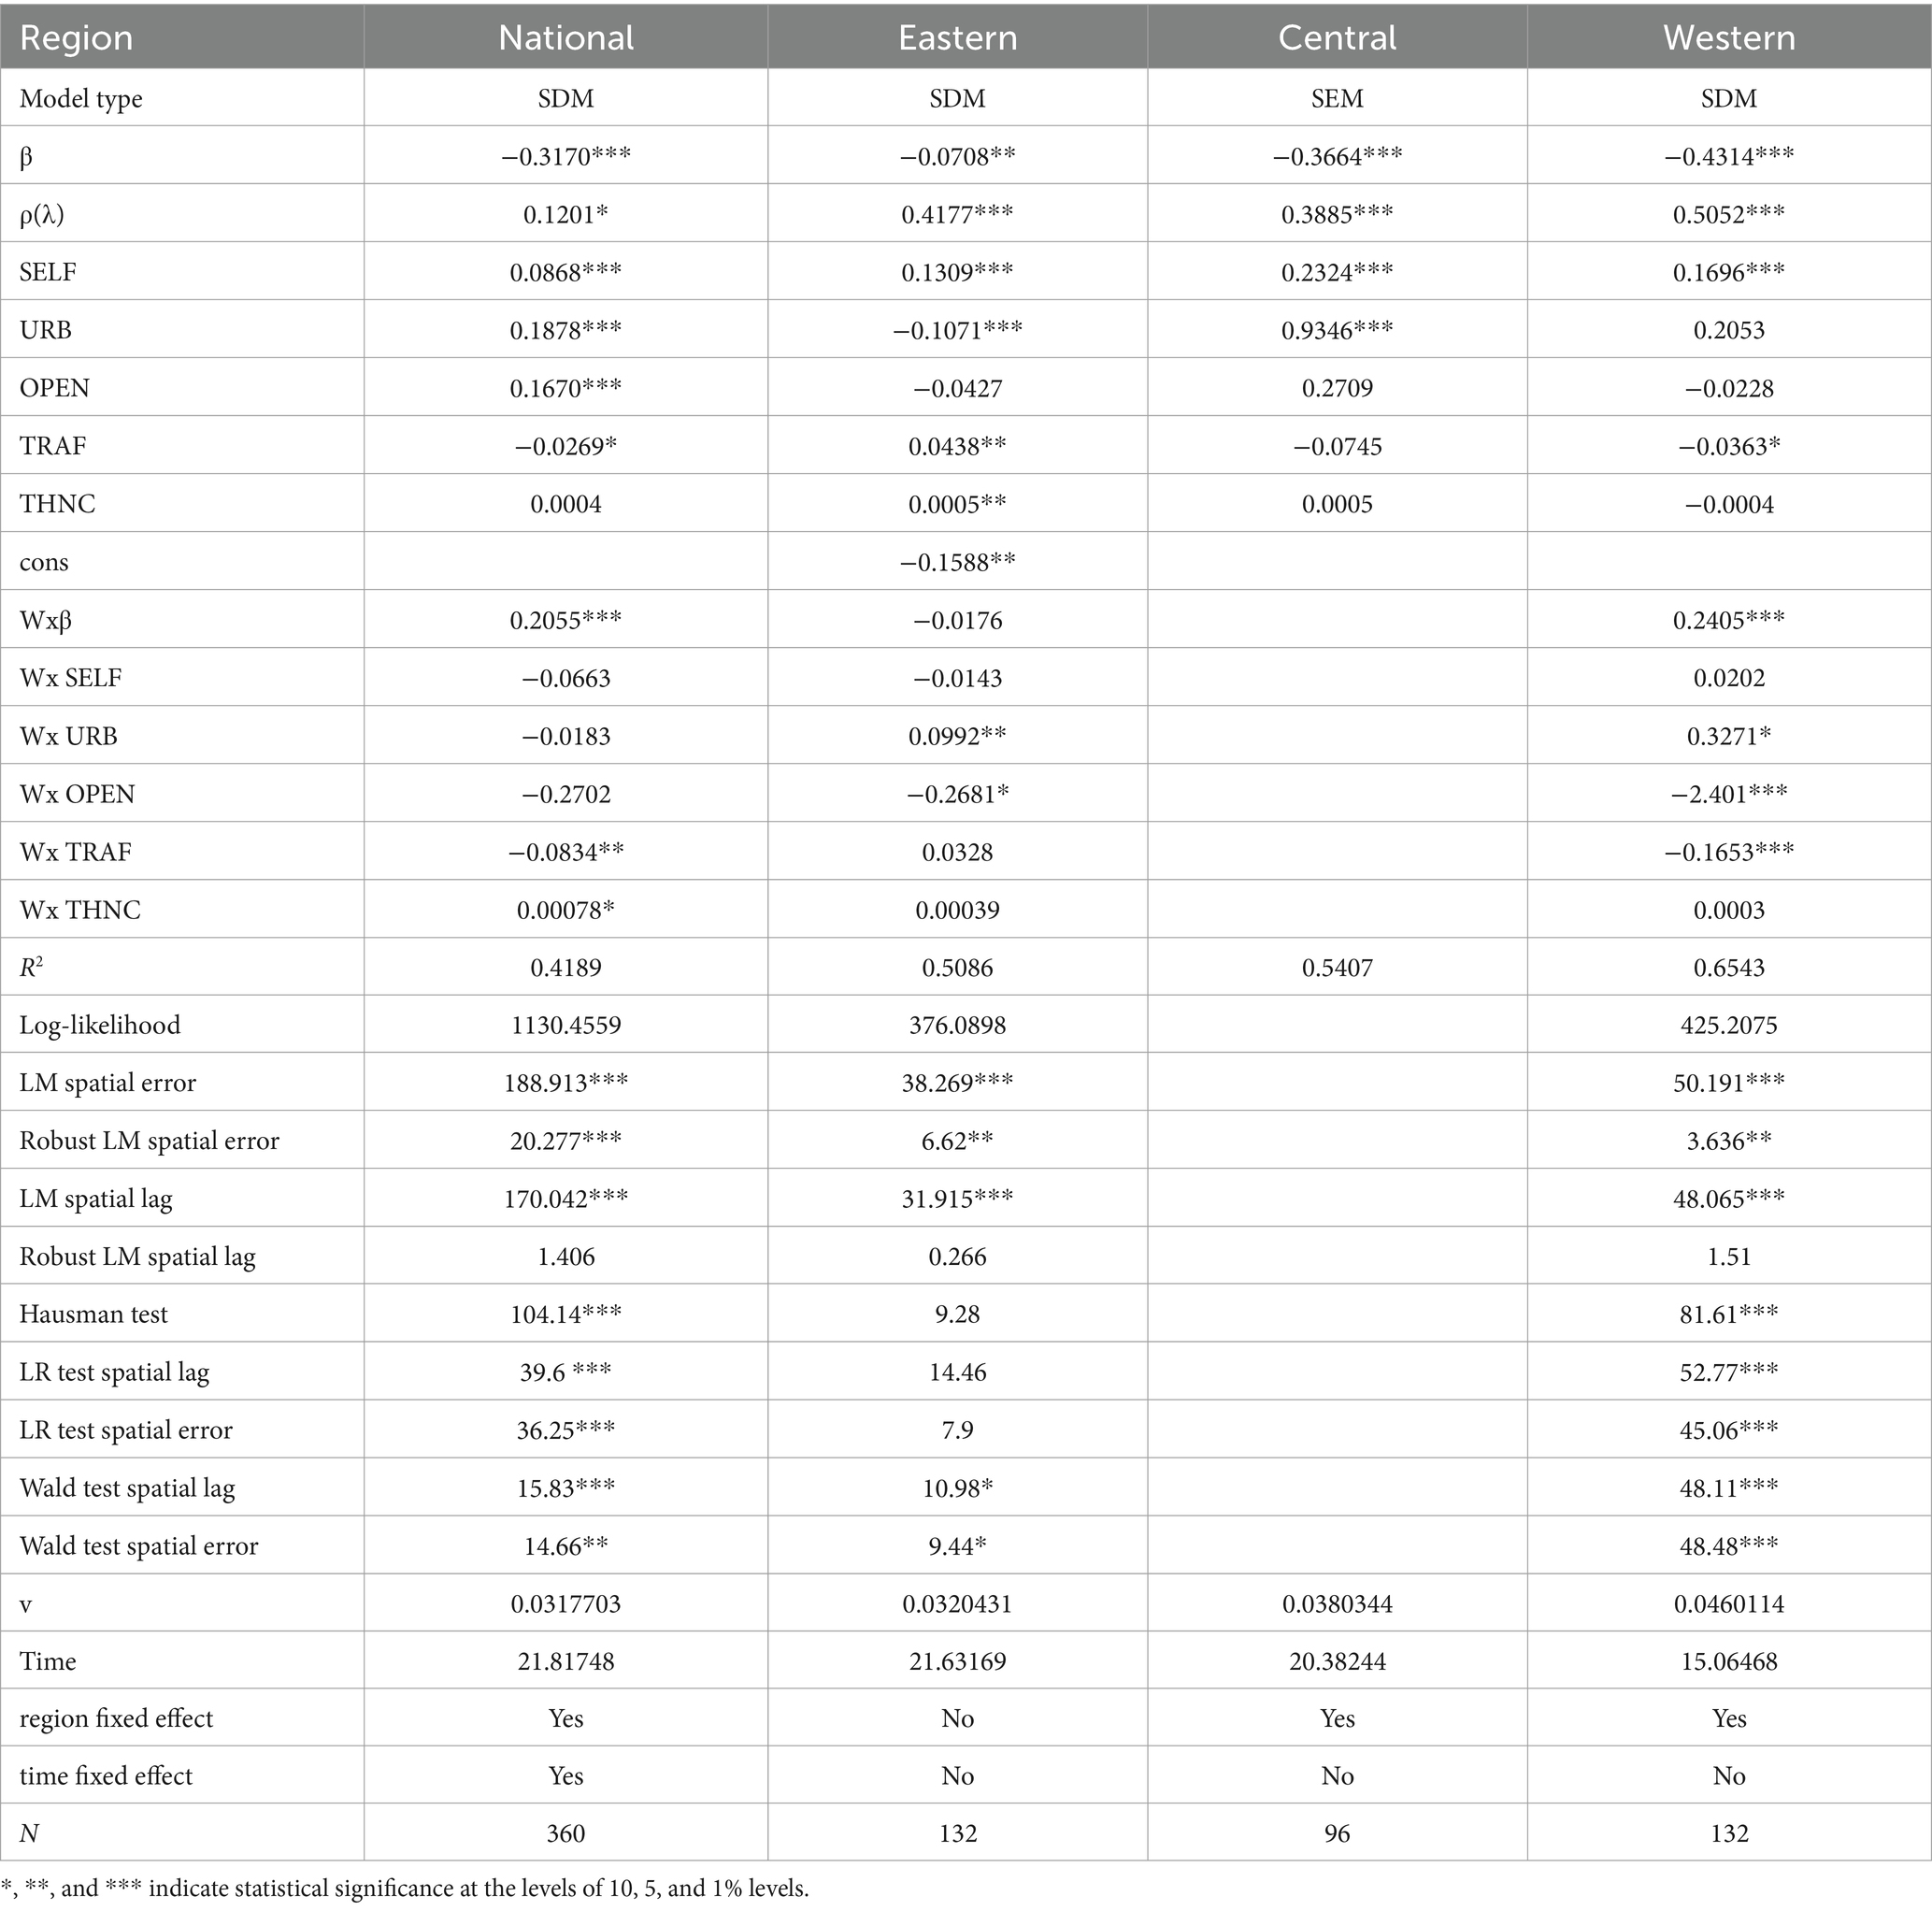
Table 8. Condition B convergence characteristics of HED in China.
In addition, it is important to note that there are significant differences in the factors influencing HED in the country and the three major regions. Conditional β convergence analysis after adding control variables, the financial self-sufficiency rate on the national, eastern, central and western regions HED has a positive effect, and all through the 1% significance level test, which indicates that improving SELF can effectively reduce the regional differences in HED, specifically SELF improvement means that the region’s own economic hematopoietic ability to improve, and is conducive to the promotion of economic growth (90), and at the same time Fiscal revenue is the power source of medical and health service supply, and the improvement of fiscal revenue can directly promote the improvement of medical and health service supply level (91), thus forming the coordinated improvement of health service supply and regional economy; the urbanization rate has a positive impact on HED in the national and central regions, while it has a negative impact on the eastern region, and both passed the 1% significance level test, and it has a positive but not significant impact on the western region. Impact on the western region but not significant. On the one hand, it may be related to the urbanization process of each region, the urbanization rate in the eastern region is significantly higher than the national and other regions, and the continued promotion of urbanization will have a diminishing marginal benefit (92, 93), and on the other hand, the regression coefficient of urbanization is not significant in the western region, which may be due to the limited financial resources of the government of the western region, and the investment in health care in the process of urbanization is relatively small, and it fails to promote the promotion of HED effectively. Promote the improvement of HED. The openness to the outside world has a positive effect on HED at the national level, while the effect on other regions is not obvious, which may be due to the fact that the role of foreign direct investment in economic growth is still significant at the national level, but for the regional level, the promotion effect of foreign direct investment decreases with the increase in the level of economic development of the region (94); the degree of accessibility to transportation has a negative effect on the whole country and the western region, while it has a positive effect on the eastern region. Transportation accessibility has a negative promotion effect on the national and the western regions, while it has a positive effect on the eastern regions, and is not significant for the central region, which may be due to the improvement of transportation conditions, the siphoning effect of the advantaged region on the disadvantaged region is strengthened, which results in the tendency of the disadvantaged region to converge to the advantaged region has been weakened; scientific and technological innovation significantly benefits only the eastern region. This is likely due to the concentration of capital, talent, top universities, and innovation-focused companies in this region, boosting both its economy and health system (95).
4 Conclusions and suggestions
4.1 Conclusion
Current research on health service provision and regional economy primarily examines their interrelated systemic association. Secondly, Studies on spatial correlation usually use Moran’s index, but there are fewer studies on the dynamic evolution mechanism and spatial convergence of system coordination. Consequently, this paper develops a coupled coordination model linking health service supply with the regional economy. This model utilizes nonparametric kernel density and spatial econometric analysis methods to investigate the dynamic evolution and spatial convergence of this coordination. The study leads to the following conclusions:
1. In terms of the process of temporal and spatial changes in the degree of coupling coordination, firstly, the degree of coupling coordination between China’s medical and health service supply and the level of economic development has shown a good and steady upward trend during the study period. The main grade types of the coupling coordination level of each province in China have experienced a transition from being on the verge of being uncoordinated to being basically coordinated, which implies that the degree of coupling coordination between the systems is developing in a good direction. Second, there are obvious regional differences in the degree of coupling and coordination between China’s health and economic systems, showing a gradient distribution pattern of “high in the east and low in the west.” In terms of regional distribution, the eastern region has the best degree of coupling, followed by the central region, and the western region has the worst.
2. In terms of dynamic evolution, the kernel density estimation shows, first, that the centroids of the national and the three overall curves gradually shifted to the right during the study period, indicating that the degree of coupling is increasing in both the national and the three main regions; second, that the peaks are decreasing and the bandwidths are increasing, indicating an increase in the degree of variation within regions; and third, that multipolarity is occurring in all regions, suggesting that the degree of coordination of coupling within the regions is showing a gradient of differentiation.
3. In terms of spatial effects, firstly, the value of the Moran’s I index of HED in China is greater than zero in all years during the study period, indicating that the two systems have obvious spatial spillover effects on the coupling. Second, the LISA analysis shows that the distribution is characterized by “H-H” and “L-L” clustering, with H-H clustering mainly in the middle and lower reaches of the Yangtze River and L-L clustering mainly in the inland provinces of northwest China, such as Qinghai and Xinjiang. In addition, during the study period, China’s high-coupling-coordination regions showed a significant southward shift, while the low-coupling regions showed a northwestward shift.
4. From the perspective of absolute β-convergence, firstly, there is a significant β-convergence characteristic for the whole country and the regions during the study period without considering the influence of the external environment. From the perspective of absolute β-convergence, the degree of coupling coordination in the whole country and the three major regions showed β-convergence characteristics after considering economic and social factors. In addition, factors such as financial self-sufficiency rate, urbanization rate, degree of opening up to the outside world, degree of transportation convenience, and level of scientific and technological innovation have different performances in terms of their influence on the convergence of the whole country and the three major regions, and only the financial autonomy rate has a positive influence in all ranges.
4.2 Suggestions
Health service supply and regional economic development have a relationship of mutual influence and constraints, and the status of coupled and coordinated development is an important criterion for measuring the level of sustainable development of the two. Based on the discussion and analysis of HED in the east, middle and west of China, the following recommendations are given to promote the long-term coordinated development of the level of health services and regional economy.
1. Transform the economic development model to support new industries and promote sustainable regional economic growth. The regional economy forms the material foundation for health service provision levels. Over the past decade, China’s local economies have relied heavily on fixed asset investment, with many local governments depending largely on land transfer fees as their primary income source. However, with China’s real estate market in recession, this land finance model is increasingly unsustainable, significantly impacting local economies (96). Consequently, the Chinese government should offer policy support nationwide, encouraging gradual industrial restructuring, enhanced science and technology investment, and fostering local economic transformation and development. Local governments can further aid this transformation by supporting new industries with tax incentives, financial subsidies, and similar policies, thus spurring economic growth and establishing a robust economic base for health service supply. Additionally, local governments should manage their expenditures, curtail fixed asset investment, and enhance their financial self-sufficiency to mitigate regional disparities in HED.
2. Enhance the financial security mechanism and boost financial support for health service supply in underprivileged areas. A spatial imbalance exists between China’s fiscal revenues and health resource allocation, characterized by higher levels in the east and lower in the west. Consequently, the Chinese government should holistically evaluate each region’s economy, health service supply levels, and residents’ healthcare demands to appropriately adjust the financial distribution mechanism, fortifying financial subsidies for medical and healthcare in less developed areas (92), thereby gradually reducing regional disparities and enhancing local health service levels.
3. Bolster inter-regional exchange and collaboration to establish a synergistic development mechanism. Significant spatial β-convergence is evident in China’s HMED, along with notable spatial performance effects across all regions. Consequently, the development of economic and healthcare policies should fully consider the spatial interconnections of regions, guiding various forms of exchanges and cooperation between the economically stronger eastern provinces and the central and western regions, thereby creating an effective inter-regional transmission mechanism (97), and promoting coordinated inter-regional development through resource exchange and sharing. Additionally, such exchanges and cooperation can enable the less developed central and western regions to learn from the eastern region’s management and development practices, further improving economic and health service efficiencies in these areas.
5 Limitations
Owing to data collection constraints, this study analyzed only provincial-level macro data in China, without examining the relationship between health service provision and regional economic coupling and coordination at the municipal (county) level. Future research will incorporate municipal (county-level) data. This approach will allow for a more detailed understanding of the variations in coupled coordination across different levels in China.
Data availability statement
The original contributions presented in the study are included in the article/Supplementary material, further inquiries can be directed to the corresponding author.
Author contributions
JD: Writing – review & editing, Writing – original draft. QS: Writing – original draft, Data curation. HL: Writing – review & editing, Conceptualization. ZJ: Writing – review & editing, Conceptualization, Data curation. CG: Writing – review & editing, Data curation. DL: Writing – review & editing, Funding acquisition.
Funding
The author(s) declare financial support was received for the research, authorship, and/or publication of this article. This research was funded by the project of 2022 Anhui Province University Cooperation and Innovation Project, “Anhui Traditional Chinese Medicine Data Integration and Governance Research” (Project No: GXXT-2022-095); Anhui Province University Research Project “Anhui Province Compact County Medical Community Chronic Disease Health Management Service Capacity Evaluation and Path Innovation” (Project No: 2023AH050717).
Conflict of interest
The authors declare that the research was conducted in the absence of any commercial or financial relationships that could be construed as a potential conflict of interest.
Publisher’s note
All claims expressed in this article are solely those of the authors and do not necessarily represent those of their affiliated organizations, or those of the publisher, the editors and the reviewers. Any product that may be evaluated in this article, or claim that may be made by its manufacturer, is not guaranteed or endorsed by the publisher.
Supplementary material
The Supplementary material for this article can be found online at: https://www.frontiersin.org/articles/10.3389/fpubh.2024.1352141/full#supplementary-material
References
1. Mai, QS, Bai, MT, and Li, L. Study on the dynamic evolution and regional differences of the level of high-quality economic and social development in China. Sustainability. (2023) 15:382. doi: 10.3390/su15010382
2. Li, JX, Xu, MZ, Liu, TF, and Zhang, C. Regional differences, dynamic evolution and convergence of public health level in China. Healthcare. (2023) 11:1459. doi: 10.3390/healthcare11101459
3. China GOotSCo. (2022). The National Health Plan for the 14th five year plan. Available at: http://wwwgovcn/zhengce/content/2022-05/20/content_5691424htm (Accessed May 20, 2022).
4. Tong, SJ, Sun, YH, and Huang, JC. Impact of economic development level on the supply level of basic public services and countermeasures: an empirical analysis based on 26 mountainous counties in Zhejiang Province. J Zhejiang Shuren Univ. (2023) 23:37–46. doi: 10.3969/j.issn.1671-2714.2023.05.005
5. Xiaoyun, Z, and Chuan, H. Does the intensity of fiscal input improve the supply of medical and health services. Contemp Financ Econ. (2021) 11:28–40. doi: 10.13676/j.cnki.cn36-1030/f.2021.11.004
6. Jiali, Y, and Shangguang, Y. Regional differences and influencing factors of China’s medical and health resource supply level. Stat Decis. (2021) 37:69–72. doi: 10.13546/j.cnki.tjyjc.2021.06.015
7. Wang, JY, and Li, TR. The impact of population change on the transformation of economic development mode in OECD countries. China Popul Sci. (2018) 6:126.
8. Mayer, D. The long-term impact of health on economic growth in Latin America. World Dev. (2001) 29:1025–33. doi: 10.1016/s0305-750x(01)00026-2
9. Chunyuan, W. An empirical analysis of the relationship between fiscal expenditure structure and economic growth in china. J. Financ. Econ. (2009) 35:120–30. doi: 10.16538/j.cnki.jfe.2009.06.005
10. Tran, L. An interactive method to select a set of sustainable urban development indicators. Ecol Indic. (2016) 61:418–27. doi: 10.1016/j.ecolind.2015.09.043
11. Wei, W, Jin, CG, Han, Y, Huang, ZH, Niu, T, and Li, JK. The coordinated development and regulation research on public health, ecological environment and economic development: evidence from the Yellow River Basin of China. Int J Environ Res Public Health. (2022) 19:6927. doi: 10.3390/ijerph19116927
12. Pan, HW, Zou, LA, Zhang, YN, Yao, YT, Ma, C, Yang, FY, et al. Research on the coupling coordination of medical service capacity of public hospitals and economic level in Guang-dong. Chinese. Health Econ. (2023) 42:60–5.
13. Zhang, Y, Khan, SU, Swallow, B, Liu, W, and Zhao, M. Coupling coordination analysis of China’s water resources utilization efficiency and economic development level. J Clean Prod. 373:133874. doi: 10.1016/j.jclepro.2022.133874
14. Liu, BB, Guo, JL, Yin, SS, Li, XX, Zeng, JJ, and Wang, HH. Analysis of the coupled coordination of medical and health services and economy in China’s provincial areas. Chin Health Resour. (2023) 26:50–56+60. doi: 10.13688/j.cnki.chr.2023.220929
15. Zhou, MJ, Zhang, KS, and Zhu, JM. Spatial and temporal differentiation and coupled coordination of medical services and economic development in the Yangtze River Delta. J Inner Mong Norm Univ. (2023) 52:42–8. doi: 10.3969/j.issn.1001-8735.2023.01.007
16. Mad, D, Han, XX, Jin, D, Cai, WQ, Jing, Q, Sheng, HQ, et al. Evaluation of the coupling degree between primary health care service capacity and regional economy in Shandong Province. Chin Health Resour. (2022) 25:363–6. doi: 10.13688/j.cnki.chr.2022.210776
17. Chi, Y, Wang, YH, and Fang, N. Spatio-temporal pattern of rural basic public services and county economy in poverty-strickencontiguous destitute areas of China. Geogr Res. (2016) 35:1243–58. doi: 10.11821/dlyj201607003
18. Tang, H, Chen, Y, Ao, RJ, Shen, X, and Shi, GN. Spatial-temporal characteristics and driving factors of the coupling coordination between population health and economic development in China. Sustainability. (2022) 14:10513. doi: 10.3390/su141710513
19. Li, LQ, Yang, SL, Yang, W, and Wang, Y. Empirical research on spatial-temporal evolution rules and influencing factors of coupling and coordinated development of medical resource allocation and economy in six provinces of Central China. Chin Health Econ. (2023) 42:30–5.
20. Gong, C, Liu, CY, Zhang, MJ, and Wan, Q. Spatial pattern and evolution trend analysis of health resource allocation and regional economic SynergistiDevelopment based on coupling coordination theory. Chin Health Econ. (2022) 41:40–5.
21. Qi, Z, Li, QL, Huang, Q, and Wu, TY. Evaluation of supply and demand balance and spatial spillover effect of age-friendly environment. Sustainability. (2023) 15:11810. doi: 10.3390/su151511810
22. Council TS. Outline of the “healthy China 2030” Plan International Business News (2016). Available at: https://www.gov.cn/zhengce/2016-10/25/content_5124174.htm (Accessed October 25, 2016).
23. Pallikadavath, S, Singh, A, Ogollah, R, Dean, T, and Stones, W. Human resource inequalities at the base of India’s public health care system. Health Place. (2013) 23:26–32. doi: 10.1016/j.healthplace.2013.05.003
24. Mollahaliloglu, S, Yardim, M, Telatar, TG, and Uner, S. Change in the geographic distribution of human resources for health in Turkey, 2002–2016. Rural Remote Health. (2021) 21:6478. doi: 10.22605/rrh6478
25. Qiu, LJ, Yang, LS, Li, HR, and Wang, L. The impact of health resource enhancement and its spatiotemporal relationship with population health. Front Public Health. (2023) 10:1043184. doi: 10.3389/fpubh.2022.1043184
26. Pu, LD. Fairness of the distribution of public medical and health resources. Front Public Health. (2021) 9:768728. doi: 10.3389/fpubh.2021.768728
27. Wang, SM, and Tao, QS. Analysis of the efficiency of China’s medical service resources under the background of hierarchical medical policy. Iran J Public Health. (2021) 50:1613–23.
28. Hernández, AR, and Sebastián, MS. Assessing the technical efficiency of health posts in rural Guatemala: a data envelopment analysis. Glob Health Action. (2014) 7:1–9. doi: 10.3402/gha.v7.23190
29. Rodrigues, NCP, Monteiro, DLM, de Almeida, AS, Barros, MBD, Neto, AP, O’Dwyer, G, et al. Temporal and spatial evolution of maternal and neonatal mortality rates in Brazil, 1997–2012. J Pediatr. (2016) 92:567–73. doi: 10.1016/j.jped.2016.03.004
30. Zheng, JY, Zhang, N, Shen, GQ, Liang, FC, Zhao, Y, He, XC, et al. Spatiotemporal and seasonal trends of class A and B notifiable infectious diseases in China: retrospective analysis. JMIR Public Health Surveill. (2023) 9:e42820. doi: 10.2196/42820
31. Chen, BQ, and Jin, FL. Spatial distribution, regional differences, and dynamic evolution of the medical and health services supply in China. Front Public Health. (2022) 10:1020402. doi: 10.3389/fpubh.2022.1020402
32. Hong, WL, and Fang, GS. A analysis on descending trend of maternal mortality ratio and its related influencing factors. J Chin J Perinat Med. (2004) 1, 3–7.
33. Zhan, DS, and Zhang, X. Spatial econometric analysis of Chinese medicine service utilization and its influencing factors in China. Chin Hosp Adm. (2022) 42:33–6.
34. He, YT, Zhang, YC, Wu, RK, Huang, W, Wang, RN, He, LX, et al. Dynamic evolution and spatial difference of public health service supply in economically developed provinces of China: typical evidence from Guangdong Province. BMC Health Serv Res. (2024) 24:23. doi: 10.1186/s12913-023-10444-4
35. Xie, K, Ding, MJ, Zhang, JR, and Chen, LW. Trends towards coordination between grain production and economic development in China. Agriculture. (2021) 11:975. doi: 10.3390/agriculture11100975
36. Yang, M, Jiao, MY, and Zhang, JY. Coupling coordination and interactive response analysis of ecological environment and urban resilience in the Yangtze River Economic Belt. Int J Environ Res Public Health. (2022) 19:11988. doi: 10.3390/ijerph191911988
37. Zhao, M, Liu, R, and Dai, DB. Synergistic effect between China’s digital transformation and economic development: a study based on sustainable development. Sustainability. (2021) 13:13773. doi: 10.3390/su132413773
38. Xu, LT, and Chen, SS. Coupling coordination degree between social-economic development and water environment: a case study of Taihu lake basin, China. Ecol Indic. (2023) 148:110118. doi: 10.1016/j.ecolind.2023.110118
39. Chen, KJ, Tian, GL, Tian, Z, Ren, YJ, and Liang, W. Evaluation of the coupled and coordinated relationship between agricultural Modernization and regional economic development under the rural revitalization strategy. Agronomy. (2022) 12:990. doi: 10.3390/agronomy12050990
40. Yang, J. Economic synergistic development of Guangdong-Hong Kong-Macao Greater Bay Area urban agglomeration: based on composite system. Comput Intell Neurosci. (2022) 2022:1–10. doi: 10.1155/2022/7677188
41. Ma, Y, Shang, M, Yang, F, and Li, CG. Exploration of the role of human Capital in China’s high-quality economic development and analysis of its spatial characteristics. Sustainability. (2023) 15:3900. doi: 10.3390/su15053900
42. Bing, L, and Jiagi, W. Coordinated driving path of institutional elderly care resource allocation and socioeconomic. J Hunan Agric Univ. (2023) 24:68–75. doi: 10.13331/j.cnki.jhau(ss).2023.02.008
43. Statistics NHCo. China health yearbook China Statistics Press. Beijing, China, 2009–2021. (2009–2022).
44. Statistics DoUSoNBo. China statistical yearbook. Beijing China: China Health and Wellness Yearbook Press (2009–2022).
45. Statistics CSOPaES. China labor statistics yearbook. Beijing, China: China Health and Wellness Yearbook Press (2009–2022).
46. Li, YF, Li, Y, Zhou, Y, Shi, YL, and Zhu, XD. Investigation of a coupling model of coordination between urbanization and the environment. J Environ Manag. (2012) 98:127–33. doi: 10.1016/j.jenvman.2011.12.025
47. Sui, GH, Wang, HX, Cai, SY, and Cui, WD. Coupling coordination analysis of resources, economy, and ecology in the Yellow River Basin. Ecol Indic. (2023) 156:111133. doi: 10.1016/j.ecolind.2023.111133
48. Le, W, Xie, JY, Liu, QW, and Guo, BH. Research on the relevance and coupling effect of new energy vehicle industrial policy. J Manag. (2022) 35:65–81. doi: 10.19808/j.cnki.41-1408/F.2022.0048
49. Huang, W, and Li, J. The coupling relationship between urbanization and carbon emissions from land use in Ningxia. Front Environ Sci. (2022) 10:927798. doi: 10.3389/fenvs.2022.927798
50. Tang, Z. An integrated approach to evaluating the coupling coordination between tourism and the environment. Tour Manag. (2015) 46:11–9. doi: 10.1016/j.tourman.2014.06.001
51. Yin, JF, Shi, PJ, Feng, HY, Tong, HL, and Chao, M. Dynamic evolution and influencing factors of coupling coordination between innovation environment and transformation development of resource-based cities in Gansu province, China. Front Environ Sci. (2022) 10:990238. doi: 10.3389/fenvs.2022.990238
52. Guo, XJ, Li, JQ, Ma, YJ, Chen, XP, and Li, Y. Study on the coupling and coordination between urban resilience and low-carbon development of central plains urban agglomeration. Sustainability. (2023) 15. doi: 10.3390/su152416748
53. Tian, L, Sun, FZ, Zhang, ZB, and Zhang, SX. Coupling coordination and driving mechanism of tourism industry, urbanization, and ecological environment: a case study of Shandong, China. Environ Dev Sustain. (2023) 18:1–22. doi: 10.1007/s10668-023-03815-8
54. Yang, SX, Xu, JF, and Yang, RY. Research on coordination and driving factors of sports industry and regional sustainable development-empirical research based on panel data of provinces and cities in eastern China. Sustainability. (2020) 12:813. doi: 10.3390/su12030813
55. Peng, BH, Sheng, X, and Wei, G. Does environmental protection promote economic development? From the perspective of coupling coordination between environmental protection and economic development. Environ Sci Pollut Res. (2020) 27:39135–48. doi: 10.1007/s11356-020-09871-1
56. Zhang, Y, Zhang, HY, and Hao, F. Spatiotemporal evolution of investment-carbon emission coupling coordination in China’s electricity market. Front Energy Res. (2023) 10:946451. doi: 10.3389/fenrg.2022.946451
57. Chongbin, L. Quantitaitve judgement and classification system for coordinated development ofenvironment amd economy--A case study of the City Group in the Pearl River Delta. Trop Geogr. (1999) 2:76–82. doi: 10.13284/j.cnki.rddl.000443
58. Chen, JX, Gao, XS, Zhang, YY, Penttinen, P, Wang, Q, Ling, J, et al. Analysis on coupling coordination degree for cropland and livestock from 2000 to 2020 in China. Agriculture. (2023) 13:1304. doi: 10.3390/agriculture13071304
59. Shi, X. Selection of bandwidth type and adjustment side in kernel density estimation over inhomogeneous backgrounds. Int J Geogr Inf Sci. (2010) 24:643–60. doi: 10.1080/13658810902950625
60. Li Hua, D, and Yan, L. Measuring the equalization of basic public services and the evolution of trends in China--a study based on the dimension of high-quality development. China Soft Sci. (2020) 10:74–84.
61. Zha, QF, Liu, Z, Song, ZH, and Wang, J. A study on dynamic evolution, regional differences and convergence of high-quality economic development in urban agglomerations: a case study of three major urban agglomerations in the Yangtze river economic belt. Front Environ Sci. (2022) 10:1012304. doi: 10.3389/fenvs.2022.1012304
62. Goli, S, Moradhvaj, CS, and Rammohan, A. World health status 1950–2015: converging or diverging. PLoS One. (2019) 14:e0213139. doi: 10.1371/journal.pone.0213139
63. Wang, ZB, Lin, TR, Xing, XY, Cai, BS, and Chen, Y. Dynamic distribution, regional differences and convergence of health workforce allocation in township health centers in China. Heliyon. (2024) 10:e23857. doi: 10.1016/j.heliyon.2023.e23857
64. Nag, A, Privara, A, Gavurova, B, and Pradhan, J. Does club convergence matter in health outcomes? Evidence from Indian states. BMC Public Health. (2023) 23:2154. doi: 10.1186/s12889-023-16972-2
65. Peng, SF, and Wu, XB. Study on coordination between water resources carrying capacity and high-quality development of agriculture in China. Yangtze River. (2023) 54:52–9. doi: 10.16232/j.cnki.1001-4179.2023.10.008
66. Fan, C, and Myint, S. A comparison of spatial autocorrelation indices and landscape metrics in measuring urban landscape fragmentation. Landsc Urban Plan. (2014) 121:117–28. doi: 10.1016/j.landurbplan.2013.10.002
67. Li, WY, Tao, LX, and Wen, CH. Study on function evolution and coupling coordination degree of “three lives space” in the upper reaches of Yangtze River in China. Environ Sci Pollut Res. (2024) 31:13026–45. doi: 10.1007/s11356-024-31956-4
68. Zhang, RT, and Lu, JF. Spatial-temporal pattern and convergence characteristics of provincial urban land use efficiency under environmental constraints in China. Int J Environ Res Public Health. (2022) 19:10729. doi: 10.3390/ijerph191710729
69. de Campos, AC, Lopes, L, and Carreira, C. Spatial autocorrelation of exports and R&D expenditures in Portugal. J Knowl Econ. (2023). doi: 10.1007/s13132-023-01425-3
70. Anselin, L. Local indicators of spatial association—LISA. Geogr Anal. (1995) 27:93–115. doi: 10.1111/j.1538-4632.1995.tb00338.x
71. Meng, B, Wang, JF, Zhang, WZ, and Liu, XH. Evaluation of regional disparity in China based on spatial analysis. Sci Geogr Sin. (2005) 25:11–8. doi: 10.13249/j.cnki.sgs.2005.04.393
73. Chen, MH, Zhang, TW, Chu, QR, Xie, LX, Liu, JX, Tansuchat, R, et al. Convergence analysis of inclusive green growth in China based on the spatial correlation network. Sustainability. (2023) 15. doi: 10.3390/su151612344
74. Cai, XL, and Pang, ZQ. Measurement and spatial convergence of Chinese modernization of rurai governance. Chin J Agric Resour Reg Plan. (2023) (Forthcoming).
75. Cavalieri, M, and Ferrante, L. Convergence, decentralization and spatial effects: An analysis of Italian regional health outcomes. Health Policy. (2020) 124:164–73. doi: 10.1016/j.healthpol.2019.12.001
76. Li, HZ, Li, BK, Liu, HY, Zhao, HR, and Wang, YW. Spatial distribution and convergence of provincial carbon intensity in China and its influencing factors: a spatial panel analysis from 2000 to 2017. Environ Sci Pollut Res. (2021) 28:54575–93. doi: 10.1007/s11356-021-14375-7
77. Li, H. Land finance and urban industrial development from the perspective of urbanization quality improvement. Econ Probl. (2023) 8:121–9. doi: 10.16011/j.cnki.jjwt.2023.08.013
78. Huang, SF, and Zhao, Y. Tax incentives and corporate green innovation. Public Financ Res. (2023) 2:68–81. doi: 10.19477/j.cnki.11-1077/f.2023.02.006
79. Tian, Z, Xiao, LY, Liu, C, Wang, YX, and Ren, YJ. Research on the spatial effect of urbanization on the carbon emission of transportation industry in China. J Technol Econ. (2023) 42:141–53.
80. Wang, XY, Wang, YL, Shen, R, Li, XM, and Du, QT. Spatial effect of Informatization China’s energy intensity:based on spatial Durbin error model. Resour Sci. (2021) 43:1752–63. doi: 10.18402/resci.2021.09.04
81. Li, Z, Yang, SY, and He, B. Does FDl inhibit or promote China’s regional innovation efficiency?-analysis of 30 provinces based on spatial panel model. Bus Manag J. (2017) 39:6–19. doi: 10.19616/j.cnki.bmj.2017.04.001
82. Qi, Y, Wang, DY, and Hou, Z. The spatial linkage mechanism of medical system, public health safety and economic prosperity. J Financ Econ. 47:124–38. doi: 10.16538/j.cnki.jfe.20210119.401
83. Liu, GG, Tang, CX, Liu, YH, Bu, T, and Tang, DS. Will high-speed railway influence the healthcare seeking behaviour of patients? Quasi-experimental evidence from China. Health Policy Plan. (2021) 36:1633–43. doi: 10.1093/heapol/czab018
84. Wang, YZ, Luo, NS, and Zhou, GF. Ls the opening of high-speed railway conducive to lmproving Residents’ health? J Financ Econ. (2020) 46:92–107. doi: 10.16538/j.cnki.jfe.20200316.401
85. Jia, CX. The path to upgrade the ability of science and technology lnnovation of lnner MongoliaBasedon the study of “the evaluation capability report 2015 of Chinese regional lnnovation”. Sci Manag Res. (2017) 35:75–8. doi: 10.19445/j.cnki.15-1103/g3.2017.03.019
86. China Science and Technology Development Strategy Research Group. China regional innovation capacity evaluation report 2022. Beijing: Science and Technology Literature Publishing (2022).
87. Wang, L, and Hu, J. Study on the spatial distribution pattern of physical health in China. China Sport Sci. (2021) 41:52–8. doi: 10.16469/j.css.202107006
88. Yuan, L, Qi, YZ, He, WJ, and Wu, X. Analysis of spatial correlation characteristics and evaluation of sustainable development capability of Yangtze River Economic Belt under new development concept. Resour Environ Yangtze Basin. (2023) 32:1993–2005. doi: 10.11870/cjlyzyyhj202310001
89. Chen, L, Hu, L, and He, F. A study on the influence of the development strategy of the Yangtze River Economic Belt on theRegional economic relations: an empirical test based on DID modal. Econ Surv. (2021) 38:23–32. doi: 10.15931/j.cnki.1006-1096.20210210.002
90. Shizhong, T, and Longxiang, W. Tax efforts, macro tax burden and high-quality development of regional economy-empirical study based on 41 cities in the Yangtze River Delta. J Shanxi Univ Financ Econ. (2023) 45:111–26. doi: 10.13781/j.cnki.1007-9556.2023.09.008
91. Jian-iun, P, and Hua-rui, W. Intrinsic logic and practical path of promoting the construction of the Community for the Chinese Nation through equalization of public services:taking medical and healthcare service as an example. J South Central Minzu Univ. (2024) 44:28–37+182. doi: 10.19898/j.cnki.42-1704/C.20240303.01
92. Zhang, GY, Zhang, LW, Wu, SL, Xia, XQ, and Lu, LM. The convergence of Chinese county government health expenditures: capitation and contribution. BMC Health Serv Res. (2016) 16:1. doi: 10.1186/s12913-016-1635-8
93. Li, TP, Xiao, G, and Zhang, X. An inquiry into Chinese urbanization quality in era of Urban Society. Urban Environ Stud. (2019) 3:3–18.
94. Xiaoping, L, and Zhongdi, Z. Threshold effects of technology spillovers in international trade: an analysis based on panel data from various regions in China. Stat Res. (2004) 10:27–32. doi: 10.19343/j.cnki.11-1302/c.2004.10.005
95. Wang, Y, Wen, QX, and Zhang, L. Interaction mechanism and coupling strategy of higher Education, Scientific and technological innovation ability and regional economy. J Natl Acad Educ Adm. (2023) 3:51–9.
96. Mei, Dongzhou, and Wang, Jiaxin. Land finance, high housing Price and China’s economic transition. World Economic Papers (2023) (3):18–38 (In Chinese).
Keywords: coupling coordination, spatial convergence, kernel density, health service supply, level of economic development
Citation: Deng J, Song Q, Liu H, Jiang Z, Ge C and Li D (2024) The coupling coordination between health service supply and regional economy in China: spatio-temporal evolution and convergence. Front. Public Health. 12:1352141. doi: 10.3389/fpubh.2024.1352141
Edited by:
Yen-Chiang Chang, Dalian Maritime University, ChinaReviewed by:
Xufeng Cui, Zhongnan University of Economics and Law, ChinaLilin Cao, Jiangsu University, China
Mohamed R. Abonazel, Cairo University, Egypt
Copyright © 2024 Deng, Song, Liu, Jiang, Ge and Li. This is an open-access article distributed under the terms of the Creative Commons Attribution License (CC BY). The use, distribution or reproduction in other forums is permitted, provided the original author(s) and the copyright owner(s) are credited and that the original publication in this journal is cited, in accordance with accepted academic practice. No use, distribution or reproduction is permitted which does not comply with these terms.
*Correspondence: Dexun Li, bGlkZXh1bm9vQDEyNi5jb20=