 Huiling Zhang
 Xinyu Liu2
 Ya Jiang
- 1The First Clinical Medical College, Shandong University of Traditional Chinese Medicine, Jinan, China
- 2Department of Cardiology, Linyi Traditional Chinese Medicine Hospital, Linyi, China
Background: Frailty is a significant concern in the field of public health. However, currently, there is a lack of widely recognized and reliable biological markers for frailty. This study aims to investigate the association between systemic inflammatory biomarkers and frailty in the older adult population in the United States.
Methods: This study employed data from the National Health and Nutrition Examination Survey (NHANES) spanning 2007 to 2018 and conducted a rigorous cross-sectional analysis. We constructed weighted logistic regression models to explore the correlation between the Systemic Immune-Inflammation Index (SII), Systemic Inflammatory Response Index (SIRI), and frailty in the population aged 40 to 80 years. Using restricted cubic spline (RCS), we successfully visualized the relationship between SII, SIRI, and frailty. Finally, we presented stratified analyses and interaction tests of covariates in a forest plot.
Results: This study involved 11,234 participants, 45.95% male and 54.05% female, with an average age of 64.75 ± 0.13 years. After adjusting for relevant covariates, the weighted logistic regression model indicated an odds ratio (OR) and 95% confidence interval(CI) for the correlation between frailty and the natural logarithm (ln) transformed lnSII and lnSIRI as 1.38 (1.24–1.54) and 1.69 (1.53–1.88), respectively. Subsequently, we assessed different levels of lnSII and lnSIRI, finding consistent results. In the lnSII group model, the likelihood of frailty significantly increased in the fourth quartile (OR = 1.82, 95% CI: 1.55–2.12) compared to the second quartile. In the lnSIRI group model, the likelihood of frailty significantly increased in the third quartile (OR = 1.30, 95% CI: 1.10–1.53) and fourth quartile (OR = 2.29, 95% CI: 1.95–2.70) compared to the second quartile. The interaction results indicate that age and income-to-poverty ratio influence the association between lnSIRI and frailty. RCS demonstrated a nonlinear relationship between lnSII, lnSIRI, and frailty.
Conclusion: The results of this cross-sectional study indicate a positive correlation between systemic inflammatory biomarkers (SII, SIRI) and frailty.
1 Introduction
Frailty, as a multifactorial syndrome, manifests a trend of increasing physiological system impairments with age and may significantly reduce survival rates at any age (1). A key characteristic of frailty is the gradual weakening of physiological systems and an exceptional sensitivity to various stresses and pressures in daily life (2). Frailty may trigger and exacerbate other health issues; therefore, prevention and slowing the progression of frailty are crucial. Frailty is determined by multiple indicators, including the Edmonton Frail Scale (3), the Geriatric Nutritional Risk Index (4), the Frailty Index (FI) (5), and the Fried phenotype, among others. Among these, FI performs well in distinguishing frailty states (6). An increased burden of inflammation also characterizes frailty (7). Systemic Immune-Inflammation Index (SII) (8) and Systemic Inflammatory Response Index (SIRI) (9) are novel markers linked with inflammatory conditions.
Blood inflammation markers are cost-effective and easily accessible biomarkers. Serving as indicators of both local immune response and systemic inflammation, SII is a robust and stable metric, integrating three types of inflammatory cells (lymphocytes, neutrophils, and platelets) (10–12). Numerous studies have indicated that the SII can predict the prognosis of patients with various cancers, acute ischemic stroke, heart failure, and acute kidney injury (13). SIRI, composed of lymphocytes, monocytes, and neutrophils, represents a more comprehensive indicator of chronic inflammation (14). Previous research suggests that SIRI is a potential marker for early diagnosis and prognosis monitoring in conditions such as stroke, inflammatory diseases, and cancer (15). Additionally, previous research has found an association between C-reactive protein and interleukin-6 with frailty (16).
Some studies have indicated an association between systemic inflammatory biomarkers and the risk of frailty (17). However, current research has limitations, including small sample sizes and a single definition of frailty. The universality and reliability of this association require validation and further confirmation through larger-scale studies. In this study, we conducted a rigorous analysis using a large sample from the National Health and Nutrition Examination Survey (NHANES) data spanning 2007 to 2018 to explore the correlation between SIRI, SII, and frailty. This research aims to gain deeper insights into the impact of systemic inflammatory biomarkers on frailty, ultimately providing more effective healthcare recommendations for individuals.
2 Methods
2.1 Study population
These data are available from the NHANES database (18). This database comprises a series of nationally representative surveys designed to assess U.S. citizens’ health and nutritional status (19). The database has received approval from the National Center for Health Statistics Ethics Review Board, and the participants have obtained written consent (20). We conducted data analysis on the most recent six NHANES survey cycles (2007–2018), encompassing 15,155 participants, followed by a series of exclusions.
1. Exclusion of participants with less than 80% of FI features (< 40 items) (n = 244);
2. Exclusion of participants with age < 40 years (n = 1,396);
3. Exclusion of individuals with insufficient baseline information (gender, race, education, marital status, income poverty ratio) (n = 1,402);
4. Exclusion of individuals with missing covariates (alcohol consumption, smoking) (n = 500);
5. Exclusion of individuals with missing values for SII and SIRI (n = 379).
Ultimately, it includes 11,234 participants, as depicted in Figure 1.

Figure 1. Flow chart of sample selection.
2.2 Frailty
Following the approach proposed by Hakeem et al., we utilized the FI to assess the degree of frailty. This index comprises 49 variables spanning multiple systems, covering aspects such as cognition, dependency, depressive symptoms, comorbidities, general health status, hospital utilization, physical performance, body measurements, and laboratory test values (21–23). The eligibility survey required a completion rate of at least 80% (approximately 40 items) for the 49 frailty items. We assigned scores ranging from 0 to 1 based on the severity of defects (see Supplementary Table S1)1. The FI is the sum of defect scores obtained by participants divided by the potential total defect score. With a critical threshold for the FI set at 0.21, values greater than or equal to 0.21 are defined as frail, while values less than 0.21 are non-frail (24).
2.3 Systemic inflammatory biomarkers
An automated hematology analyzer will evaluate lymphocyte, neutrophil, platelet, and monocyte counts expressed as ×103 cells/μL (25). We calculated two systemic inflammatory markers based on peripheral blood cell counts: SII and SIRI. The calculation formula for SII is platelet count × neutrophil/lymphocyte count (26). The calculation formula for SIRI is neutrophil count × monocyte count/lymphocyte count (27).
2.4 Covariates
Correlation logic and previously published literature guided the selection of covariates. We collected statistical data on basic participant information, including age, gender, race, education level, marital status, income poverty ratio, and statistics on alcohol and smoking habits. Specifically, age into two groups: <40 years and ≥ 40 years; gender into two groups: male and female; race into five groups: Mexican American, other Hispanic, non-Hispanic White, non-Hispanic Black, and other races, including multiple races; education level into three groups: less than high school, high school or general education diploma, and more than high school (28); marital status into three groups: married/living with a partner, never married, and separated/divorced/widowed (29); The income poverty ratio is categorized into three groups: low (≤1.3), moderate (1.3–3.5), and high (>3.5). It is calculated by dividing the family’s (or individual’s) income by the poverty threshold specific to the survey year. A lower income poverty ratio indicates lower income for the family (or individual). Based on the response to the question, “Have you smoked at least 100 cigarettes in your entire life?” participants were categorized as smokers or non-smokers. Based on responses to questions about drinking at least 12 alcoholic beverages in the past year and ever drinking any alcoholic beverage, participants were drinkers or non-drinkers (30).
2.5 Statistical analysis
In this study, statistical analyses followed the recommendations of the Centers for Disease Control and Prevention guidelines. We were considering the complexity and multi-stage sampling design of NHANES data collection and sampling weights in the statistical analysis. We compared the baseline characteristics between frail and non-frail individuals, as well as the baseline characteristics of different quartiles of the natural logarithm (ln) transformed SII (lnSII) and SIRI (lnSIRI). For normally distributed quantitative data, we used the t-test, and for qualitative data, we employed the χ2 test. Descriptive statistics presented continuous variables using mean ± standard deviation and categorical variables using percentages with 95% confidence intervals. Subsequently, weighted logistic regression models estimate the relationships between lnSII, lnSIRI, and frailty in three different models. Model 1 was a basic unadjusted model; Model 2 adjusted for age, gender, race, income poverty ratio, education level, and marital status; Model 3 included all variables in Model 2, plus smoking and drinking status. Furthermore, restricted cubic splines (RCS) were employed to detect potential non-linear relationships between lnSII, lnSIRI, and frailty. We performed Subgroup and interaction analyses for age, gender, education, marital status, income and poverty ratio, smoking, and drinking. All analyses use R software (V.4.3.2), Stata software (version 17), and SPSS software (version 27). Statistically significant: A significance level of p < 0.05 was considered.
3 Results
3.1 The baseline features of the participants
11,234 participants were included, with males comprising 45.95% and females 54.05%. Clinical characteristics of participants, stratified by frailty status, are presented in Table 1. The proportions of lnSII four quartiles among frail patients were 21.24, 21.80, 23.7, and 33.26%, respectively, while lnSIRI four quartiles were 20.08, 21.25, 25.01, and 33.67%, respectively. Frailty showed statistical significance (p < 0.05) concerning age, gender, race, education level, marital status, income poverty ratio, alcohol consumption, smoking status, lnSIRI, and lnSII. Compared to non-frail individuals, frail patients are often female, have lower educational levels, lower income poverty ratio, are less likely to be married or living with a partner, and are more likely to smoke. Additionally, they tend to have higher levels of lnSII and lnSIRI. The mean age of frail patients is 64.29 ± 0.22 years.

Table 1. Baseline characteristics of weighted sample by frailty and non-frailty groups.
Among the 11,234 participants, 63.54% were non-frail, and 36.46% as frail. Stratifying by different levels of lnSIRI, significant differences in frailty, age, gender, race, education, marital status, income and poverty ratio, alcohol consumption, and smoking status were observed (p < 0.05). The proportions of the four categories of frailty were 34.96, 29.48, 34.43, and 46.69%, as illustrated in Table 2.

Table 2. Baseline characteristics of the study population stratified by quartiles of lnSIRI value.
Stratifying by different levels of lnSII, significant differences in frailty, race, education, marital status, income and poverty ratio, and smoking status were observed (p < 0.05). The proportions of the four frailty categories were 35.91, 31.12, 33.05, and 45.35%, as illustrated in Table 3.

Table 3. Baseline characteristics of the study population stratified by quartiles of lnSII value.
3.2 The relationship between lnSII, lnSIRI and frailty
Three weighted logistic regression models were employed to investigate the association between lnSII, lnSIRI, and frailty. The odds ratios (OR) and 95% confidence intervals (CI) for the ratio of frailty’s correlation with lnSII and lnSIRI are presented in Table 4. Model 1, unadjusted; Model 2, adjusted for age, gender, race, education, marital status, income-to-poverty ratio; Model 3, additional adjustment for smoking and drinking status based on Model 2. There is a consistently significant positive correlation between lnSII, lnSIRI, and frailty in all three models. The impact of lnSII on frailty was as follows: Model 1 (OR = 1.34, 95% CI: 1.21–1.48), Model 2 (OR = 1.41, 95% CI: 1.26–1.57), Model 3 (OR = 1.38, 95% CI: 1.24–1.54). When assessing different levels of lnSII, compared to the second quartile of lnSII, the first and third quartiles did not show a significant difference in the probability of frailty. At the same time, the likelihood significantly increased in the fourth quartile: Model 1 (OR = 1.84, 95% CI: 1.58–2.13), Model 2 (OR = 1.86, 95% CI: 1.59–2.17), Model 3 (OR = 1.82, 95% CI: 1.55–2.12). Furthermore, the trend p-values for all three models were below 0.001.

Table 4. Association between lnSII, lnSIRI and frailty.
The impact of lnSIRI on frailty was as follows: Model 1 (OR = 1.45, 95% CI: 1.32–1.58), Model 2 (OR = 1.73, 95% CI: 1.56–1.91), and Model 3 (OR = 1.69, 95% CI: 1.53–1.88). When assessing different levels of lnSIRI, compared to the second quartile of lnSIRI, the first quartile did not show a significant difference in the probability of frailty. In contrast, the probabilities significantly increased in the third and fourth quartiles. For the third quartile: Model 1 (OR = 1.26, 95% CI: 1.08–1.47), Model 2 (OR = 1.32, 95% CI: 1.12–1.55), Model 3 (OR = 1.30, 95% CI: 1.10–1.53); For the fourth quartile: Model 1 (OR = 2.09, 95% CI: 1.80–2.44), Model 2 (OR = 2.34, 95% CI: 1.99–2.76), Model 3 (OR = 2.29, 95% CI: 1.95–2.70). Furthermore, the trend p-values for all three models were below 0.001.
We also used RCS to visualize the association between lnSII, lnSIRI, and frailty. After adjusting for all covariates in the primary analysis Model 3 mentioned above, we observed a non-linear correlation between lnSII, lnSIRI, and frailty (Figure 2).
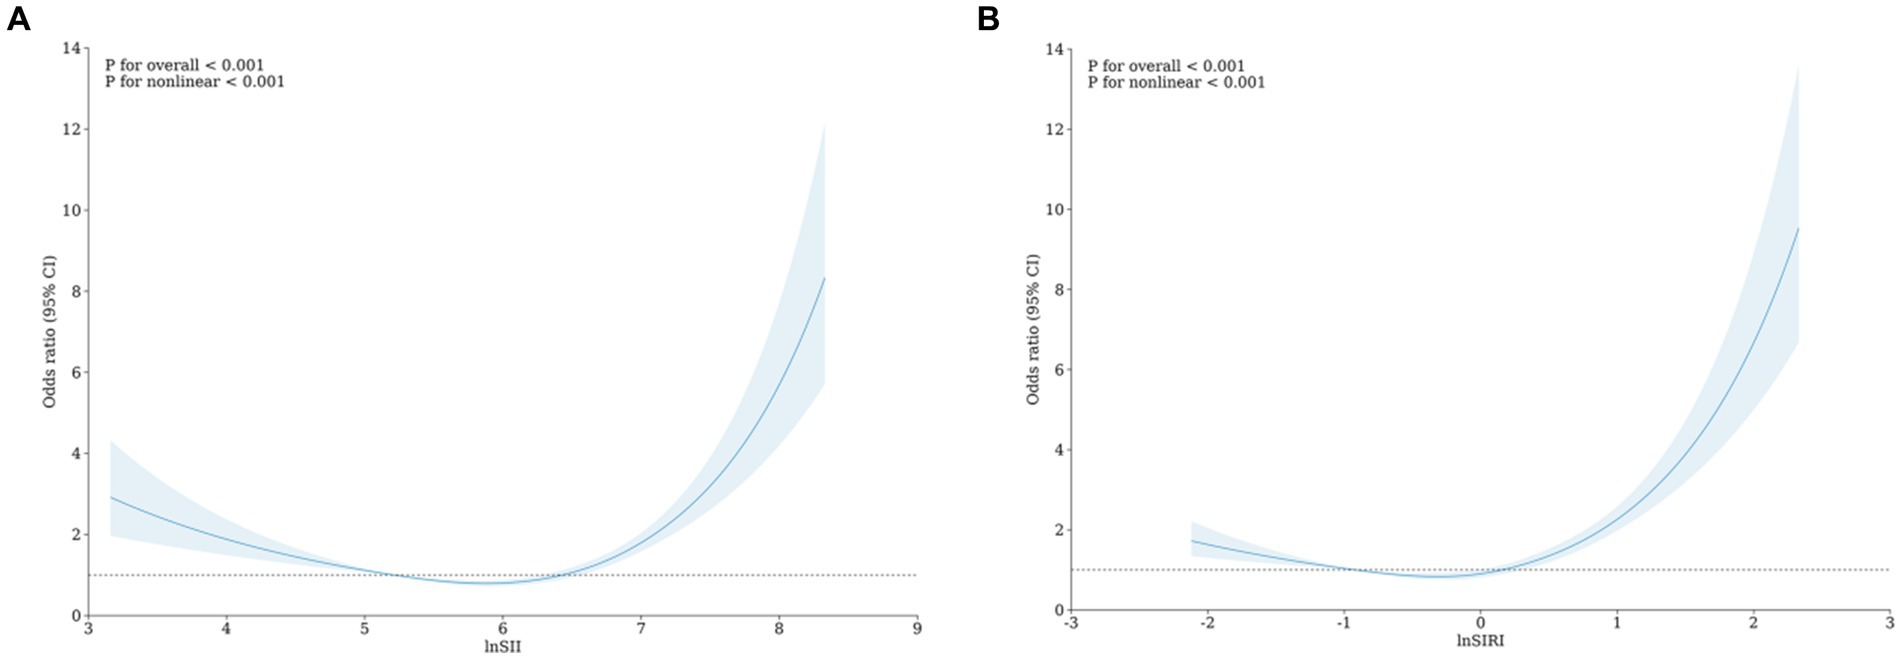
Figure 2. RCS analysis of lnSII (A) and lnSIRI (B) with the odds ratio of frailty.
3.3 Stratified analyses and interaction test
The interaction tests in the subgroup analysis revealed that the impact of lnSIRI on frailty varied with age (p for interaction = 0.007) and income-to-poverty ratio (p for interaction <0.001). However, gender, race, education, marital status, smoking, and alcohol consumption did not influence this positive correlation (p for interaction >0.05), as illustrated in Figure 3.

Figure 3. Subgroup analysis and interaction of the association between lnSIRI and frailty.
The relationship between lnSII and frailty showed no statistically significant differences across different strata, indicating that age, gender, race, education, marital status, income-to-poverty ratio, smoking, and alcohol consumption did not significantly affect this positive correlation (p for interaction >0.05), as depicted in Figure 4.

Figure 4. Subgroup analysis and interaction of the association between lnSII and frailty.
4 Discussion
This cross-sectional study investigated the relationship between lnSII, lnSIRI, and frailty using weighted logistic regression. We included 11,234 adults aged 40 years and older. The study’s results indicated a positive correlation between lnSII and lnSIRI with frailty. This finding aligns with previous research, which suggested that individuals with higher neutrophil-to-lymphocyte ratio and higher SII levels have an increased risk of frailty events (17). Furthermore, our study revealed that age and income poverty ratio influence the association between lnSIRI and frailty. In contrast, the association between lnSII and frailty is relatively unaffected by other factors. We also observed several differences between frail and non-frail individuals. Frail individuals were more likely to be female, have lower educational attainment, lower income poverty ratio, less likely to be married/cohabiting, smokers, and had higher levels of lnSII and lnSIRI. Previous studies have also shown that the frail group is more likely to be female, have lower educational attainment, and have lower income (31, 32).
Research indicates that the prevalence of frailty among older adults is between 12 and 24% in 62 countries and regions (33). Frailty has been shown to have varying degrees of impact on the prognosis of older adults with cardiovascular diseases, increasing the incidence and mortality rates of cardiovascular disease patients (34). It becomes an independent risk factor for various major adverse cardiovascular events, including death, stroke, readmission for heart failure, and postoperative cardiac complications (35). Additionally, frail patients are at a higher risk of developing sepsis, pneumonia, and kidney failure compared to non-frail individuals (36). However, the pathological mechanisms leading to frailty remain unclear, and there is a lack of recognized, accurate, and reliable biological markers for frailty (37–39). Future research efforts should focus on understanding the pathogenesis of frailty to improve early diagnosis and intervention, thereby alleviating the burden on global healthcare systems.
The study points out that elevated levels of inflammatory markers are commonly found in older adults, and inflammation may be a primary factor leading to frailty (40, 41). The association between changes in the immune system and frailty involves multiple pathways, with neutrophils being a crucial biomarker for innate immunity, platelets potentially contributing to immune function, and lymphocytes providing rich information about adaptive immunity (42, 43). SII and SIRI have demonstrated exceptional validity as emerging biomarkers in various diseases (44). SII’s predictive ability for major cardiovascular events in coronary heart disease patients undergoing coronary intervention surpasses traditional risk factors (45). Both SII and SIRI are closely correlated with cardiovascular and all-cause mortality. These studies emphasize the role of managing inflammatory markers in frailty among middle-aged and older adults and suggest that emerging biomarkers like SII and SIRI could be powerful tools for assessing and managing the health of middle-aged and older individuals (46, 47).
The findings of this study reveal a positive correlation between SII and SIRI with frailty, especially with SIRI exhibiting a more significant association. The study holds general significance due to its large sample size and representative sample selection. However, it is essential to note some limitations. Firstly, the study adopts a cross-sectional design, thus preventing the establishment of a causal relationship between SII, SIRI, and frailty. Secondly, some unaccounted confounding factors could impact the accurate assessment of the genuine associations.
5 Conclusion
This cross-sectional study provides compelling evidence indicating a positive correlation between systemic inflammatory biomarkers (SIRI and SII) and frailty. Given the ease of assessment of SIRI and SII in the laboratory, they can serve as cost-effective predictive factors for future frailty occurrences. This offers feasibility and guiding information for further interventions targeting the immune system to reduce the incidence of frailty.
Data availability statement
The original contributions presented in the study are included in the article/Supplementary material, further inquiries can be directed to the corresponding author.
Author contributions
HZ: Conceptualization, Data curation, Methodology, Software, Visualization, Writing – original draft. XL: Supervision, Writing – review & editing. XW: Data curation, Visualization, Writing – original draft. YJ: Conceptualization, Supervision, Validation, Visualization, Writing – review & editing.
Funding
The author(s) declare that no financial support was received for the research, authorship, and/or publication of this article.
Acknowledgments
We appreciate the people who contributed to the NHANES data we studied.
Conflict of interest
The authors declare that the research was conducted in the absence of any commercial or financial relationships that could be construed as a potential conflict of interest.
Publisher’s note
All claims expressed in this article are solely those of the authors and do not necessarily represent those of their affiliated organizations, or those of the publisher, the editors and the reviewers. Any product that may be evaluated in this article, or claim that may be made by its manufacturer, is not guaranteed or endorsed by the publisher.
Supplementary material
The Supplementary material for this article can be found online at: https://www.frontiersin.org/articles/10.3389/fpubh.2024.1377408/full#supplementary-material
Abbreviations
NHANES, National Health and Nutrition Examination Survey; SII, Systemic Immune-Inflammation Index; SIRI, Systemic Inflammatory Response Index; RCS, restricted cubic spline; OR, odds ratio; CI, confidence interval; ln, natural logarithm; FI, Frailty Index.
Footnotes
References
1. Jiang, Z, Wang, J, Cai, X, Wang, P, and Liu, S. L-shaped association of serum α-klotho and frailty among the middle-aged and older adults: results from NHANES 2007-2016. BMC Geriatr. (2023) 23:716. doi: 10.1186/s12877-023-04324-z
2. Huang, G, Qian, D, Liu, Y, Qu, G, Qian, Y, and Pei, B. The association between frailty and osteoarthritis based on the NHANES and Mendelian randomization study. Arch Med Sci. (2023) 19:1545–50. doi: 10.5114/aoms/171270
3. Bilgin, S, Aktas, G, Kurtkulagi, O, Atak, BM, and Duman, TT. Edmonton frail score is associated with diabetic control in elderly type 2 diabetic subjects. J Diabetes Metab Disord. (2020) 19:511–4. doi: 10.1007/s40200-020-00542-z
4. Aktas, G. Importance of the geriatric nutritional risk index in survival among the geriatric population. Geriatr Gerontol Int. (2024). doi: 10.1111/ggi.14836
5. Liu, X, Wang, Y, Shen, L, Sun, Y, Zeng, B, Zhu, B, et al. Association between frailty and chronic constipation and chronic diarrhea among American older adults: National Health and nutrition examination survey. BMC Geriatr. (2023) 23:745. doi: 10.1186/s12877-023-04438-4
6. Fried, LP, Tangen, CM, Walston, J, Newman, AB, Hirsch, C, Gottdiener, J, et al. Frailty in older adults: evidence for a phenotype. J Gerontol A Biol Sci Med Sci. (2001) 56:M146–56. doi: 10.1093/gerona/56.3.M146
7. Bilgin, S, Aktas, G, Kahveci, G, Tel, A, Kurtkulagi, O, and Taslamacioglu, DT. Does mean platelet volume/lymphocyte count ratio associate with frailty in type 2 diabetes mellitus? Bratisl Lek Listy. (2021) 122:116–119. doi: 10.4149/BLL_2021_017
8. Taslamacioglu Duman, T, Ozkul, FN, and Balci, B. Could systemic inflammatory index predict diabetic kidney injury in type 2 diabetes mellitus? Diagnostics. (2023) 13:2063. doi: 10.3390/diagnostics13122063
9. Dziedzic, EA, Gąsior, JS, Tuzimek, A, Paleczny, J, Junka, A, Dąbrowski, M, et al. Investigation of the associations of novel inflammatory biomarkers—systemic inflammatory index (SII) and systemic inflammatory response index (SIRI)—with the severity of coronary artery disease and acute coronary syndrome occurrence. Int J Mol Sci. (2022) 23:9553. doi: 10.3390/ijms23179553
10. Mahemuti, N, Jing, X, Zhang, N, Liu, C, Li, C, Cui, Z, et al. Association between systemic immunity-inflammation index and hyperlipidemia: a population-based study from the NHANES (2015-2020). Nutrients. (2023) 15:1177. doi: 10.3390/nu15051177
11. van Soest, RJ, Templeton, AJ, Vera-Badillo, FE, Mercier, F, Sonpavde, G, Amir, E, et al. Neutrophil-to-lymphocyte ratio as a prognostic biomarker for men with metastatic castration-resistant prostate cancer receiving first-line chemotherapy: data from two randomized phase III trials. Ann Oncol. (2015) 26:743–9. doi: 10.1093/annonc/mdu569
12. Tong, YS, Tan, J, Zhou, XL, Song, YQ, and Song, YJ. Systemic immune-inflammation index predicting chemoradiation resistance and poor outcome in patients with stage III non-small cell lung cancer. J Transl Med. (2017) 15:221. doi: 10.1186/s12967-017-1326-1
13. Sun, W, Fang, Y, Zhou, B, Mao, G, Cheng, J, Zhang, X, et al. The association of systemic inflammatory biomarkers with non-alcoholic fatty liver disease: a large population-based cross-sectional study. Prev Med Rep. (2024) 37:102536. doi: 10.1016/j.pmedr.2023.102536
14. Jin, N, Huang, L, Hong, J, Zhao, X, Hu, J, Wang, S, et al. The association between systemic inflammation markers and the prevalence of hypertension. BMC Cardiovasc Disord. (2023) 23:615. doi: 10.1186/s12872-023-03661-6
15. Dziedzic, EA, Gąsior, JS, Tuzimek, A, Dąbrowski, M, and Jankowski, P. The association between serum vitamin D concentration and new inflammatory biomarkers-systemic inflammatory index (SII) and systemic inflammatory response (SIRI)-in patients with ischemic heart disease. Nutrients. (2022) 14:4212. doi: 10.3390/nu14194212
16. Soysal, P, Stubbs, B, Lucato, P, Luchini, C, Solmi, M, Peluso, R, et al. Inflammation and frailty in the elderly: a systematic review and meta-analysis. Ageing Res Rev. (2016) 31:1–8. doi: 10.1016/j.arr.2016.08.006
17. Zhang, H, Hao, M, Hu, Z, Li, Y, Jiang, X, Wang, J, et al. Association of immunity markers with the risk of incident frailty: the Rugao longitudinal aging study. Immun Ageing. (2022) 19:1. doi: 10.1186/s12979-021-00257-6
18. Liang, Y, Wang, J, Wang, T, Li, H, Yin, C, Liu, J, et al. Moderate selenium mitigates hand grip strength impairment associated with elevated blood cadmium and lead levels in middle-aged and elderly individuals: insights from NHANES 2011-2014. Front Pharmacol. (2023) 14:1324583. doi: 10.3389/fphar.2023.1324583
19. Zeng, Y, Yin, L, Yin, X, and Zhao, D. Total cholesterol mediates the association between history of gestational diabetes mellitus and bone mineral density in US women aged 20-49 years. BMC Public Health. (2024) 24:81. doi: 10.1186/s12889-023-17609-0
20. He, YS, Cao, F, Musonye, HA, Xu, YQ, Gao, ZX, Ge, M, et al. Serum albumin mediates the associations between heavy metals and two novel systemic inflammation indexes among U.S. adults. Ecotoxicol Environ Saf. (2024) 270:115863. doi: 10.1016/j.ecoenv.2023.115863
21. Shi, L. Association of energy-adjusted dietary inflammatory index and frailty in older adults with nonalcoholic fatty liver disease. Exp Gerontol. (2023) 182:112296. doi: 10.1016/j.exger.2023.112296
22. Searle, SD, Mitnitski, A, Gahbauer, EA, Gill, TM, and Rockwood, K. A standard procedure for creating a frailty index. BMC Geriatr. (2008) 8:24. doi: 10.1186/1471-2318-8-24
23. Ferrucci, L, Guralnik, JM, Studenski, S, Fried, LP, Cutler, GB Jr, and Walston, JD. Designing randomized, controlled trials aimed at preventing or delaying functional decline and disability in frail, older persons: a consensus report. J Am Geriatr Soc. (2004) 52:625–34. doi: 10.1111/j.1532-5415.2004.52174.x
24. Joo, SH, Song, JW, Shin, K, Kim, MJ, Lee, J, and Song, YW. Knee osteoarthritis with a high grade of Kellgren-Lawrence score is associated with a worse frailty status, KNHANES 2010-2013. Sci Rep. (2023) 13:19714. doi: 10.1038/s41598-023-46558-2
25. Wang, J, Zhou, D, Dai, Z, and Li, X. Association between systemic immune-inflammation index and diabetic depression. Clin Interv Aging. (2021) 16:97–105. doi: 10.2147/CIA.S285000
26. Arı, E, Köseoğlu, H, and Eroğlu, T. Predictive value of SIRI and SII for metastases in RCC: a prospective clinical study. BMC Urol. (2024) 24:14. doi: 10.1186/s12894-024-01401-2
27. Peng, A, Zhang, B, Wang, S, Feng, Y, Liu, S, Liu, C, et al. Comparison of the value of various complex indexes of blood cell types and lipid levels in coronary heart disease. Front Cardiovas Med. (2023) 10:1284491. doi: 10.3389/fcvm.2023.1284491
28. Yang, M, Miao, S, Hu, W, and Yan, J. Association between the dietary inflammatory index and all-cause and cardiovascular mortality in patients with atherosclerotic cardiovascular disease. Nutr Metab Cardiovasc Dis. (2024) 34:1046–53. doi: 10.1016/j.numecd.2023.11.015
29. Meshkat, S, Liu, Y, Jung, H, Tassone, VK, Pang, H, Janssen-Aguilar, R, et al. Temporal associations of BMI and glucose parameters with depressive symptoms among US adults. Psychiatry Res. (2024) 332:115709. doi: 10.1016/j.psychres.2023.115709
30. Xu, J, Xu, ZX, Yang, QF, Zhuang, J, Zhu, X, and Yao, J. Association between the sarcopenia index and abnormal liver function in the adult population in the United States: a cross-sectional study. Front Med. (2023) 10:1266253. doi: 10.3389/fmed.2023.1266253
31. Baniak, LM, Yang, K, Choi, J, and Chasens, ER. Long sleep duration is associated with increased frailty risk in older community-dwelling adults. J Aging Health. (2020) 32:42–51. doi: 10.1177/0898264318803470
32. Jayanama, K, Theou, O, Blodgett, JM, Cahill, L, and Rockwood, K. Frailty, nutrition-related parameters, and mortality across the adult age spectrum. BMC Med. (2018) 16:1–23. doi: 10.1186/s12916-018-1176-6
33. Barrera, A, Rezende, LFM, Sabag, A, Keating, CJ, and Rey-Lopez, JP. Understanding the causes of frailty using a life-course perspective: a systematic review. Healthcare (Basel, Switzerland). (2023) 12:22. doi: 10.3390/healthcare12010022
34. Udell, JA, Lu, D, Bagai, A, Dodson, JA, Desai, NR, Fonarow, GC, et al. Preexisting frailty and outcomes in older patients with acute myocardial infarction. Am Heart J. (2022) 249:34–44. doi: 10.1016/j.ahj.2022.03.007
35. Zong, M, Guan, X, Huang, W, Chang, J, and Zhang, J. Effect of frailty on the long-term prognosis of elderly patients with acute myocardial infarction. Clin Interv Aging. (2023) 18:2021–9. doi: 10.2147/CIA.S433221
36. Yamaguchi, K, Miyagami, T, Imada, R, Kushiro, S, Yanagida, R, Morikawa, T, et al. Effect of poor oral health status at hospital admission on in-hospital outcomes of older patients with aspiration pneumonia. Eur Geriatr Med. (2024) 1–8. doi: 10.1007/s41999-023-00917-4
37. Pan, Y, and Ma, L. Inflammatory markers and physical frailty: towards clinical application. Immun Ageing. (2024) 21:4. doi: 10.1186/s12979-023-00410-3
38. Zhang, L, Zeng, X, He, F, and Huang, X. Inflammatory biomarkers of frailty: a review. Exp Gerontol. (2023) 179:112253. doi: 10.1016/j.exger.2023.112253
39. Xu, Y, Wang, M, Chen, D, Jiang, X, and Xiong, Z. Inflammatory biomarkers in older adults with frailty: a systematic review and meta-analysis of cross-sectional studies. Aging Clin Exp Res. (2022) 34:971–87. doi: 10.1007/s40520-021-02022-7
40. Ferrucci, L, and Fabbri, E. Inflammageing: chronic inflammation in ageing, cardiovascular disease, and frailty. Nat Rev Cardiol. (2018) 15:505–22. doi: 10.1038/s41569-018-0064-2
41. van Sleen, Y, Shetty, SA, van der Heiden, M, Venema, MCA, Gutiérrez-Melo, N, Toonen, EJM, et al. Frailty is related to serum inflammageing markers: results from the VITAL study. Immun Ageing. (2023) 20:68. doi: 10.1186/s12979-023-00391-3
42. Bonilla, FA, and Oettgen, HC. Adaptive immunity. J Allergy Clin Immunol. (2010) 125:S33–40. doi: 10.1016/j.jaci.2009.09.017
43. Fest, J, Ruiter, TR, Groot Koerkamp, B, Rizopoulos, D, Ikram, MA, van Eijck, CHJ, et al. The neutrophil-to-lymphocyte ratio is associated with mortality in the general population: the Rotterdam study. Eur J Epidemiol. (2019) 34:463–70. doi: 10.1007/s10654-018-0472-y
44. Fan, W, Wei, C, Liu, Y, Sun, Q, Tian, Y, Wang, X, et al. The prognostic value of hematologic inflammatory markers in patients with acute coronary syndrome undergoing percutaneous coronary intervention. Clin Appl Thromb Hemost. (2022) 28:10760296221146183. doi: 10.1177/10760296221146183
45. Gao, X, Liu, Y, Tian, Y, Rao, C, Shi, F, Bu, H, et al. Prognostic value of peripheral blood inflammatory cell subsets in patients with acute coronary syndrome undergoing percutaneous coronary intervention. J Int Med Res. (2021) 49:3000605211010059. doi: 10.1177/03000605211010059
46. Zhao, S, Dong, S, Qin, Y, Wang, Y, Zhang, B, and Liu, A. Inflammation index SIRI is associated with increased all-cause and cardiovascular mortality among patients with hypertension. Front Cardiovas Med. (2022) 9:1066219. doi: 10.3389/fcvm.2022.1066219
Keywords: frailty, SIRI, SII, systemic inflammatory biomarkers, NHANES
Citation: Zhang H, Liu X, Wang X and Jiang Y (2024) Association of two novel systemic inflammatory biomarkers and frailty based on NHANES 2007–2018. Front. Public Health. 12:1377408. doi: 10.3389/fpubh.2024.1377408
Edited by:
Emiliana Giacomello, University of Trieste, ItalyReviewed by:
Tuba Duman, Abant Izzet Baysal University, TürkiyeHaider Abdul-Lateef Mousa, University of Basrah, Iraq
Copyright © 2024 Zhang, Liu, Wang and Jiang. This is an open-access article distributed under the terms of the Creative Commons Attribution License (CC BY). The use, distribution or reproduction in other forums is permitted, provided the original author(s) and the copyright owner(s) are credited and that the original publication in this journal is cited, in accordance with accepted academic practice. No use, distribution or reproduction is permitted which does not comply with these terms.
*Correspondence: Ya Jiang, Smlhbmd5YTIwMjRAMTYzLmNvbQ==