 Jodie Leu
 Salome A. Rebello2
 Ginny M. Sargent
 Matthew Kelly
 Cathy Banwell
- 1National Centre for Epidemiology and Population Health, The Australian National University, Canberra, ACT, Australia
- 2Saw Swee Hock School of Public Health, National University of Singapore, Singapore, Singapore
A corrigendum on
Hard work, long hours, and Singaporean young adults' health—A qualitative study
by Leu, J., Rebello, S. A., Sargent, G. M., Kelly, M., and Banwell, C. (2023). Front. Public Health 11:1082581. doi: 10.3389/fpubh.2023.1082581
In the published article, there were errors in Table 1 as published. The percentage of Indian male participants in the study was displayed as (33.3). The correct percentage is (20.0). The number of male participants who were of normal weight and corresponding percentage was displayed as 8 (53.3). The correct number and percentage is 10 (66.7). The number of male participants who were overweight and corresponding percentage was displayed as 5 (33.3). The correct number and percentage is 3 (20.0). The number of all participants who were of normal weight and corresponding percentage was displayed as 20 (60.6). The correct number and percentage is 22 (66.7). The number of all participants who were overweight and corresponding percentage was displayed as 7 (21.2). The correct number and percentage is 5 (15.2). The percentage of participants who earned 6000-10,000SGD/month was displayed as (18.1). The correct percentage is (18.2). The corrected Table 1 and its caption ‘Sociodemographic information of participants.' appear below.
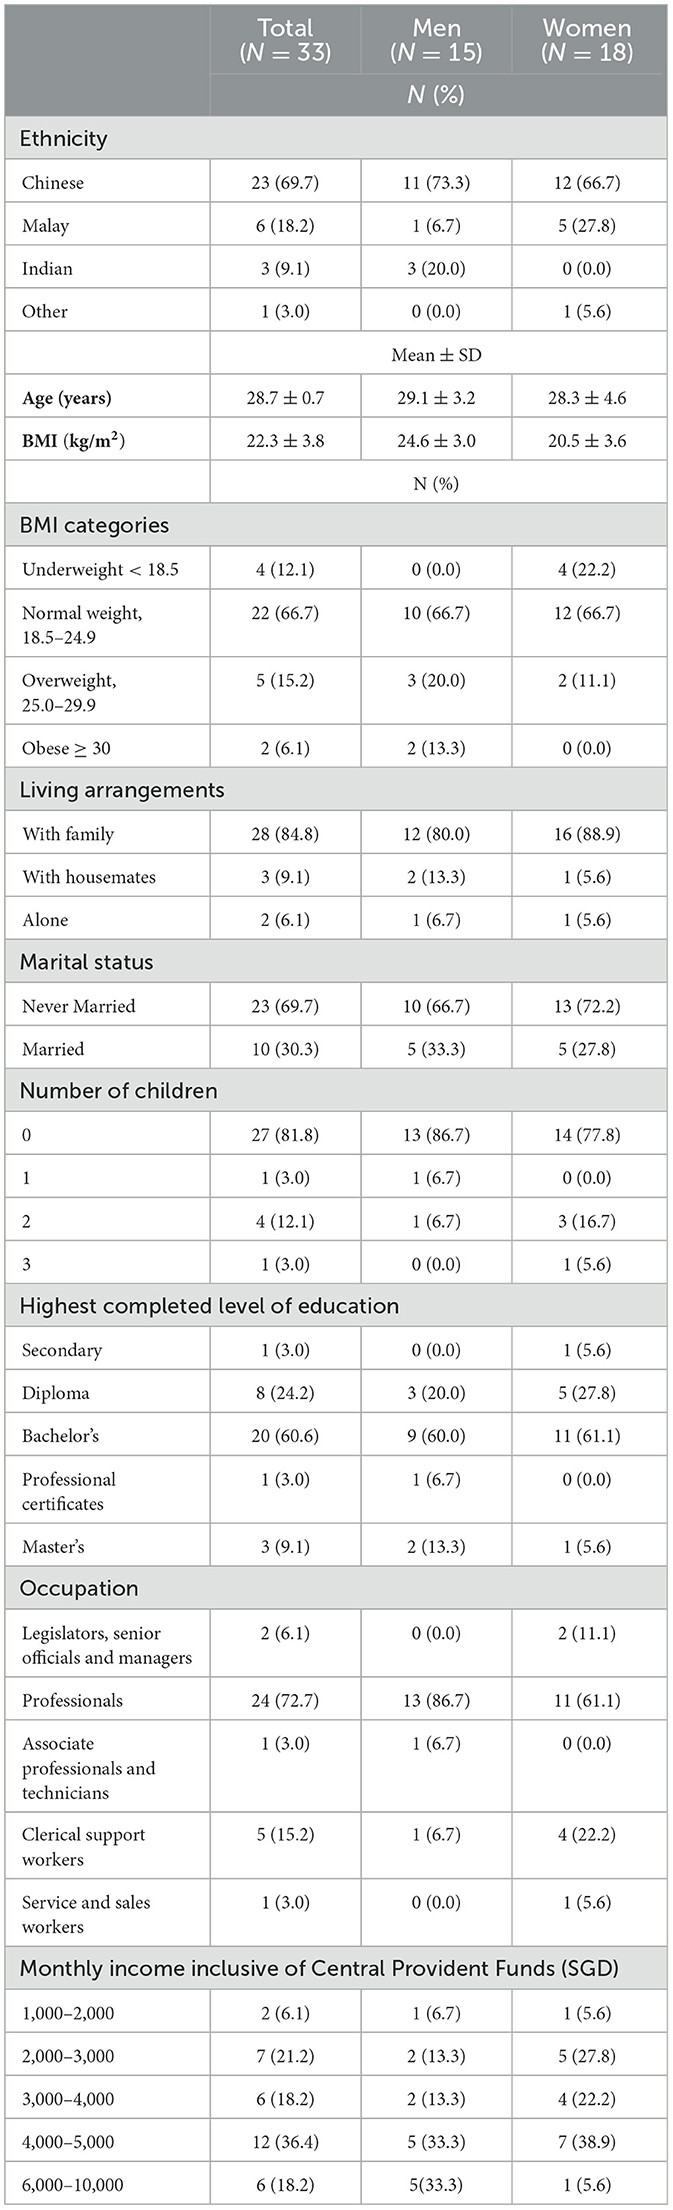
Table 1. Sociodemographic information of participants.
In the published article, there was an error in the numbers reported in relation to the number of participants who met the physical activity recommendations.
A correction has been made to Results, “I would love to exercise every day, but I can't do it: the influence of work on physical activities”, Paragraph 2. This sentence previously stated:
Nevertheless, more than half of the participants (66.7%−12 men and 10 women) took part in physical activity at least once in a typical week, although fewer (39.4%−7 men and 6 women) met the recommendation of 150 min of moderate-intensity aerobic exercise or at least 75 min of vigorous-intensity aerobic exercise in a week (55).
The corrected sentence appears below:
The WHO physical activity guidelines recommend per week: 150 min of moderate-intensity aerobic exercise or 75 min of vigorous-intensity aerobic exercise; and muscle strengthening activities on two or more days (55). More than half of the participants (66.7%−12 men and 10 women) took part in recreational physical activity at least once in a typical week. Yet, many participants did not meet the guidelines despite most participants (81.8%−12 men and 15 women) performing moderate or vigorous intensity exercise, largely through incidental activity.
The authors apologize for this error and state that this does not change the scientific conclusions of the article in any way. The original article has been updated.
Keywords: work time, health practices, diet, physical activity, obesity, health promotion, preventing non-communicable diseases, burden of disease
Citation: Leu J, Rebello SA, Sargent GM, Kelly M and Banwell C (2024) Corrigendum: Hard work, long hours, and Singaporean young adults' health—A qualitative study. Front. Public Health 12:1409963. doi: 10.3389/fpubh.2024.1409963
Received: 31 March 2024; Accepted: 25 April 2024;
Published: 06 May 2024.
Approved by:
Harshad Thakur, Tata Institute of Social Sciences, IndiaCopyright © 2024 Leu, Rebello, Sargent, Kelly and Banwell. This is an open-access article distributed under the terms of the Creative Commons Attribution License (CC BY). The use, distribution or reproduction in other forums is permitted, provided the original author(s) and the copyright owner(s) are credited and that the original publication in this journal is cited, in accordance with accepted academic practice. No use, distribution or reproduction is permitted which does not comply with these terms.
*Correspondence: Jodie Leu, Sm9kaWUuTGV1QGFsdW1uaS5hbnUuZWR1LmF1