 Ye-Soon Kim
 Ju-Hee Kim
 Sooyoung Kwon
- Department of Healthcare and Public Health Research, Korea National Rehabilitation Center, Rehabilitation Research Institute, Seoul, Republic of Korea
Objective: To investigate temporal trends in mortality rates and underlying causes of death in persons with disabilities before and during the coronavirus disease 2019 (COVID-19) pandemic.
Methods: Annual mortality rates and causes of death were analyzed using data covering the 2017–2022 period.
Results: The mortality rate among people with disabilities increased from 2017 to 2022; the rate was five times higher during COVID-19 in this population than in the general population. When analyzing the cause of death, the incidence of infectious diseases and tuberculosis decreased after COVID-19. In contrast, the incidence of other bacillary disorders (A30–A49) increased. The incidence of respiratory system diseases (J00–J99), influenza and pneumonia (J09–J18), and other acute lower respiratory infections (J20–J22) decreased before COVID-19, while the incidence of lung diseases due to external agents (J60–J70), other respiratory diseases principally affecting the interstitium (J80–J84), and other diseases of the pleura (J90–J94) increased during the pandemic. The risk of COVID-19 death among people with disabilities was 1.1-fold higher for female patients (95% CI = 1.06–1.142), 1.41-fold for patients aged 70 years and older (95% CI = 1.09–1.82), and 1.24-fold higher for people with severe disabilities (95% CI = 1.19–1.28).
Conclusions: The mortality rate in people with disabilities significantly increased during COVID-19, compared with that before the pandemic. People with disabilities had a higher mortality rate during COVID-19 compared with the general population. Risk factors must be reduced to prevent high mortality rates in this population.
1 Introduction
On January 30, 2020, the World Health Organization (WHO) declared a public health emergency due to international concern over the outbreak of coronavirus disease 2019 (COVID-19) (1). South Korea began social distancing on February 29, 2020, and on March 22, 2020, it began to impose more substantial social distancing measures (2). Restrictions on the use of religious facilities and the operation of commercial industries were affected. Over time, social distancing was initiated and suspended several times (3). On May 5, 2023, the WHO declared that COVID-19 was no longer an international public health emergency. Consequently, on May 11, 2023, Korean health authorities lifted most of the COVID-19 quarantine measures, declaring it an infectious disease that has become endemic (4).
The mortality rate related to the COVID-19 pandemic was not constant across population subsets. Older people (5–7), women (8, 9), ethnic minorities, and particular population groups (10, 11) were more likely to die from COVID-19. This information helped in the COVID-19 response and may help in responding to future infectious diseases. Moreover, this information was applied in policies involving social distancing (12, 13), allotting vaccination priority (14, 15), and quarantine and public relations (16–18).
In South Korea, men had a higher COVID-19-related mortality rate than women (19). Among patients with COVID-19, older individuals had higher case fatality and symptomatic infection rates, leading to a high mortality rate. In Korea, approximately 80% of COVID-19-related deaths occurred in people aged over 70 years (20). However, epidemiological indicators such as infection rate, hospitalization, mortality rate, and cause of death have not been separately evaluated for people with disabilities, who are expectedly vulnerable.
As such, there is insufficient information on the current status and risk of COVID-19 mortality in people with disabilities. Reports of mortality exist, although these are limited to some types of disabilities such as physical disabilities and developmental and mental disorders. However, there is an apparent lack of data on COVID-19-related mortality rate and mortality risk encompassing all people with disabilities. Therefore, we aimed to answer the following research questions: (1) Has the pandemic brought about a change in the mortality rate and cause of death in people with disabilities? (2) Is the pandemic-related mortality rate in people with disabilities similar to that in the general population?
2 Materials and methods
2.1 Data sources and study population
A death cause database was created by linking Statistics Korea data on the cause of death with the data of registered people with disabilities from the Ministry of Health and Welfare in South Korea. Registered people with disabilities are subject to the Korean Emotional Welfare Act (Act on Welfare of Persons with Disabilities) of the, Ministry of Government Legislation (21), which is legally registered with the Korean government (approximately 265 million registered people). There are 15 types of disabilities, each divided into severe and mild (22). The database records the number of registered people with disabilities nationwide. The data obtained for this study included sex, age, main disability type, and degree of disability. Any missing item resulted in exclusion from the analysis. Cause of death was classified using the International Classification of Diseases, Tenth Revision (ICD-10) codes and recorded on the patients' death certificates. This falls within the scope of the World Health Organization's 103 items. This study was approved by the Institutional Review Board of the National Rehabilitation Institute (approval number: NRC-2023-01-008).
2.2 Statistical analysis
Crude mortality and age-standardized mortality rates were calculated using death data for persons with disabilities in South Korea. The crude death rate for people with disabilities is an indicator calculated by dividing the total number of deaths of registered people with disabilities that occurred in a year by the estimated population of the country for that year, expressed per 100,000 people. The number of deaths of registered people with disabilities is collected at the end of the relevant year. The population of registered people with disabilities was operationally defined per the following formula:
The overall population crude death rate was set to the same standard as the crude death rate for people with disabilities. However, this figure includes people with and without disabilities. Logistic regression analysis was used to analyze factors affecting COVID-19 deaths in people with disabilities. The significance level was set at p < 0.05. The data were analyzed with SAS 9.4 statistical software (SAS Institute Inc, Cary, NC).
3 Results
3.1 Changes in mortality rates among people with disabilities before and after the COVID-19 pandemic
Figure 1 shows the changes in the mortality rates of people with disabilities before and after the COVID-19 pandemic. From 2017 to 2022, the number of deaths among people with disabilities increased. Concurrently, the crude mortality rate showed an overall increase. The general population showed the same pattern as that of people with disabilities. Over the past 5 years, mortality rates have increased. In 2020, there were 240 deaths among people with disabilities due to COVID-19, increasing to 1,414 in 2021 and 10,513 in 2022. Additionally, COVID-19-related mortality increased from 9.2 to 396.9. The mortality rate gap between people with disabilities and the general population increased 4.8-fold in 2020, 5.5-fold in 2021, and 6.5-fold in 2022 (Figure 2).
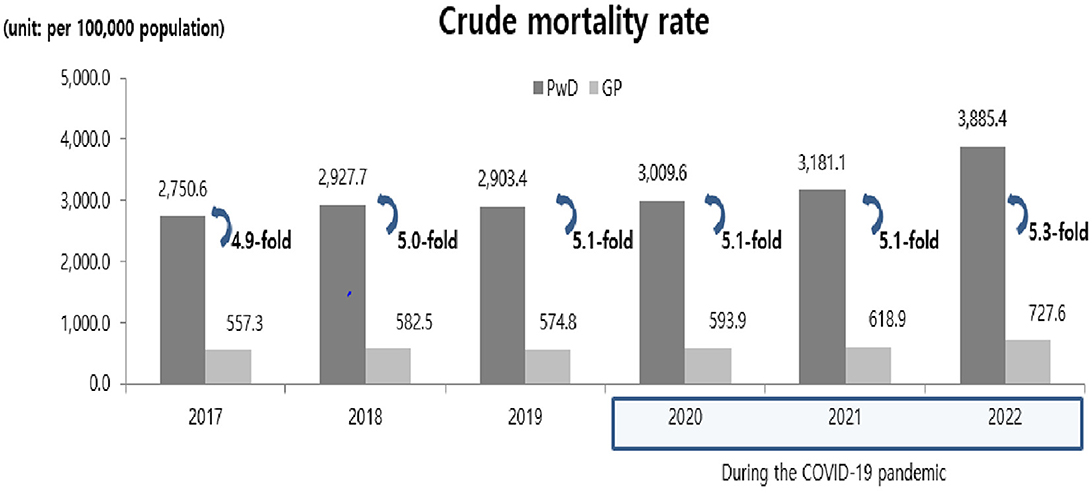
Figure 1. Mortality trends among people with and without disabilities before and during the COVID-19 pandemic. PwD, People with disabilities; GP, General population; COVID-19, coronavirus disease 2019.

Figure 2. COVID-19 specific death rate trends among people with and without disabilities during the COVID-19 pandemic. COVID-19, coronavirus disease 2019; PwD, People with disabilities; GP, General population.
3.2 Changes in cause of death among people with disabilities before and after the COVID-19 pandemic
Table 1 shows changes in ICD-10 codes for cause of death among people with disabilities during the pre- and post-COVID-19 period. The number of deaths among people with disabilities increased over the 5-years study period. Between 2020 and 2022, significant increases were observed in symptoms, signs, and abnormal clinical and laboratory findings not elsewhere classified (NEC, R00–R99), and in the provisional assignment of new diseases of uncertain etiology or emergency use (U00–U18).
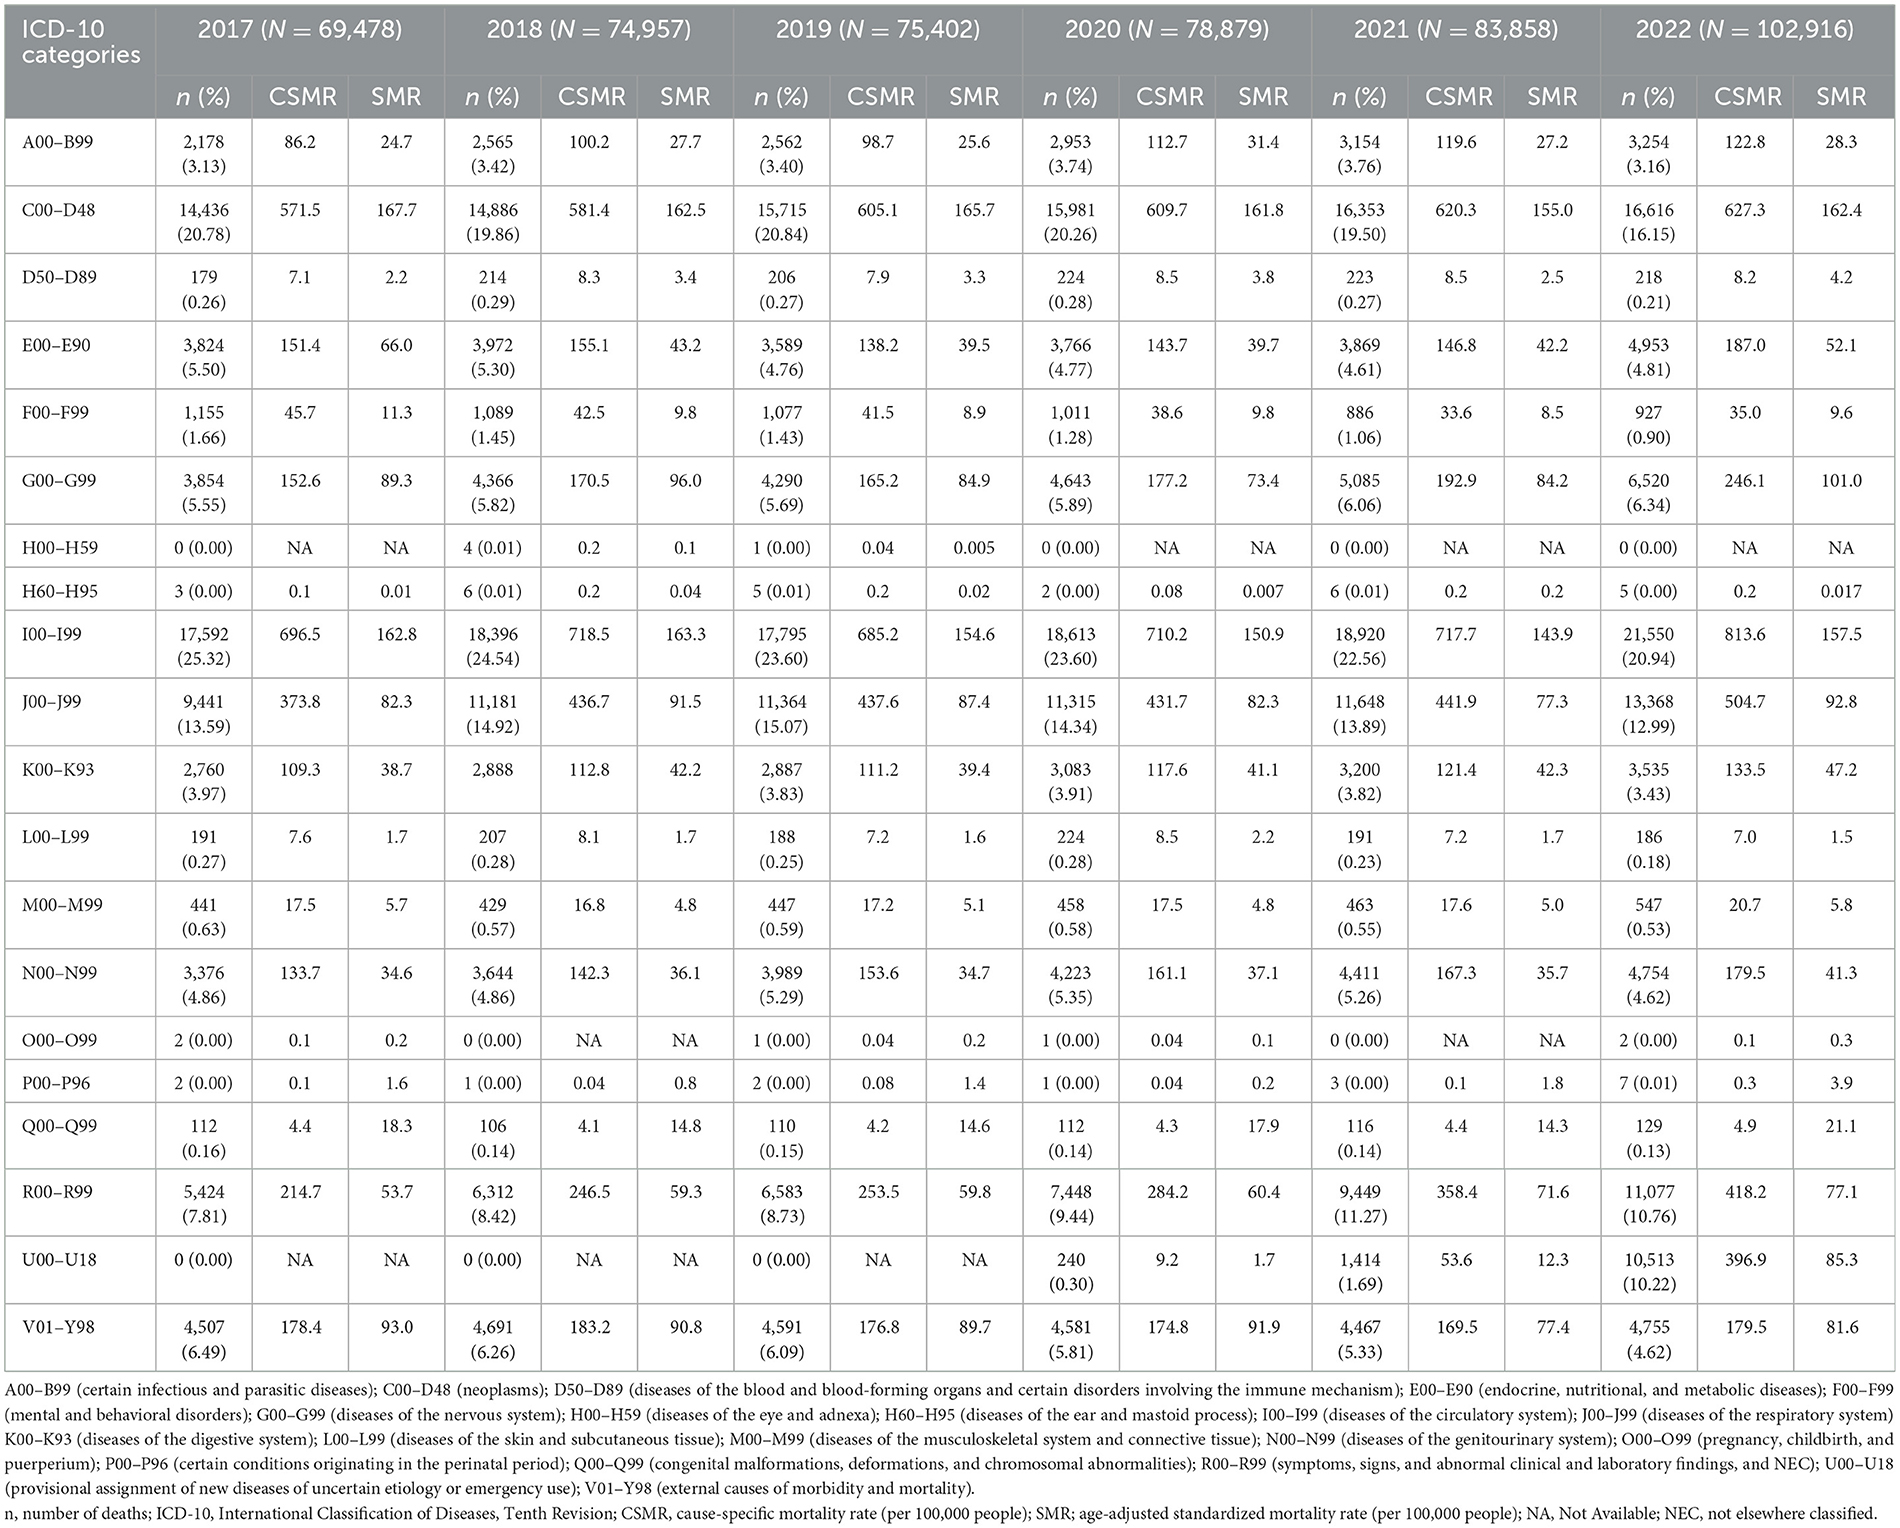
Table 1. Causes of death among people with disabilities based on ICD-10 codes from 2017 to 2022.
3.3 Changes in cause of death related to COVID-19 in people with disabilities after the COVID-19 pandemic
Three disease types with significant changes between 2019 and 2020 before and after COVID-19 were observed in people with disabilities: Diseases of the nervous system (G00–G99), certain infectious and parasitic diseases (A00–B99), and diseases of the respiratory system (J00–J99) on which an intensive study was conducted. These results are presented in Tables 2–4.
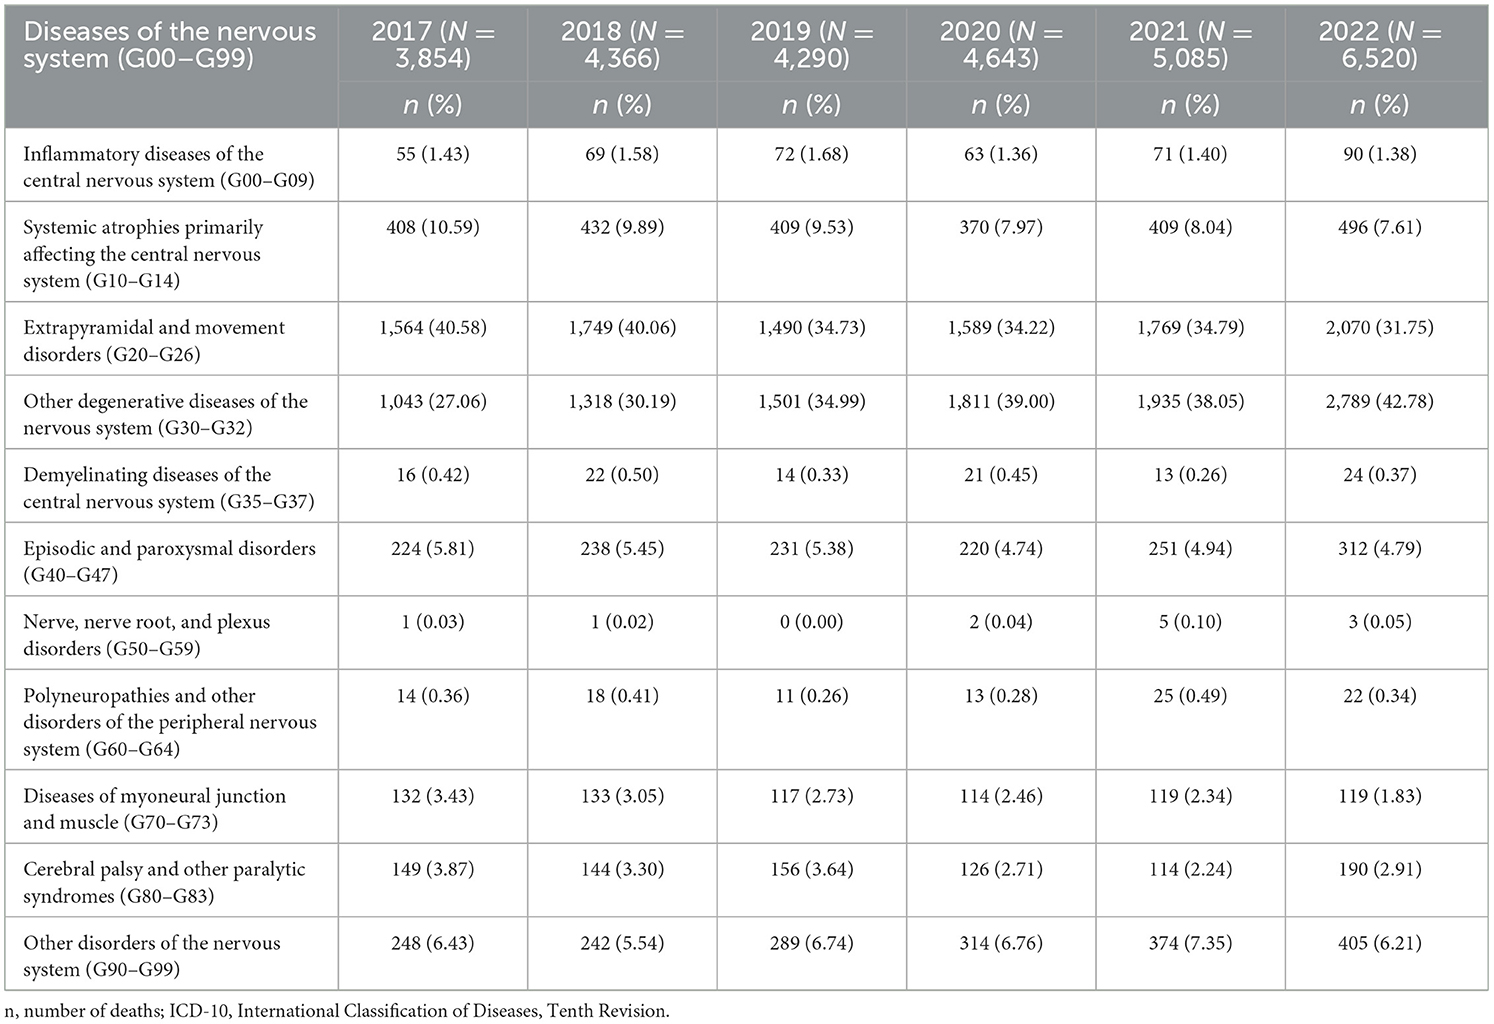
Table 2. Causes of death among people with disabilities by ICD-10-based diseases of the nervous system (G00–G99) from 2017 to 2022.
3.3.1 Diseases of the nervous system (G00–G99)
From 2017 to 2020, the number of deaths among people with disabilities due to diseases of the nervous system (G00–G99) increased. This number further increased during COVID-19, from 2020 to 2022. It is difficult to clearly observe the change in mortality rates among people with disabilities due to diseases of the nervous system (G00–G99) after COVID-19. However, the diseases that caused an increase in the number of deaths since 2020 compared with 2019 included extrapyramidal and movement disorder (G20–G26) and other generic disorders of the nervous system (G30–G32) (Table 2).
3.3.2 Certain infectious and parasitic diseases (A00–B99)
The number of individuals with certain infectious and parasitic diseases (A00-B99) among people with disabilities was 2,953 in 2020, 3,151 in 2021, and 3,254 in 2022, showing an increasing trend since COVID-19. However, the incidence of infectious intestinal diseases and tuberculosis decreased after COVID-19. In contrast, the incidence of other bacillary disorders (A30–A49) increased (Table 3).
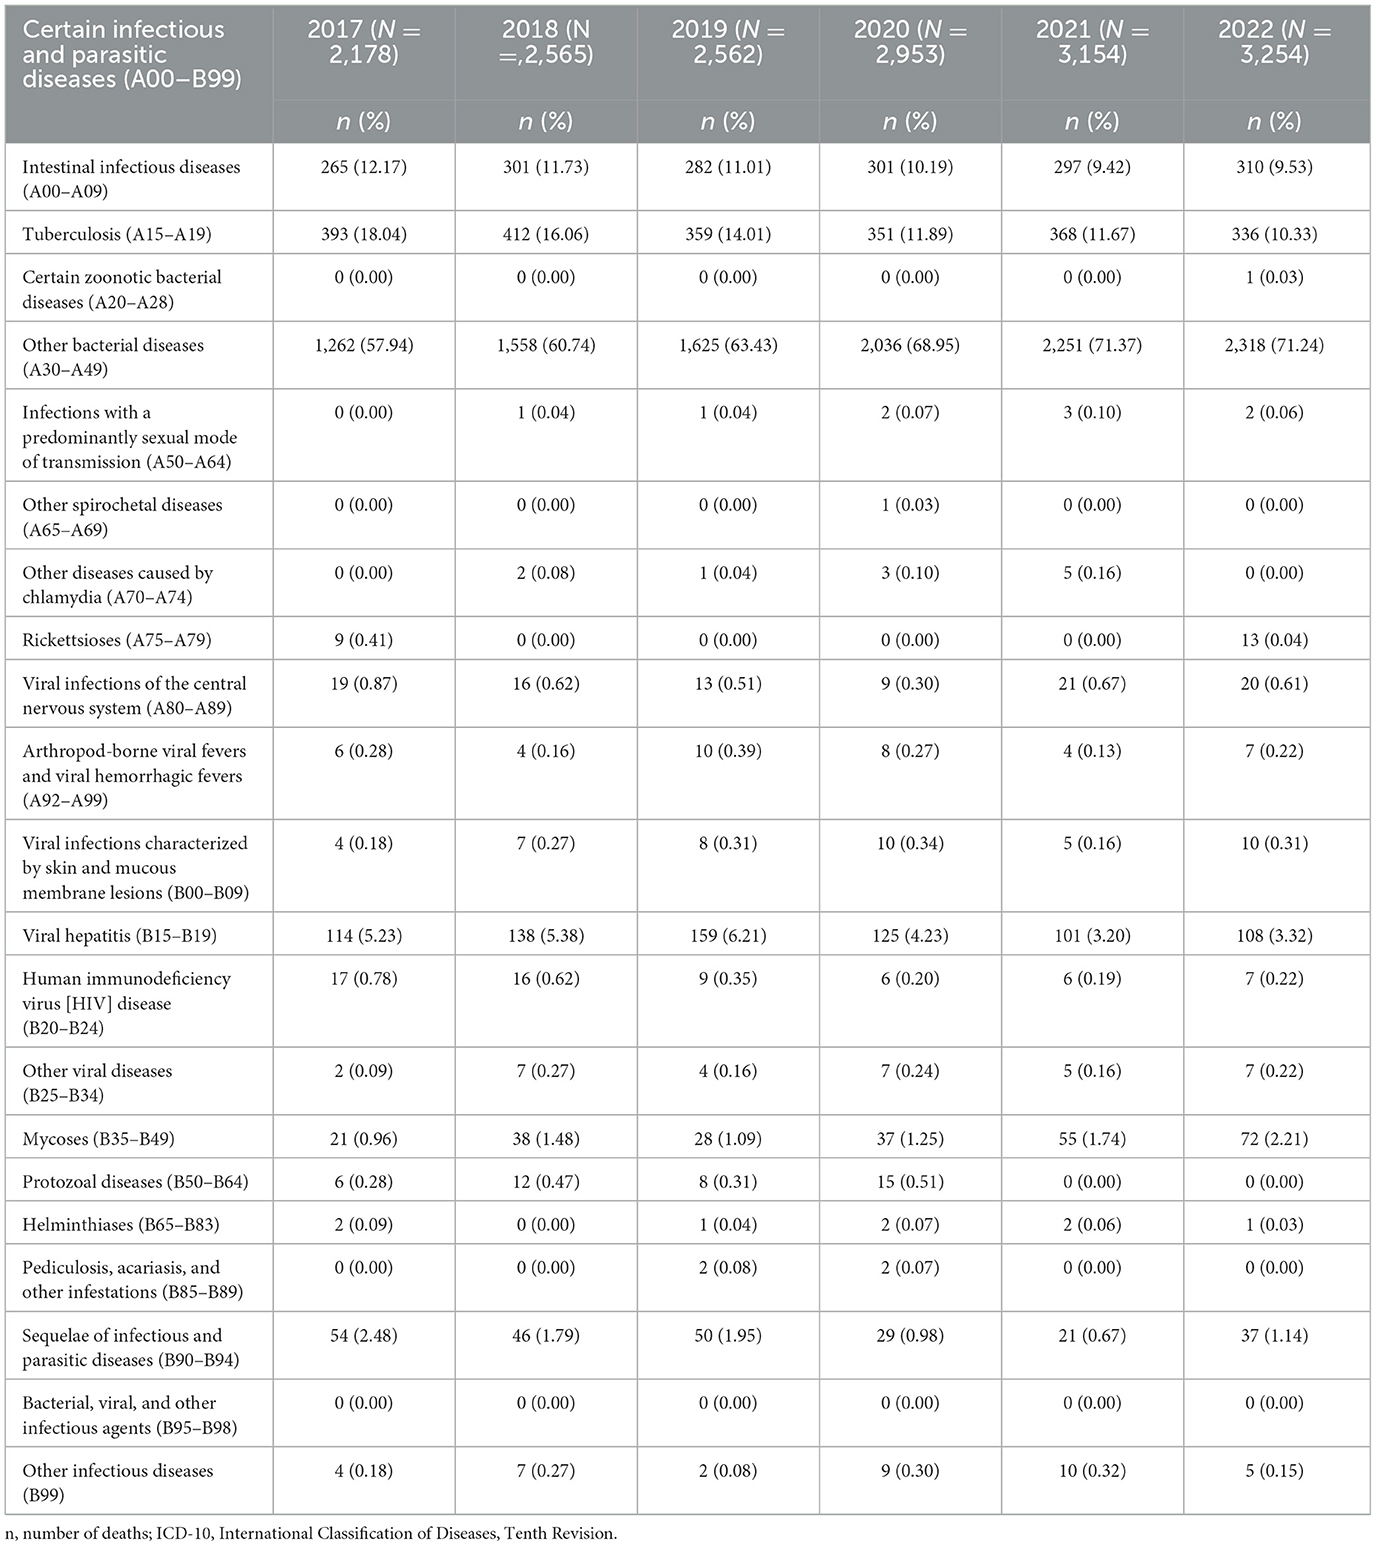
Table 3. Causes of death among people with disabilities by ICD-10-based certain infectious and parasitic diseases (A00–B99) from 2017 to 2022.
3.3.3 Diseases of the respiratory system (J00–J99)
In the 5-year study period, the incidence of diseases of the respiratory system (J00-J99) among people with disabilities increased. Particularly, in 2021, 11,648 people with disabilities were newly diagnosed with diseases of the respiratory system; more than those diagnosed in the 2017–2020 period. The incidence of influenza and pneumonia (J09–J18), other acute lower respiratory infections (J20–J22), and diseases of the respiratory system decreased after COVID-19. Contrarily, the incidence of lung diseases due to external agents (J60–J70), other respiratory diseases principally affecting the interstitium (J80–J84), other diseases of the pleura (J90–J94), and other diseases of the respiratory system (J95–J99) increased after COVID-19 (Table 4).
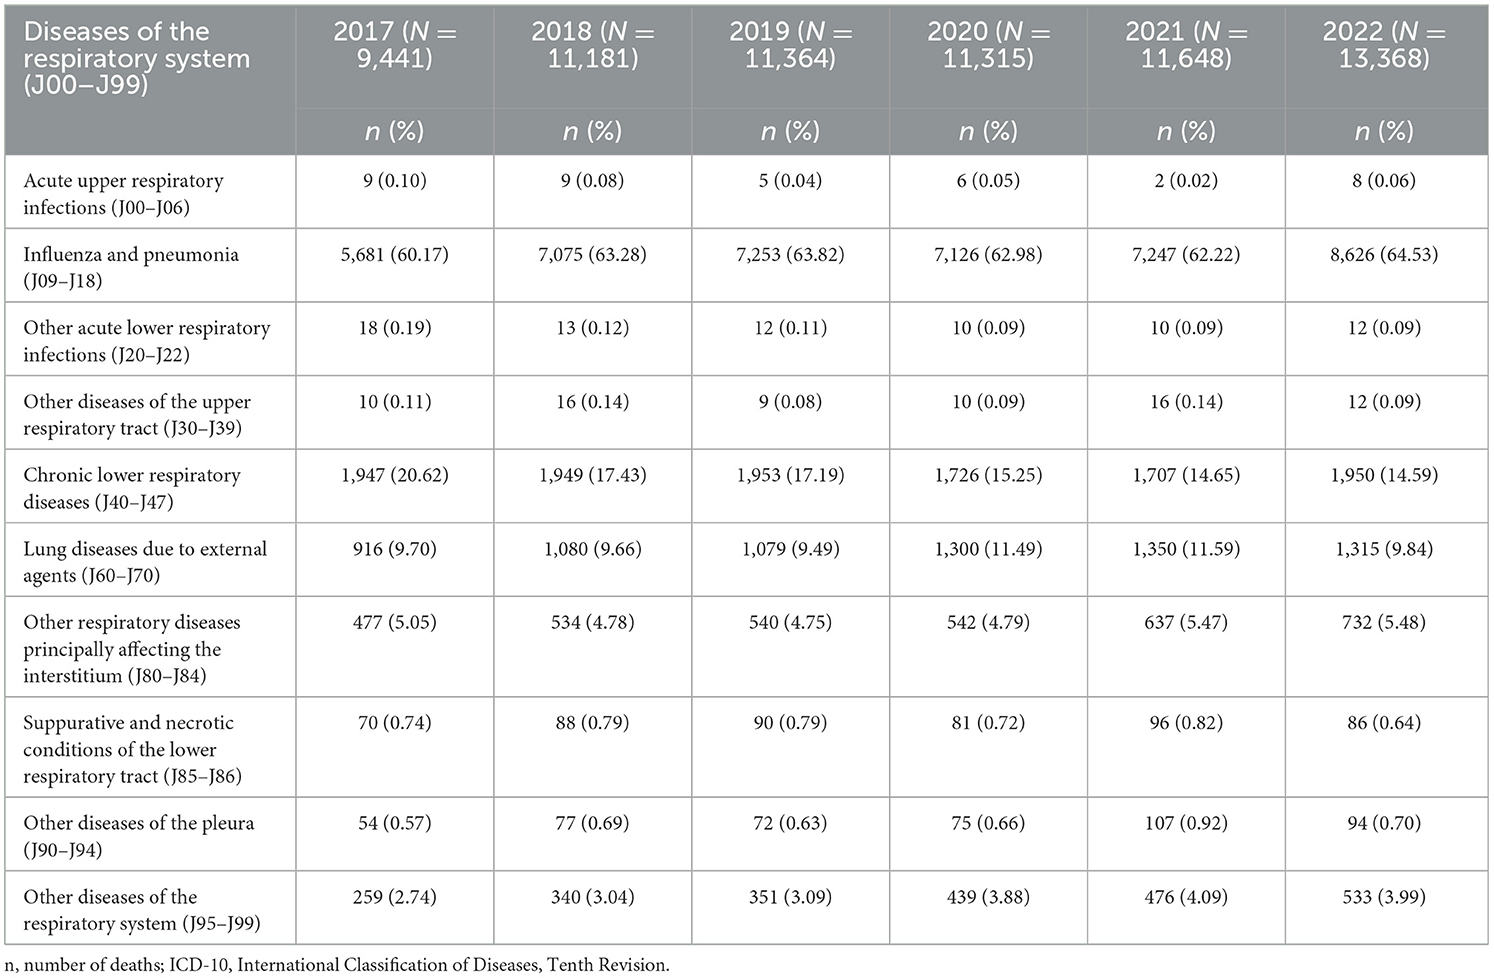
Table 4. Causes of death among people with disabilities by ICD-10-based diseases of the respiratory system (J00-J99) from 2017 to 2022.
3.4 Analysis of COVID-19-related deaths among people with disabilities from 2020 to 2022
As a multivariate analysis of COVID-19 deaths in people with disabilities, binomial logistic regression analysis was performed, and the odds ratio was calculated. Compared with males, females were significantly more likely to die from COVID-19 (p < 0.05). Compared with individuals under 30 years of age, the probability of death was 0.894-fold lower for those between 30 and 49 years of age, which was statistically significant (p = 0.0015). Compared with patients under the age of 30 years, those aged ≥ 70 years had a 1.41-fold higher probability of death, showing statistical significance. The risk of COVID-19 death in people with severe disabilities was 1.24-fold higher than that in those with mild disabilities, which was statistically significant (Table 5).
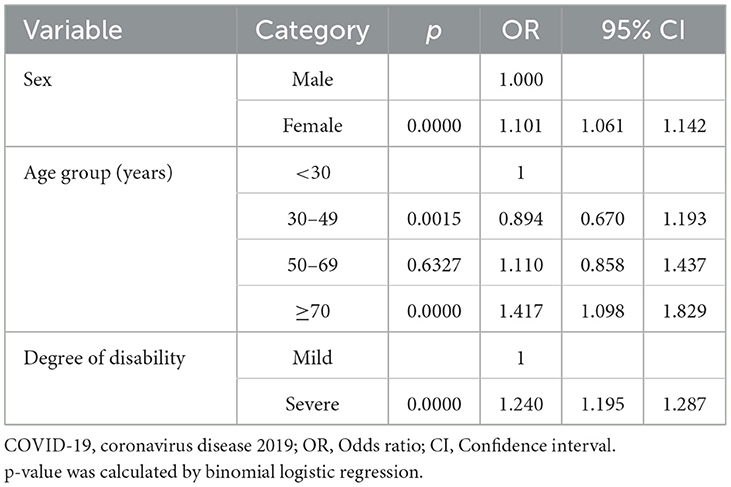
Table 5. Binomial logistic regression analysis of COVID-19 deaths among people with disabilities from 2020 to 2022.
4 Discussion
A database was established by linking data for registered people with disabilities in Korea with data from the Korea National Statistical Office (2017–2022), and mortality rate and cause of death were analyzed using the death database. The analysis of our findings in the context of previous studies is discussed below.
First, the number of deaths among people with disabilities due to COVID-19 increased in 2022 compared with 2020. The mortality rate due to COVID-19 increased from 9.2 people in 2020 to 396.9 people in 2022. The related gap between people with disabilities and the general population was 4.8-fold higher in 2020 and 6.5-fold higher in 2022 (23). According to a study by Kuper et al., the combined adjusted effect estimate for COVID-19-related mortality in people with disabilities compared with those without disabilities was 2.7-fold (95% confidence interval, 2.4–3.2) (24). The study highlighted that people with disabilities had a higher COVID-19-related mortality than the general population (25), despite the differences in degree of disability and country.
Second, there was a change in the causes of death during COVID-19 among people with disabilities, compared with that before COVID-19. During the COVID-19 pandemic, between 2020 and 2022, significant increases were observed in symptoms, signs, and abnormal clinical and laboratory findings, NEC (R00–R99), and provisional assignment of new diseases of uncertain etiology or emergency use (U00–U18). This means that R00–R99 in the ICD-10 code comprises fever (R50) and headache (R51) associated with COVID-19. Therefore, these increases due to COVID-19 are believed to be disease-induced (26).
Third, the cause of death related to COVID-19 in people with disabilities after COVID-19 was confirmed through ICD-10 code changes. The incidence of intestinal infectious diseases and tuberculosis, and certain infectious and parasitic diseases (A00–B99) decreased after COVID-19. This shows that continuous disease monitoring, prevention strategies, relevant knowledge, and health education following the COVID-19 epidemic can play a role in preventing and controlling intestinal infections associated with COVID-19 (27). In a previous study, the daily notification of tuberculosis outbreaks decreased by 30% during the COVID-19 pandemic (28), which aligns with the findings of this study.
In this study, the incidence of respiratory system diseases (J00–J99), including influenza and pneumonia (J09–J18) and other acute lower respiratory infections (J20–J22), decreased after COVID-19. The symptoms and signs of pulmonary tuberculosis are similar to those of respiratory virus infections, including COVID-19; thus, tuberculosis diagnosis might have been delayed during the COVID-19 pandemic (29). Additional observations are required to confirm whether the decline in tuberculosis diagnoses and intestinal infections continues after 2022, and further research on the causal relationship is required. Overall, the seasonal duration of influenza was shortened with COVID-19 prevention and control, and the positivity rate of influenza decreased significantly within 7–12 weeks in 2020 (28, 30). Generally, it was confirmed that respiratory infectious diseases decreased during the COVID-19 pandemic (28–31). In this study, the incidence of lung diseases due to external agents (J60–J70), other respiratory diseases principally affecting the interstitium (J80–J84), and other diseases of the pleura (J90–J94) increased during COVID-19. The mortality rate of respiratory diseases in Spain did not return to pre-pandemic levels in 2021 and was still high at 30.3% (95% CI 30.2–30.4) compared with the levels in 2019 (29, 31).
The study revealed that COVID-19 deaths in people with disabilities were associated with a higher risk in females, older adults, and people with severe disabilities. Similar to our findings, the mortality rate for COVID-19 among females with disabilities was 2- to 3-fold higher than that of males with disabilities (32–34). However, another study showed a 1.39-fold higher mortality rate in males with disabilities. In this study, the older the disabled person, the higher the COVID-19 mortality rate. This is consistent with previous studies reporting that people with disabilities over 65 years of age are more than twice as likely to die from COVID-19 (33). Additionally, we found that people with severe disabilities are at a significantly greater risk of dying from COVID-19 than people with mild disabilities; this finding is consistent with reported from previous studies (35, 36).
This study had some limitations. First, the observation period of this study after COVID-19 was short (37, 38). Therefore, a more accurate interpretations can only be obtained when longitudinal observational evidence has accumulated in the years to come. Second, this study analyzed data using the middle classification of the ICD-10 codes. Due to the limitations of the information provided by the National Statistical Office in Korea, it was impossible to analyze the ICD-10 codes further divided into sub- and detailed classifications. Consequently, we could only observe the comprehensive status of the investigation rate and cause of death related to COVID-19. Third, we did not conduct a detailed analysis of COVID-19-related diseases. Through a detailed analysis related to COVID-19, strategies to respond to diseases in the event of a new infectious disease, as well as COVID-19 itself, are required. However, through this study, the death patterns of people with disabilities in Korea after COVID-19 were broadly confirmed. However, it is also necessary to reveal the differences in the 15 types of disabilities in Korea, and international comparisons are also required.
This study sought to identify differences in patterns of causes of death for people with disabilities in South Korea before and during COVID-19. Accordingly, we aimed to comprehensively confirm the trend of the cause of death of people with disabilities from 2017 to 2022. Additionally, we confirmed differences in the COVID-19 mortality rate for people with disabilities by sex, age, and degree of disability. However, it is difficult to explain how COVID-19 affected people with disabilities and what factors put them at a higher risk compared with the general population. Therefore, these points will need to be addressed in future research.
5 Conclusions
Our findings revealed that the mortality rate among people with disabilities significantly increased during the COVID-19 pandemic compared with that from before the pandemic, and the rate was higher than that in the general population. Considering this high mortality rate among people with disabilities, it is important to address the attendant poor health risk factors to reduce the COVID-19 mortality gap between people with disabilities and the general population. Additionally, short- and long-term public health interventions addressing COVID-19 risks are required.
Data availability statement
The original contributions presented in the study are included in the article/supplementary material, further inquiries can be directed to the corresponding author.
Author contributions
Y-SK: Conceptualization, Supervision, Validation, Writing – original draft, Writing – review & editing. Ju-HK: Data curation, Validation, Methodology, Writing – original draft. SK: Formal analysis, Software, Writing – original draft. Jo-HK: Formal analysis, Software, Writing – original draft. H-JK: Validation, Visualization, Writing – original draft. SH: Conceptualization, Funding acquisition, Investigation, Project administration, Writing – original draft.
Funding
The author(s) declare financial support was received for the research, authorship, and/or publication of this article. This research was supported by grants (23-H-02 and 24-H-02) from the Korea National Rehabilitation Center and a grant (2023 MoHW) from the Ministry of Health and Welfare in South Korea.
Conflict of interest
The authors declare that the research was conducted in the absence of any commercial or financial relationships that could be construed as a potential conflict of interest.
Publisher's note
All claims expressed in this article are solely those of the authors and do not necessarily represent those of their affiliated organizations, or those of the publisher, the editors and the reviewers. Any product that may be evaluated in this article, or claim that may be made by its manufacturer, is not guaranteed or endorsed by the publisher.
References
1. World Health Organization. General's statement on IHR Emergency Committee on Novel Coronavirus. (2019). Available online at: https://www.who.int/director-general/speeches/detail/who-director-general-s-statement-on-ihr-emergency-committee-on-novel-coronavirus- (accessed August 7, 2023).
2. Korea Disease Control and Prevention Agency (2020). Current Status of Domestic Outbreak of COVID-19. Available online at: https://www.kdca.go.kr/board/board.es?mid=a20501010000&bid=0015&act=view&list_no=366403 (accessed August 7, 2023).
3. Korea Disease Control and Prevention Agency. Social Distancing Adjustment Plan. (2023). Available online at: https://www.kdca.go.kr/board/board.es?mid=a20501020000&bid=0015&list_no=719317&cg_code=C01&act=view&nPage=1 (accessed August 7, 2023).
4. Korean Culture and Information Service. Declaring the end of COVID-19… President Yoon “Restoration of daily life after 3 years and 4 months”. (2023). https://www.kocis.go.kr/koreanet/view.do?seq=1044801 (accessed August 7, 20230).
5. Yanez ND, Weiss NS, Romand JA, Treggiari MM. COVID-19 mortality risk for older men and women. BMC Public Health. (2020) 20:1742. doi: 10.1186/s12889-020-09826-8
6. Zhao HL, Huang YM, Huang Y. Mortality in older patients with COVID-19. J Am Geriatr Soc. (2020) 68:1685–7. doi: 10.1111/jgs.16649
7. Shahid Z, Kalayanamitra R, McClafferty B, Kepko D, Ramgobin D, Patel R, et al. COVID-19 and older adults: what we know. J Am Geriatr Soc. (2020) 68:926–9. doi: 10.1111/jgs.16472
8. Demetriou CA, Achilleos S, Quattrocchi A, Gabel J, Critselis E, Constantinou C, et al. Impact of the COVID-19 pandemic on total, sex- and age-specific all-cause mortality in 20 countries worldwide during 2020: results from the C-MOR project. Int J Epidemiol. (2023) 52:664–76. doi: 10.1093/ije/dyac170
9. Akter S. The gender gap in COVID-19 mortality in the United States. Feminist Econ. (2021) 27:30–47. doi: 10.1080/13545701.2020.1829673
10. Jain VK, Iyengar K, Vaish A, Vaishya R. Differential mortality in COVID-19 patients from India and western countries. Diabetes Metab Syndr. (2020) 14:1037–41. doi: 10.1016/j.dsx.2020.06.067
11. Mishra V, Seyedzenouzi G, Almohtadi A, Chowdhury T, Khashkhusha A, Axiaq A, et al. Health inequalities during COVID-19 and their effects on morbidity and mortality. J Healthc Leadersh. (2021) 13:19–26. doi: 10.2147/JHL.S270175
12. Kissler S, Tedijanto C, Lipsitch M, Grad YH. Social distancing strategies for curbing the COVID-19 epidemic. MedRxiv. (2020). doi: 10.1101/2020.03.22.20041079
13. Aslam F. COVID-19 and Importance of Social Distancing. (2020). doi: 10.20944/preprints202004.0078.v1
14. Russell FM, Greenwood B. Who should be priorotised for COVID-19 vaccination. Hum Vaccin Immunother. (2021) 17:1317–21. doi: 10.1080/21645515.2020.1827882
15. Saadi N, Chi YL, Ghosh S, Eggo RM, McCarthy CV, Quaife M, et al. Models of COVID-19 vaccine prioritisation: a systematic literature search and narrative review. BMC Med. (2021) 19:318. doi: 10.1186/s12916-021-02190-3
16. Güner R, Hasanoglu I, Aktaş F. COVID-19: Prevention and control measures in community. Turk J Med Sci. (2020) 50:571–7. doi: 10.3906/sag-2004-146
17. Girum T, Lentiro K, Geremew M, Migora B, Shewamare S. Global strategies and effectiveness for COVID-19 prevention through contact tracing, screening, quarantine, and isolation: a systematic review. Trop Med Health. (2020) 48:91. doi: 10.1186/s41182-020-00285-w
18. Emmanuel F, Hassan A, Ahmad A, Reza TE. Pakistan's COVID-19 prevention and control response using the World Health Organization's guidelines for epidemic response interventions. Cureus. (2023) 15:e34480. doi: 10.7759/cureus.34480
19. Kim J, Heo N, Kang H. Sex-based differences in outcomes of coronavirus disease 2019 (COVID-19) in Korea. Asian Nurs Res. (2022) 16:224–30. doi: 10.1016/j.anr.2022.07.003
20. Kang SJ, Jung SI. Age-related morbidity and mortality among patients with COVID-19. Infect Chemother. (2020) 52:154–64. doi: 10.3947/ic.2020.52.2.154
21. Ministry of Government Legislation. Database: Act on Welfare of Persons with Disabilities. (2023). Available online at: https://www.law.go.kr/LSW/eng/engLsSc.do?menuId=2§ion=lawNm&query=South+Korea+%E2%80%93+Welfare+law+for+Persons+with+Disabilities&x=0&y=0#liBgcolor0 (accessed August 10, 2023).
22. Korean Statistical Information Service. Number of the Registered Disabled-by Year, Types of Disability and Gender (the whole country). (2023). Available online at: https://kosis.kr/statHtml/statHtml.do?orgId=117&tblId=DT_11761_N001&conn_path=I2&language=en (accessed Nov 23, 2023).
23. Landes SD, Turk MA, Ervin DA. COVID-19 case-fatality disparities among people with intellectual and developmental disabilities: evidence from 12 US jurisdictions. Disabil Health J. (2021) 14:101116. doi: 10.1016/j.dhjo.2021.101116
24. Kuper H, Smythe T. Are people with disabilities at higher risk of COVID-19-related mortality?: a systematic review and meta-analysis. Public Health. (2023) 222:115–24. doi: 10.1016/j.puhe.2023.06.032
25. Seid AA, Woday Tadesse A, Hasen AA. Severity and mortality of COVID-19 among people with disabilities: protocol for a systematic review and meta-analysis. BMJ Open. (2022) 12:e061438. doi: 10.1136/bmjopen-2022-061438
26. Sariyer G, Ataman MG, Mangla SK, Kazancoglu Y, Dora M. Big data analytics and the effects of government restrictions and prohibitions in the COVID-19 pandemic on emergency department sustainable operations. Ann Oper Res. (2023) 328:1073–103. doi: 10.1007/s10479-022-04955-2
27. Chen B, Wang M, Huang X, Xie M, Pan L, Liu H, et al. Changes in incidence of notifiable infectious diseases in China under the prevention and control measures of COVID-19. Front Public Health. (2021) 9:728768. doi: 10.3389/fpubh.2021.728768
28. Dey A, Roy I, Chakrabartty AK, Choudhury A, Lahiri A. Changing patterns of household transmission of tuberculosis in an eastern state of India: the impact of COVID19 pandemic. Indian J Tuberc. (2022) 69:682–9. doi: 10.1016/j.ijtb.2022.03.001
29. Cilloni F, Fu H, Vesga JF, Dowdy D, Pretorius C, Ahmedov S, et al. The potential impact of the COVID-19 pandemic on the tuberculosis epidemic a modelling analysis. EClinicalMedicine. (2020) 28:100603. doi: 10.1016/j.eclinm.2020.100603
30. Garcia-Olive I, Lopez Seguí F, Hernandez Guillamet G, Vidal-Alaball J, Abad J, Rosell A. Impact of the COVID-19 pandemic on diagnosis of respiratory diseases in the Northern Metropolitan Area in Barcelona (Spain). Med Clin (Engl Ed). (2023) 160:392–6. doi: 10.1016/j.medcli.2022.11.021
31. Soriano JB, Peláez A, Fernández E, Ancochea J. Impact of the COVID-19 pandemic in mortality due to respiratory diseases: a comparative analysis of 2021 and 2020 vs 2019 in Spain. Med Clin (Barc). (2023) 161:192–8. doi: 10.1016/j.medcli.2023.04.020
32. Deal JA, Jiang K, Betz JF, Clemens GD, Zhu J, Reed NS, et al. COVID-19 clinical outcomes by patient disability status: A retrospective cohort study. Disabil Health J. (2023) 16:101441. doi: 10.1016/j.dhjo.2023.101441
33. Weaver DA. The mortality experience of disabled persons in the United States during the COVID-19 pandemic. Health Aff. (2024) 2:qxad082. doi: 10.1093/haschl/qxad082
34. Lunsky Y, Durbin A, Balogh R, Lin E, Palma L, Plumptre L. COVID-19 positivity rates, hospitalizations and mortality of adults with and without intellectual and developmental disabilities in Ontario, Canada. Disabil Health J. (2022) 15:101174. doi: 10.1016/j.dhjo.2021.101174
35. Xie Z, Hong YR, Tanner R, Marlow NM. People with functional disability and access to health care during the COVID-19 pandemic: a US population-based study. Med Care. (2023) 61:58–66. doi: 10.1097/MLR.0000000000001765
36. Fumagalli C, Ungar A, Rozzini R, Vannini M, Coccia F, Cesaroni G, et al. Predicting mortality risk in older hospitalized persons with COVID-19: a comparison of the COVID-19 mortality risk score with frailty and disability. J Am Med Dir Assoc. (2021) 22:1588–92. doi: 10.1016/j.jamda.2021.05.028
37. Wang J-L, Xiao X-L, Zhang F-F, Pei X, Li M-T, Zhang J-P et al. Forecast of peak infection and estimate of excess deaths in COVID-19 transmission and prevalence in Taiyuan City, 2022 to 2023. Infect Dis Modell. (2024) 9:56–69. doi: 10.1016/j.idm.2023.11.005
Keywords: COVID-19, mortality, people with disability, South Korea, infection
Citation: Kim Y-S, Kim J-H, Kwon S, Kim J-H, Kim H-J and Ho SH (2024) Mortality trends in people with disabilities before and during the COVID-19 pandemic in South Korea, 2017–2022. Front. Public Health 12:1414515. doi: 10.3389/fpubh.2024.1414515
Received: 09 April 2024; Accepted: 08 July 2024;
Published: 25 July 2024.
Edited by:
Ritthideach Yorsaeng, Chulalongkorn University, ThailandReviewed by:
Fanpu Ji, Second Affiliated Hospital of Xi'an Jiaotong University, ChinaHatem Kallel, Hôpital de Cayenne, French Guiana
Copyright © 2024 Kim, Kim, Kwon, Kim, Kim and Ho. This is an open-access article distributed under the terms of the Creative Commons Attribution License (CC BY). The use, distribution or reproduction in other forums is permitted, provided the original author(s) and the copyright owner(s) are credited and that the original publication in this journal is cited, in accordance with accepted academic practice. No use, distribution or reproduction is permitted which does not comply with these terms.
*Correspondence: Seung Hee Ho, aHNoN0Brb3JlYS5rcg==