 Matthias Hans Belau
- University Medical Centre Hamburg-Eppendorf, Institute of Medical Biometry and Epidemiology, Hamburg, Germany
Background: Adverse socioeconomic conditions at the individual and regional levels are associated with an increased risk of mortality. However, few studies have examined this relationship using multilevel analysis and, if so, only within a single country. This study aimed to examine this relationship using data from several European countries.
Methods: Individual-level data were obtained from Waves 5 to 9 of the Survey of Health, Ageing and Retirement in Europe, while regional-level data were obtained from the Luxembourg Income Study Database. Cox regression analysis with gamma-shared frailty and a random intercept for country of residence was used to examine the association between individual mortality from all causes, cancer, heart attack, and stroke and measures of socioeconomic deprivation at the individual level, including material and social deprivation indices, and at the area level, including the Gini index.
Results: The risk of mortality from all causes was increased for respondents with material deprivation (hazard ratio (HR) = 1.77, 95% CI = [1.60, 1.96]) and social deprivation (HR = 7.63, 95% CI = [6.42, 9.07]) compared with those without. A similar association was observed between individual deprivation and the risk of mortality from cancer, heart attack, or stroke. Regional deprivation had a modest contextual effect on the individual risk of death from all causes and cancer. However, when individual-level deprivation was included in the models, no contextual effects were found.
Conclusion: The results indicate that individual socioeconomic conditions significantly predict causes of death in older European adults, with those with material deprivation and social deprivation having a higher risk of death from all causes, including cancer, heart attack, and stroke, while the Gini index has a minimal effect, although the Gini index reflects regional disparities across Europe.
Introduction
Life expectancy has increased markedly in numerous European countries over the past few decades (1). This favorable trend can be attributed to advances in the diagnosis, treatment, and prevention of common diseases that are major causes of death (2–4). Nevertheless, despite these improvements, cardiovascular disease and cancer, with a median onset age of 65–70 years (5–8), remain the leading causes of death in Europe (9, 10). They also have a significant economic impact (11).
It has been proposed that adverse socioeconomic conditions at the individual and regional levels contribute to the development of cardiovascular disease, including ischemic heart disease [i.e., heart attack (12–14)] and cerebrovascular disease [i.e., stroke (15, 16)]. Furthermore, studies have demonstrated associations between socioeconomic indicators and certain cancers (17–19).
The concept of individual socioeconomic status is constituted by a complex network of interrelated factors that are inextricably linked to an individual’s material and social context. Such factors include, but are not limited to, educational attainment, income, and occupation (20). Nevertheless, income-based measures may prove to be particularly inadequate proxies for material conditions in older individuals, for example, when they are retired (21). In addition to the potential for financial losses, the transition to retirement is frequently accompanied by alterations in an individual’s social networks and participation in shared activities (22, 23). These changes have the potential to influence an individual’s health (24, 25) and quality of life (26). In contrast, regional socioeconomic measures, as exemplified by single measures or multidimensional deprivation indices, focus on material and social indicators at the area level (27, 28).
The extant literature examines the relationship between individual or regional socioeconomic measures and the underlying causes of death within a country. However, few studies have considered both individual and regional levels of analysis simultaneously using a multilevel approach, which constrains the inferences that can be drawn from existing studies. Moreover, there are notable socioeconomic and health disparities between European countries, as evidenced by the findings of numerous studies (29, 30), which further constrains the external validity of these studies.
The objective of this study was to examine the association between socioeconomic deprivation and the actual causes of death among older people in the European Region, with consideration of area-level information in addition to individual-level information. The hypothesis was that elevated mortality risk is associated with higher levels of socioeconomic deprivation at both the individual and area levels.
Materials and methods
Study population and procedure
The data from Waves 5 to 9 of the Survey of Health, Ageing and Retirement in Europe (SHARE) (31) were subjected to analysis. The SHARE population included individuals aged 50 and older and their spouses and partners, regardless of age, from 14 European countries and Israel who were permanent residents of each country. Individual data were available at the major socioeconomic region level (NUTS 1) for respondents in Belgium, Germany, Israel, Italy, Slovenia, Spain (only the Autonomous Community of Este), and Sweden, and at the country level (NUTS 0) for respondents in Austria, the Czech Republic, Denmark, Estonia, France, Luxembourg, the Netherlands, Spain (excluding the Autonomous Community of Este), and Switzerland. Wave 5, which was administered in 2013, encompassed computer-assisted personal interview data for 66,038 individuals. This data included information on individual-level socioeconomic deprivation, specifically on material and social deprivation. Subsequent follow-up was conducted approximately every 2 years for a period exceeding 8 years (Waves 6 to 9). This included information on vital status and disease burden. A total of 9,509 respondents lacked information on material and social deprivation and thus were excluded from the analysis. In addition, 968 respondents were less than 50 years of age and were also excluded, as the deprivation index utilized (see below) is validated for the 50-year-old and older population (32). The final analytical sample consisted of N = 55,561 individuals for the material and social deprivation and cause of death analyses.
Measures
Ascertainment of vital status
Information on vital status was obtained from the status of their participation in the follow-up period. If a participant completed the survey in the corresponding Waves 6 to 9, their vital status was designated as “alive.” When information was available on individuals who died during the follow-up period, the cause of death was documented by conducting an “end-of-life interview” with close relatives of the deceased respondent. The outcomes of interest in this study were all-cause death and death due to public health causes, including cancer, stroke, and heart attack. The reported time of death (month/year) was defined as the endpoint of the observation period.
Area-level variable
The Gini index was employed to evaluate regional deprivation for each country and for the corresponding SHARE Wave 5 to 9 years. This approach is consistent with that employed in other studies that have examined area-level socioeconomic deprivation in European countries (33, 34). The Gini index is a measure of the extent to which the distribution of income or consumption among individuals or households within an economy deviates from a perfectly equal distribution. The Gini index is defined on a scale of 0 to 100, with higher values indicating greater levels of inequality. The data were obtained from the Luxembourg Income Study (LIS) Database (35), which contains harmonized microdata collected from approximately 50 countries across Europe, North America, Latin America, Africa, Asia, and Australasia, spanning five decades. The Gini indices utilized in this analysis were constructed with weighted data on household income from population surveys conducted during the SHARE Waves 5 to 9 (i.e., in the years 2013, 2015, 2017, 2019, and 2021). It is important to note that the Gini index does not indicate the absolute level of income of the population. This implies that an area or country with a very low absolute income can have an equal income distribution and still have a very poor population. Consequently, an adjustment was made for the relative poverty rate, as detailed below.
Individual-level variables
Material deprivation was operationalized at the individual level by aggregating 11 items related to the affordability of basic needs and the prevalence of financial difficulties (36). The items are listed in Table 1 and described in detail elsewhere (37). They address various aspects of economic circumstances. These include the ability to afford meat or fruit more than three times per week, the affordability of specific items such as groceries and vacations, the necessity to limit expenses in items such as footwear or heating to maintain affordable living costs, and the inability to access medical care due to financial constraints. The material deprivation index (MDI) aggregates binary indicators on whether an individual is deprived of a specific item, employing so-called “hedonic weights” derived from a multiple regression of all items on a single life satisfaction measure (32, 36). The final MDI is defined on a scale from 0 to 1, with higher values indicating a greater degree of deprivation.
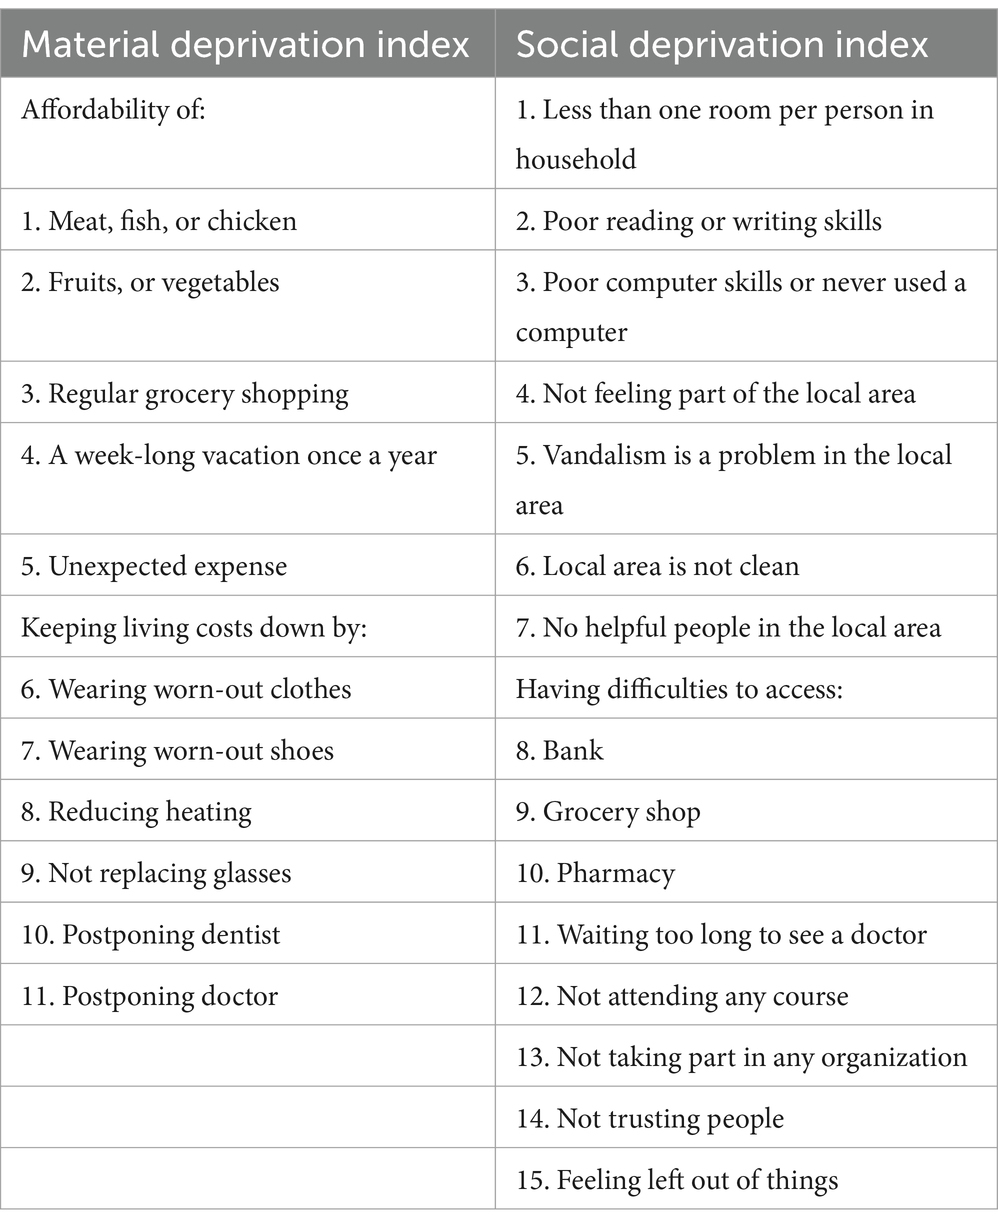
Table 1. Material and social deprivation items.
Social deprivation was operationalized at the individual level by aggregating 15 items related to participation in everyday life, social activities, and the quality of the neighborhood. The items are listed in Table 1 and described in detail in another source (38). They comprise social isolation and lack of social support, as well as normative integration. The social deprivation index (SDI) also aggregates binary indicators on whether an individual is deprived of a specific item, employing the “hedonic weights” derived from a multiple regression of all items on a single life satisfaction measure (32, 36, 38). The final SDI is defined on a scale from 0 to 1, with higher values indicating a greater degree of deprivation.
Covariates
Area-level covariates encompass data on the percentage of the migrant population and the relative poverty rate. The data were obtained from the Luxembourg Income Study (LIS) Database (35). The relative poverty rate represents the proportion of households whose incomes fall below the median equivalized household disposable income in the total population and corresponding year. Covariates at the individual level encompass data on age, sex (female, male), education (low, medium, high), migration background (absent, one-sided, two-sided), and disease burden. A two-sided migration background is defined as the case of individuals with both parents who are citizens of a foreign country or who were born in a country other than the one in which they currently reside. In contrast, a one-sided migration background is defined as the case of individuals with only one parent who is a citizen of a foreign country or who was born in a country other than the country in which the respondent currently resides. The disease burden was quantified through a modified version of the Charlson comorbidity index (39, 40), wherein the following diseases (ever diagnosed) were assigned weighted scores: a score of two was assigned to conditions including heart attack or congestive heart failure, Alzheimer’s disease or dementia, cancer, and stroke; a score of one was assigned to chronic pulmonary disease, rheumatologic disease, and diabetes. Subsequently, the index was calculated by summing the weighted scores of diseases self-reported by the individuals, with higher scores indicating a greater burden of disease.
Statistical analysis
Descriptive statistics were employed to ascertain respondents’ and country-specific characteristics. To illustrate the regional distribution of the Gini index, a quintile-based choropleth map was created. Furthermore, Kaplan–Meier curves were created for all-cause mortality among subgroups of MDI, categorized into unexposed (due to a spike at zero, as illustrated below) and tertiles of MDI greater than zero (low, medium, high) and SDI, categorized into quartiles (low, medium-low, medium-high, high). The association between socioeconomic deprivation and individual mortality was evaluated using a Cox regression model with gamma shared frailty and a random intercept for country of residence. The independent variables considered in the regression models for all-cause mortality (model 1), cancer mortality (model 2), heart attack mortality (model 3), and stroke mortality (model 4) were the Gini index (basic model) as well as MDI and SDI (full model). These variables were analyzed as continuous variables. To account for demographic and health differences, the regression models (basic and full models) were adjusted for the aforementioned area-level and individual-level covariates. Explained variation (R2) for basic and full survival models was measured according to Royston (41). As the exposure variable MDI comprises positive continuous values with a spike at zero (SAZ), a number of different linear methods were evaluated for model selection. These included (i) modeling the SAZ variable continuously and untransformed, (ii) modeling it using the fractional polynomial (FP) approach, (iii) modeling it continuously and untransformed, including a binary indicator for SAZ, and (iv) modeling it using the FP method, including a binary indicator for the SAZ, as proposed by Lorenz and colleagues (42). The results of the model selection for each outcome of interest can be found in Supplementary material S1. The association between individual socioeconomic deprivation and individual mortality stratified by quintiles of the Gini index was also examined. The stratified models were adjusted for the aforementioned area-level and individual-level covariates to account for potential confounding factors. The proportional hazards assumption was evaluated through a graphical examination of the Schoenfeld residuals, and no serious violation of the assumption was observed. Associations were presented as hazard ratios (HR) and 95% confidence intervals (CI). All analyses were performed with STATA/MP 18.
Results
Table 2 provides a summary of the characteristics of the study population for SHARE Waves 5 to 9. The sample was composed of slightly more women (55.8%) than men (44.2%), and the majority of the participants did not have a migration background (80.9%). The mean age of the participants was 69.4 years. One-fourth of the participants reported high levels of education.
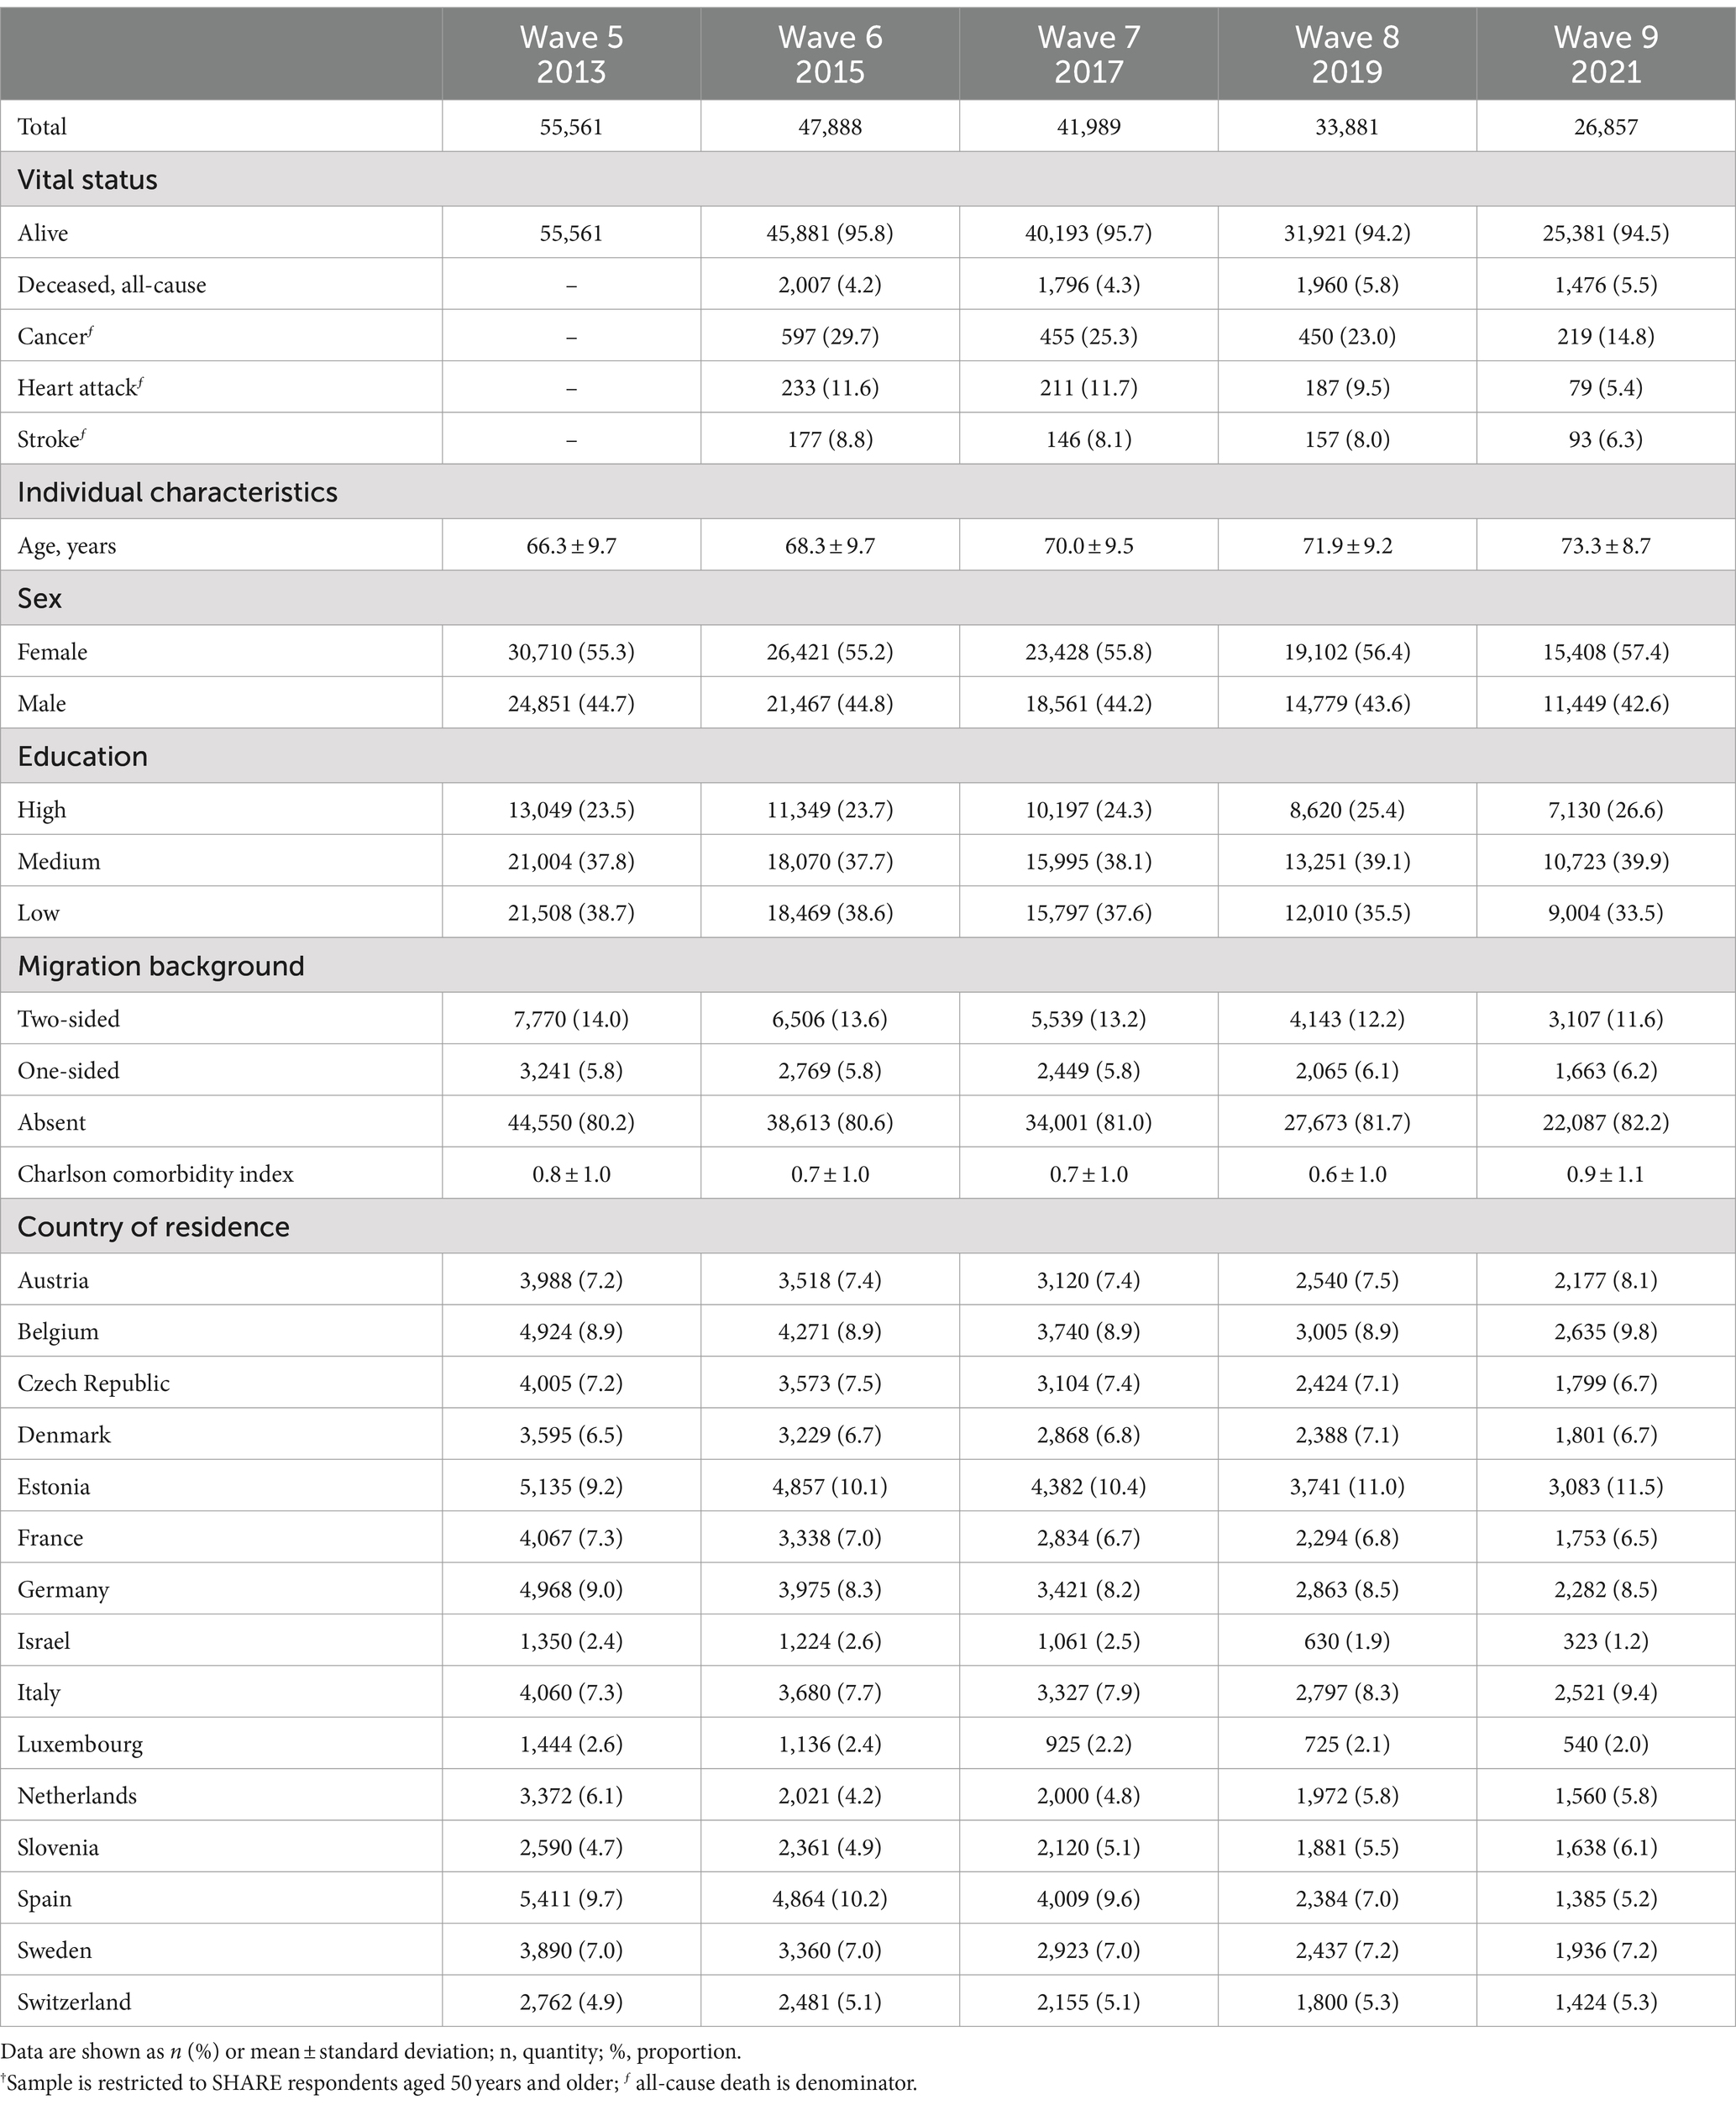
Table 2. Characteristics of the SHARE study population† by Wave.
The country’s Gini index exhibited a range from a minimum of 24.9 in the Czech Republic to a maximum of 40.7 in Israel, with a mean value of 29.4 and a standard deviation of 2.9 across all countries. Figure 1 depicts the regional disparities observed in the distribution of the Gini index quintiles. A more detailed illustration of the country’s Gini index across SHARE Waves 5 to 9 can be found in Supplementary material S2. The distribution of the relative poverty rate and the percentage of the migrant population can be found in Supplementary materials S3, S4, respectively.
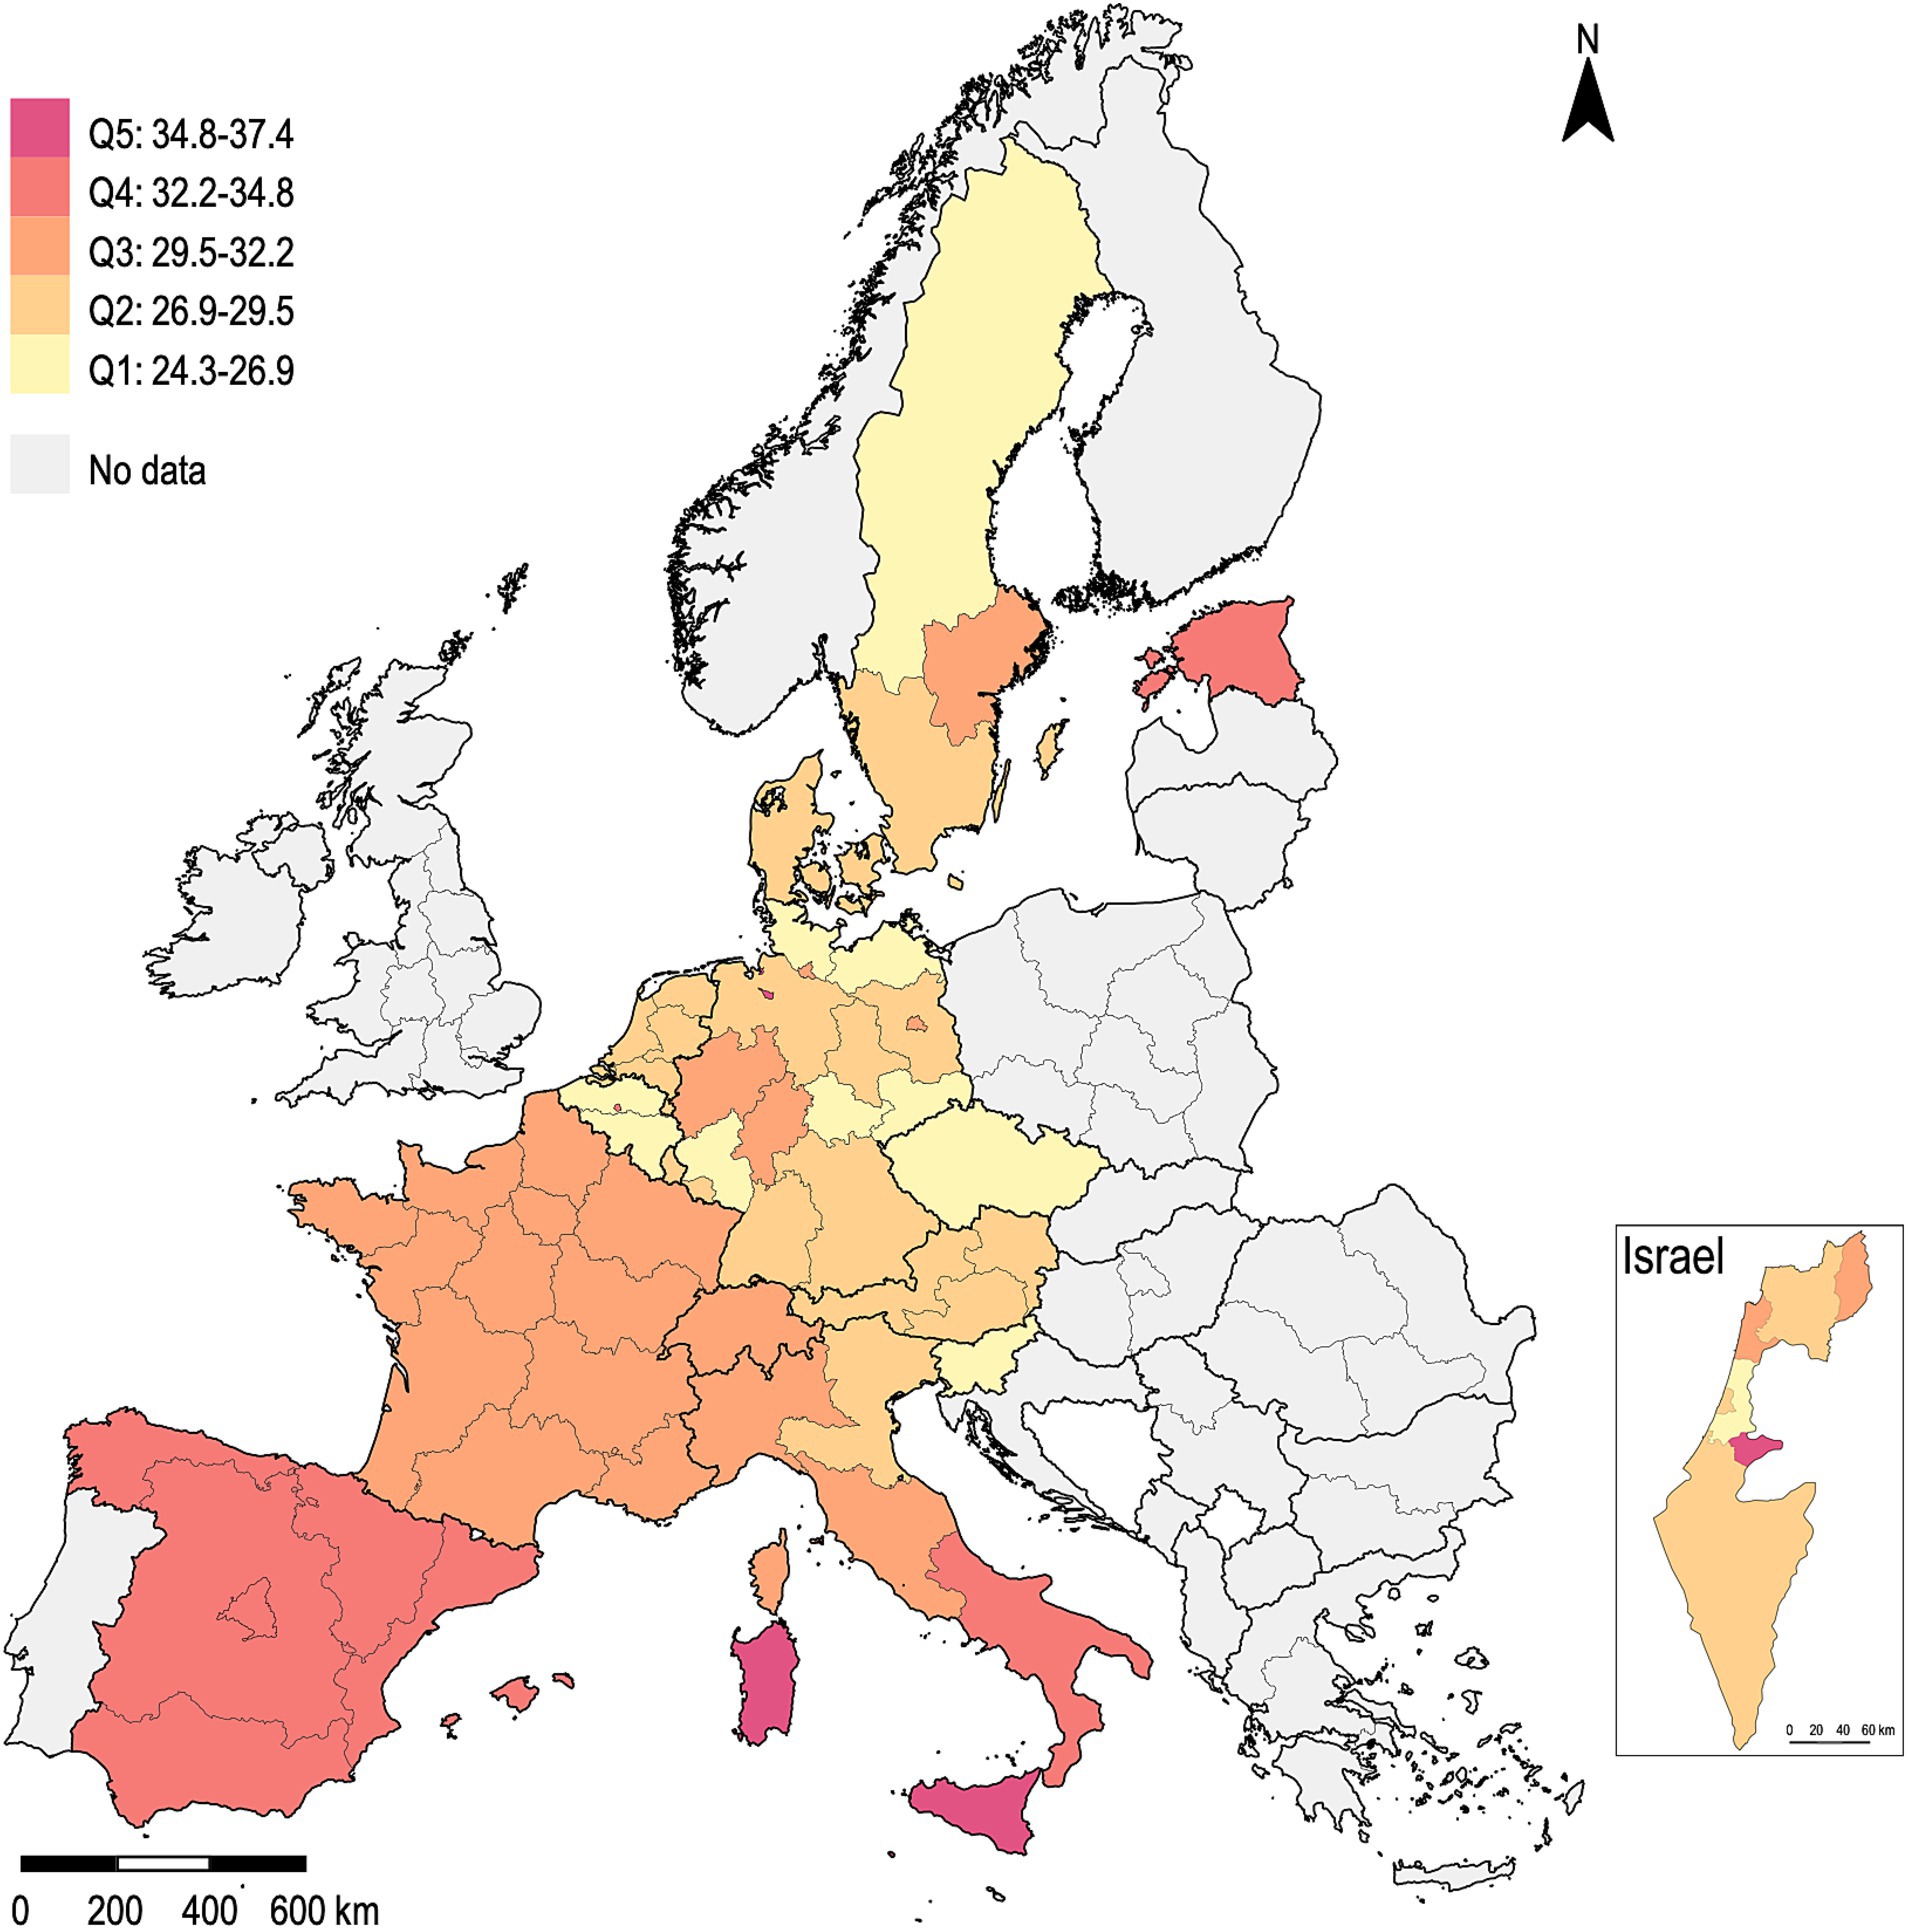
Figure 1. Distribution of the Gini index, the arithmetic mean of the years 2013 to 2021.
The mean value ± standard deviation for material deprivation index (MDI) was 0.13 ± 0.19 (min, max: 0.00, 0.99) across all countries, while that for social deprivation index (SDI) was 0.17 ± 0.14 (min, max: 0.00, 0.92). The respondents from Denmark exhibited the lowest mean values for both MDI = 0.04 and SDI = 0.09, while those from Estonia (MDI = 0.31, SDI = 0.22) and Italy (MDI = 0.21, SDI = 0.24) demonstrated the highest.
Figure 2 illustrates the all-cause survivor function for discrete subgroups of MDI (Figure 2A) and SDI (Figure 2B). Individuals who were not exposed to material deprivation (51.8%) and those with low MDI (19.0%) exhibited superior survival outcomes compared to those with medium and high MDI. A comparable pattern can be discerned regarding SDI, albeit with a more pronounced survival advantage from low to high SDI quartiles.
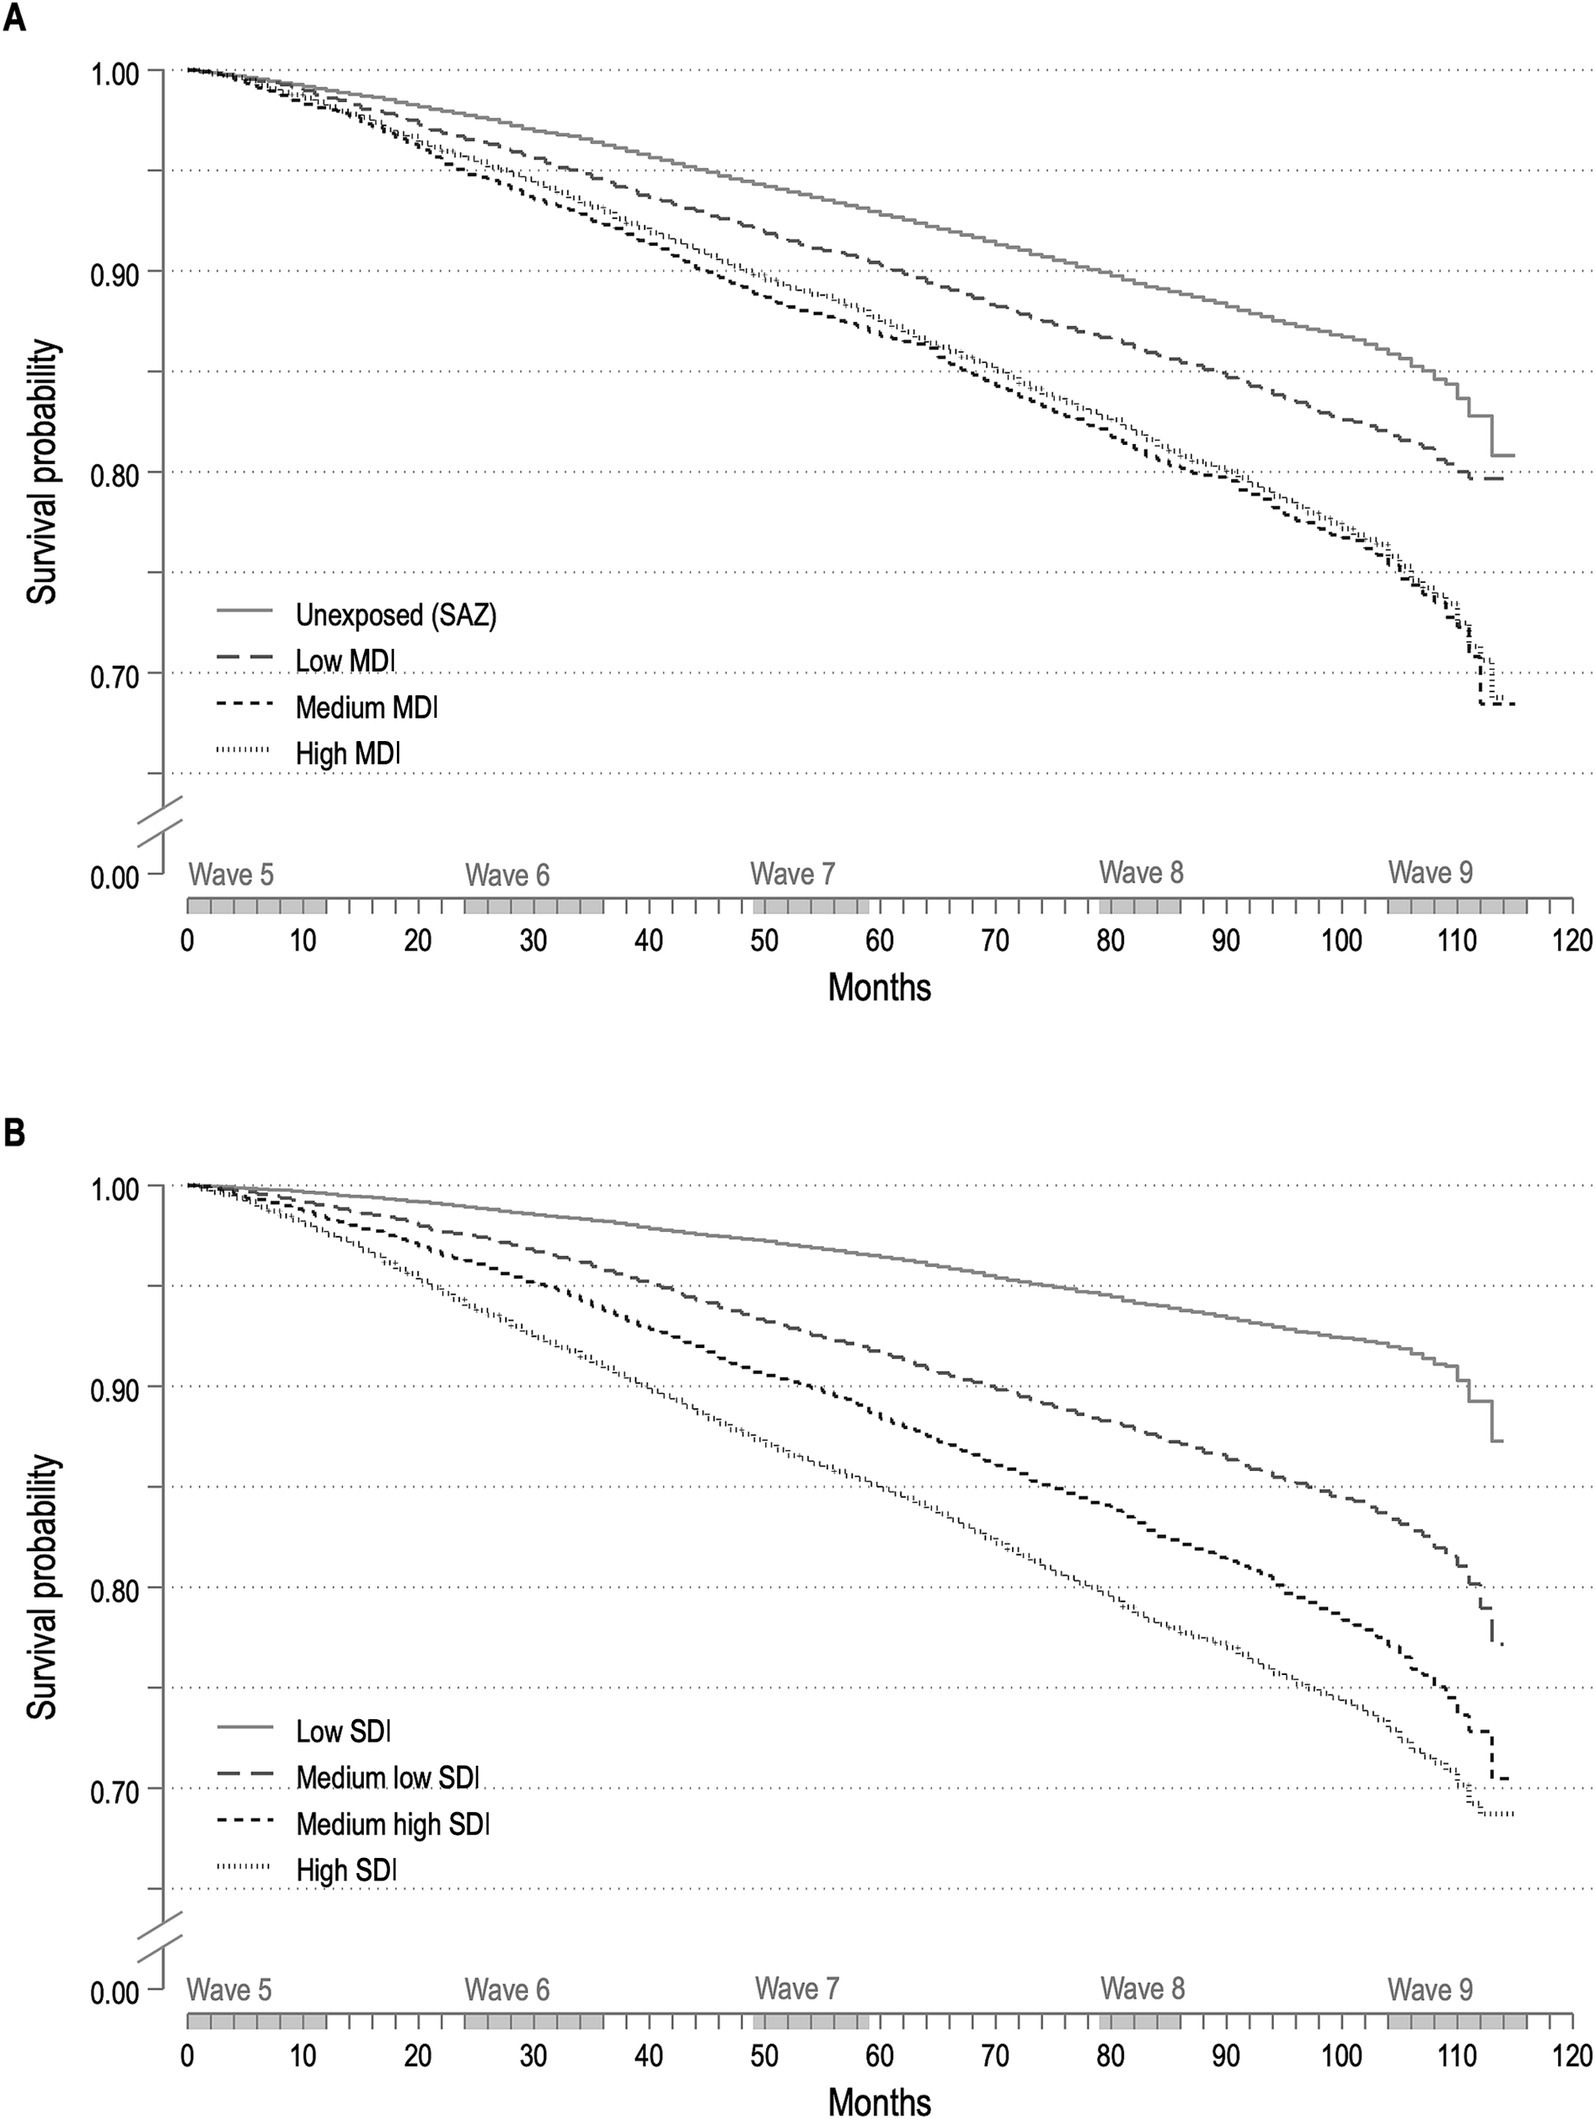
Figure 2. Kaplan–Meier estimates for material deprivation (A) and social deprivation (B) categories.
The results of the adjusted Cox regression between the Gini index and individual mortality (basic model) indicated a positive association between higher levels of regional income inequality and an increased risk of mortality from all causes (HR = 1.06, 95% CI = [1.02, 1.10], R2 = 0.738). However, no association was observed between the Gini index and the risk of mortality from cancer (HR = 1.03, 95% CI = [0.98, 1.07], R2 = 0.515), heart attack (HR = 1.05, 95% CI = [0.98, 1.13], R2 = 0.707) or stroke (HR = 1.00, 95% CI = [0.89, 1.07], R2 = 0.759).
Figure 3 presents HRs and 95% CIs for the effects of individual-level socioeconomic deprivation and the Gini index on individual mortality risk (full model). The full model results, including estimates for covariates, are provided in Supplementary material S5. The results demonstrate that SDI exerts a larger effect on mortality in terms of HR. In Model 1 (R2 = 0.764), there was no longer evidence for a relationship between the Gini index and the individual all-cause mortality risk. However, the mortality risk for respondents with social deprivation was more than seven times that of respondents without social deprivation (HR = 7.63, 95% CI = [6.42, 9.07]). Similarly, respondents with material deprivation exhibited a higher risk of mortality than those without (HR = 1.77, 95% CI = [1.60, 1.96]). Similarly, Model 2 (R2 = 0.531) also revealed no relationship between the Gini index and the individual cancer mortality risk. Nevertheless, respondents with material and social deprivation exhibited a mortality risk that was more than twice that of respondents without material (HR = 2.00, 95% CI = [1.50, 2.65]) and social deprivation (HR = 2.77, 96% CI = [1.90, 4.04]), respectively. The results of Model 3 (R2 = 0.749) demonstrate that respondents with material and social deprivation exhibited a mortality risk due to heart attack that was more than three times and eight times higher, respectively, than that observed in individuals without material (HR = 3.65, 95% CI = [2.42, 5.52]) and social deprivation (HR = 7.21, 95% CI = [4.18, 12.41]). However, no evidence was found to indicate a relation between the Gini index and the individual risk of mortality from heart attacks. The results of Model 4 (R2 = 0.785) indicate that individuals with material deprivation exhibited a higher risk of stroke mortality in comparison to those without (HR = 1.95, 95% CI = [1.37, 2.77]). In contrast, the risk of stroke mortality for those with social deprivation was eight times that of individuals without (HR = 7.94, 95% CI = [4.36, 14.45]). As with the preceding disease-specific models, no evidence was found to indicate a relation between the Gini index and the individual risk of mortality from stroke.
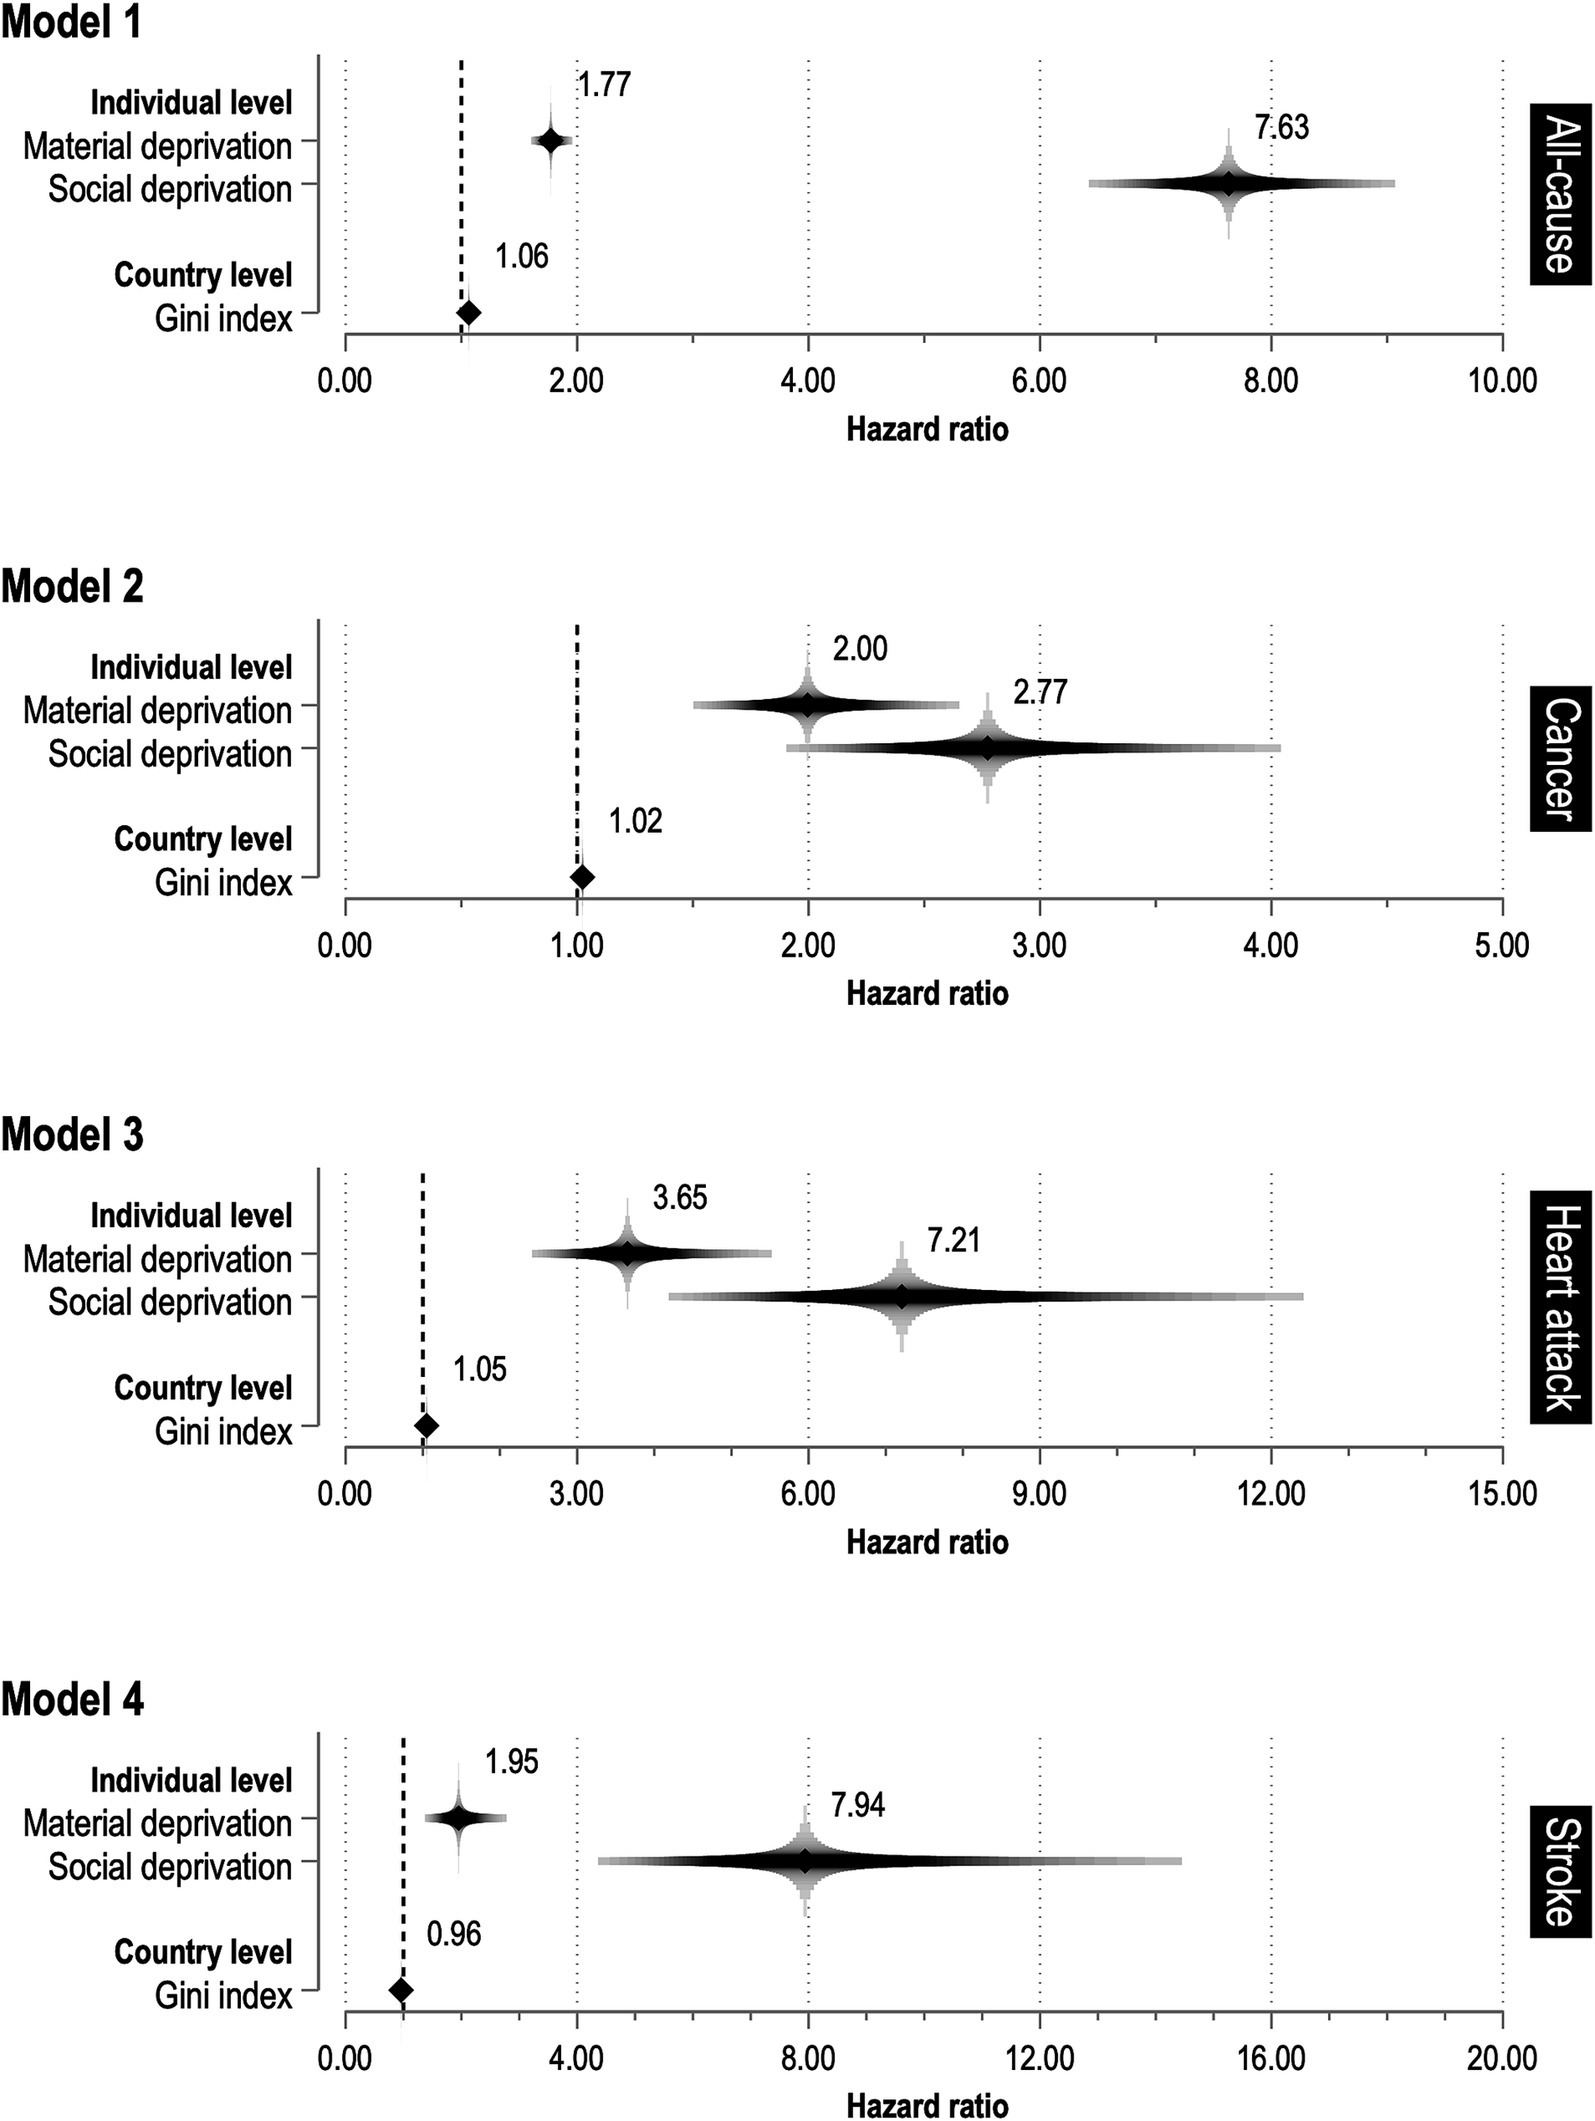
Figure 3. Relationship between socioeconomic deprivation and causes of death.
Table 3 presents the results of the association between individual socioeconomic deprivation and individual mortality stratified by quintiles of the Gini index. No mortality-specific pattern was identified, nor was there any evidence to suggest a difference or trend for MDI and SDI through quintiles of the Gini index, as indicated by the overlap of the 95% CIs. However, it is notable that SDI shows the largest effects in the lower and middle quintiles (except for heart attack), while MDI shows the largest effects, especially for heart attack in regions with the lowest deprivation. Overall, the findings indicate that there is weak evidence to suggest an association between individual mortality from all causes, cancer, heart attack, or stroke, and the Gini index as a measure of area-level socioeconomic inequality. Conversely, there is substantial evidence to suggest an association between individual socioeconomic deprivation and individual mortality.
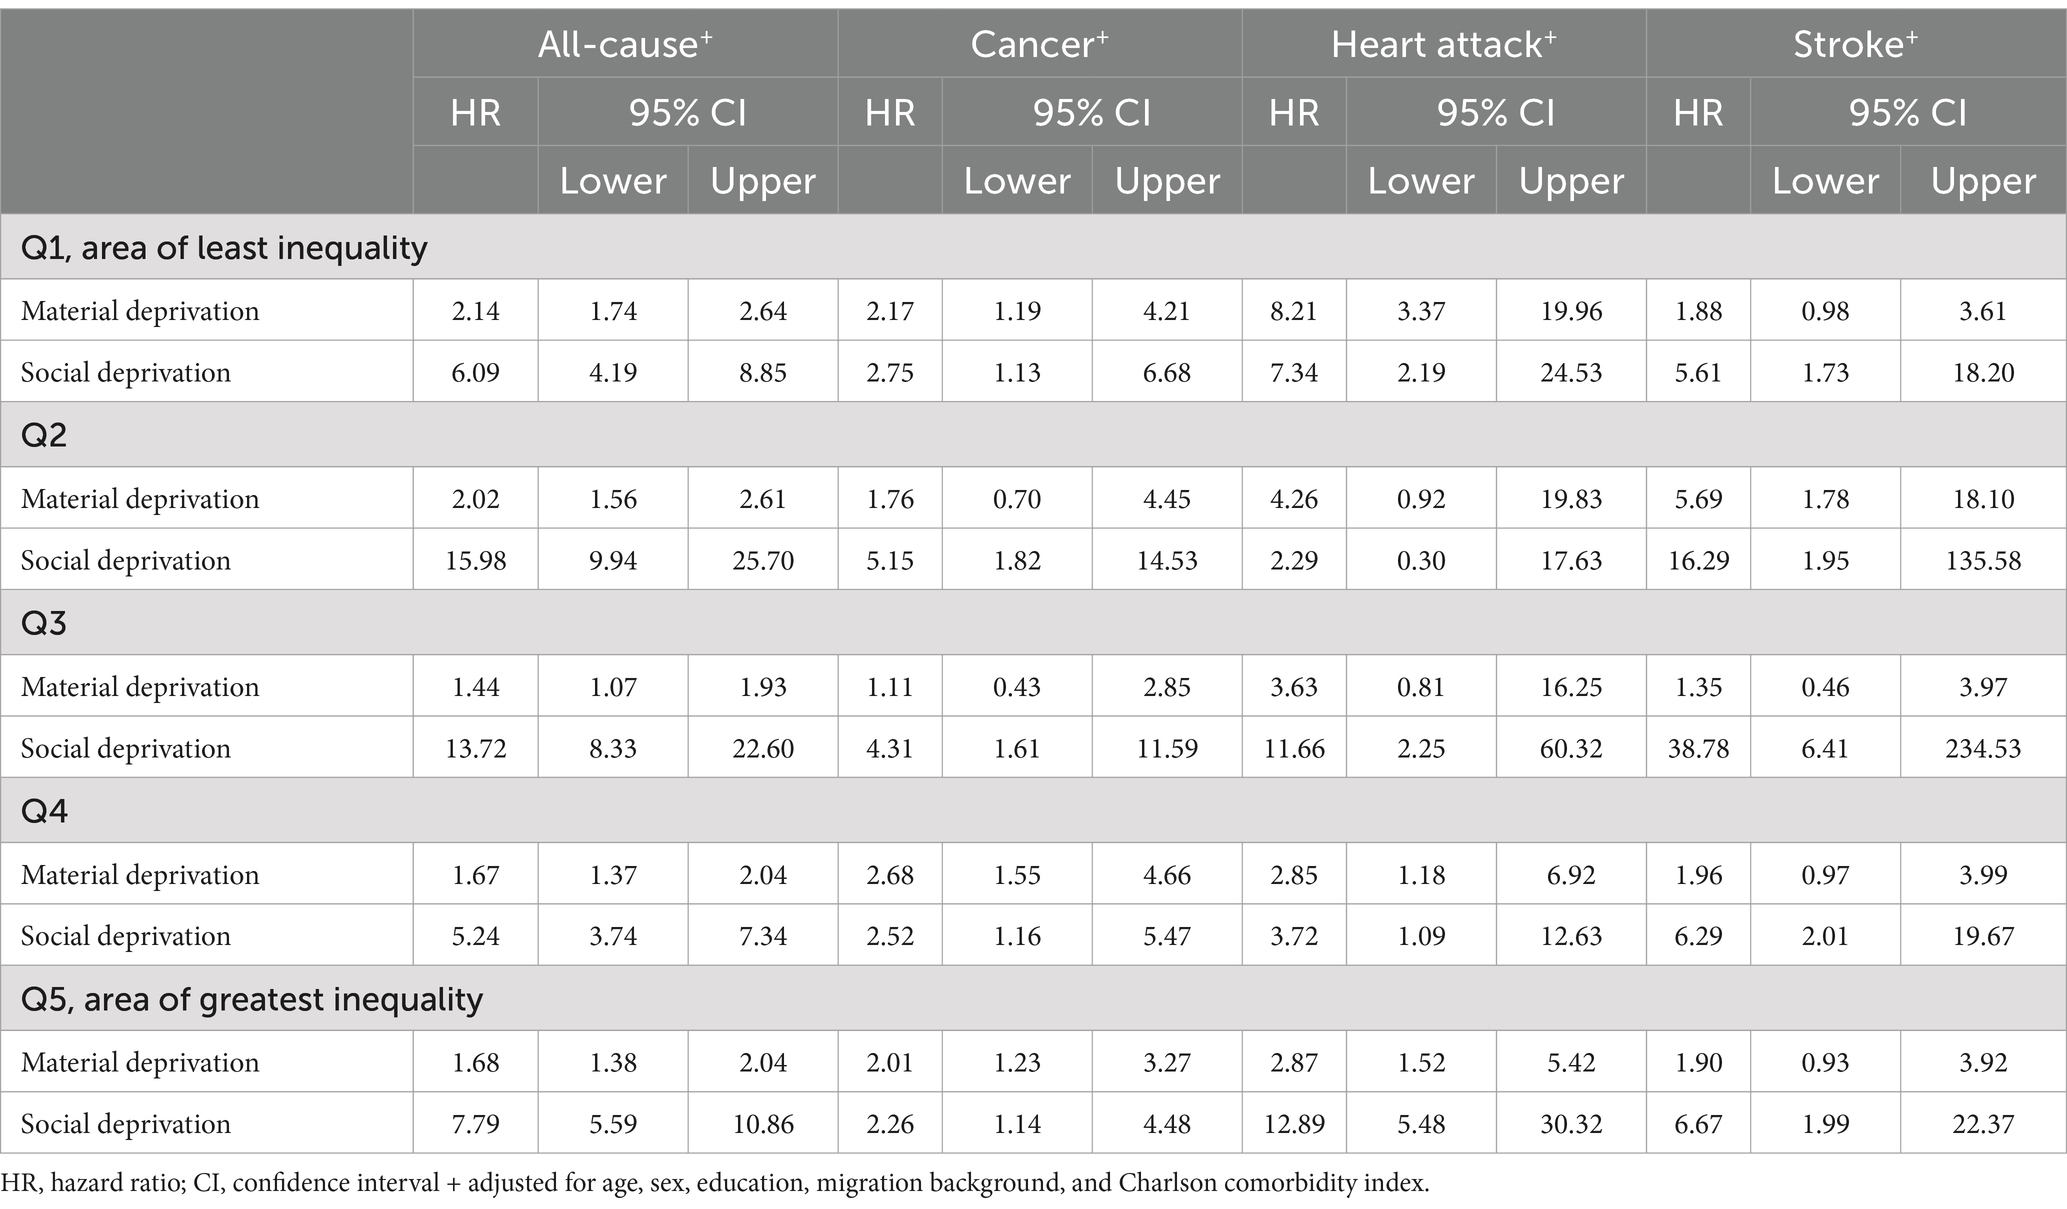
Table 3. Cox regression models with gamma shared frailty and random intercept for country of residence examining the association between material and social deprivation and cause of death, stratified by quintiles of the Gini index in the country of residence.
Discussion
This study examined the effect of individual and regional socioeconomic deprivation on individual mortality risk among older people in the European Region. The findings indicate that the Gini index, which served as a measure for regional deprivation, exerts a modest contextual effect on individual mortality risk for all causes and cancer, once sociodemographic characteristics are taken into account. However, the inclusion of individual-level deprivation in the models did not result in any discernible contextual effects. Instead, it became evident that individual socioeconomic status plays a more significant role in determining the actual causes of death among older individuals in the European Region, which is known as a compositional effect (43).
Previous multilevel studies that have examined the contextual effect of income inequality on mortality have yielded comparable results after adjusting for individual socioeconomic status (44, 45). However, the assertion that an individual’s socioeconomic status is the sole determinant of their mortality risk is not supported by the findings of this study. Prior research (46–49) also indicates that the individual effect may vary depending on contextual factors, underscoring the necessity for a more comprehensive study that incorporates these influences. In this study, the effect size of area-level deprivation may have been underestimated because socioeconomic heterogeneity within countries was not taken into account. This is because individual SHARE data were only available at the NUTS 0 level and in some cases at the NUTS 1 level for data protection reasons. Therefore, regional deprivation could only be considered at this aggregated level. It would be beneficial for future studies to attempt comparisons between spatial units at a more granular level, such as local administrative units within each country in the European Region. The regions under consideration exhibit considerable variation in population size and socioeconomic deprivation, with considerable heterogeneity within countries. When deprivation and mortality data are analyzed at a smaller scale, conclusions may change, a phenomenon known as the modifiable area unit problem (50). However, since these data are not available for all of Europe, small-scale analyses are very difficult to perform.
In contrast, the findings of this study indicate that individual socioeconomic deprivation, particularly in the domains of material and social resources, is associated with an increased risk of individual mortality from all causes, as well as specific conditions such as cancer, heart attack, and stroke. This finding is consistent with previous research from Europe (44, 51, 52), the United States (45, 53), and Asia (17), although individual socioeconomic status has typically been operationalized in terms of educational attainment, income, and occupation. A single prospective cohort study conducted in France was identified that examined the one-year survival rate following a stroke in patients with and without individual social deprivation (54). The findings of the French study indicated that patients with social deprivation exhibited a mortality risk that was more than twice that observed in patients without. However, the results of this study demonstrated that mortality rates were increased for both material deprivation and social deprivation, but with larger effects observed for social deprivation.
This study’s primary strength is its use of prospective data from the most comprehensive pan-European social science panel study (31), merged with area-level data obtained from the LIS Database (35). The study was limited by the exclusive use of a single indicator, the Gini index, for the investigation of regional socioeconomic deprivation. This was due to the unavailability of a validated multidimensional instrument for all European countries included in this study. For example, the European Deprivation Index is currently available for England, Italy, Portugal, Slovenia, and Spain (55, 56). It is thus imperative to recognize that the Gini index serves as a metric for income inequality, rather than a gauge for socioeconomic deprivation. The application of the Gini index is limited by the possibility that an area may exhibit a low Gini index due to its socially homogeneous nature, yet still demonstrate considerable socioeconomic deprivation in absolute terms or, conversely, display high levels of affluence. Consequently, statistical models were adjusted for the relative poverty rate. Moreover, a restricted number of social deprivation items, such as local vandalism and the accessibility of community resources, are indicative of characteristics intrinsic to the social context, situated at the meso level rather than the individual level. Nevertheless, the individual’s lifeworld is shaped by social behaviors and individual consumption patterns, including residential choices, among other factors. Additionally, the SHARE data set is constrained by the inclusion of self-reported diagnoses and a paucity of data concerning disease-specific obstacles and additional factors that may have influenced the vital status of the respondents.
Despite these limitations, this study contributes to our understanding of the relationship between socioeconomic deprivation and the underlying causes of mortality among older people in Europe. Further research is needed to clarify this relationship and to develop targeted health strategies at the European level. This will facilitate the reduction of social inequalities and their impact on health outcomes, thereby contributing to the promotion of social justice.
Conclusion
The results confirm that individual socioeconomic status is a main predictor of actual causes of death among older adults in Europe. Individuals with material deprivation and social deprivation had a higher risk of mortality from all causes, as well as from cancer, heart attack, and stroke, compared to less disadvantaged individuals. The Gini index shows a negligible additional contextual effect on individual mortality, at least partly because of its inherent limitations as a measure of absolute deprivation. Nevertheless, the Gini index shows regional disparities across Europe, and future studies should examine regional measures of deprivation at a more granular level.
Data availability statement
Publicly available datasets were analyzed in this study. This data can be found here: the individual data sets analyzed during the current study are distributed by SHARE-ERIC to registered users through the SHARE Research Data Center. This paper uses data from SHARE Waves 5 (DOI: 10.6103/SHARE.w5.900), 6 (DOI: 10.6103/SHARE.w6.900), 7 (DOI: 10.6103/SHARE.w7.900), 8 (DOI: 10.6103/SHARE.w8.900), and 9 (DOI: 10.6103/SHARE.w9.900). More information about the data resource profile can be found here: Börsch-Supan et al. (31). The area-level data sets analyzed during the current study are distributed by the Luxembourg Income Study (LIS) Database, http://www.lisdatacenter.org (multiple countries; 2015–2021) Luxembourg: LIS.
Ethics statement
The studies involving humans were approved by the Ethics Council of the Max Planck Society. The studies were conducted in accordance with the local legislation and institutional requirements. The participants provided their written informed consent to participate in this study.
Author contributions
MB: Writing – original draft, Writing – review & editing.
Funding
The author(s) declare financial support was received for the research, authorship, and/or publication of this article. I acknowledge financial support from the Open Access Publication Fund of the UKE - University Medical Centre Hamburg-Eppendorf. The SHARE data collection has been funded by the European Commission, DG RTD through FP5 (QLK6-CT-2001-00360), FP6 (SHARE-I3: RII-CT-2006-062193, COMPARE: CIT5-CT-2005-028857, SHARELIFE: CIT4-CT-2006-028812), FP7 (SHARE-PREP: GA N°211909, SHARE-LEAP: GA N°227822, SHARE M4: GA N°261982, DASISH: GA N°283646) and Horizon 2020 (SHARE-DEV3: GA N°676536, SHARE-COHESION: GA N°870628, SERISS: GA N°654221, SSHOC: GA N°823782, SHARE-COVID19: GA N°101015924) and by DG Employment, Social Affairs & Inclusion through VS 2015/0195, VS 2016/0135, VS 2018/0285, VS 2019/0332, VS 2020/0313 and SHARE-EUCOV: GA N°101052589 and EUCOVII: GA N°101102412. Additional funding from the German Ministry of Education and Research, the Max Planck Society for the Advancement of Science, the U.S. National Institute on Aging (U01_AG09740-13S2, P01_AG005842, P01_AG08291, P30_AG12815, R21_AG025169, Y1-AG-4553-01, IAG_BSR06-11, OGHA_04-064, BSR12-04, R01_AG052527-02, HHSN271201300071C, RAG052527A) and from various national funding sources is gratefully acknowledged (see www.share-eric.eu).
Conflict of interest
The author declares that the research was conducted in the absence of any commercial or financial relationships that could be construed as a potential conflict of interest.
Publisher’s note
All claims expressed in this article are solely those of the authors and do not necessarily represent those of their affiliated organizations, or those of the publisher, the editors and the reviewers. Any product that may be evaluated in this article, or claim that may be made by its manufacturer, is not guaranteed or endorsed by the publisher.
Supplementary material
The Supplementary material for this article can be found online at: https://www.frontiersin.org/articles/10.3389/fpubh.2024.1469203/full#supplementary-material
References
1. World Health Organization. European mortality database. (2023). Available at: https://gateway.euro.who.int/en/datasets/european-mortality-database/ (Accessed July 2, 2024).
2. Santucci, C, Carioli, G, Bertuccio, P, Malvezzi, M, Pastorino, U, Boffetta, P, et al. Progress in cancer mortality, incidence, and survival: a global overview. Eur J Cancer Prev. (2020) 29:367–81. doi: 10.1097/CEJ.0000000000000594
3. GBD 2019 Stroke Collaborators. Global, regional, and national burden of stroke and its risk factors, 1990-2019: a systematic analysis for the Global Burden of Disease Study 2019. Lancet Neurol. (2021) 20:795–820. doi: 10.1016/S1474-4422(21)00252-0
4. Aminorroaya, A, Yoosefi, M, Rezaei, N, Shabani, M, Mohammadi, E, Fattahi, N, et al. Global, regional, and national quality of care of ischaemic heart disease from 1990 to 2017: a systematic analysis for the global burden of disease study 2017. Eur J Prev Cardiol. (2022) 29:371–9. doi: 10.1093/eurjpc/zwab066
5. Roth, GA, Mensah, GA, Johnson, CO, Addolorato, G, Ammirati, E, Baddour, LM, et al. Global burden of cardiovascular diseases and risk factors, 1990-2019: update from the GBD 2019 study. J Am Coll Cardiol. (2020) 76:2982–3021. doi: 10.1016/j.jacc.2020.11.010
6. Conrad, N, Molenberghs, G, Verbeke, G, Zaccardi, F, Lawson, C, Friday, JM, et al. Trends in cardiovascular disease incidence among 22 million people in the UK over 20 years: population based study. BMJ. (2024) 385:e078523. doi: 10.1136/bmj-2023-078523
7. Bidoli, E, Lamaj, E, Angelin, T, Forgiarini, O, De Santis, E, and Serraino, D. Linearity of age at cancer onset worldwide: 25-year population-based cancer registry study. Cancers. (2021) 13:5589. doi: 10.3390/cancers13215589
8. Zahed, H, Feng, X, Sheikh, M, Bray, F, Ferlay, J, Ginsburg, O, et al. Age at diagnosis for lung, colon, breast and prostate cancers: an international comparative study. Int J Cancer. (2024) 154:28–40. doi: 10.1002/ijc.34671
9. Townsend, N, Kazakiewicz, D, Lucy Wright, F, Timmis, A, Huculeci, R, Torbica, A, et al. Epidemiology of cardiovascular disease in Europe. Nat Rev Cardiol. (2022) 19:133–43. doi: 10.1038/s41569-021-00607-3
10. Santos, JV, Padron-Monedero, A, Bikbov, B, Grad, DA, Plass, D, Mechili, EA, et al. The state of health in the European Union (EU-27) in 2019: a systematic analysis for the global burden of disease study 2019. BMC Public Health. (2024) 24:1374. doi: 10.1186/s12889-024-18529-3
11. Vandenberghe, D, and Albrecht, J. The financial burden of non-communicable diseases in the European Union: a systematic review. Eur J Pub Health. (2020) 30:833–9. doi: 10.1093/eurpub/ckz073
12. Kölegård Stjärne, M, Diderichsen, F, Reuterwall, C, and Hallqvist, J. Socioeconomic context in area of living and risk of myocardial infarction: results from Stockholm heart epidemiology program (SHEEP). J Epidemiol Community Health. (2002) 56:29–35. doi: 10.1136/jech.56.1.29
13. Macintyre, K, Stewart, S, Chalmers, J, Pell, J, Finlayson, A, Boyd, J, et al. Relation between socioeconomic deprivation and death from a first myocardial infarction in Scotland: population based analysis. BMJ. (2001) 322:1152–3. doi: 10.1136/bmj.322.7295.1152
14. Okui, T, Matoba, T, and Nakashima, N. The association between the socioeconomic deprivation level and ischemic heart disease mortality in Japan: an analysis using municipality-specific data. Epidemiol Health. (2022) 44:e2022059. doi: 10.4178/epih.e2022059
15. Belau, MH, Becher, H, Riefflin, M, Bartig, D, Schwettmann, L, Schwarzbach, CJ, et al. The impact of regional deprivation on stroke incidence, treatment, and mortality in Germany. Neurol Res Pract. (2023) 5:6. doi: 10.1186/s42466-023-00232-0
16. Marshall, IJ, Wang, Y, Crichton, S, McKevitt, C, Rudd, AG, and Wolfe, CD. The effects of socioeconomic status on stroke risk and outcomes. Lancet Neurol. (2015) 14:1206–18. doi: 10.1016/S1474-4422(15)00200-8
17. Vathesatogkit, P, Batty, GD, and Woodward, M. Socioeconomic disadvantage and disease-specific mortality in Asia: systematic review with meta-analysis of population-based cohort studies. J Epidemiol Community Health. (2014) 68:375–83. doi: 10.1136/jech-2013-203053
18. Donkers, H, Bekkers, R, and Galaal, K. Systematic review on socioeconomic deprivation and cervical Cancer: inequalities in survival. J Health Care Poor Underserved. (2021) 32:751–66. doi: 10.1353/hpu.2021.0103
19. Finke, I, Behrens, G, Weisser, L, Brenner, H, and Jansen, L. Socioeconomic differences and lung cancer survival-systematic review and meta-analysis. Front Oncol. (2018) 8:536. doi: 10.3389/fonc.2018.00536
20. Green, LW . Manual for scoring socioeconomic status for research on health behavior. Public Health Rep. (1896-1970) 85:815–27. doi: 10.2307/4593972
21. Adena, M, and Myck, M. Poverty and transitions in health in later life. Soc Sci Med. (2014) 116:202–10. doi: 10.1016/j.socscimed.2014.06.045
22. Pilehvari, A, You, W, and Lin, X. Retirement's impact on health: what role does social network play? Eur J Ageing. (2023) 20:14. doi: 10.1007/s10433-023-00759-w
23. Kauppi, M, Virtanen, M, Pentti, J, Aalto, V, Kivimäki, M, Vahtera, J, et al. Social network ties before and after retirement: a cohort study. Eur J Ageing. (2021) 18:503–12. doi: 10.1007/s10433-021-00604-y
24. Xue, B, Head, J, and McMunn, A. The impact of retirement on cardiovascular disease and its risk factors: a systematic review of longitudinal studies. Gerontologist. (2020) 60:e367–77. doi: 10.1093/geront/gnz062
25. Li, W, Ye, X, Zhu, D, and He, P. The longitudinal association between retirement and depression: a systematic review and meta-analysis. Am J Epidemiol. (2021) 190:2220–30. doi: 10.1093/aje/kwab125
26. Silva, IGP, Marquete, VF, Lino, IGT, Batista, VC, Magnabosco, G, Haddad, M, et al. Factors associated with quality of life in retirement: a systematic review. Rev Bras Med Trab. (2022) 20:676–84. doi: 10.47626/1679-4435-2022-876
27. Noble, M, Wright, G, Smith, G, and Dibben, C. Measuring multiple deprivation at the small-area level. Environ Plann A Econ Space. (2006) 38:169–85. doi: 10.1068/a37168
28. Trinidad, S, Brokamp, C, Mor Huertas, A, Beck, AF, Riley, CL, Rasnik, E, et al. Use of area-based socioeconomic deprivation indices: a scoping review and qualitative analysis. Health Aff. (2022) 41:1804–11. doi: 10.1377/hlthaff.2022.00482
29. McNamara, CL, Balaj, M, Thomson, KH, Eikemo, TA, Solheim, EF, and Bambra, C. The socioeconomic distribution of non-communicable diseases in Europe: findings from the European social survey (2014) special module on the social determinants of health. Eur J Pub Health. (2017) 27:22–6. doi: 10.1093/eurpub/ckw222
30. Mackenbach, JP, Stirbu, I, Roskam, AJ, Schaap, MM, Menvielle, G, Leinsalu, M, et al. Socioeconomic inequalities in health in 22 European countries. N Engl J Med. (2008) 358:2468–81. doi: 10.1056/NEJMsa0707519
31. Börsch-Supan, A, Brandt, M, Hunkler, C, Kneip, T, Korbmacher, J, Malter, F, et al. Data resource profile: the survey of health, ageing and retirement in Europe (SHARE). Int J Epidemiol. (2013) 42:992–1001. doi: 10.1093/ije/dyt088
32. Bertoni, M, Cavapozzi, D, Celidoni, M, and Trevisan, E. Development and validation of a material deprivation index In: A Börsch-Supan, T Kneip, H Litwin, M Myck, and G Weber, editors. Ageing in Europe - supporting policies for an inclusive society. Berlin: De Gruyter (2015). 57–65.
33. Hu, Y, van Lenthe, FJ, and Mackenbach, JP. Income inequality, life expectancy and cause-specific mortality in 43 European countries, 1987-2008: a fixed effects study. Eur J Epidemiol. (2015) 30:615–25. doi: 10.1007/s10654-015-0066-x
34. Kõlves, K, Milner, A, and Värnik, P. Suicide rates and socioeconomic factors in eastern European countries after the collapse of the Soviet Union: trends between 1990 and 2008. Sociol Health Illn. (2013) 35:956–70. doi: 10.1111/1467-9566.12011
35. Luxembourg income study (LIS) database. Available at: http://www.lisdatacenter.org (multiple countries; 2013-2021). Luxembourg: LIS.
36. Bertoni, M, Cavapozzi, D, Celidoni, M, and Trevisan, E. Assessing the material deprivation of older Europeans In: A Börsch-Supan, T Kneip, H Litwin, M Myck, and G Weber, editors. Ageing in Europe - supporting policies for an inclusive society. Berlin: De Gruyter (2015). 49–56.
37. Adena, M, Myck, M, and Oczkowska, M. Material deprivation items in SHARE wave 5 data: a contribution to a better understanding of differences in material conditions in later life In: A Börsch-Supan, T Kneip, H Litwin, M Myck, and G Weber, editors. Ageing in Europe - supporting policies for an inclusive society. Berlin: De Gruyter (2015). 25–37.
38. Myck, M, Najsztub, M, and Oczkowska, M. Measuring social deprivation and social exclusion In: A Börsch-Supan, T Kneip, H Litwin, M Myck, and G Weber, editors. Ageing in Europe - supporting policies for an inclusive society. Berlin: De Gruyter (2015). 67–77.
39. Charlson, ME, Pompei, P, Ales, KL, and MacKenzie, CR. A new method of classifying prognostic comorbidity in longitudinal studies: development and validation. J Chronic Dis. (1987) 40:373–83. doi: 10.1016/0021-9681(87)90171-8
40. Quan, H, Li, B, Couris, CM, Fushimi, K, Graham, P, Hider, P, et al. Updating and validating the Charlson comorbidity index and score for risk adjustment in hospital discharge abstracts using data from 6 countries. Am J Epidemiol. (2011) 173:676–82. doi: 10.1093/aje/kwq433
41. Royston, P . Explained variation for survival models. Stata J. (2006) 6:83–96. doi: 10.1177/1536867X0600600105
42. Lorenz, E, Jenkner, C, Sauerbrei, W, and Becher, H. Modeling variables with a spike at zero: examples and practical recommendations. Am J Epidemiol. (2017) 185:650–60. doi: 10.1093/aje/kww122
43. Kawachi, I, Subramanian, SV, and Almeida-Filho, N. A glossary for health inequalities. J Epidemiol Community Health. (2002) 56:647–52. doi: 10.1136/jech.56.9.647
44. Ng, N, Lundevaller, E, Malmberg, G, and Edvinsson, S. Income inequality and old-age mortality in Sweden: do regional development and lagged effect matter? Health Place. (2020) 64:102384. doi: 10.1016/j.healthplace.2020.102384
45. Fiscella, K, and Franks, P. Poverty or income inequality as predictor of mortality: longitudinal cohort study. BMJ. (1997) 314:1724–7. doi: 10.1136/bmj.314.7096.1724
46. Lochner, K, Pamuk, E, Makuc, D, Kennedy, BP, and Kawachi, I. State-level income inequality and individual mortality risk: a prospective, multilevel study. Am J Public Health. (2001) 91:385–91. doi: 10.2105/AJPH.91.3.385
47. Daly, MC, Duncan, GJ, Kaplan, GA, and Lynch, JW. Macro-to-micro links in the relation between income inequality and mortality. Milbank Q. (1998) 76:315.
48. Shin, J, Choi, Y, Kim, SW, Lee, SG, and Park, EC. Cross-level interaction between individual socioeconomic status and regional deprivation on overall survival after onset of ischemic stroke: national health insurance cohort sample data from 2002 to 2013. J Epidemiol. (2017) 27:381–8. doi: 10.1016/j.je.2016.08.020
49. Reiss, K, Berger, U, Winkler, V, Voigtländer, S, Becher, H, and Razum, O. Assessing the effect of regional deprivation on mortality avoiding compositional bias: a natural experiment. J Epidemiol Community Health. (2013) 67:213–8. doi: 10.1136/jech-2012-201336
50. Schuurman, N, Bell, N, Dunn, JR, and Oliver, L. Deprivation indices, population health and geography: an evaluation of the spatial effectiveness of indices at multiple scales. J Urban Health. (2007) 84:591–603. doi: 10.1007/s11524-007-9193-3
51. Huisman, M, Kunst, AE, Bopp, M, Borgan, JK, Borrell, C, Costa, G, et al. Educational inequalities in cause-specific mortality in middle-aged and older men and women in eight western European populations. Lancet. (2005) 365:493–500. doi: 10.1016/S0140-6736(05)17867-2
52. Gallo, V, Mackenbach, JP, Ezzati, M, Menvielle, G, Kunst, AE, Rohrmann, S, et al. Social inequalities and mortality in Europe--results from a large multi-national cohort. PLoS One. (2012) 7:e39013. doi: 10.1371/journal.pone.0039013
53. Steenland, K, Henley, J, and Thun, M. All-cause and cause-specific death rates by educational status for two million people in two American Cancer Society cohorts, 1959-1996. Am J Epidemiol. (2002) 156:11–21. doi: 10.1093/aje/kwf001
54. Béjot, Y, Bourredjem, A, Mimeau, E, Joux, J, Lannuzel, A, Misslin-Tritsch, C, et al. Social deprivation and 1-year survival after stroke: a prospective cohort study. Eur J Neurol. (2021) 28:800–8. doi: 10.1111/ene.14614
55. Guillaume, E, Pornet, C, Dejardin, O, Launay, L, Lillini, R, Vercelli, M, et al. Development of a cross-cultural deprivation index in five European countries. J Epidemiol Community Health. (2016) 70:493–9. doi: 10.1136/jech-2015-205729
Keywords: social class, mortality, neoplasm, heart attack, stroke, Europe
Citation: Belau MH (2024) Material and social deprivation associated with public health actual causes of death among older people in Europe: longitudinal and multilevel results from the Survey of Health, Ageing and Retirement in Europe (SHARE). Front. Public Health. 12:1469203. doi: 10.3389/fpubh.2024.1469203
Edited by:
Myer Glickman, Office for National Statistics, United KingdomReviewed by:
Kimberly Jinnett, University of California, San Francisco, United StatesMaría Antonia Parra Rizo, Miguel Hernández University of Elche, Spain
Copyright © 2024 Belau. This is an open-access article distributed under the terms of the Creative Commons Attribution License (CC BY). The use, distribution or reproduction in other forums is permitted, provided the original author(s) and the copyright owner(s) are credited and that the original publication in this journal is cited, in accordance with accepted academic practice. No use, distribution or reproduction is permitted which does not comply with these terms.
*Correspondence: Matthias Hans Belau, bS5iZWxhdUB1a2UuZGU=