 Levent Aytemiz1*
 Gamze Sart
 Yilmaz Bayar
 Marina Danilina
 Funda H. Sezgin
- 1Department of Public Finance, Faculty of Economics and Administrative Sciences, Bandirma Onyedi Eylul University, Bandirma-Balikesir, Türkiye
- 2Department of Educational Sciences, Hasan Ali Yucel Faculty of Education, İstanbul University-Cerrahpaşa, İstanbul, Türkiye
- 3Department of Economics, Plekhanov Russian University of Economics (PRUE), Moscow, Russia
- 4Department of Economics, Financial University Under the Government of the Russian Federation, Moscow, Russia
- 5Department of Industrial Engineering, Istanbul University-Cerrahpaşa, İstanbul, Türkiye
Life expectancy provides insights into population health and the socio-economic development level of a country. However, there has been a significant gap in life expectancy between developed and underdeveloped countries, although these countries and international institutions have focused on reducing these inequalities. This article explores the long-term effects of social, educational, and health expenditures together with GDP per capita on indicators of life expectancy in the OECD states over the period of 2005–2021 through second-generation cointegration analysis. The results of the cointegration analysis demonstrate that public social and educational expenditures, health expenditures, and real GDP per capita have a positive effect on indicators of life expectancy in the OECD states over the long term, but the effect of real GDP per capita and health expenditures on indicators of life expectancy is relatively higher than effect of public social and educational expenditures on indicators of life expectancy. In conclusion, the effective use of governmental resources in terms of social, educational, and health expenditures can be beneficial in improving population health directly and indirectly through economic growth and development.
1 Introduction
Life expectancy indicates the average lifespan of a society and increases in life expectancy generally reflect progress in living standards, medicine, education, and lifestyle (1). Therefore, life expectancy is generally accepted as one of the key indicators of a country’s socioeconomic development (2). On the other hand, healthy human capital is one of the main factors behind economic growth and development (3). In conclusion, every country tries to improve life expectancy by implementing economic, social, educational, and health policies that address the aforementioned implications for society.
All parts of the world have experienced improvements in life expectancy, and inter-country differences in life expectancy have also decreased during the period of 1990–2022. In this context, Chad (52.997 years), Lesotho (53.036 years), and Nigeria (53.633 years) had the lowest life expectancy at birth (LEB) in 2022, while Japan (84.82 years), Liechtenstein (84.656 years), and Switzerland (84.255 years) recorded the highest LEB in 2022 (4). The gap between the highest and the lowest LEB of the countries (Japan and South Sudan) in 1990 was 49.049 years, but this gap decreased to 31.823 years in 2022 between Japan and Chad (4). Although there has been a partial improvement in the life expectancy gap between countries, the gap remains significant. This underlines the importance of emphasizing the Sustainable Development Goals (SDGs) outlined in the 2030 Agenda for Sustainable Development (5). Aksan and Chakraborty (6) also noted a convergence in LEB, but a divergence in life expectancy at age 65 between 1960 and 2015 worldwide.
Researchers have also conducted a wide range of empirical studies on economic, social, and environmental factors behind inter-country differences in life expectancy. The factors listed in Table 1 have been identified as the major drivers of various life expectancy indicators. In this context, researchers have primarily focused on the impact of factors related to national and personal income, health expenditures, and infrastructure on life expectancy. However, the effects of other social, economic, environmental, and demographic factors, such as institutional quality, financial sector development, government effectiveness, poverty, income inequality, lifestyle, demographic indicators, the environment, information and communication technologies, unemployment and employment, education, population, urbanization, and political regimes on life expectancy have also been explored, albeit to a relatively lesser extent.
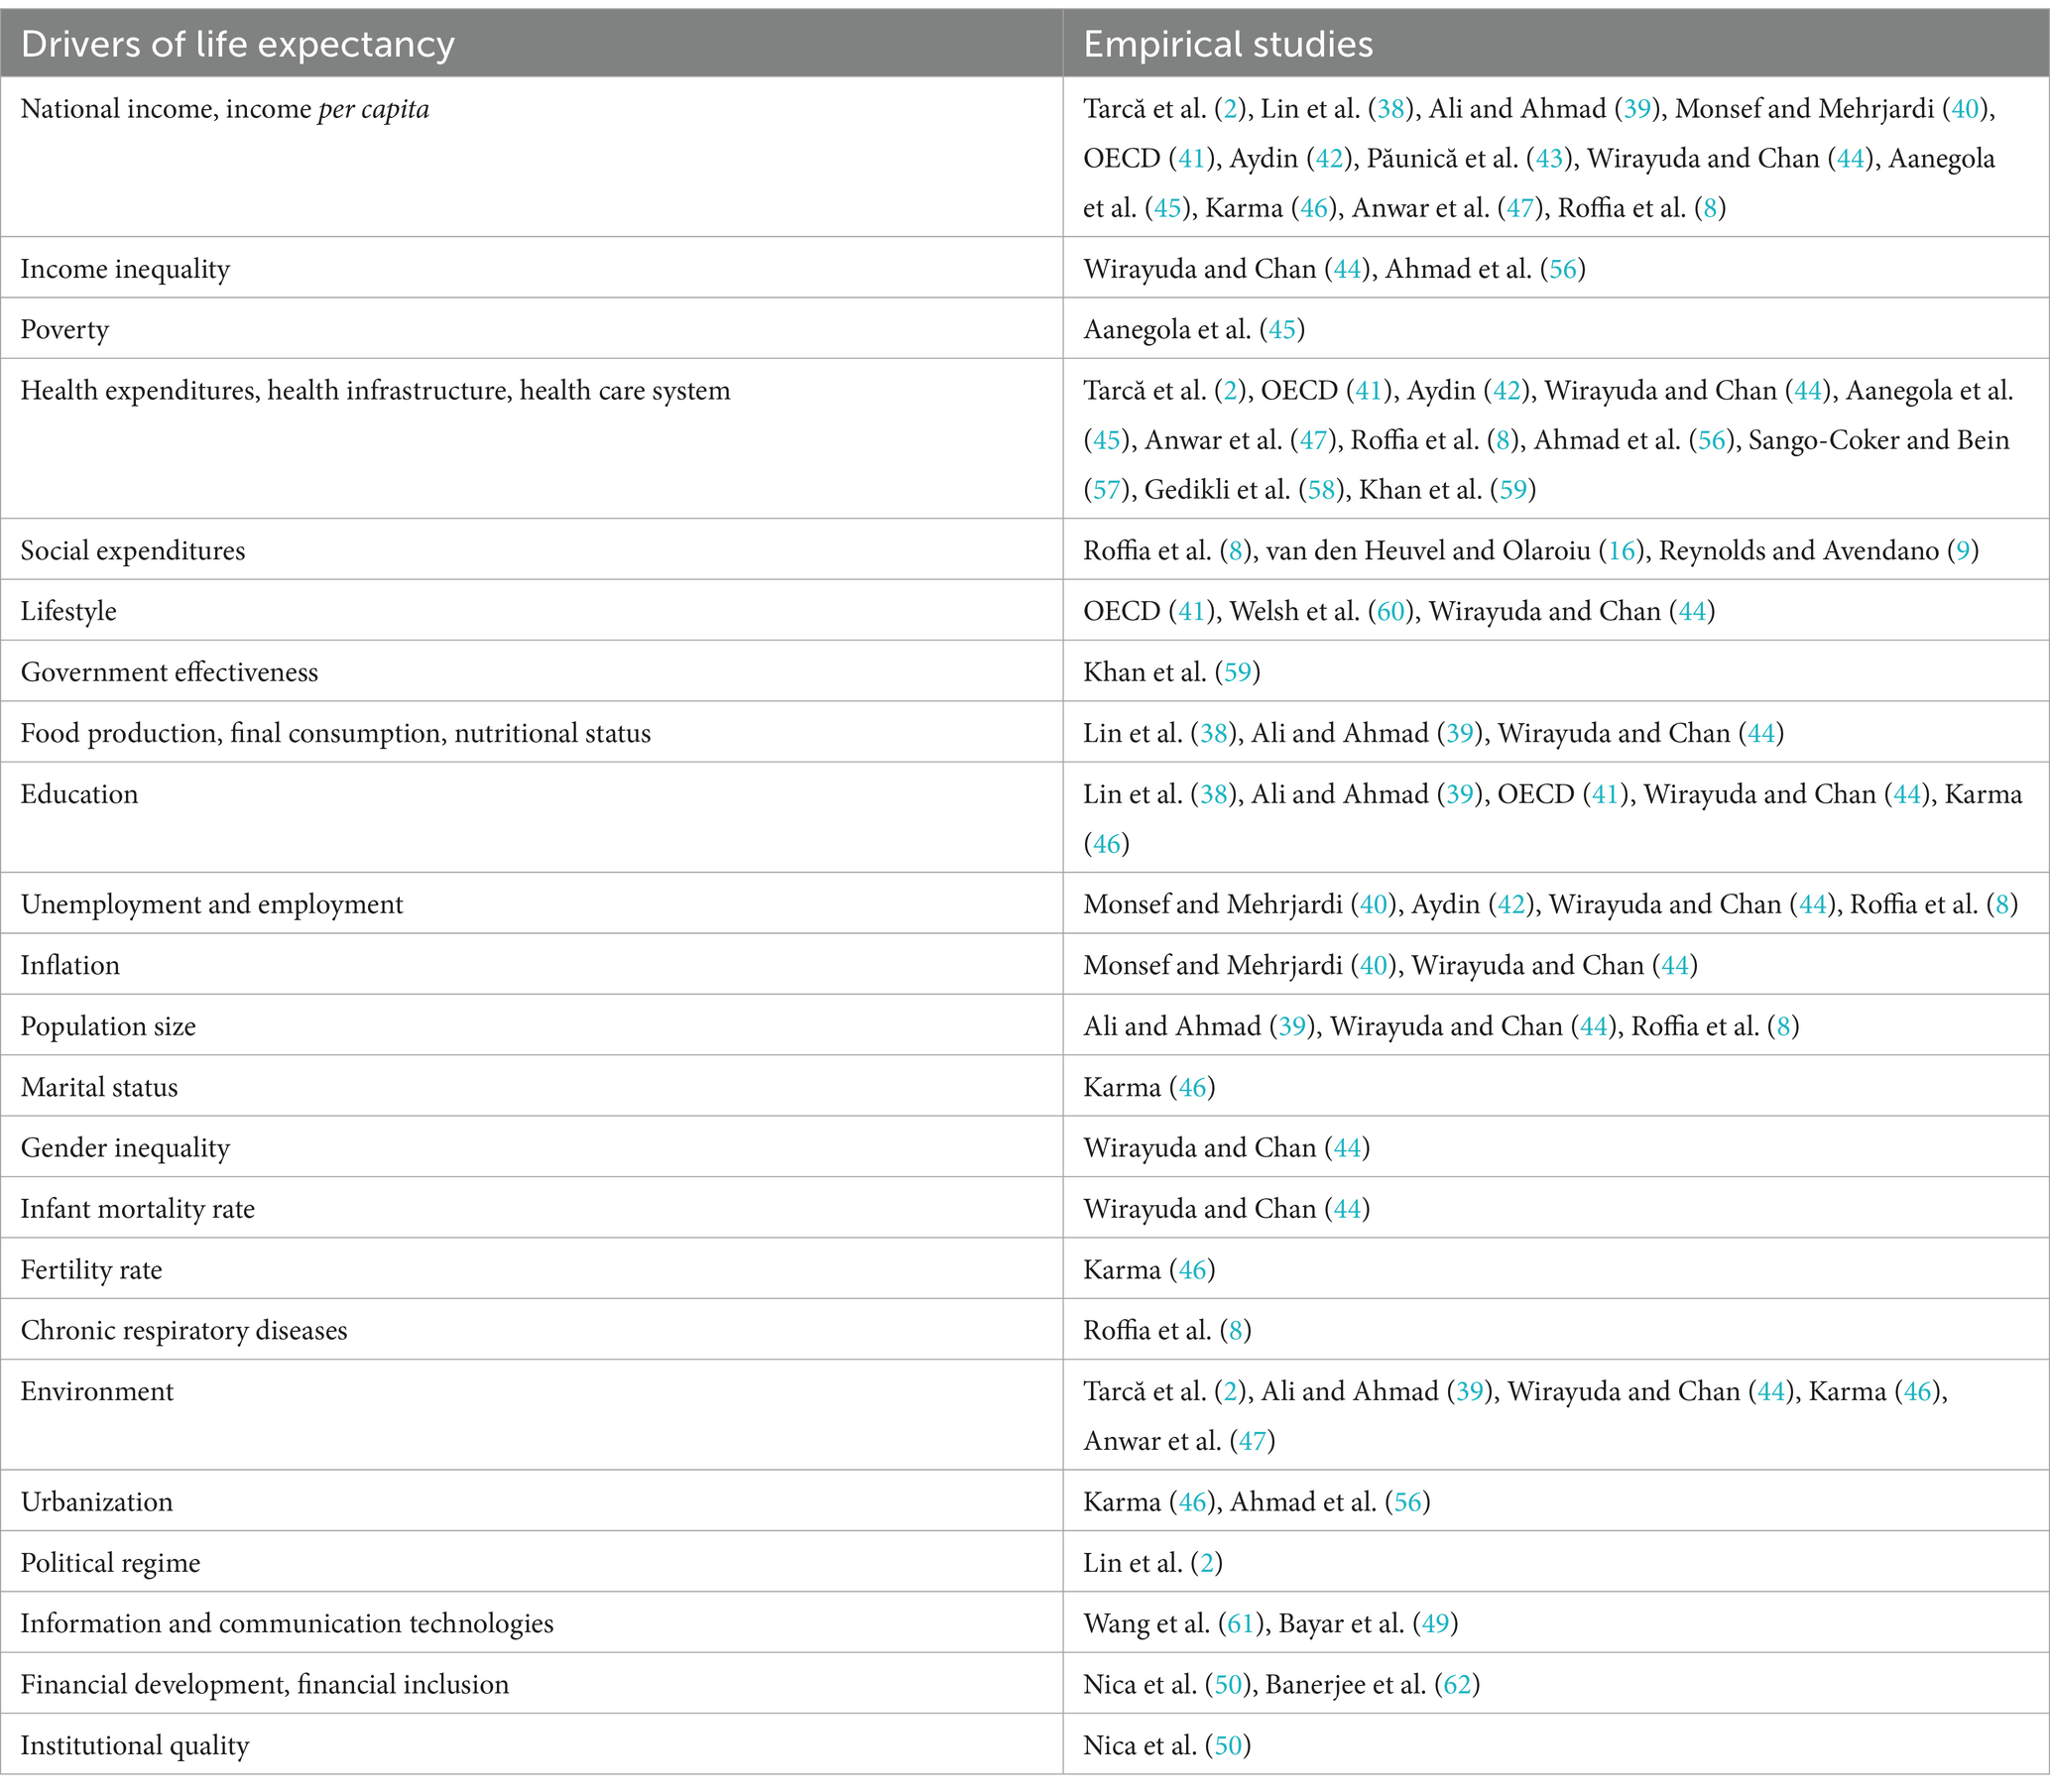
Table 1. Economic, institutional, social, and environmental drivers of life expectancy.
This research surveys the long-term effects of social, educational, and health expenditures together with real GDP per capita on indicators of life expectancy, as these variables have the ability to impact life expectancy through multiple channels. Social expenditures include cash benefits, delivery of goods and services, and tax reductions for low-income households, the unemployed, the disabled, the sick, the older adults, or young individuals (7). Therefore, social expenditures can positively impact life expectancy by increasing the disposable income or consumption levels of individuals (8). Furthermore, increases in household disposable income can also improve life expectancy through higher living standards, better education opportunities, improved medical care, healthier lifestyles, and reduced stress levels (8, 9).
Public education investments can also impact life expectancy by improving education, which enables individuals to attain better living standards, healthy lifestyles, and healthcare opportunities. This effect arises because individuals with higher education levels generally earn higher wages (10, 11). On the other hand, increases in health expenditures can positively affect the life expectancy through improvements in health infrastructure and care, healthy nutrition and immunization (12). Lastly, social, educational, and health expenditures can foster economic growth and development via increased productivity mainly resulting from improvements in human capital and, in turn, improve life expectancy through enhancements in income and health facilities (11–14).
A person with relatively higher income is expected to live longer due to easier access to healthy life style and appropriate healthcare. Preston (15) also suggested that the persons in higher-income countries generally have higher lifetime than persons in the lower-income countries. However, increases in income cause higher increases in lifetime at low GDP per capita values, but relatively lower increases in lifetime emerge at higher GDP per capita values (15). In conclusion, a positive association between real GDP per capita and indicators of life expectancy is anticipated.
This research investigates the long-term effects of social, educational, and health expenditures and real GDP per capita on indicators of life expectancy in OECD countries, because OECD includes countries with different economic, social, and institutional characteristics. This article intends to contribute to the associated empirical literature from three perspectives. First, the empirical studies have usually investigated the effect of various economic, social, and institutional factors on life expectancy at birth. Our article is also utilized healthy life expectancy at birth and 60 and life expectancy at 60 together with life expectancy at birth. Secondly, in the associated empirical literature, only Roffia et al. (8), van den Heuvel and Olaroiu (16), Reynolds and Avendano (9), Dutton et al. (17), Aydan et al. (18), Cardona et al. (19), and Aydan et al. (20) have been explored the effect of social expenditures on life expectancy in the short term. But this research investigates the long-term effects of social expenditures on indicators of life expectancy at birth and 60 differently from the empirical literature by means of second-generation cointegration test which enables us to determine whether the variables under consideration have a stable long-run relationship (21). Thirdly, this research examines the effect of public educational investment on indicators of life expectancy distinguishing it from the literature on the nexus between education indicators and population health. In the remainder of the article, the associated empirical literature is reviewed in Section 2, data, data sources, and econometric tests are explained in Section 3. Econometric tests and discussions about the empirical findings are presented in Section 4, while the conclusions and policy suggestions are outlined in Section 5.
2 Literature review
Life expectancy is one of the essential proxies for population health and socio-economic development. The gap in life expectancy at the global level has partially narrowed in recent years, but a significant gap between developed and underdeveloped countries persists (4). Therefore, economic, environmental, social, and health-related factors contributing to the heterogeneity in life expectancy among countries have been widely explored. In this research, the long-term effects of social, educational, and health expenditures on life expectancy in OECD states have been investigated because only a few academicians have empirically studied the short-term effects of these expenditures. Furthermore, the impacts of governmental social and educational expenditures on life expectancy are more discernible over the long term.
Empirical studies analyzing the interplay between social expenditures and life expectancy across various countries and panels have generally utilized the regression approach, revealing an increasing effect of both public and private social spending on life expectancy in compatible with the theoretical considerations (8, 9, 16–20).
Roffia et al. (8) investigated the effects of health-related indicators, as well as social, economic, and environmental factors, on life expectancy at birth in OECD countries between 1999 and 2018 using a regression approach. They identified a positive effect of social expenditures on life expectancy. On the other hand, van den Heuvel and Olaroiu (16) explored the effects of health-related indicators, education, and social protection expenditures on life expectancy in 31 European countries using a regression approach and found a positive effect of social protection expenditures on life expectancy.
Reynolds and Avendano (9) investigated the influence of socio-economic factors on life expectancy in 20 high-income countries from 1980 to 2010 using a regression approach and discovered a positive influence of incapacity benefits on life expectancy. Dutton et al. (17) analyzed the effect of provincial social expenditures on life expectancy in Canada from 1981 to 2011 using a regression approach and unveiled a positive influence of social spending on life expectancy.
Aydan et al. (18) explored the effect of health and social expenditures on life expectancy among OECD members from 2006 to 2017 using regression analysis and disclosed an increasing influence of social expenditures on life expectancy. Cardona et al. (19) investigated the nexus between spending on social services and life expectancy in the United States from 2005 to 2010 using structural equation modeling and revealed a positive effect of social expenditures on life expectancy. Lastly, Aydan et al. (20) analyzed the effect of social expenditures, economic freedom, and health expenditures on well-being proxied by better life index among OECD members from 2013 to 2017 using regression analysis and discovered a positive influence of social expenditures on well-being.
The interaction between educational indicators, including literacy rate, schooling years, and education index of United Nations Development Program, and life expectancy has been studied in relatively more research papers, as summarized in Table 2. These research papers typically utilized a panel-level regression approach and uncovered a positive influence of various education indicators on life expectancy (11, 22–34). However, Hazan (35) suggested that the influence of education on life expectancy can vary based on the proxies of life expectancy used. Bilas et al. (36) disclosed a decreasing influence of education on life expectancy in European countries. Last, Craigwell et al. (37) unveiled an insignificant effect of public education spendings on primary and secondary school enrolments. This article investigates the effect of public education investments, proxied by public educational expenditures, on life expectancy, differing from most of the studies presented in Table 2.
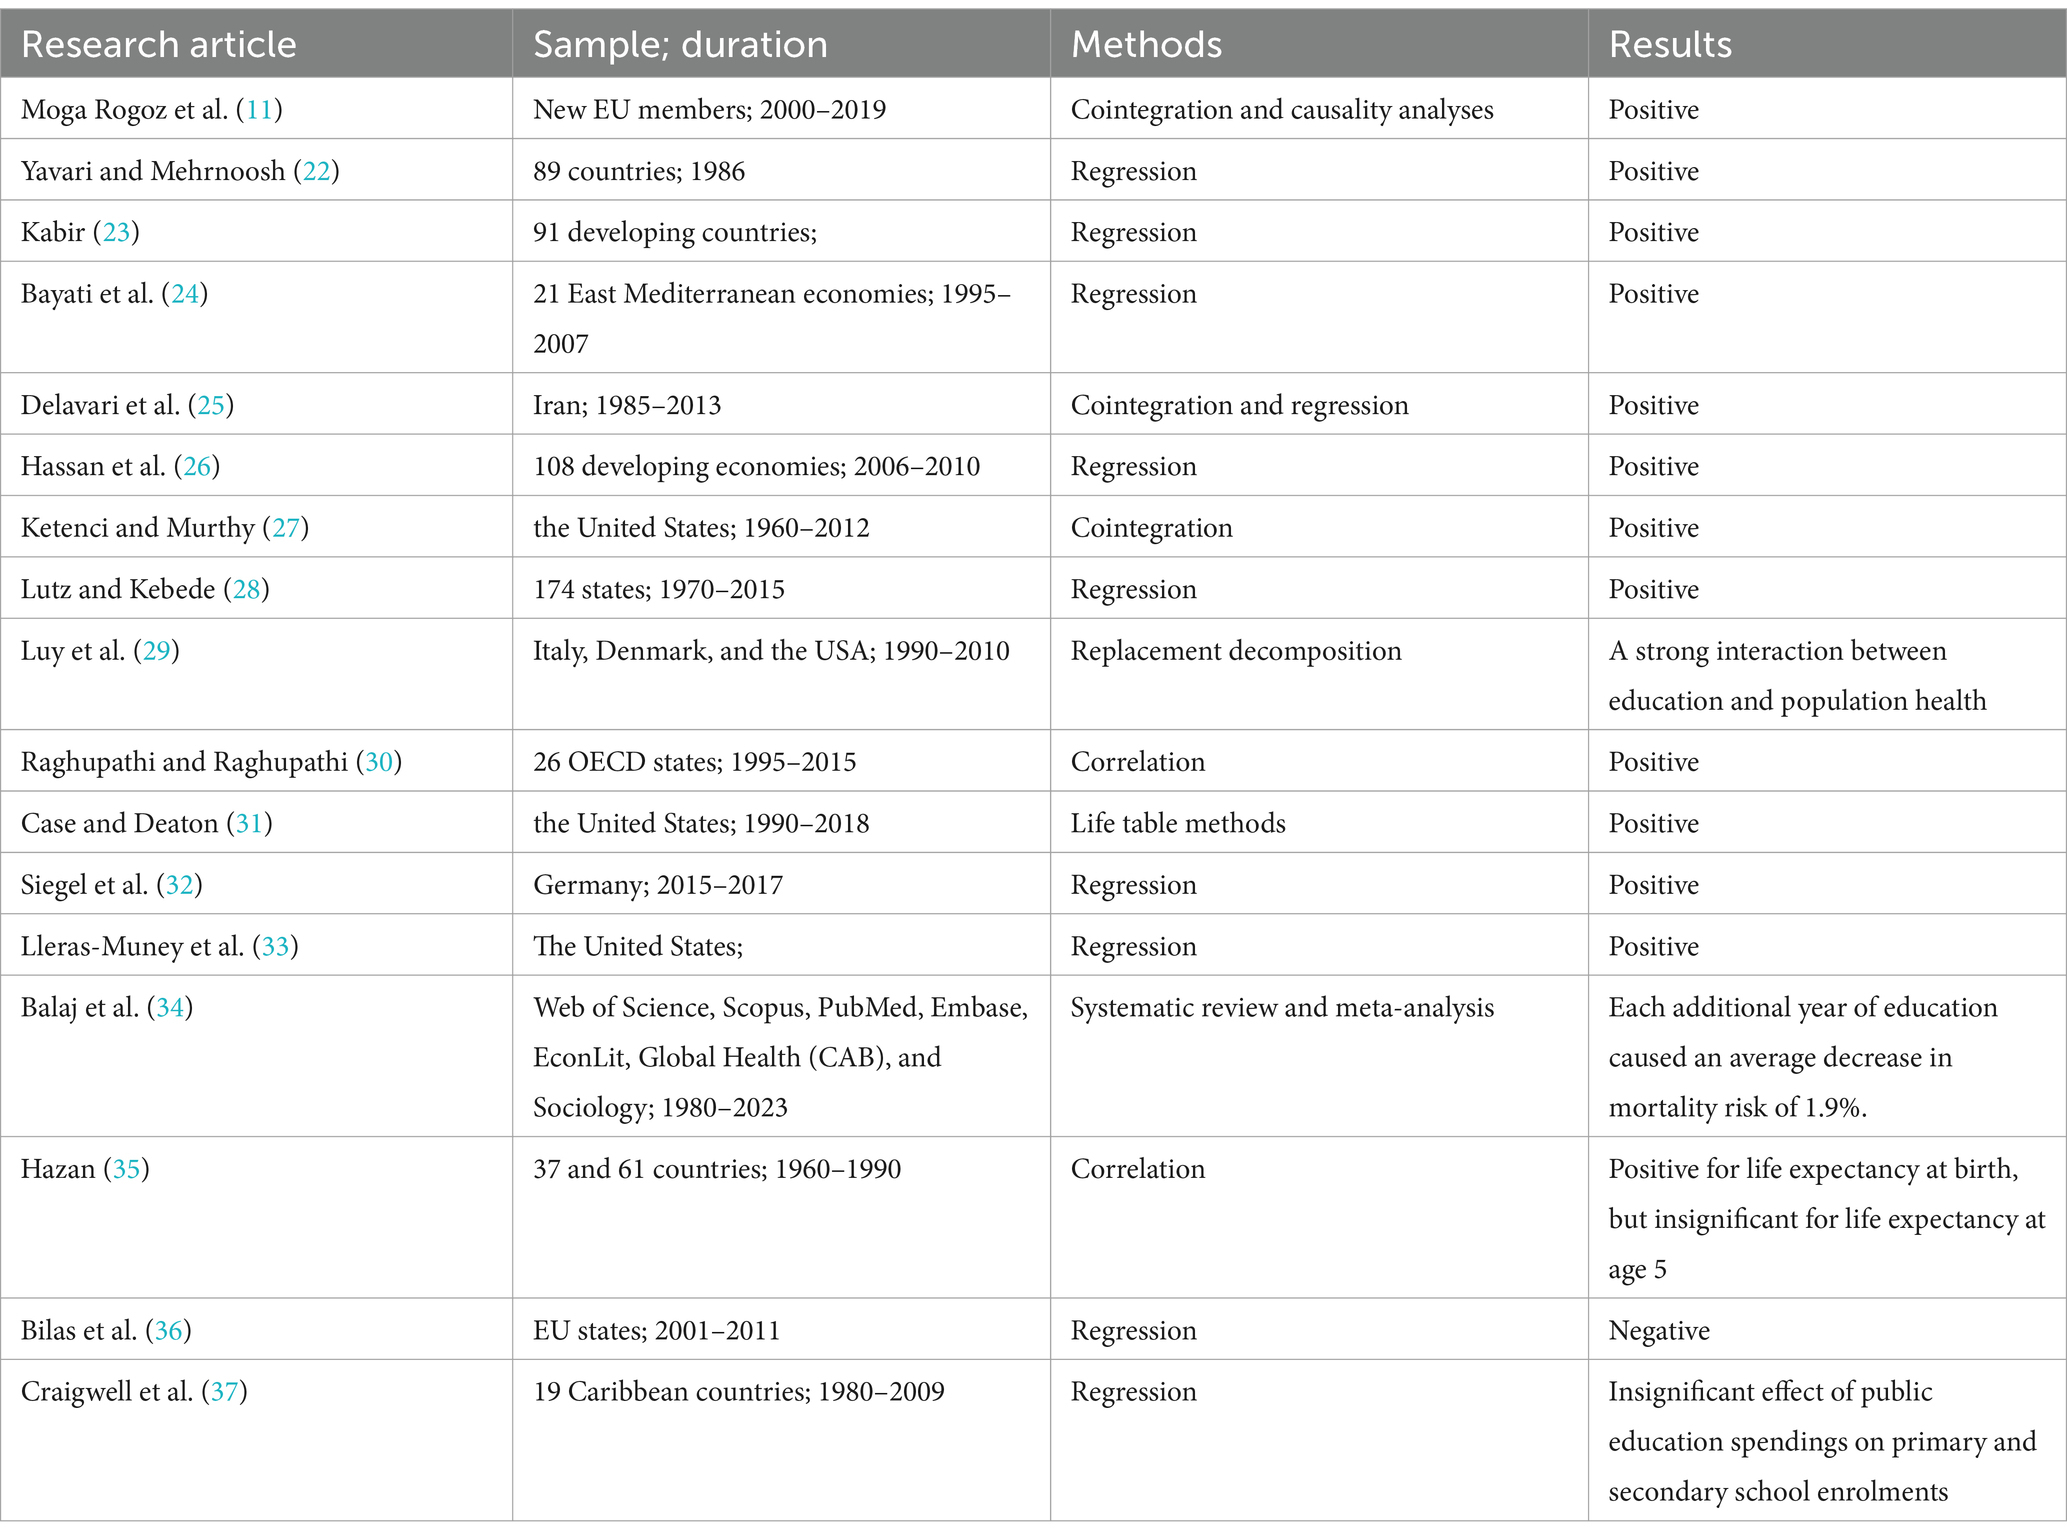
Table 2. Literature summary on the interplay between life expectancy and education proxies.
The relationship between health expenditures and life expectancy have been widely investigated and the empirical studies in Table 3 have unveiled a positive effect of health expenditures on life expectancy. However, van den Heuvel and Olaroiu (16) found that healthcare expenditures are not one of the main drivers of life expectancy. Last, Tarcă et al. (2), Lin et al. (38), Ali and Ahmad (39), Monsef and Mehrjardi (40), OECD (41), Aydin (42), Păunică et al. (43), Wirayuda and Chan (44), Aanegola et al. (45), Karma (46), Anwar et al. (47), Roffia et al. (8) also suggested the income as one of the main drivers of life expectancy.
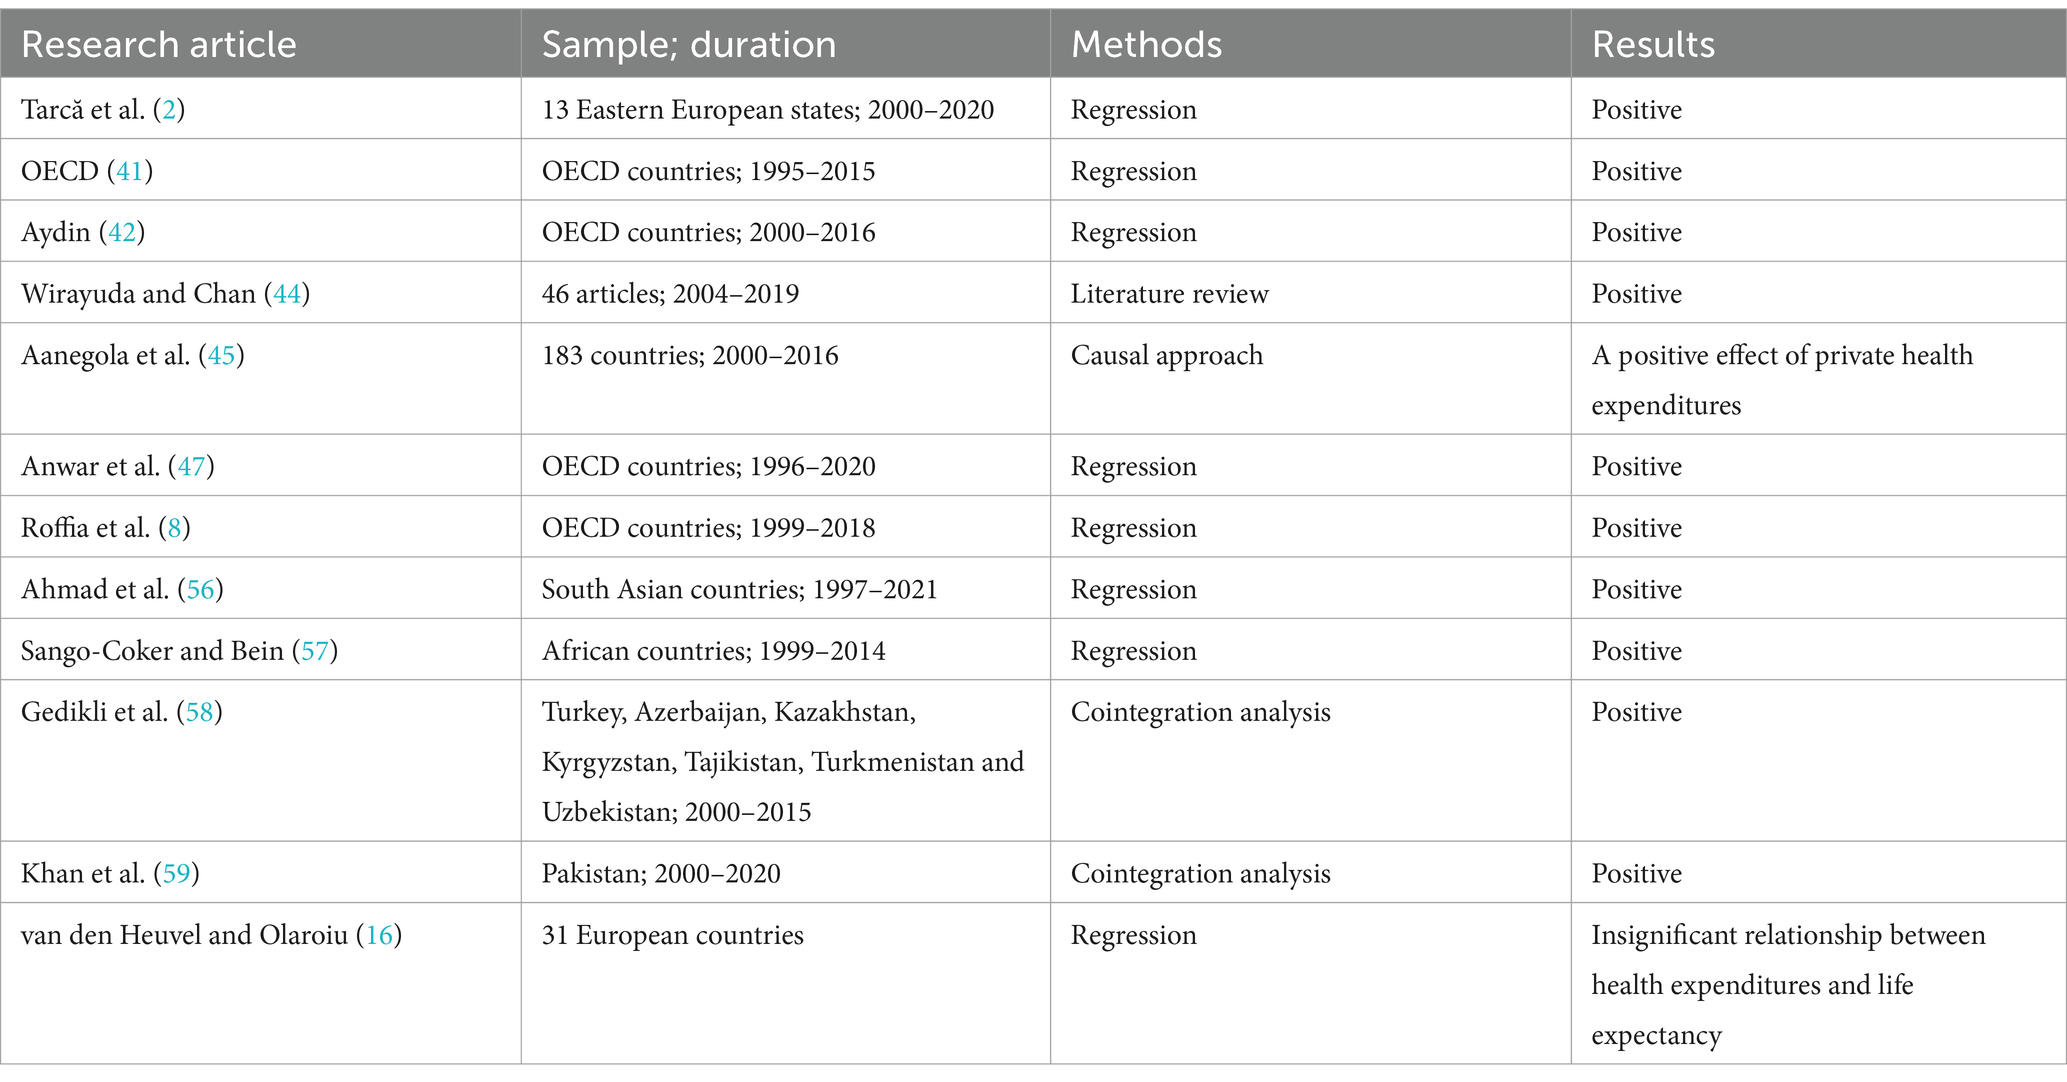
Table 3. Literature summary on the interplay between life expectancy and health expenditures.
Based on the explored literature, the research hypotheses of our research article are established as follows:
HP1: Public social expenditures have a positive effect on indicators of life expectancy in the long-term.
HP2: Public education expenditures have a positive effect on indicators of life expectancy in the long-term.
HP3: Health expenditures have a positive effect on indicators of life expectancy in the long-term.
HP4: Real GDP per capita has a positive effect on indicators of life expectancy in the long-term.
3 Data and methods
The article examines the long-term effects of social, educational, and health expenditures together with real GDP per capita on indicators of life expectancy using the Westerlund and Edgerton (48) bootstrap cointegration test. The variables considered in the econometric applications are listed in Table 4. Population health is proxied by healthy life expectancy at birth and 60, life expectancy at birth and 60 and these variables are sourced from World Health Organization (49, 50). Public social and educational expenditures are represented by total public social expenditures and government expenditure on education as a percentage of GDP, respectively. Public social expenditures are sourced from the OECD (51), and government education expenditures are obtained from the World Bank (36). Health expenditures are proxied by current health expenditure as a percent of GDP and income is represented by GDP per capita based on constant 2015 US$. Both variables are, respectively, provided from World Bank (52, 53). The variables of social, educational, and health expenditures are available as a percent of GDP in databases of OECD and World Bank. This form of data enables us to compare the variables among countries and/or over time in connection with the overall size of the economy (36).
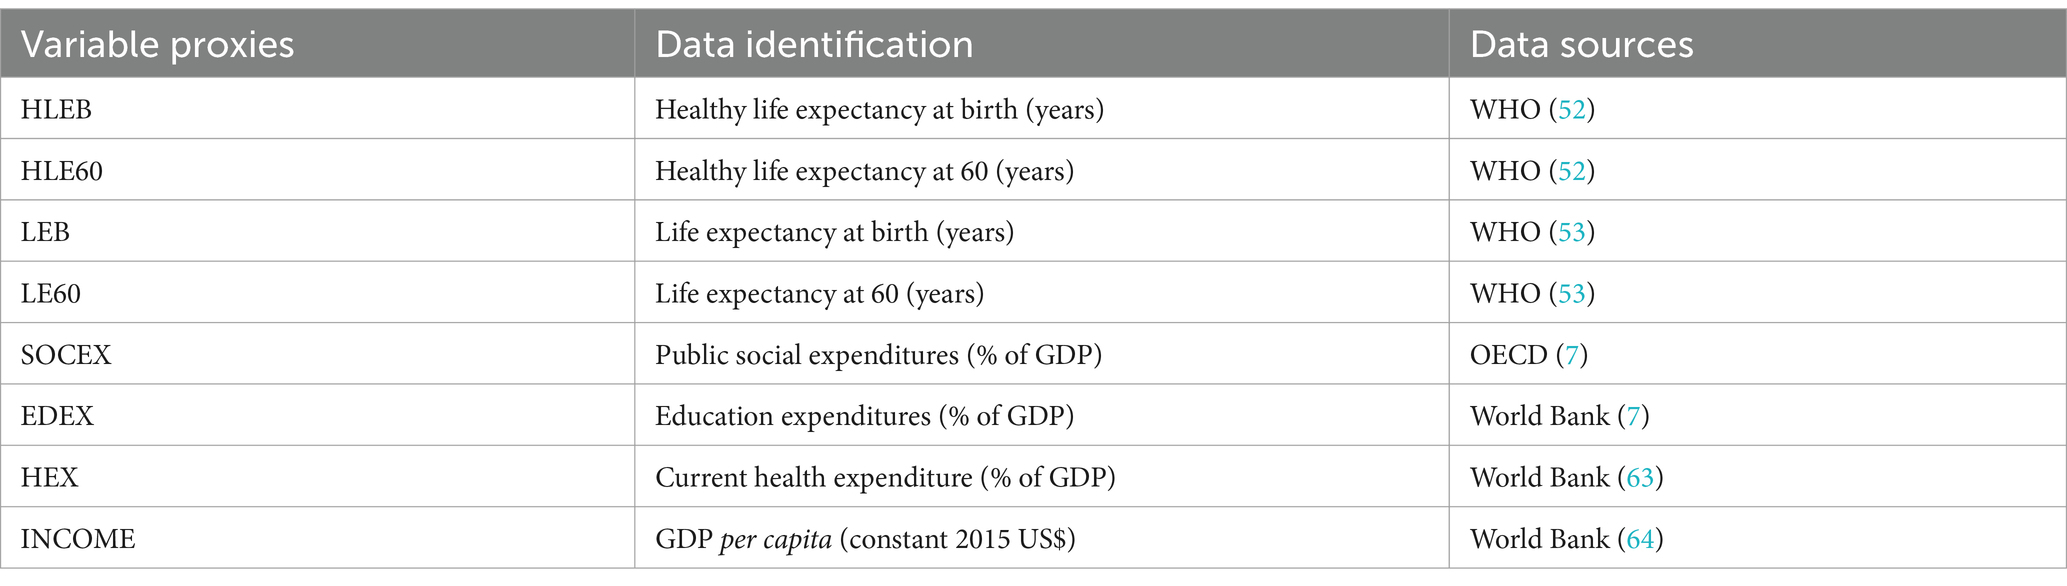
Table 4. Description of variables.
The sample of the research includes 32 OECD members (Austria, Belgium, Canada, Chile, Czechia, Denmark, Estonia, Finland, France, Germany, Greece, Hungary, Iceland, Ireland, Israel, Italy, Japan, Korea, Latvia, Lithuania, Luxembourg, Netherlands, Norway, Poland, Portugal, Slovak Republic, Slovenia, Spain, Sweden, Switzerland, the United Kingdom, and the United States), selected due to the availability of public social and educational expenditures. The dataset spans from 2005 to 2021, as government expenditure on education is available starting in 2005 for most OECD states and continues until 2021.
The econometric analyses are conducted using statistical packages Gauss 12.0, EViews 10.0, and Stata 17.0. According to the summary indicators in Table 5, the average of healthy life expectancy and life expectancy at birth are, respectively, 68.970 years and 78.863 years while the average of healthy life expectancy and life expectancy at 60 are 17.441 years and 22.491 years. On the other hand, the average values of total public social and educational expenditures and health expenditures as a percentage of GDP are 21.106 and 5.185%, and 8.654% of GDP, respectively. Lastly, the average of real GDP per capita is USD 37033.040 While real GDP per capita and public social expenditures show a remarkable variation among OECD states, indicators of life expectancy, public educational expenditures, and health expenditures have been relatively more stable during the period from 2005 to 2021.
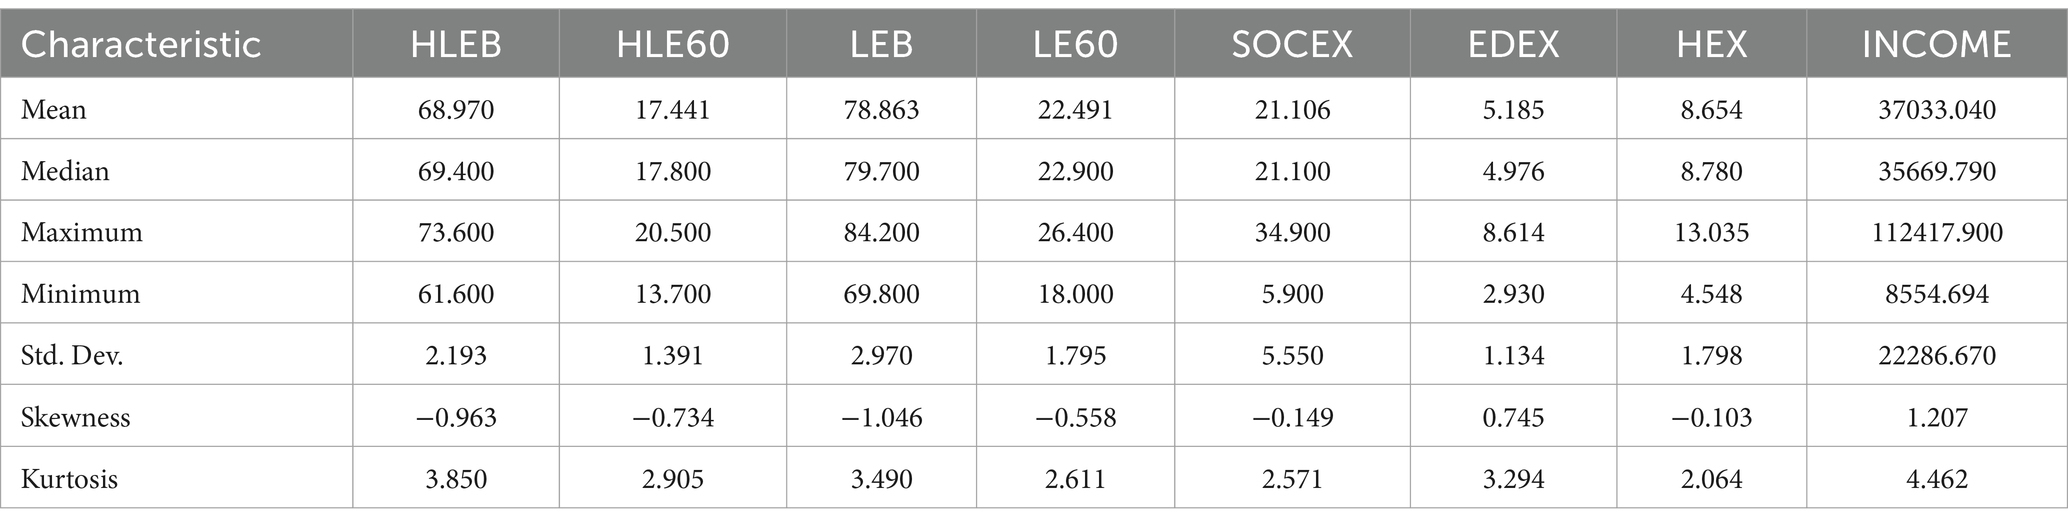
Table 5. Summary indicators of the variables.
The correlation matxrix among the explanatory variables is displayed in Table 6. The correlation matrix shows us that a positive correlation among social expenditures, educational expenditures, health expenditures, and income proxied by real GDP per capita. Furthermore, relatively low correlation coefficients demonstrate the non-existence of multicollinearity problem.
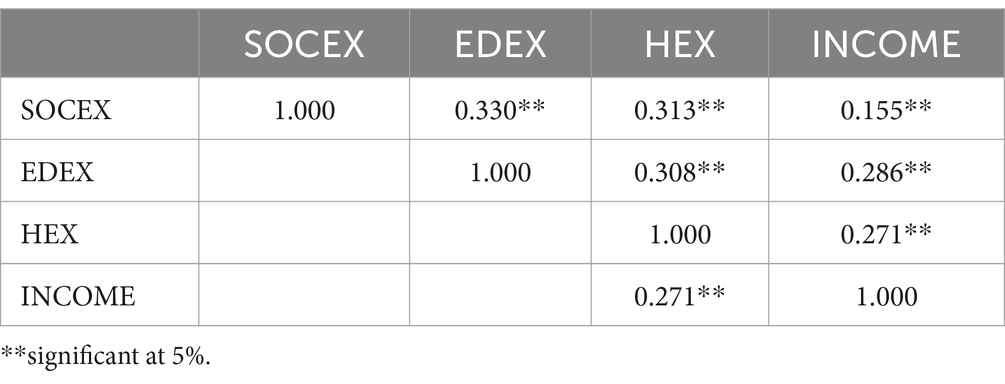
Table 6. Correlation matrix.
The effect of total public social and educational expenditures, health expenditures, and income on healthy life expectancy at birth and 60 and life expectancy at birth and 60 among OECD members is investigated using four models presented in Equations 1–4. The dependent variables are healthy life expectancy at birth (HLEB), healthy life expectancy at 60 (HLE60), life expectancy at birth (LEB) and life expectancy at 60 (LE60). On the other hand, the independent variables are public social expenditures (SOCEX), government expenditure on education (EDEX), health expenditures (HEXP), and real GDP per capita (INCOME).
where i and t demonstrate the OECD members and years, respectively.
In the econometric application of this article, cross-sectional dependency (CD) tests and homogeneity tests are initially performed to select appropriate cointegration and unit root tests. In this context, the stationarity of the series under consideration is analyzed using the Pesaran (54) CIPS test due to CD among the variables described in four models.
Subsequently, the cointegration relationship among the variables is examined using Westerlund and Edgerton’s (48) LM cointegration test to see the long-term relationship among social, educational, and health expenditures, real GDP per capita, and indicators of life expectancy. This test produces robust long-term coefficients in case of CD through bootstrapping (48) unlike the traditional cointegration tests. Otherwise, asymptotic approach is used. Furthermore, Westerlund and Edgerton’s (48) LM cointegration test allows for dependence both between and within the cross-sections in the cointegration equation. Last, the test is is proven to be efficient in small datasets (48). In conclusion, Westerlund and Edgerton’s (48) LM cointegration test is selected considering the presence of CD and our dataset size. The test is derived from Equations 5–7.
i and t demonstrate the OECD countries and the years of the panel. is the disturbance term. LM statistic of the cointegration test is figured out as following:
In Equation 7, is partial total of and is long-term variance of . Both are derived from a cointegration model using fully modified ordinary least squares. The null hypothesis proposes the presence of a cointegration relationship among the variables under consideration. Asymptotic and bootstrap critical values are generated from normal distributions and bootstrapping, respectively, to test the hypotheses. Bootstrap p values are used if CD exists among the variables; otherwise, asymptotic p values are applied.
Finally, the AMG (Augmented Mean Group) estimator, introduced by Eberhardt and Bond (55), is employed to estimate the panel and cross-sections’ cointegration coefficients. This estimator accounts for CD and heterogeneity and provides coefficients for both the panel and individual OECD countries. The estimation by the AMG is implemented at two stages. At the first stage, model is estimated through the first differences of the variables as in Equation 8 because non-stationary variables and unobservable factors produce biased results in the regression with the level values of the variables. Thus, time dummy variables of are obtained (55).
At the second stage, the model in Equation 9 is estimated. The time dummy variable is included in the regression of each cross-section. AMG estimations are calculated as the average of each cross-section coefficient (55).
4 Results and discussion
In the application section of our research paper, cross-sectional dependency (CD) and heterogeneity are initially examined using CD and delta tilde tests, respectively. The CD among the series is analyzed using LM, LM CD, and LMadj. tests, and the results of these tests are presented in Table 7. The null hypothesis favoring CD independence is rejected because the p-values of the LM, LM CD, and LMadj. tests are below 5%. Consequently, the CD among the variables is confirmed.
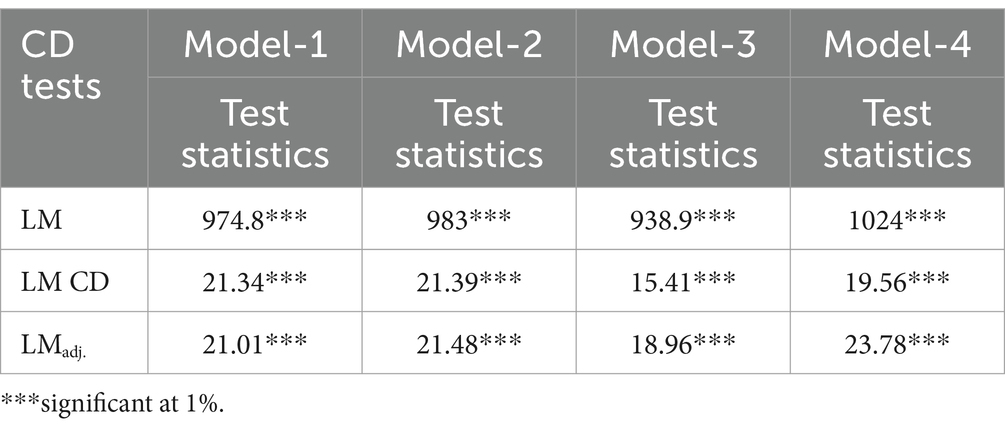
Table 7. Results of LM, LM CD, and LMadj. tests.
The presence of heterogeneity is also explored using delta tilde tests, and the findings are presented in Table 8. The null hypothesis of homogeneity for both delta and adjusted delta tests is rejected, confirming the presence of heterogeneity. Based on the results of the CD and heterogeneity tests, it is recommended that tests of cointegration and unit roots that consider CD and heterogeneity are preferred due to their relatively more robust outcomes.
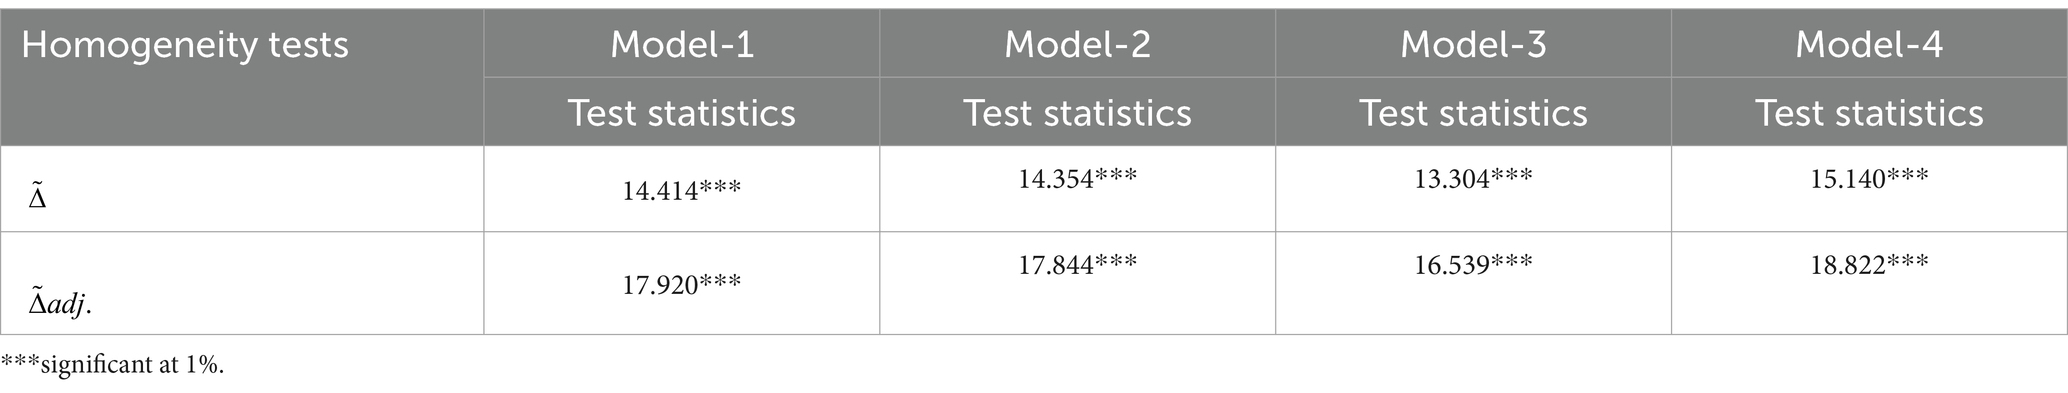
Table 8. Consequences of delta tilde tests.
The presence of unit roots in the series employed in the cointegration analysis is examined using the panel CIPS test, due to the presence of cross-sectional dependency. The CIPS test statistics are presented in Table 9. The results of the unit root tests reveal that the series include unit roots at level values. However, the first differences of the variables do not exhibit unit roots and become stationary.
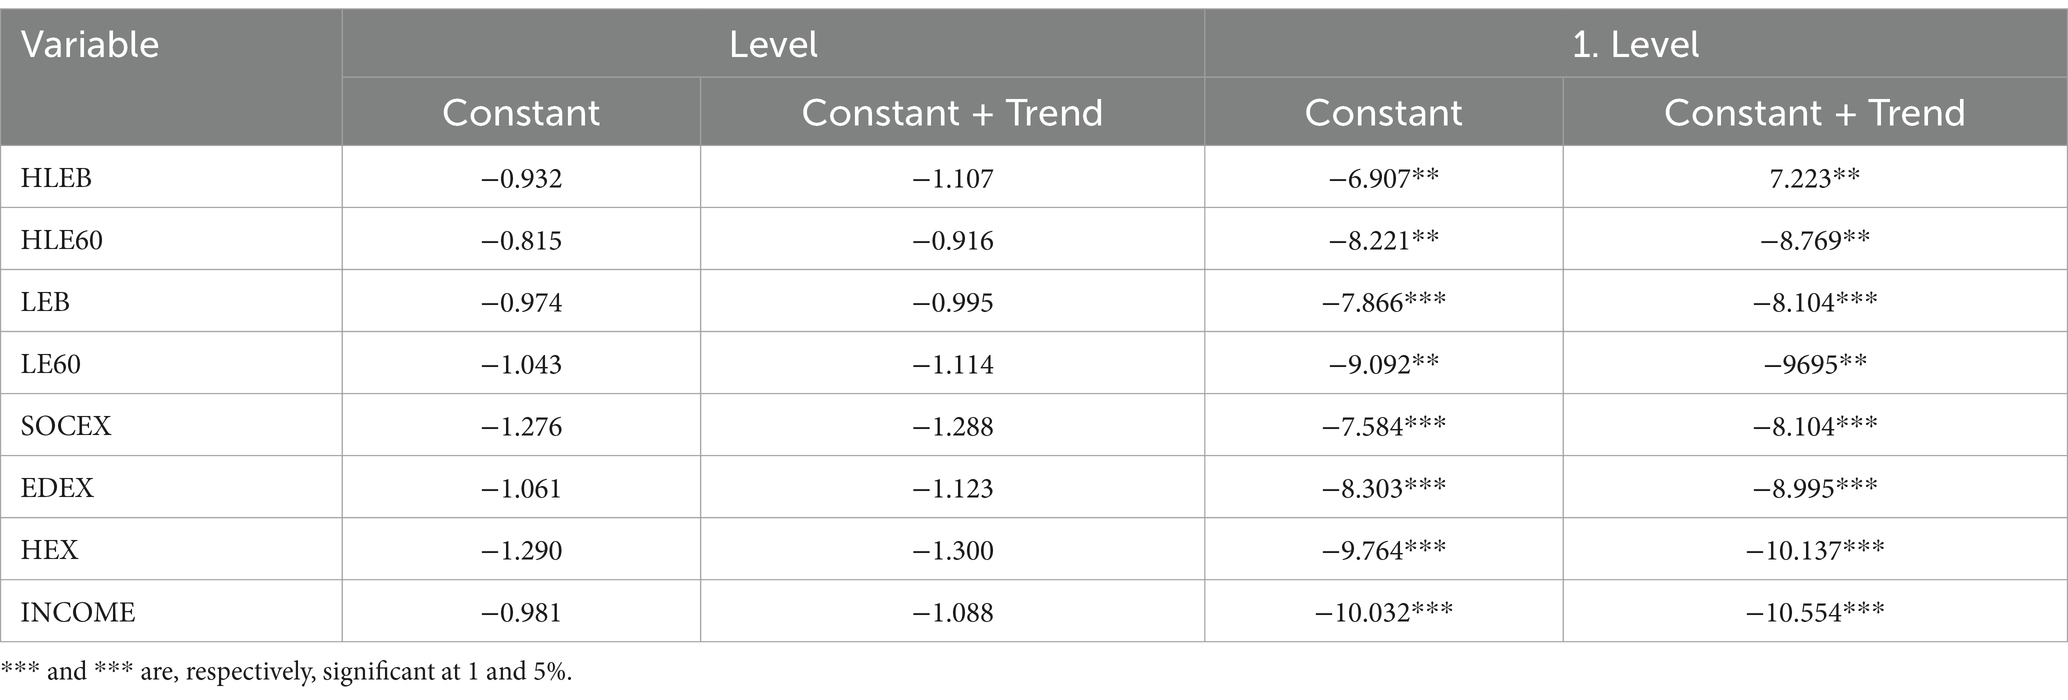
Table 9. Consequences of CIPS test.
The cointegration relationship among indicators of life expectancy, social and educational spending, health expenditures and real GDP per capita is investigated using the Westerlund and Edgerton (48) LM cointegration test. The LM test statistics, along with bootstrap and asymptotic p-values, are presented in Table 10. Due to the bootstrap p-values and the presence of cross-sectional dependency, the null hypothesis, which posits the existence of a long-term relationship among the indicators of life expectancy, social, educational, and health expenditures, and real GDP per capita, is accepted.
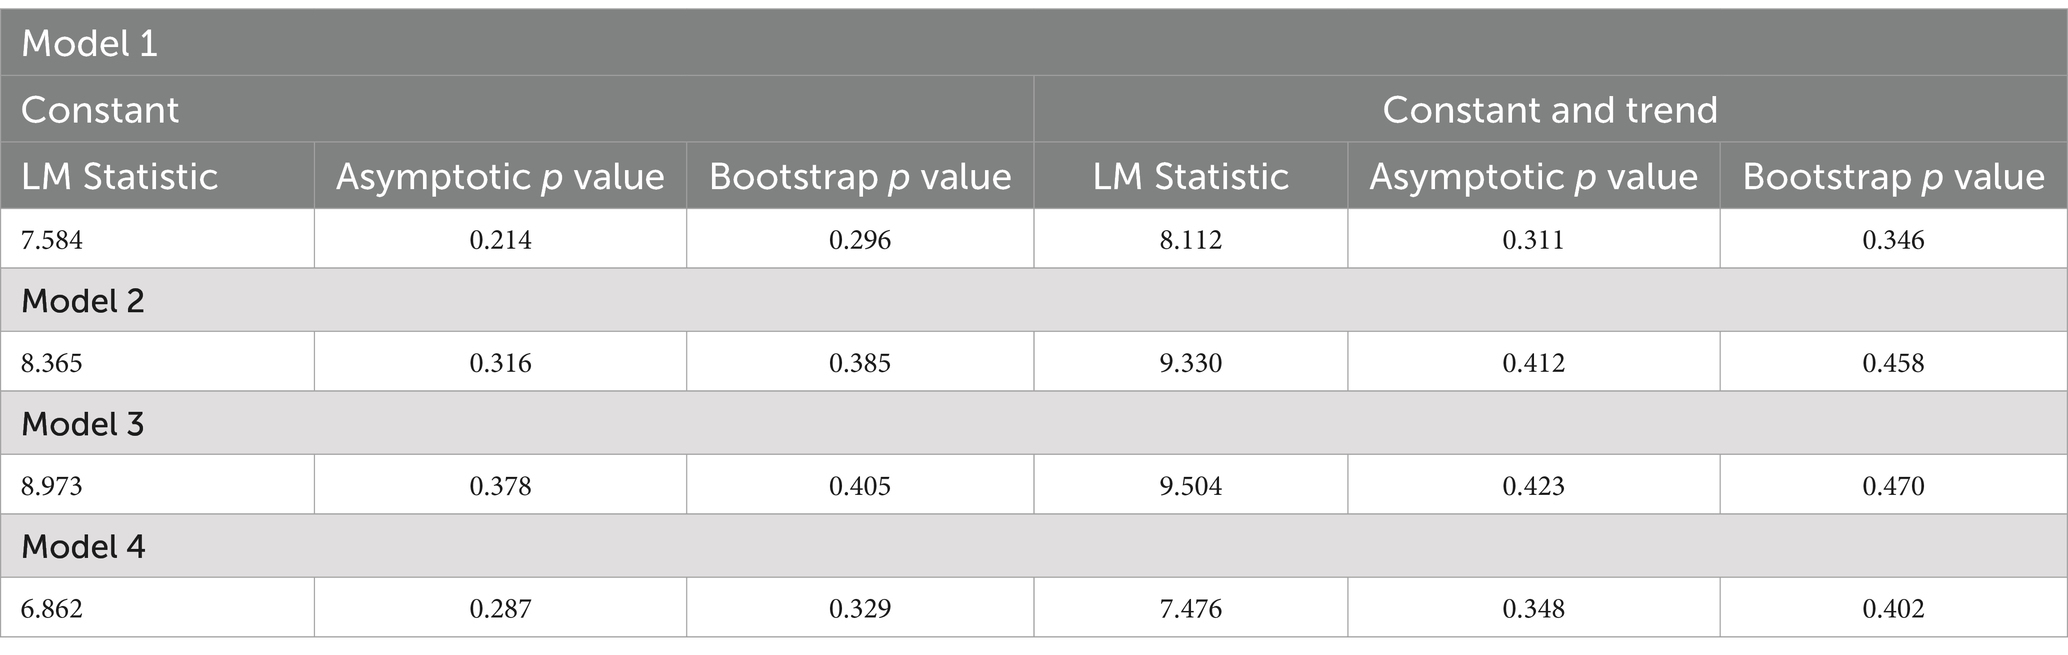
Table 10. Consequences of Westerlund and Edgerton Cointegration test.
The AMG estimator is used to estimate the long-term cointegration coefficients at both panel and cross-sectional levels, and these coefficients are presented in Tables 11, 12. Table 11 demonstrates that social expenditures positively impact healthy life expectancy at birth and 60 in nearly all OECD countries except Estonia, Latvia, Lithuania, and Slovakia, but educational and health expenditures and real GDP per capita positively affect healthy life expectancy at birth and 60 in all OECD members. Impact of income proxied by real GDP per capita and health expenditures on healthy life expectancy at birth and 60 is found to be relatively much higher than impact of public social and educational expenditures on healthy life expectancy at birth and 60. Furthermore, the long-term coefficients indicate that impact of all variables on healthy life expectancy at birth are generally higher than the impact of all variables on healthy life expectancy at 60.
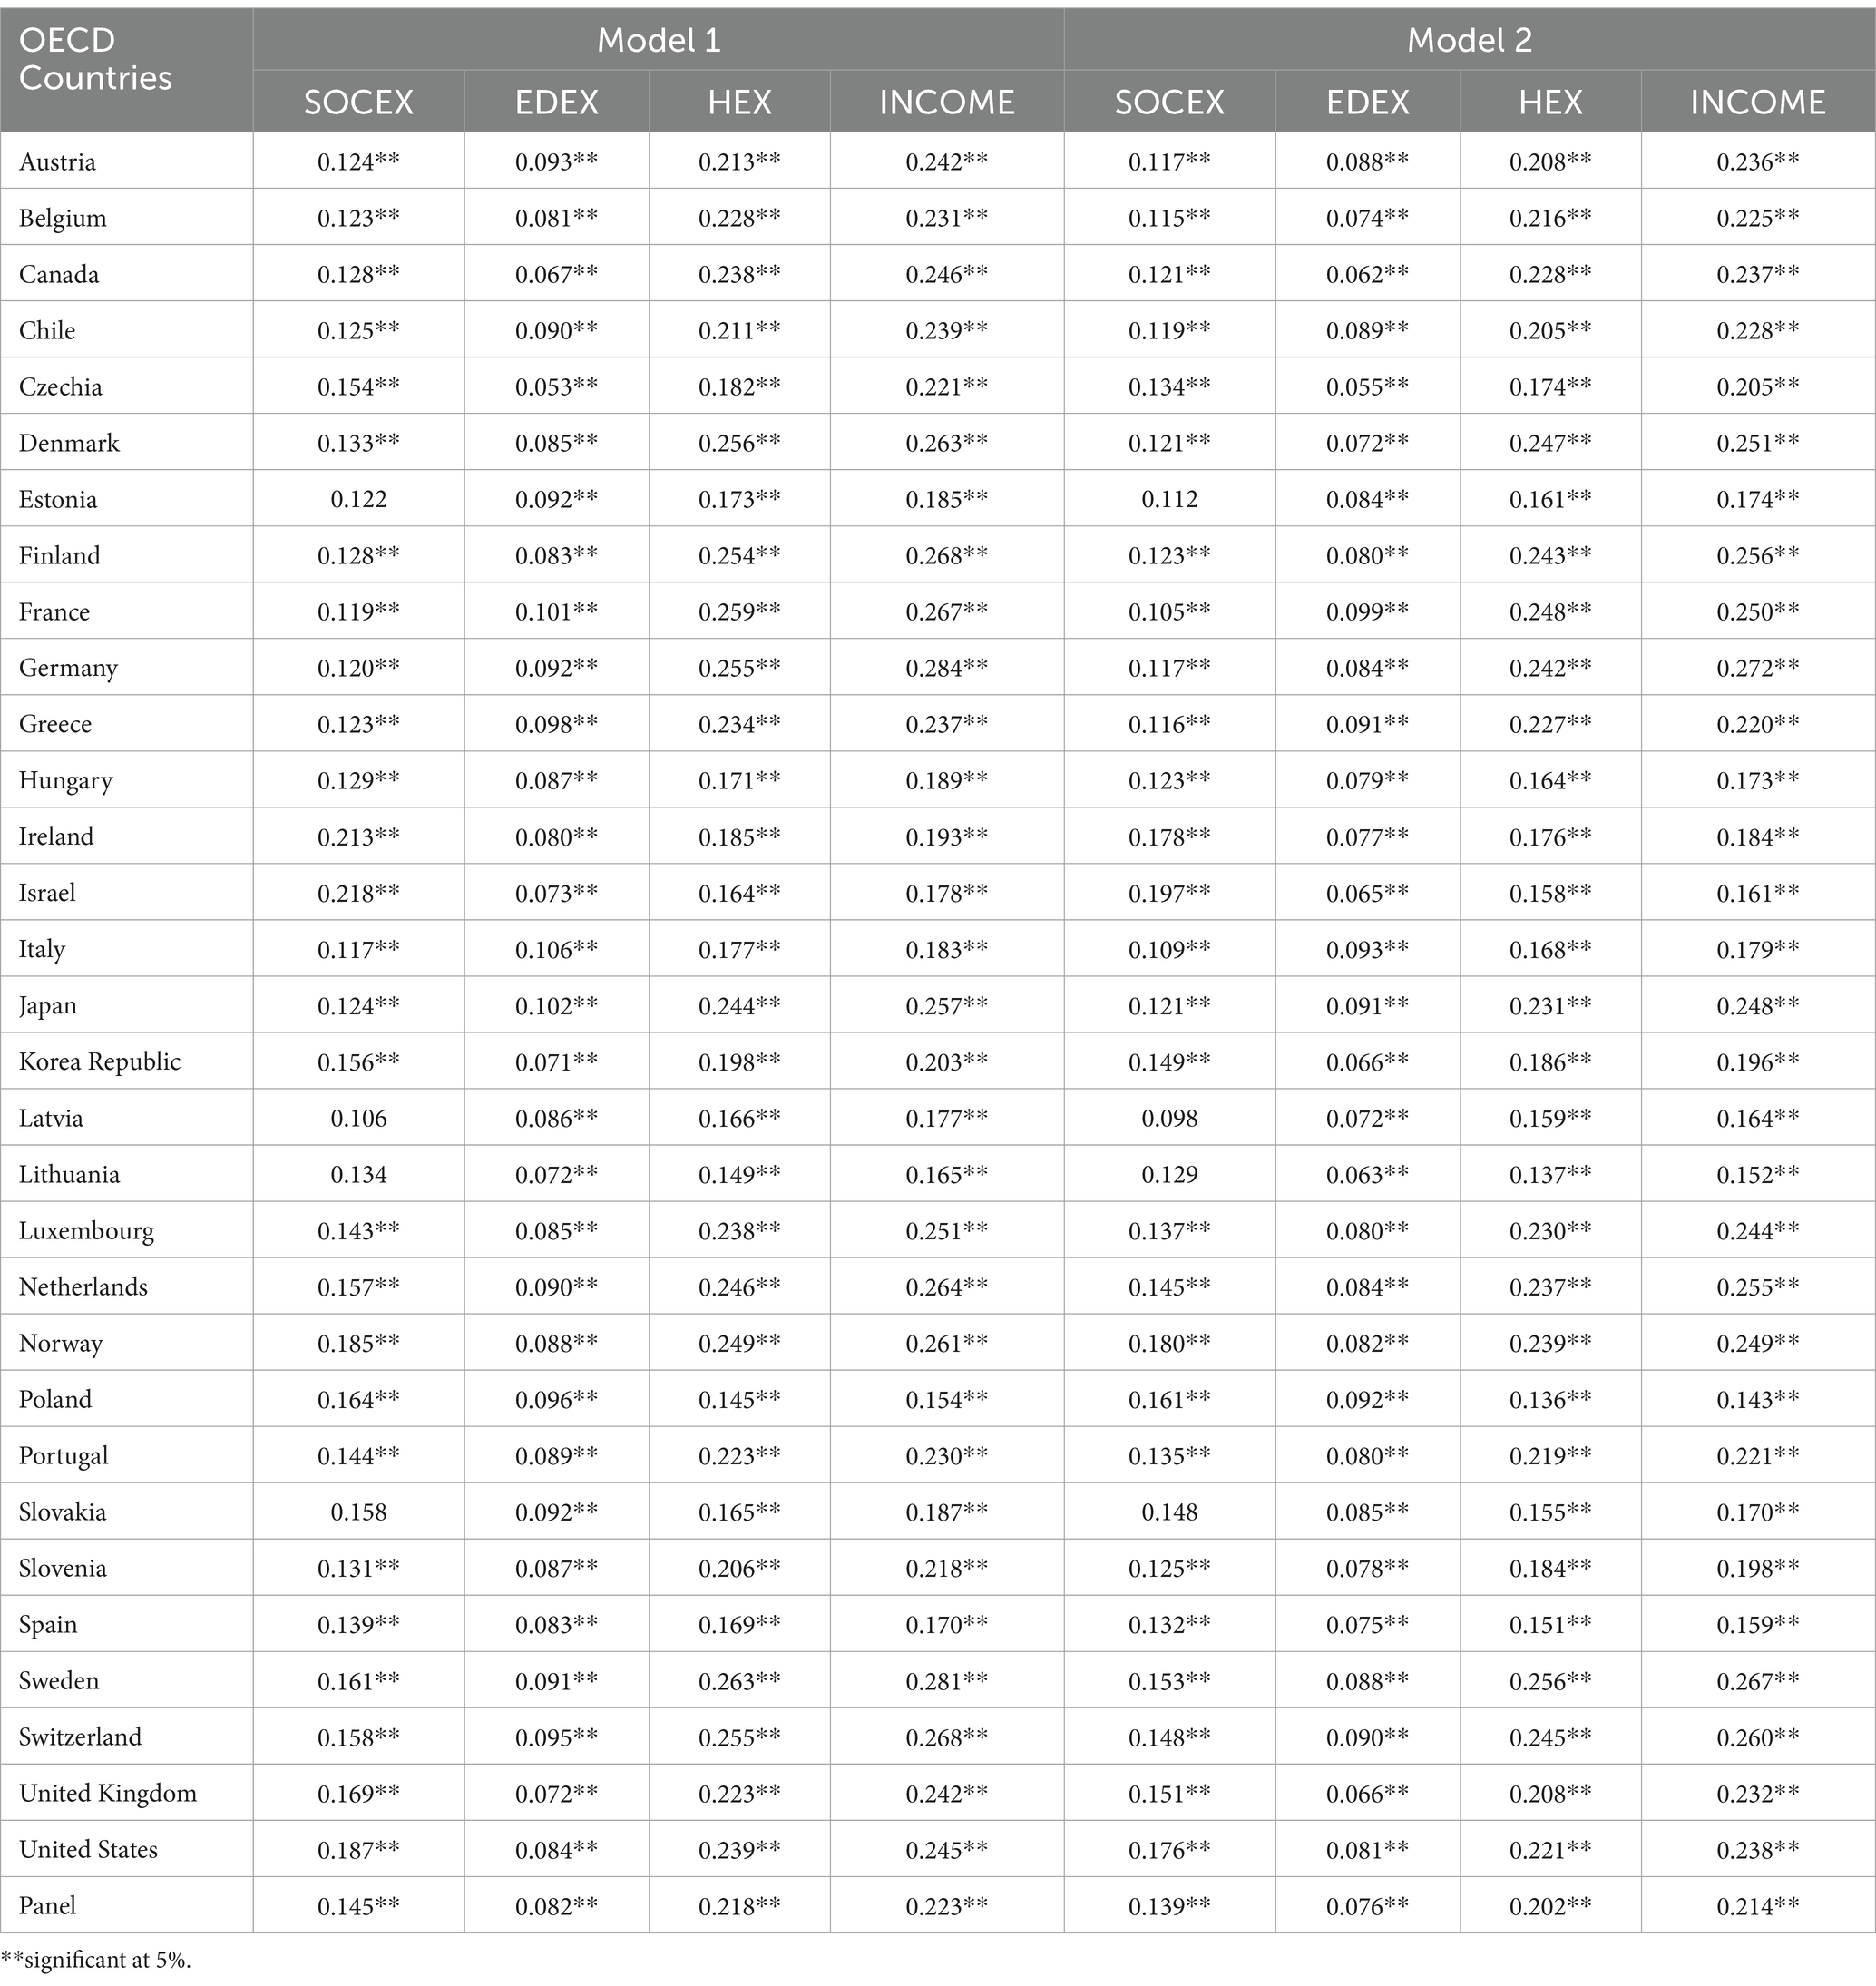
Table 11. Long-term coefficients (Model 1 and 2).
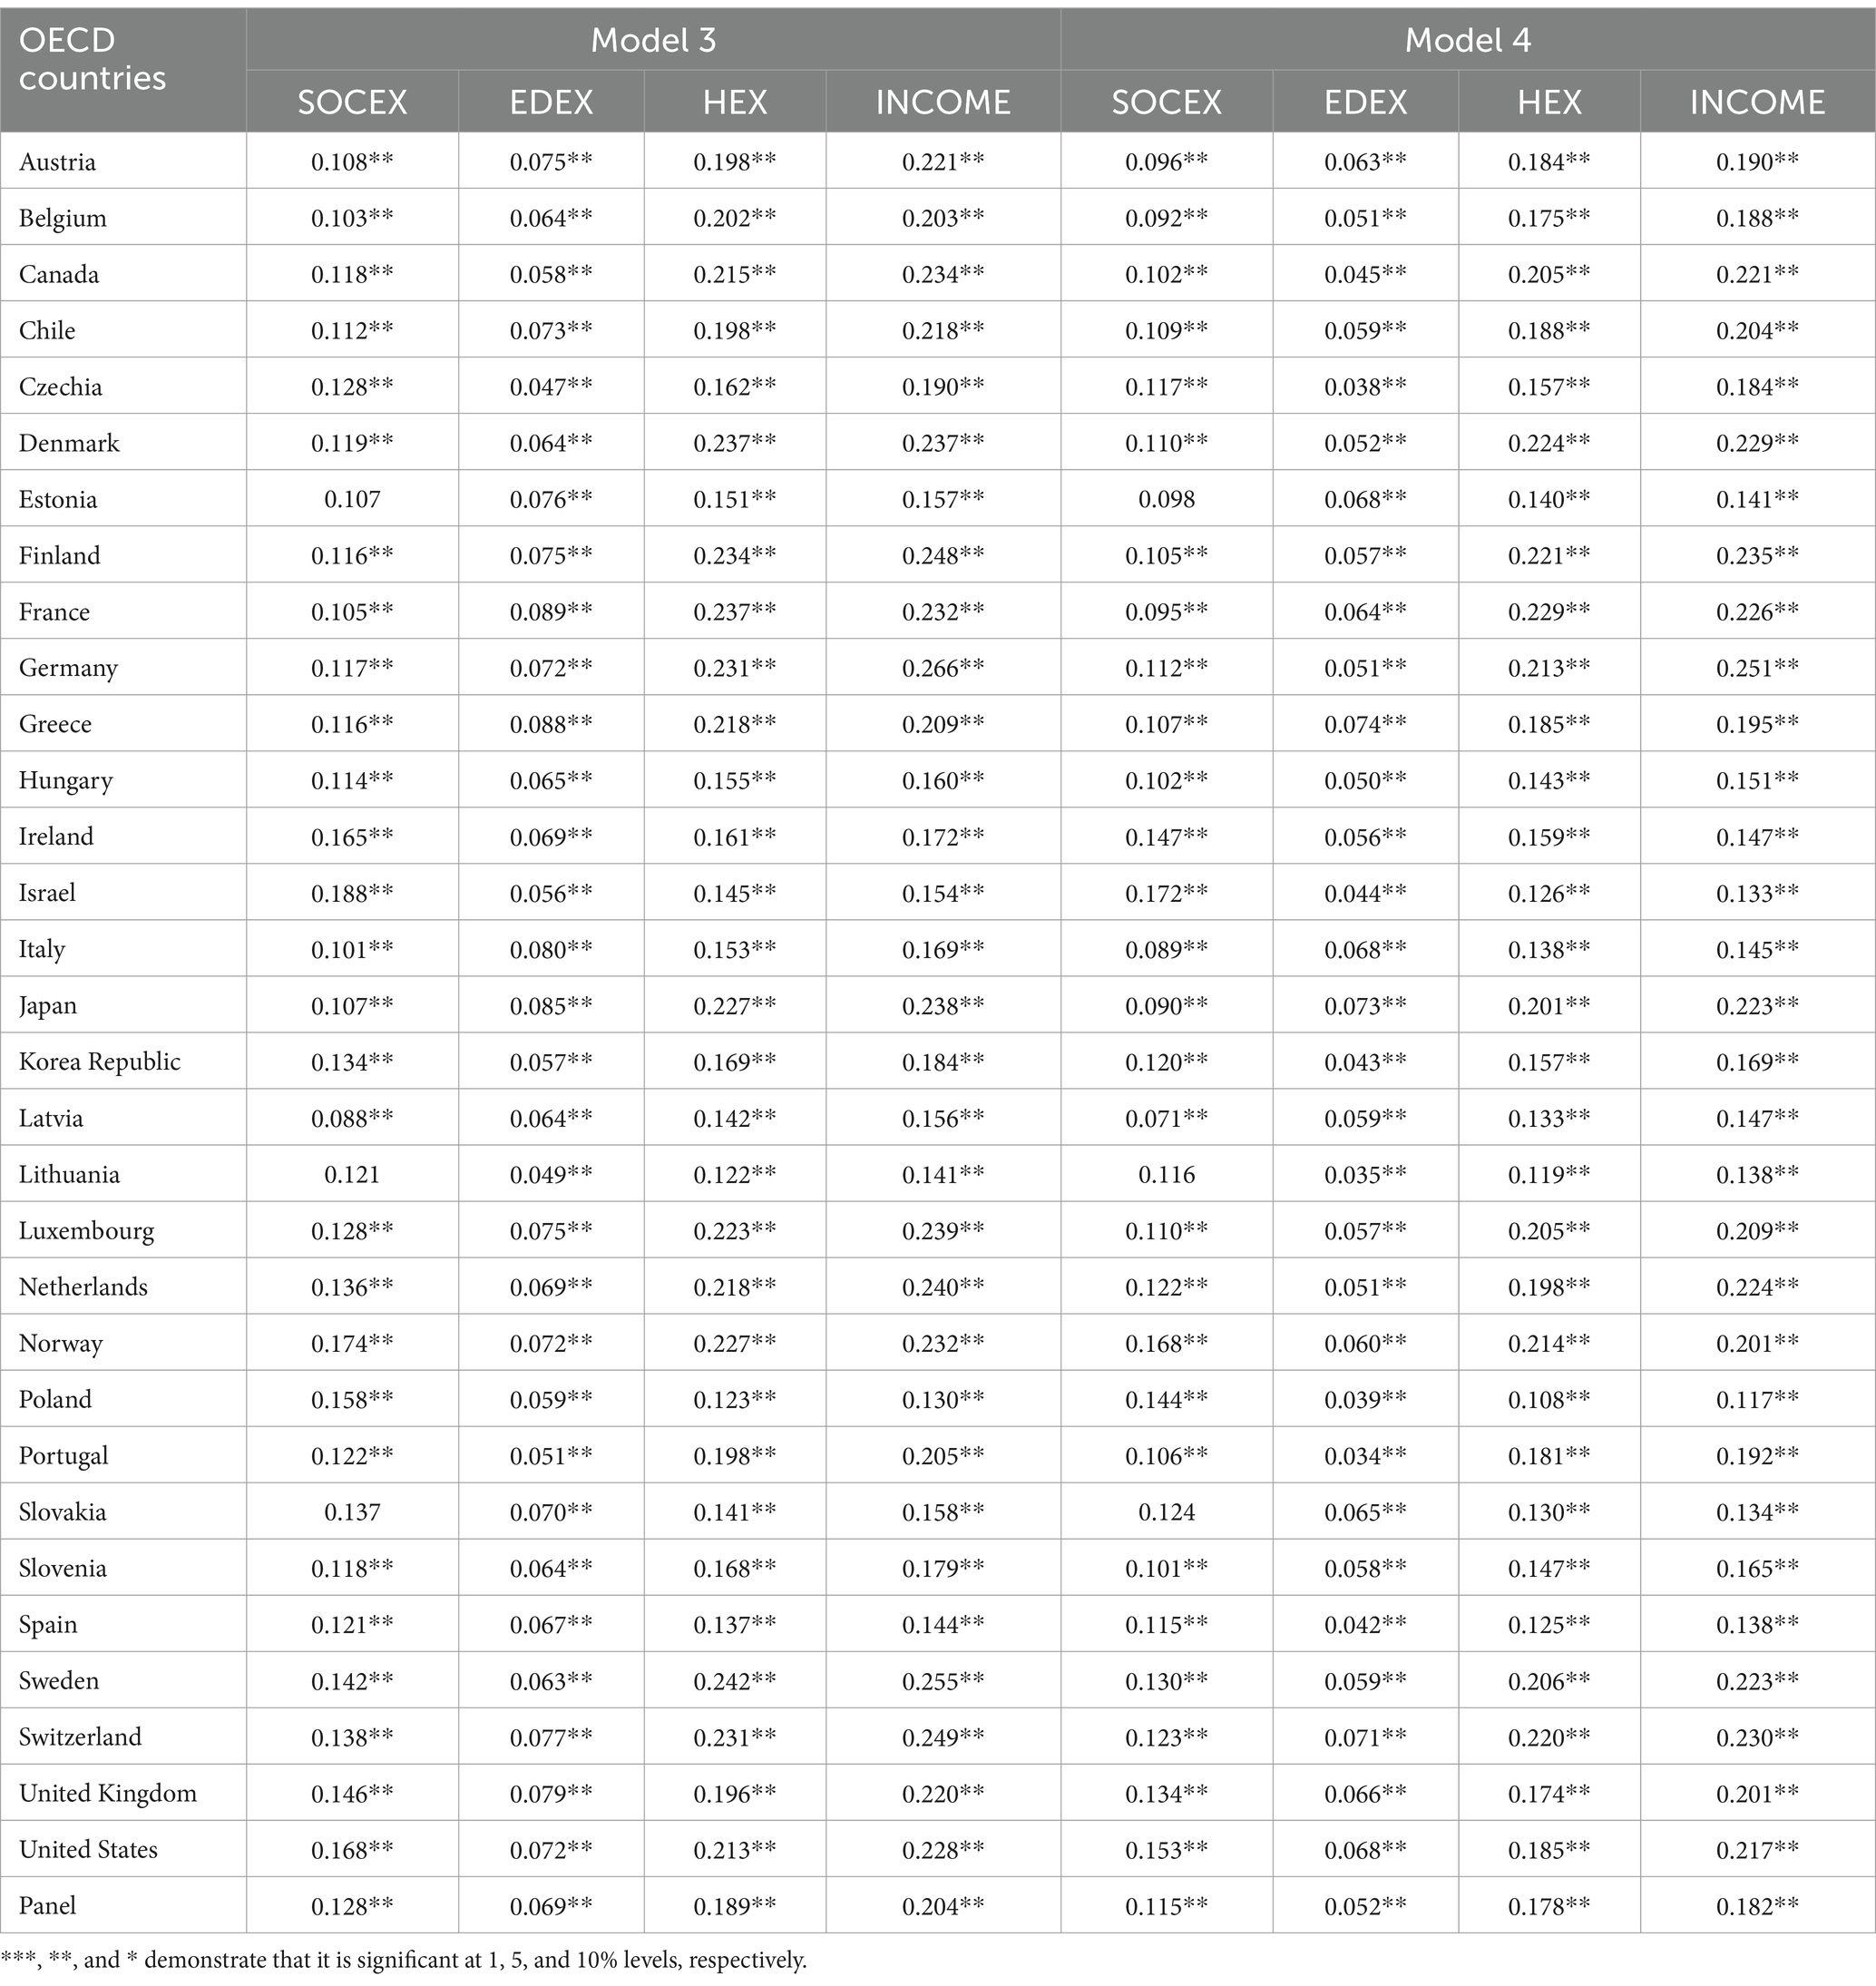
Table 12. Long-term coefficients (Model 3 and 4).
Table 12 presents that social expenditures positively impact life expectancy at birth and 60 in nearly all OECD countries except Estonia, Lithuania, and Slovakia, but educational and health expenditures and real GDP per capita positively affect life expectancy at birth and 60 in all OECD members. Similarly, effect of income and health expenditures are relatively greater than impact of public social and educational expenditures. Furthermore, the long-term coefficients indicate impact of all variables on life expectancy at birth are generally higher than the impact of all variables on life expectancy at 60.
Social expenditures, including cash benefits, tax reductions, and the delivery of goods and services, can positively affect indicators of life expectancy in various ways. Firstly, cash benefits and tax reductions can increase the disposable income of individuals. This increase in personal income can support improvements in life expectancy through higher living standards, better education opportunities, improved medical care, healthier lifestyles, and reduced stress levels. Furthermore, the provision of goods and services can also contribute to life expectancy through enhanced nourishment and lifestyles. Therefore, the positive effect of public social expenditures on life expectancy across all OECD members aligns with associated theoretical views. Additionally, the results of studies by Roffia et al. (8), Dutton et al. (17), Aydan et al. (18), Cardona et al. (19), and Aydan et al. (20) on the influence of social expenditures on life expectancy in OECD countries have support our findings. Our findings also indicate that social expenditures affect not only life expectancy at birth but also healthy life expectancy at birth and 60 and life expectancy at 60 unlike these empirical studies. Furthermore, the effect of social expenditures on healthy life expectancy at birth and life expectancy at birth is usually a little higher than effect of social expenditures on healthy life expectancy at 60 and life expectancy at 60.
Education is one of the most substantial drivers of human capital, which is a key input to economic growth and development. Therefore, education can impact life expectancy through higher living standards and better health facilities. Furthermore, individuals with higher levels of education generally have greater awareness of healthy lifestyles, earn higher wages, and have better access to healthcare facilities. In conclusion, education can enhance life expectancy through these channels. This research investigates the effect of public education expenditures on life expectancy. Public education expenditures can increase life expectancy if they improve educational attainment (37). Our findings demonstrate that public educational investments enhance education and, in turn, life expectancy. However, Craigwell et al. (37) found an insignificant effect of public education spending on education. The existing empirical literature has also revealed a positive effect of various educational indicators on life expectancy (11, 22–33), and our findings largely align with the related literature and also indicate that education fosters healthy life expectancy at birth and 60 and life expectancy at 60 differently from the results of these empirical studies.
Income and health expenditures have been revealed to be the main drivers of life expectancy because health expenditures can positively affect life expectancy through improvements in health care and income can affect life expectancy through easier access to healthy life style and appropriate healthcare. Our results also reveal that income and health expenditures have relatively more effective on indicators of life expectancy. Similarly, Tarcă et al. (2), Lin et al. (38), Ali and Ahmad (39), Monsef and Mehrjardi (40), OECD (41), Aydin (42), Păunică et al. (43), Wirayuda and Chan (44), Aanegola et al. (45), Karma (46), Anwar et al. (47), Roffia et al. (8) also discovered a positive influence of income on life expectancy. On the other hand, Tarcă et al. (2), OECD (41), Aydin (42), Wirayuda and Chan (44), Aanegola et al. (45), Anwar et al. (47), Roffia et al. (8), Ahmad et al. (56), Sango-Coker and Bein (57), Gedikli et al. (58), and Khan et al. (59) also found that health expenditures fostered the life expectancy. Our study also indicates that both income and health expenditures also fostered the healthy life expectancy at birth and 60 and life expectancy at 60 unlike these empirical studies.
5 Conclusion, limitations, and policy recommendations
Life expectancy is one of the key indicators of a population’s health, living standards, and lifestyle. Therefore, one of the ultimate goals is to improve life expectancy in good health. In this regard, a remarkable improvement in life expectancy has been achieved globally, and the gap in life expectancy levels between countries has also partially decreased. However, a significant difference in life expectancy persists between developed and underdeveloped countries. These inequalities in life expectancy have motivated researchers to explore the economic, social, institutional, and environmental factors driving these disparities. This article investigates the long-term effect of public social and educational expenditures, health expenditures, and real GDP per capita on life expectancy in OECD member countries using a second-generation cointegration test.
The study includes the following limitations: First, availability of social and educational expenditures data limits our ability to perform econometric analyses for the 2005–2021 period and 32 OECD countries. Secondly, the main focus of the research is to examine the long-term effect of social, educational, and health expenditures together with real GDP per capita on indicators of life expectancy. Therefore, it disregards the delayed effects of the explanatory variables.
The results of the cointegration test show that public social and educational expenditures, health expenditures, and real GDP per capita have a positive long-term effect on indicators of life expectancy in OECD members, but real GDP per capita and health expenditures income are found to be more effective on indicators of life expectancy than that of public social and educational expenditures. Furthermore, the long-term coefficients also indicate that impact of all variables on healthy life expectancy at birth and life expectancy at birth are generally higher than the impact of all variables on healthy life expectancy at 60 and life expectancy at 60. Our results are largely consistent with associated theoretical views and empirical literature, but they also indicate that public social and educational expenditures, health expenditures, and real GDP per capita impact not only life expectancy but also healthy life expectancy.
Based on our empirical findings, social, educational, and health expenditures, and real GDP per capita are significant drivers of life expectancy and healthy life expectancy. Therefore, efficiently utilization of public social and educational expenditures and health expenditures can be used to improve life expectancy. Furthermore, improvements in social, educational, and health expenditures can also foster life expectancy through economic growth and development. Future studies could explore the decomposition of social, educational, and health expenditures’ effects on indicators of life expectancy.
Data availability statement
The original contributions presented in the study are included in the article/supplementary material, further inquiries can be directed to the corresponding author.
Author contributions
LA: Conceptualization, Data curation, Formal analysis, Investigation, Methodology, Supervision, Writing – original draft, Writing – review & editing. GS: Conceptualization, Data curation, Formal analysis, Investigation, Methodology, Writing – original draft, Writing – review & editing. YB: Conceptualization, Data curation, Formal analysis, Investigation, Methodology, Supervision, Writing – original draft, Writing – review & editing. MD: Conceptualization, Data curation, Formal analysis, Investigation, Methodology, Writing – original draft, Writing – review & editing. FS: Conceptualization, Data curation, Formal analysis, Investigation, Methodology, Writing – original draft, Writing – review & editing.
Funding
The author(s) declare that no financial support was received for the research, authorship, and/or publication of this article.
Conflict of interest
The authors declare that the research was conducted in the absence of any commercial or financial relationships that could be construed as a potential conflict of interest.
Publisher’s note
All claims expressed in this article are solely those of the authors and do not necessarily represent those of their affiliated organizations, or those of the publisher, the editors and the reviewers. Any product that may be evaluated in this article, or claim that may be made by its manufacturer, is not guaranteed or endorsed by the publisher.
References
1. OECD (2024). Life expectancy at birth. Available at: https://www.oecd.org/en/data/indicators/life-expectancy-at-birth.html#:~:text=Gains%20in%20life%20expectancy%20at,total%20population%20and%20by%20gender (accessed on 10 May 2024).
2. Tarcă, V, Tarcă, E, and Moscalu, M. Social and economic determinants of life expectancy at birth in Eastern Europe. Health. (2024) 12:1148. doi: 10.3390/healthcare12111148
3. Giouli, E. The role of human Capital in Economic Development in the twenty-first century In: PE Petrakis, editor. Human capital and production structure in the Greek economy. The political economy of Greek growth up to 2030. Cham: Palgrave Macmillan (2022)
4. UNDP (2024). Explore and Download Human Development Data. Available at: https://hdr.undp.org/data-center/documentation-and-downloads (accessed on 14 May 2024).
5. United Nations. (2024). The 17 goals. Available at: https://sdgs.un.org/goals (accessed on 15 May 2024).
6. Aksan, AM, and Chakraborty, S. Life expectancy across countries: convergence, divergence and fluctuations. World Dev. (2023) 168:106263. doi: 10.1016/j.worlddev.2023.106263
7. OECD (2024). Social expenditure aggregates. Available at: https://data-explorer.oecd.org/ (accessed on 20 May 2024).
8. Roffia, P, Bucciol, A, and Hashlamoun, S. Determinants of life expectancy at birth: a longitudinal study on OECD countries. Int J Health Econ Manag. (2023) 23:189–212. doi: 10.1007/s10754-022-09338-5
9. Reynolds, MM, and Avendano, M. Social policy expenditures and life expectancy in high-income countries. Am J Prev Med. (2018) 54:72–9. doi: 10.1016/j.amepre.2017.09.001
10. Baker, D, Leon, J, Smith Greenaway, EG, Collins, J, and Movit, M. The education effect on population health: a reassessment. Popul Dev Rev. (2011) 37:307–32. doi: 10.1111/j.1728-4457.2011.00412.x
11. Moga Rogoz, AT, Sart, G, Bayar, Y, and Gavriletea, MD. Impact of economic freedom and educational attainment on life expectancy: evidence from the new EU member states. Front Public Health. (2022) 10:907138. doi: 10.3389/fpubh.2022.907138
12. Bein, M, and Coker-Farrell, EY. The association between medical spending and health status: a study of selected African countries. Malawi Med J. (2020) 32:37–44. doi: 10.4314/mmj.v32i1.8
13. Acemoglu, D, Aghion, P, and Zilibotti, F. Distance to frontier, selection, and economic growth. J Eur Econ Assoc. (2006) 4:37–74. doi: 10.1162/jeea.2006.4.1.37
14. Khan, H, and Bashar, OKMR. Social expenditure and economic growth: evidence from Australia and New Zealand using Cointegration and causality tests. J Dev Areas. (2015) 49:285–300. doi: 10.1353/jda.2015.0137
15. Preston, SH. The changing relation between mortality and level of economic development. Popul Stud. (1975) 29:231–48. doi: 10.2307/2173509
16. van den Heuvel, WJA, and Olaroiu, M. How important are health care expenditures for life expectancy? A comparative, European analysis. J Am Med Dir Assoc. (2017) 18:276.e9–276.e12. doi: 10.1016/j.jamda.2016.11.027
17. Dutton, DJ, Forest, PG, Kneebone, RD, and Zwicker, JD. Effect of provincial spending on social services and health care on health outcomes in Canada: an observational longitudinal study. CMAJ. (2018) 190:E66–71. doi: 10.1503/cmaj.170132
18. Aydan, S, Bayın Donar, G, and Arıkan, C. The effects of public health and social Spendings on health outcomes: a panel data analysis of OECD countries. Hacettepe Sağlık İdaresi Dergisi. (2021) 24:469–82.
19. Cardona, C, Anand, NS, Alfonso, YN, Leider, JP, McCullough, JM, Resnick, B, et al. County health outcomes linkage to county spending on social services, building infrastructure, and law and order. SSM - Population Health. (2021) 16:100930. doi: 10.1016/j.ssmph.2021.100930
20. Aydan, S, Bayin Donar, G, and Arikan, C. Impacts of economic freedom, health, and social expenditures on well-being measured by the better life index in OECD countries. Soc Work Public Health. (2022) 37:435–47. doi: 10.1080/19371918.2021.2018083
21. Tu, C, Fan, Y, and Fan, J. Universal Cointegration and its applications. iScience. (2019) 19:986–95. doi: 10.1016/j.isci.2019.08.048
22. Yavari, K, and Mehrnoosh, M. Determinants of life expectancy: a cross –country. Iranian Econ Rev. (2006) 11:131–42. doi: 10.22059/ier.2006.30853
23. Kabir, M. Determinants of life expectancy in developing countries. J Dev Areas. (2008) 41:185–204. doi: 10.1353/jda.2008.0013
24. Bayati, M, Akbarian, R, and Kavosi, Z. Determinants of life expectancy in eastern Mediterranean region: a health production function. Int J Health Policy Manag. (2013) 1:57–61. doi: 10.15171/ijhpm.2013.09
25. Delavari, S, Zandian, H, Rezaei, S, Moradinazar, M, Delavari, S, Saber, A, et al. Life expectancy and its socioeconomic determinants in Iran. Electron Physician. (2016) 8:3062–8. doi: 10.19082/3062
26. Hassan, FA, Minato, N, Ishida, S, and Nor, NM. Social environment determinants of life expectancy in developing countries: a panel data analysis. Global J Health Sci. (2017) 9:105. doi: 10.5539/gjhs.v9n5p105
27. Ketenci, N, and Murthy, VNR. Some determinants of life expectancy in the United States: results from Cointegration tests under structural breaks. J Econ Financ. (2018) 42:508–25. doi: 10.1007/s12197-017-9401-2
28. Lutz, W, and Kebede, E. Education and health: redrawing the Preston curve. Popul Dev Rev. (2018) 44:343–61. doi: 10.1111/padr.12141
29. Luy, M, Zannella, M, Wegner-Siegmundt, C, Minagawa, Y, Lutz, W, and Caselli, G. The impact of increasing education levels on rising life expectancy: a decomposition analysis for Italy, Denmark, and the USA. Genus. (2019) 75:11. doi: 10.1186/s41118-019-0055-0
30. Raghupathi, V, and Raghupathi, W. The influence of education on health: an empirical assessment of OECD countries for the period 1995–2015. Arch Public Health. (2020) 78:20–18. doi: 10.1186/s13690-020-00402-5
31. Case, A, and Deaton, A. Life expectancy in adulthood is falling for those without a BA degree, but as educational gaps have widened, racial gaps have narrowed. Proc Natl Acad Sci USA. (2021) 118:e2024777118. doi: 10.1073/pnas.2024777118
32. Siegel, A, Schug, JF, and Rieger, MA. Social determinants of remaining life expectancy at age 60: a district-level analysis in Germany. Int J Environ Res Public Health. (2022) 19:1530. doi: 10.3390/ijerph19031530
33. Lleras-Muney, A, Price, J, and Yue, D. The association between educational attainment and longevity using individual-level data from the 1940 census. J Health Econ. (2022) 84:102649. doi: 10.1016/j.jhealeco.2022.102649
34. Balaj, M, Henson, CA, Aronsson, A, Aravkin, A, Beck, K, Degail, C, et al. Effects of education on adult mortality: a global systematic review and Meta-analysis. Lancet Public Health. (2024) 9:e155–65. doi: 10.1016/S2468-2667(23)00306-7
35. Hazan, M. Life expectancy and schooling: new insights from cross-country data. J Popul Econ. (2012) 25:1237–48. doi: 10.1007/s00148-011-0392-6
36. Bilas, V, Franc, S, and Bosnjak, M. Determinant factors of life expectancy at birth in the European Union countries. Coll Antropol. (2014) 38:1–9.
37. Craigwell, R, Bynoe, D, and Lowe, S. The effectiveness of government expenditure on education and health Care in the Caribbean. Int J Develop Issues. (2012) 11:4–18. doi: 10.1108/14468951211213831
38. Lin, RT, Chen, YM, Chien, LC, and Chan, CC. Political and social determinants of life expectancy in less developed countries: a longitudinal study. BMC Public Health. (2012) 12:85. doi: 10.1186/1471-2458-12-85
39. Ali, A., and Ahmad, K. (2014). The impact of socio-economic factors on life expectancy for Sultanate of Oman: An empirical analysis. MPRA Paper No. 70871. Available at: https://mpra.ub.uni-muenchen.de/70871 (Accessed May 20, 2024).
40. Monsef, A, and Mehrjardi, AS. Determinants of life expectancy: a panel data approach. Asian Econ Financial Rev. (2015) 5:1251–7. doi: 10.18488/journal.aefr/2015.5.11/102.11.1251.1257
42. Aydin,. The impact of economic indicators on life expectancy: a panel data analysis. İstanbul İktisat Dergisi – Istanbul J Econ. (2020) 70:163–81. doi: 10.26650/ISTJECON2019-0028
43. Păunică, M, Manole, A, Motofei, C, and Tănase, GL. Life expectancy from the perspective of global and individual wealth and expenditures: a granger causality study of some EU countries. Romanian J Econ Forecasting. (2020) 23:170–84.
44. Wirayuda, AAB, and Chan, MF. A systematic review of sociodemographic, macroeconomic, and health resources factors on life expectancy. Asia Pac J Public Health. (2021) 33:335–56. doi: 10.1177/1010539520983671
45. Aanegola, R, Sakai, SN, and Kumar, N. Longitudinal analysis of the determinants of life expectancy and healthy life. Healthcare Analytics. (2022) 2:100028. doi: 10.1016/j.health.2022.100028
46. Karma, E. Socioeconomic determinants of life expectancy: southeastern European countries. European J Sustain Develop. (2023) 12:25–34. doi: 10.14207/ejsd.2023.v12n1p25
47. Anwar, A, Hyder, S, Mohamed Nor, N, and Younis, M. Government health expenditures and health outcome Nexus: a study on OECD countries. Front Public Health. (2023) 11:1123759. doi: 10.3389/fpubh.2023.1123759
48. Westerlund, J, and Edgerton, DL. A panel bootstrap Cointegration test. Ecol Lett. (2007) 97:185–90. doi: 10.1016/j.econlet.2007.03.003
49. Bayar, Y, Ozen, A, Sasmaz, MU, and Danilina, M. ICT penetration and life expectancy in emerging market economies: panel evidence from asymmetric causality analysis. BMC Public Health. (2024) 24:897. doi: 10.1186/s12889-024-18323-1
50. Nica, E, Poliakova, A, Popescu, GH, Valaskova, K, Burcea, SG, and Constantin, AD. The impact of financial development, health expenditure, CO2 emissions, institutional quality, and energy mix on life expectancy in Eastern Europe: CS-ARDL and quantile regression approaches. Heliyon. (2023) 9:e21084. doi: 10.1016/j.heliyon.2023.e21084
51. World Bank (2024). Government Expenditure on Education, Total (% of GDP). Available at: https://data.worldbank.org/indicator/SE.XPD.TOTL.GD.ZS (accessed on 20 May 2024).
52. World Health Organization (2024). Healthy life expectancy (HALE) at birth (years). Available at: https://www.who.int/data/gho/data/indicators/indicator-details/GHO/gho-ghe-hale-healthy-life-expectancy-at-birth (Accessed on 2.11.2024)
53. World Health Organization (2024). Life expectancy at birth (years). Available at: https://www.who.int/data/gho/data/indicators/indicator-details/GHO/life-expectancy-at-birth-(years) (Accessed on 02.11.2024)
54. Pesaran, MH. A simple panel unit root test in the presence of cross-section dependence. J Appl Econ. (2007) 22:265–312. doi: 10.1002/jae.951
55. Eberhart, M., and Bond, S.R. (2009). “Cross-sectional dependence in non-stationary panel models: a novel estimator.” In Proceedings of the 5th Nordic Econometric Meetings. Lund 2009.
56. Ahmad, N, Raid, M, Alzyadat, J, and Alhawal, H. Impact of urbanization and income inequality on life expectancy of male and female in south Asian countries: a moderating role of health expenditures. Human Social Sci Commun. (2023) 10:552. doi: 10.1057/s41599-023-02005-1
57. Sango-Coker, EY, and Bein, MA. The impact of healthcare spending on life expectancy. African J Reproductive Health / La Revue Africaine de la Santé Reproduct. (2018) 22:64–71. doi: 10.29063/ajrh2018/v22i4.7
58. Gedikli, A, Erdoğan, S, Kırca, M, and Demir, İ. An analysis of relationship between health expenditures and life expectancy: the Case of Turkey and Turkic republics. bilig –J Social Sci Turkic World. (2019) 91:27–52. doi: 10.12995/bilig.9102
59. Khan, K, Zeeshan, M, Moiz, A, Bano, R, Khan, MH, Ahmad, S, et al. Influence of government effectiveness, health expenditure, and sustainable development goals on life expectancy: evidence from time series data. Sustain For. (2024) 16:6128. doi: 10.3390/su16146128
60. Welsh, CE, Matthews, FE, and Jagger, C. Trends in life expectancy and healthy life years at birth and age 65 in the UK, 2008-2016, and other countries of the EU28: an observational Crosssectional study. Lancet Regional Health - Europe. (2021) 2:100023. doi: 10.1016/j.lanepe.2020.100023
61. Wang, W, Khelfaoui, I, Ahmed, D, Xie, Y, Hafeez, M, and Meskher, H. Nexus between information and communication technologies and life expectancies of low-income countries: does technological advancement increase their life span? SSM Popul Health. (2024) 25:101600. doi: 10.1016/j.ssmph.2023.101600
62. Banerjee, R, Maruta, AA, and Donato, R. Does higher financial inclusion Lead to better health outcomes? Evidence from developing and transitional economies. Econ Transition and Institutional Change. (2023) 31:363–401. doi: 10.1111/ecot.12341
63. World Bank (2024). Current health expenditure (% of GDP). Available at: https://data.worldbank.org/indicator/SH.XPD.CHEX.GD.ZS (Accessed on 02.11.2024)
64. World Bank (2024). GDP per capita (constant 2015 US$). Available at: https://data.worldbank.org/indicator/NY.GDP.PCAP.KD (Accessed on 02.11.2024)
Keywords: public social expenditures, public education expenditures, health expenditures, indicators of life expectancy, OECD states, panel cointegration analysis
Citation: Aytemiz L, Sart G, Bayar Y, Danilina M and Sezgin FH (2024) The long-term effect of social, educational, and health expenditures on indicators of life expectancy: an empirical analysis for the OECD countries. Front. Public Health. 12:1497794. doi: 10.3389/fpubh.2024.1497794
Edited by:
Sam Agatre Okuonzi, Ministry of Health, UgandaReviewed by:
Daniela Weber, International Institute for Applied Systems Analysis (IIASA), AustriaAdrian Teodor Moga Rogoz, University of Medicine and Pharmacy Iuliu Hatieganu, Romania
Copyright © 2024 Aytemiz, Sart, Bayar, Danilina and Sezgin. This is an open-access article distributed under the terms of the Creative Commons Attribution License (CC BY). The use, distribution or reproduction in other forums is permitted, provided the original author(s) and the copyright owner(s) are credited and that the original publication in this journal is cited, in accordance with accepted academic practice. No use, distribution or reproduction is permitted which does not comply with these terms.
*Correspondence: Levent Aytemiz, bGF5dGVtaXpAYmFuZGlybWEuZWR1LnRy