 Amirkeyvan Ghazvinian
 Bo Feng
 Junwen Feng1
- 1School of Economics and Management, Nanjing University of Science and Technology, Nanjing, China
- 2School of Intellectual Property, Nanjing University of Science and Technology, Nanjing, China
Introduction: Millions of people living with HIV around the world depend on having access to antiretroviral (ARV) drugs, yet the supply chain continues to confront obstacles like rising freight costs and delivery delays. These inefficiencies put timely access to life-saving medications at risk, especially in resource-limited settings. To find ways to improve the HIV drug supply chain, this study looks into the underlying causes of these disruptions.
Objectives: This study aims to: (1) assess and prioritize risks in the HIV drug supply chain, focusing on failure modes impacting delivery timelines and freight costs; and (2) enhance supply chain substantivity (fulfillment capacity) and resilience (disruption adaptability) through evidence-based strategies.
Methods: Using Z-numbers to handle uncertainty, we developed a hybrid multi-criteria decision-making framework that integrates Z-SWARA, Z-WASPAS, and Z-DEA-FMEA. Along with using FMEA to assess risks and identify failure modes, the method ranks them based on freight costs and delivery timeliness, using hybrid rankings, RPN, Z-SWARA/Z-WASPAS, and Z-DEA-FMEA efficiencies.
Results: Hybrid rankings indicate that the primary contributors to supply chain inefficiencies are Quantity Errors (F14, ranked 1st, 𝑄𝑡𝑜𝑡𝑎𝑙=0.9374), Pack Price Discrepancies (F16, ranked 2nd, 0.8430), and Unit Miscalculation (F13, ranked 3rd, 0.7261). The Z-WASPAS analysis emphasizes the financial implications of F16, placing it at the top for Freight Costs (K = 0.178). Additionally, Z-DEA-FMEA notes efficiency shifts including Delivery Confirmation (F06, 𝜃=0.7303, Delivery). In the case of Weight Failures (F20), the Freight score (𝑄𝑖=0.6991, ranked 3rd) surpasses that of Delivery (0.6753, ranked 4th), while Shipment Mode Selection (F04) holds the 5th position overall (𝑄𝑡𝑜𝑡𝑎𝑙=0.6741).
Discussion: Aiming to improve the availability of antiretroviral (ARV) medications, our approach integrates risk, uncertainty, and efficiency analysis to formulate evidence-based strategies by utilizing Z-numbers. It redefines concepts of resilience and substantivity, providing decision-makers with a framework to enhance delivery speed and minimize costs. These improvements strengthen global health logistics.
1 Introduction
The intricate web of entities and processes comprising the supply chain for antiretroviral (ARV) treatments and HIV laboratory resources strives to ensure the timely and cost-effective provision of indispensable medicines to beneficiary nations (1–4). The World Health Organization (WHO) data underscores the gravity of the situation, revealing that 3.8 million out of the approximately 38.4 million HIV-afflicted individuals worldwide are located in Southeast Asia. This region has the unfortunate distinction of having the second-most pronounced HIV incidence, following only sub-Saharan Africa (5). Nepal, a South Asian country, has witnessed an alarming surge in HIV infection rates since the identification of its inaugural case in 1988 (6, 7). Present statistics suggest that 29,503 individuals are living with HIV in the country, translating to an HIV prevalence rate of 0.13% among adults aged 15–49. Despite rigorous endeavors to combat HIV/AIDS, the ARV supply chain faces substantial challenges, particularly in the timely and consistent delivery of drugs and laboratory resources to underserved regions (8–10). Logistical problems such as inadequate deliveries, limited infrastructure, and difficulties in reaching isolated locales remain significant hurdles (11–13). For instance, in some countries, stock shortages have led to treatment deferments, threatening health outcomes and increasing the risk of drug resistance. However, many countries are making efforts to overcome these hurdles. For example, since 2013, Tanzania has tried improving its health supply chain with an electronic logistics system. Yet, data use remained low. To fix this, the government is encouraging better use of data for smarter decisions and ongoing improvements (14).
A pivotal issue is striking a harmony between substantivity, the supply chain’s capacity to fulfill the recipient countries’ needs and resilience, indicating its robustness against disruptions and its adaptability to evolving scenarios (15).
The task of achieving this equilibrium demands meticulous considerations, including parameters like the target nation, the overseeing entity, the method of fulfillment, and the vendor’s INCO terms (16–19). Not only does HIV AIDS affect individual health, but it has deeper challenges such as economic insecurity, and also puts strains on healthcare systems especially on the supply chain management of antiretroviral drugs. Therefore, there has been great emphasis on international focusing on supply chain adaptation and treatment retention through planning and integration with the health systems (20, 21). The challenges plaguing the ARV and HIV lab supply chain, such as stock shortages, treatment deferments, and the looming threat of drug resistance, remain pressing concerns that require urgent attention (22). These challenges exacerbate the health risks for those living with HIV and catalyze the further transmission of the virus. Optimization of this supply chain is non-negotiable in the quest to terminate the HIV epidemic (13, 23). Central to this mission are data-centric methodologies that refine the supply chain’s efficacy. The focus of this study is the exploration of the equilibrium between substantivity and resilience in the ARV and HIV lab supply chain directed toward the assisted nations (24, 25). This comprehensive approach facilitates an exhaustive examination of diverse supply chain-associated variables. Gleaned insights from these analytical procedures are poised to arm stakeholders and policy architects with invaluable data, fostering more informed decision-making. It is anticipated that this will enhance the supply chain performance, strengthening the global resistance to HIV/AIDS. By pinpointing and emphasizing critical factors like the destination country, managing entity, fulfillment modality, and vendor INCO specifications, the study seeks to pave the way for supply chain enhancements that promise improved health outcomes for those with HIV. Further, optimizing this supply chain can precipitate cost reductions in treatment and broaden the accessibility of antiretroviral medications and diagnostic tools (26). In essence, the insights and recommendations proffered in this research endeavor aim to be a cornerstone in the collective global ambition of eradicating the HIV epidemic, by augmenting the competency and impact of the HIV drug supply chain to nations in need.
Effective distribution and utilization of ARVs depend on hospital efficiency, as a key endpoint in the supply chain. Data Envelopment Analysis (DEA) has been used extensively to measure hospital performance and provide insights that can be applied to supply chain optimization. For instance, Lindlbauer et al. (27) evaluated German hospitals after quality certification, Li and Dong (28) used bootstrap-DEA for Chinese public hospitals, and O’Neill et al. (29) provided a cross-national DEA taxonomy for hospital efficiency. Recent studies, such as Chowdhury et al. (30) on Indian private hospitals and Li et al. (31) on physician-hospital integration, have highlighted the role of DEA in identifying inefficiencies under resource constraints, directly informing ARV supply strategies in resource-limited settings. Additionally, Nunes and Ferreira (32) used network DEA to assess the efficacy and efficiency of Portuguese public hospitals before and after COVID-19, observing initial declines but recoveries with improved patient safety—demonstrating the usefulness of DEA for resilience in interrupted systems. Similar to our focus on freight optimization in ARV supply chains, Ferreira et al. (33) created a log-linear DEA model for pay-for-performance in hospitals, delivering cost reductions by matching compensation with quality and access. Our Z-DEA-FMEA integration is informed by these studies, which highlight DEA’s flexibility in the face of uncertainty.
Our research integrates Z-SWARA, Z-WASPAS, and Z-DEA-FMEA multi-criteria decision-making (MCDM) techniques with the Failure Modes and Effects Analysis (FMEA) method, forming a hybrid framework to identify effective strategies for optimizing the HIV drug supply chain, with a focus on delivery scheduling. This data-centric approach enhances supply chain performance by addressing inefficiencies through a structured methodology, chosen for the following reasons:
Z-SWARA, Z-WASPAS, and Z-DEA-FMEA: These approaches help ranking and prioritization of supply chain factors. They integrate risk and efficiency, using Z-numbers to address uncertainty in Severity, Occurrence, and Detection assessments and also, they facilitate structured decision-making based on identified factors for both delivery and freight efficiency.
FMEA Method: Failure Modes and Effects Analysis (FMEA) systematically identifies risks (e.g., quantity errors, weight failures) impacting freight costs and delivery timelines. This supports proactive mitigation of supply chain vulnerabilities, such as stock shortages.
Z-DEA-FMEA and Hybrids: Z-DEA-FMEA evaluates supply chain operations’ efficiency and offers information about performance gaps to guide optimization.
The steps of the proposed method are as follows:
1 Collect data on ARV and HIV lab shipments and assess risks using FMEA (Severity, Occurrence, Detection).
2 Define failure modes and assess risks using expert opinions and FMEA outcomes.
3 Develop a multi-criteria decision-making model integrating Z-SWARA, Z-WASPAS, and Z-DEA-FMEA, using Z-numbers for optimizing delivery timelines and freight costs, enhancing substantivity and resilience.
4 Rank supply chain factors using RPN and Z-SWARA/Z-WASPAS to prioritize risks.
5 Assess failure mode substantivity and resilience using Z-DEA-FMEA efficiencies to guide prioritization.
6 Compute hybrid rankings and combined rankings (see Results section).
The structure of this paper is organized as follows: We begin with an introduction, followed by a related work review, methodology (data collection, proposed approach), results, discussion, conclusion, and future research directions.
2 Related works
Medical male circumcision and pre-exposure prophylaxis (PrEP) have been shown to reduce the burden of HIV among men (34–36). Naidoo et al. (21) and Cremin et al. (37) investigated ART and PrEP coverage rates in KwaZulu-Natal, South Africa. Identifying HIV-positive individuals one-year post-infection and elevating ART coverage to 80% could potentially avert 35% of cumulative HIV infections across a decade. However, the impact may be attenuated due to the surge in newly infected individuals. Targeted PrEP, when given to couples at the onset of infection, yields an incremental cost-effectiveness ratio of $40,000 per averted infection. In a related study, Alsallaq et al. (38) in KwaZulu-Natal, South Africa, modeled similar interventions to discern if they exhibited synergistic outcomes. Their findings suggest that the most pronounced synergistic effects arise when interventions are compromised by factors like behavioral disinhibition, suboptimal adherence, and ART discontinuation. In the broader spectrum of HIV prevention, strategies encompassing both medical male circumcision and PrEP could be pivotal if they further curtail transmission rates. However, to offer ART to the global count of 34 million HIV-positive individuals, a staggering $19.1 billion in international funds remains a requisite (39). While it is crucial to augment ART coverage, several challenges and considerations remain at the forefront. Aspects tied to each stage of the models mentioned above, such as testing frequency, care uptake ratios, adherence, and attrition rates, warrant meticulous scrutiny. To ensure sustained viral suppression, patients need to navigate a care cascade, delineating their treatment initiation, ART commencement, subsequent follow-ups, and the achievement of consistent viral suppression. Furthermore, dynamic models serve as invaluable tools for operational research. They can spotlight logistical challenges and factors hampering health outcomes and guide the judicious allocation of resources, grounded in defined objective functions (40).
While taking into account how the entire supply chain influences costs is important, it is crucial to note that this perspective may not fully encapsulate health outcomes. Brown et al. (41) modeled the vaccination supply chain in Benin using a discrete-event, agent-based framework. Their study examined a variety of scenarios, such as streamlining administrative tiers, transitioning to bikes for direct deliveries, and utilizing trucks for looped deliveries. Particularly noteworthy was the shift from existing “Health Zones” to third-tier “Communities” and the replacement of truck loops with motorcycle deliveries; these changes collectively reduced the logistics cost per vial from $0.26 to $0.19 in 2017, a total savings of $500,000. Such enhancements might be advantageous for HIV initiatives.
Assi et al. (42) investigated the efficacy of vaccination supply chains in Niger by simplifying the number of tiers. By excluding regional-level outlets and allowing district stores to directly fetch vaccines from central repositories, vaccine availability surged to 95%, and the cost per dose slightly dropped. Past studies, like those involving One Health (43) and Supply Chain Guru (44), have probed into how supply chains impact health. In earlier disease models, there is a direct correlation between supply networks and health outcomes. It is critical to precisely project ART availability, ART dispatch, and health outcomes within HIV care cascades at clinic tiers (45, 46). Mathematical modeling offers a lens to further dissect the HIV supply chain. For instance, similar to pharmaceuticals, laboratory tests are location-bound. Past spatial analyses, as seen with polio in Nigeria (47) and HIV in Kenya (48), can be instrumental in optimizing laboratory test deliveries. Moreover, to cater to the 34 million HIV patients, manufacturing processes demand recalibration, ensuring production amplification dovetails with reduced acquisition costs (49).
Accurate forecasting models are indispensable to temper financial unpredictability and smoothen pharmaceutical production processes. Despite its popularity, the HIV rapid test supply chain is restricted, making its management arduous, particularly under constrained resources. The diagnostic market grapples with supply inconsistency, convoluted procurement, delays, and inadequate quality assurance. Compromised supply chains could potentially deteriorate point-of-care testing outcomes (2). Biza et al. noted that flawed supply chains stymied the distribution of prenatal care kits across three health institutions in Mozambique (50). To adeptly infuse POC technologies, procurement frameworks equipped for regular cold chain management and limited shelf-life are pivotal (1–3, 51). There are a number of roadblocks to the effective implementation of Point-of-Care (POC) diagnostic systems, especially the lack of resources and inadequate handling of inventory management systems as well as problems relating to congestion of the Health Facility. Such bottlenecks can delay the distribution process, most especially in resource actualized situations where logistical obstacles and slow mechanisms of requesting for tests restrict quick diagnosis (1, 3, 52). Ensuring quality in LMICs is further complicated by gaps in knowledge and training (53, 54). Velloza et al. note that HIV prevention strategies must be community-specific. The investigations highlight that adequate service delivery requires knowledge of specific characteristics of the area variations, including local culture and health system components. This includes tackling supply chain and human resources challenges in order to coordinate with local authorities for better implementation of the strategies. In this respect, they stress that factors related to context should not be downplayed because they could alter the acceptance and the quality of the HIV prevention products, thus it is critical to integrate the views of the community in the decision-making processes (55). Additionally, Engel et al. observed a deficit in user representation during R and D, leading to POC diagnostics that might be misaligned with their intended use-cases. Addressing these challenges requires an emphasis on localized and transdisciplinary operational research for the POC diagnostics value chain system (56, 57). Yazdanparast et al. (58) introduced a hybrid method combining Z-number Data Envelopment Analysis (Z-DEA) with neural networks to assess supply chain resilience. This approach leverages expert insights to evaluate 16 resilience enablers within an Iranian automotive supply chain. Z-DEA incorporates uncertainty and reliability into the analysis, while neural networks handle complex, non-linear relationships, demonstrating that targeted improvements in resilience enablers can mitigate supply chain disruptions. Karuppiah et al. elaborations on supply chain management and sustainability offers valuable insights for optimizing systems, providing frameworks for enhancing resilience and efficiency that could inform our HIV supply chain strategies (59, 60).
Khadem et al. (61) investigated the role of Artificial Intelligence (AI) in optimizing supply chain operations, emphasizing applications like demand forecasting, inventory management, and transportation. Although the study does not directly address Z-numbers, it highlights how advanced computational tools can enhance efficiency, reduce costs, and improve decision-making, aligning with the objectives of Z-number methodologies for managing uncertainty and ensuring reliability.
Muysinaliyev and Aktamov (62) provided a broad review of supply chain management, covering key concepts, performance metrics, and challenges. While Z-numbers were not a focus, the study underscores the need for advanced tools to address evolving complexities in supply chain practices. It emphasizes the importance of integrated strategies to boost performance, aligning with the goals of Z-number-based approaches for addressing modern supply chain challenges.
Recent advancements in multi-criteria decision-making, including Z-SWARA and Z-WASPAS, enhance FMEA with fuzzy Z-numbers, while Data Envelopment Analysis (DEA) measures efficiency. However, integrating these into hybrids like Z-SWARA-DEA-FMEA and Z-WASPAS-DEA-FMEA remains underexplored. Tables 1, 2, provide a summary of related methods and contextual literature on multi-criteria decision-making in healthcare and supply chain and an overview of challenges and prospects in the HIV supply chain, respectively.
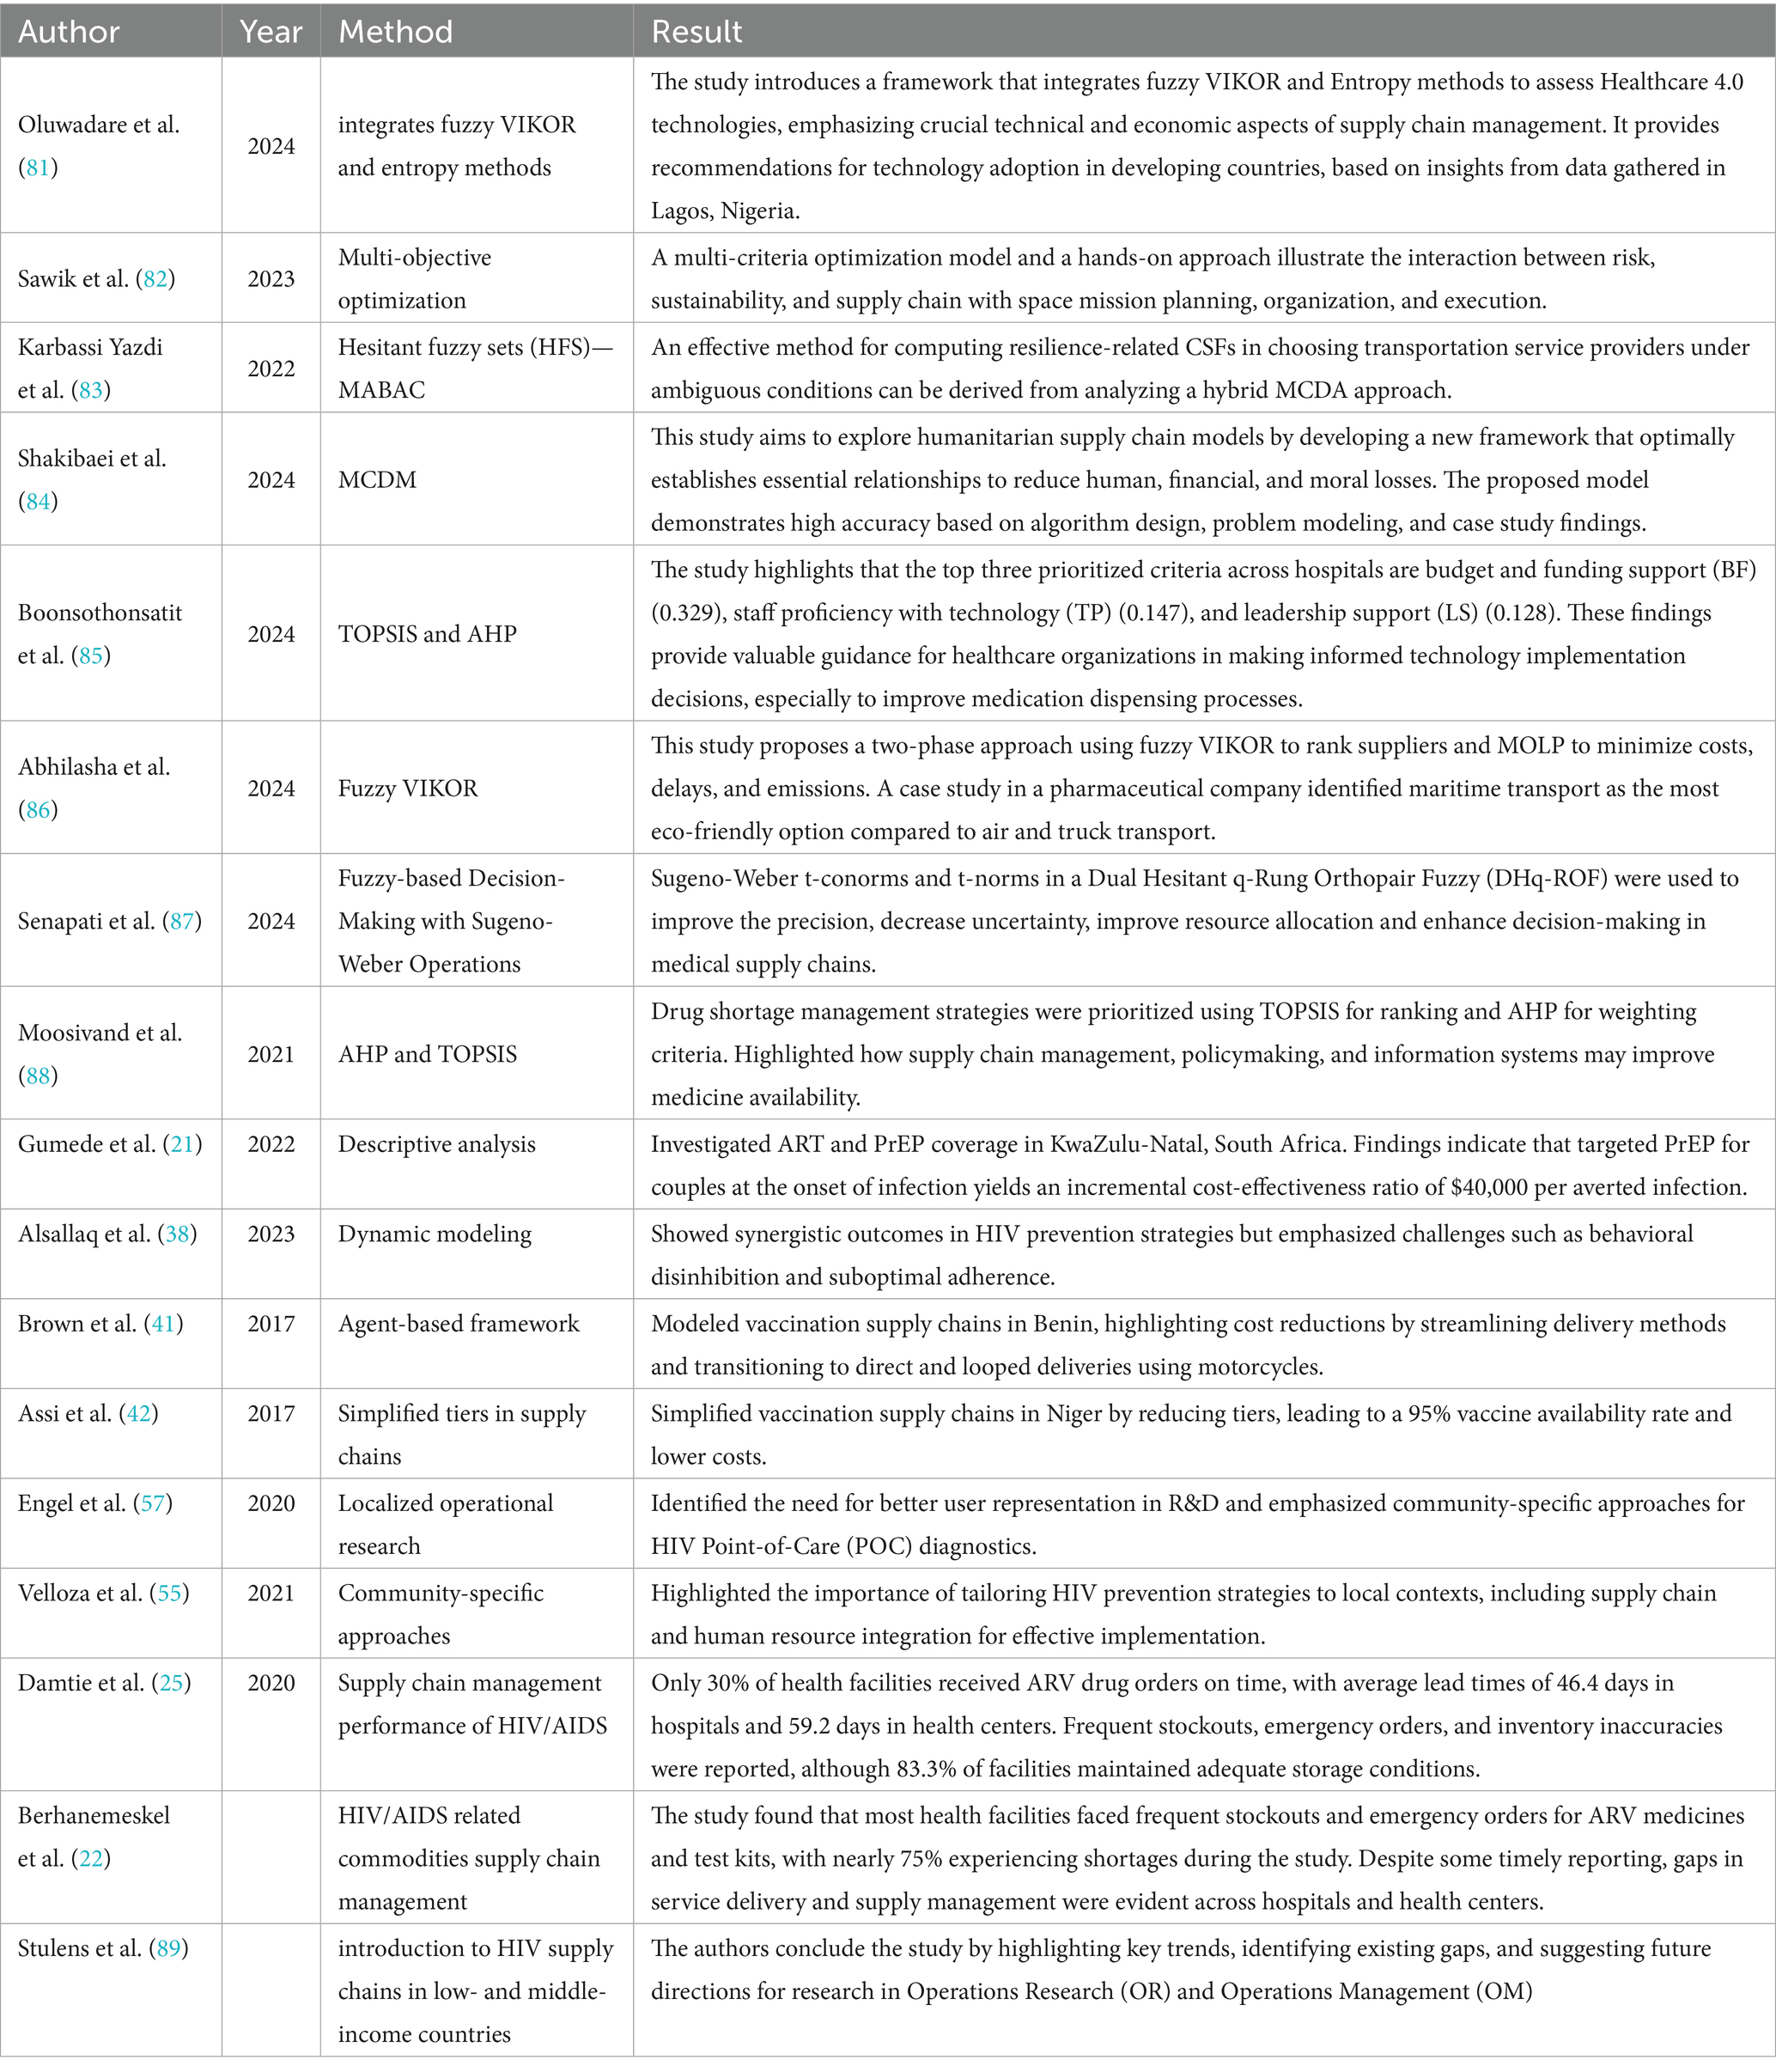
Table 1. Review of related methods and contextual literature on multi-criteria decision-making in healthcare and supply chain.
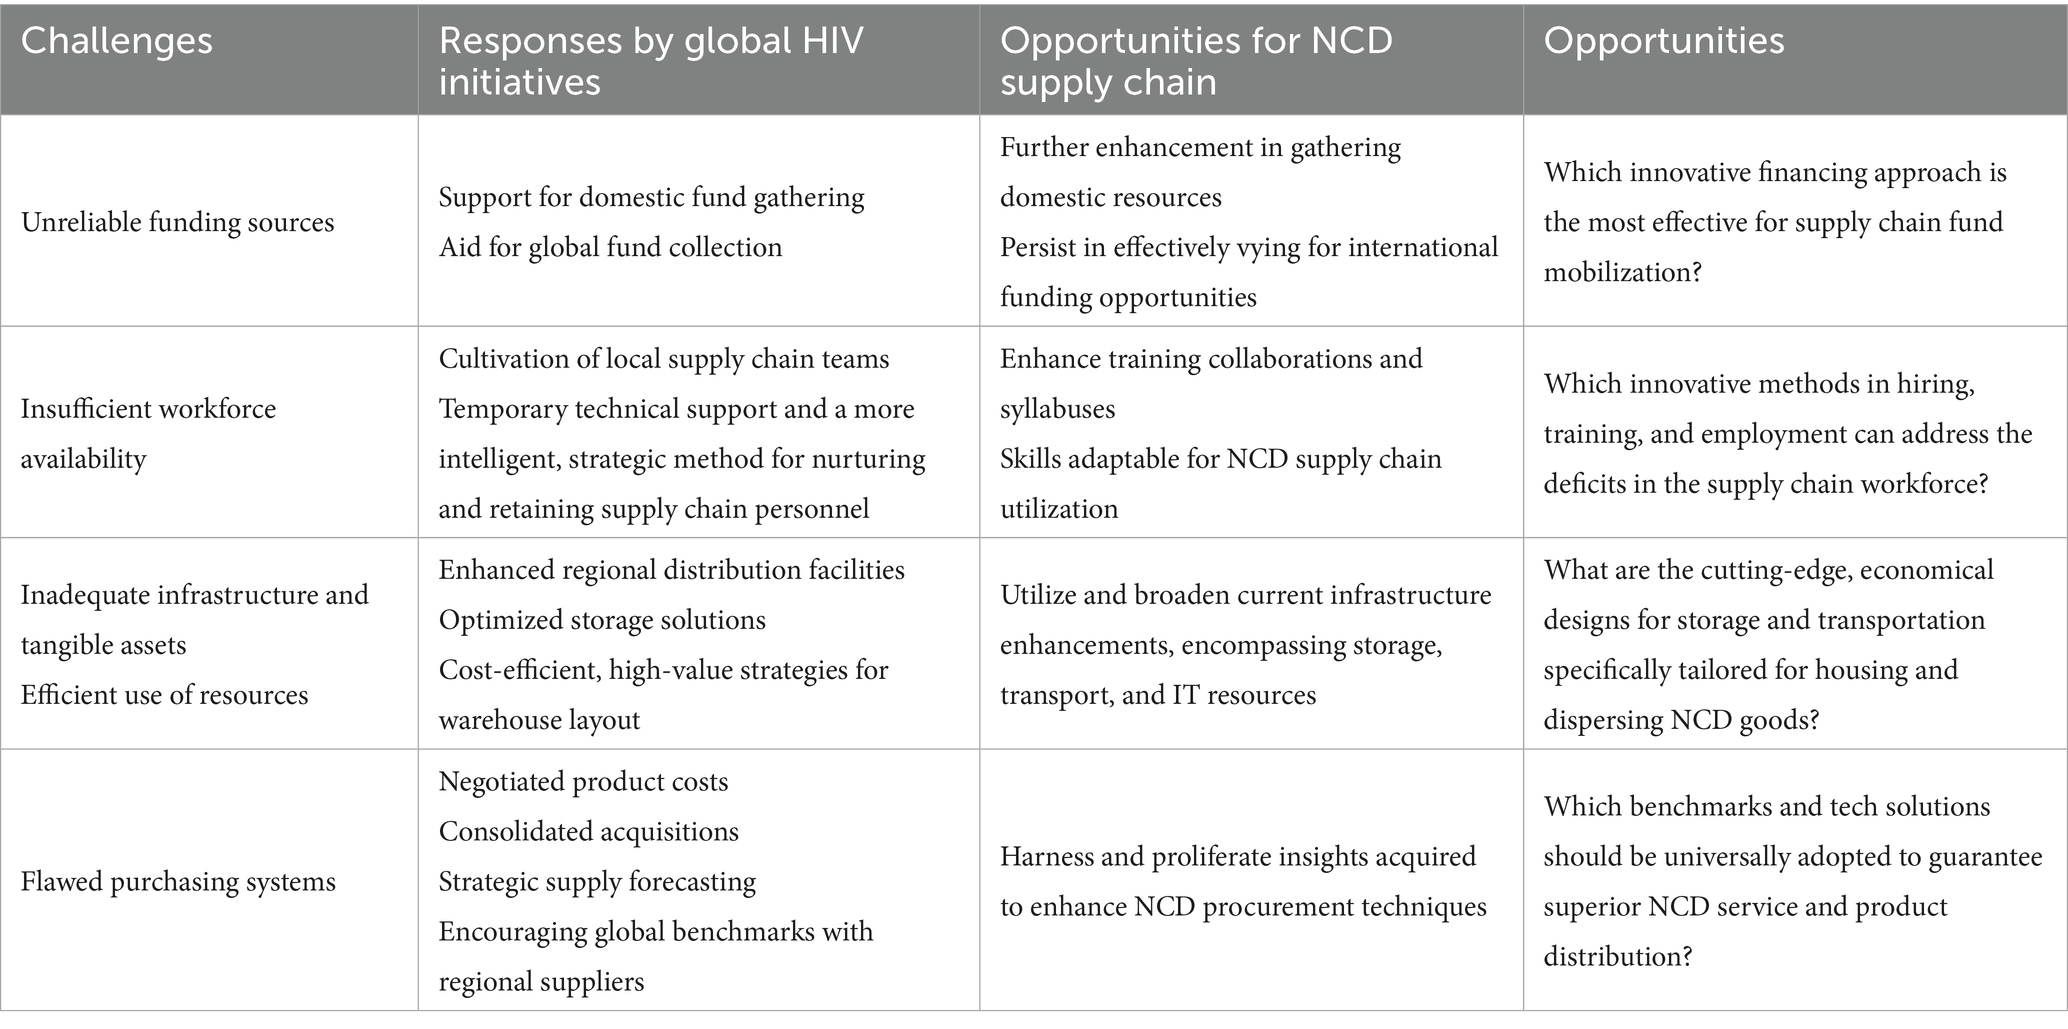
Table 2. Overview of challenges and prospects in the HIV supply chain.
3 Methodology
3.1 Dataset
The Global Fund and PEPFAR, major procurers of HIV health commodities, rely on the Price, Quality, and Reporting (PQR) dataset. Comprising 10,325 shipment records, this dataset provides comprehensive insights into global HIV expenditure, price ranges, shipment trends, and country-specific volumes. Supplemented by expert opinions, it reliably informs analyses of weight, quantity, and delivery timelines despite limitations in real-time data. Stakeholders can leverage this resource for informed decision-making, as endorsed by the USAID (63), to enhance HIV drug logistics.
3.2 Triangular fuzzy numbers in Z-number framework
Fuzzy set theory was developed by Zadeh (64). A fuzzy set theory extends classical set theory to solve practical problems in uncertain environments. A fuzzy set is a pair (U, m), where U is a set and m: U → [0, 1] is a (x) denoted membership function mapping elements to a degree of belonging between 0 and 1.
Definition 1. Let F (R) be a fuzzy number if:
(A) There is x 0 R such that (x0) = 1;
(B) For any α [0, 1], α = [x, α(x) ≥ α] is a closed interval. Here, the set of real numbers is R, and F (R) describes the fuzzy set.
Definition 2. If its membership functions (x): R → [0, 1], a Fuzzy number on R is known as a Triangular Fuzzy Number (TFN).
Is identical to Equation 1
In this formula, l, m, and u are the lower, modal, and upper support values, which are all crisp (−∞ < l ≤ m ≤ u < ∞). As a triplet of letters (l, m, u), a TFN can be represented. Two TFNs are described in (65) for a basic understanding of how they work (Figure 1; Table 3).
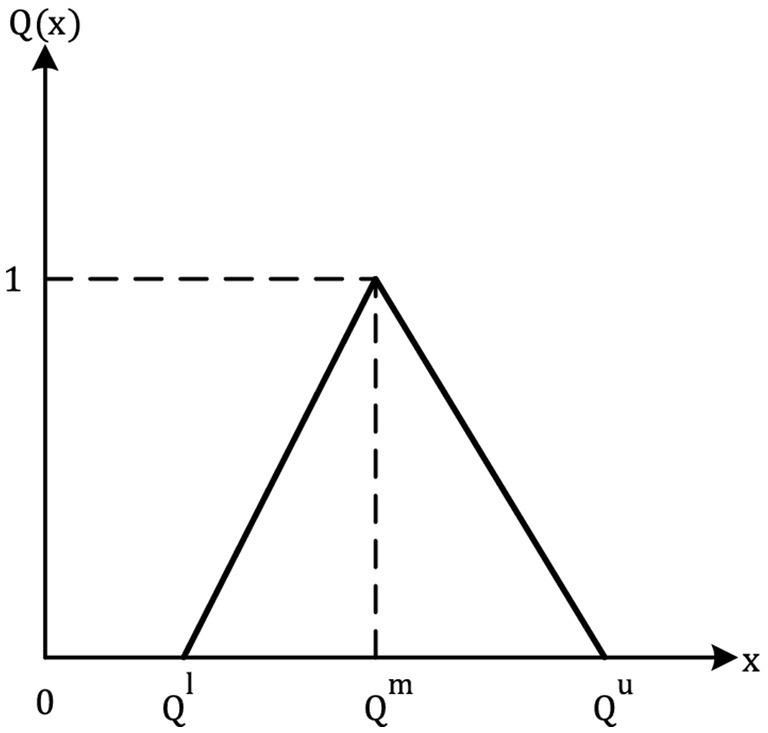
Figure 1. Fuzzy triangular number.
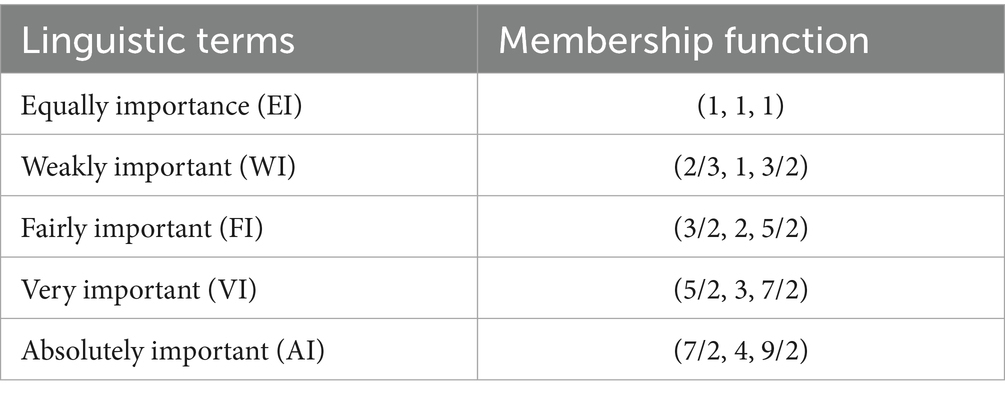
Table 3. The linguistic variables that determine decision-makers’ transformation rules.
Definition 3. To convert a TFN( ) = ( ), to a crisp value for analysis, we use the simple average defuzzification method Equation 2:
This method applied to defuzzify TFNs in Z-SWARA, Z-WASPAS, and Z-DEA-FMEA calculations.
3.3 Z-number theory
As Zadeh (66) introduced a framework for mathematically representing linguistic claims, this kind of probability-qualified statement was introduced. A Z-number is a pair of ordered numbers in which both and L is TFNs. Y domain is comprised of the fuzzier as an initial component. The variable Y represents an uncertain real-valued variable, while the variable Z represents its Z-number. An interval between [0, 1] is represented by the fuzzy subset . Restrictions are represented by and dependability by . Z-numbers can communicate unknown variables. There is a collection of Z-values that constitute Z-information. Several everyday decisions and thoughts are based on Z-information. Assume that Y, in Equation 3, is a fuzzy variable since it is a stochastic variable. A probability distribution of Y indicates the probability of Y in the Equation. The probabilistic constraint is as follows.
Using Equation 3 as a starting point, it can be seen that the function of Y’s probability density can be found in Equation 4.
Y is represented by the probability density function p, and u is represented by the differential du.
Z-numbers can be converted to TFN by assuming . Restrictions are represented by the initial component . Reliability is represented by the second component . The second component (reliability) is converted into a crisp integer using the centroid method as follows (67):
equals, as shown in Equation 6. Due to this, the second factor (reliability) has the same weight as the first (restriction). The weighted Z-number in TFN form can be obtained by applying:
For triangular fuzzy reliability components, the centroid method (5) simplifies to .
3.4 Z-SWARA method
The Stepwise Weight Assessment Ratio Analysis (SWARA) method, introduced by Kersuliene et al. (68), determines criteria weights through expert judgments in a structured manner. Fuzzy SWARA extends this by using Triangular Fuzzy Numbers (TFNs) to handle uncertainty in expert opinions. In this study, we further extend fuzzy SWARA to Z-SWARA by incorporating Z-numbers, which add reliability to the weight assessment process, enhancing the credibility of the results (69). Experts compare criteria step-by-step, assigning relative importance based on the cumulative influence of preceding criteria. The resulting weights (Table 4) are used in Z-WASPAS (Table 5) and hybrid rankings (Tables 6–8). The Z-SWARA method involves the following steps:
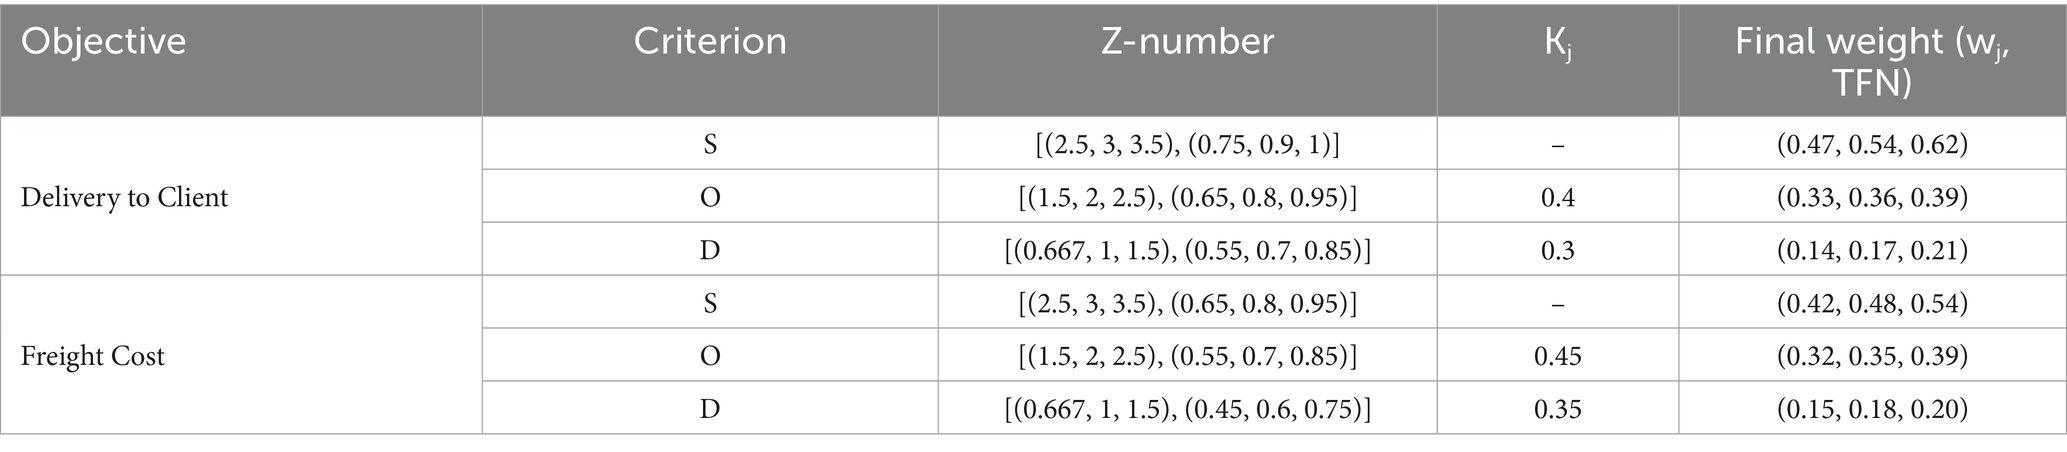
Table 4. Z-SWARA criteria weights.
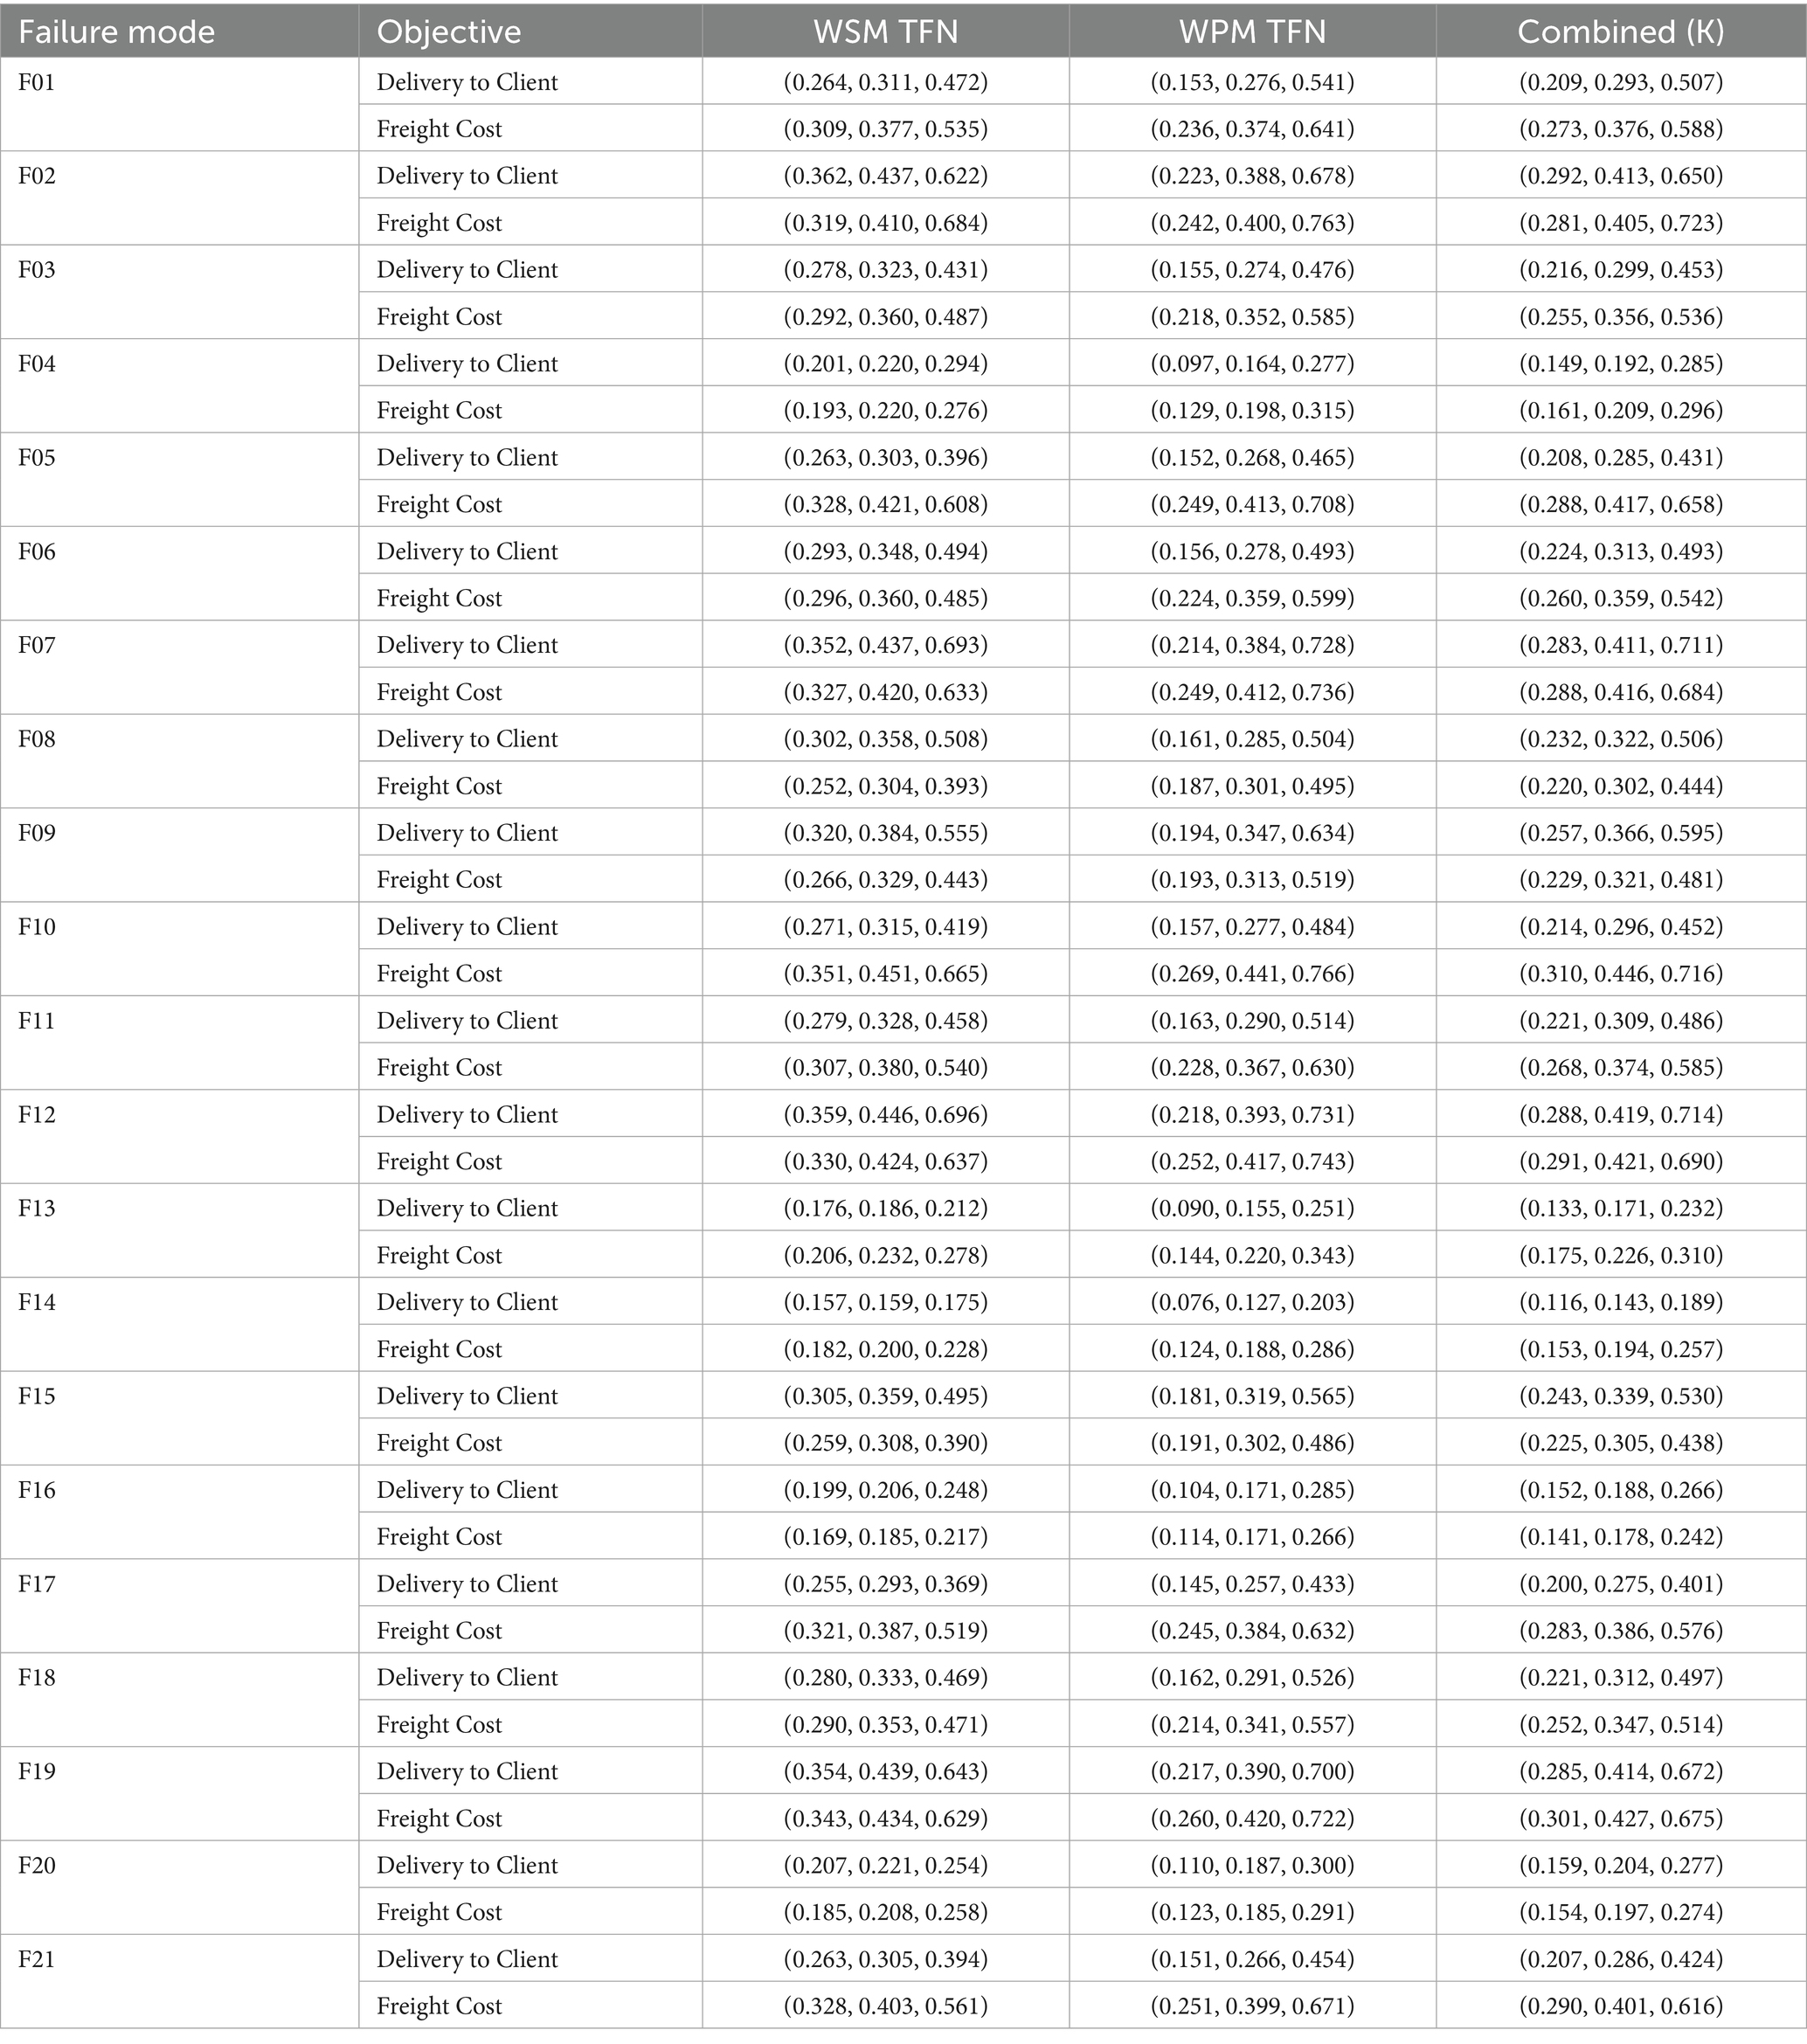
Table 5. Z-WASPAS weighted sum model (WSM) and weighted product model (WPM) values for identified failure modes.
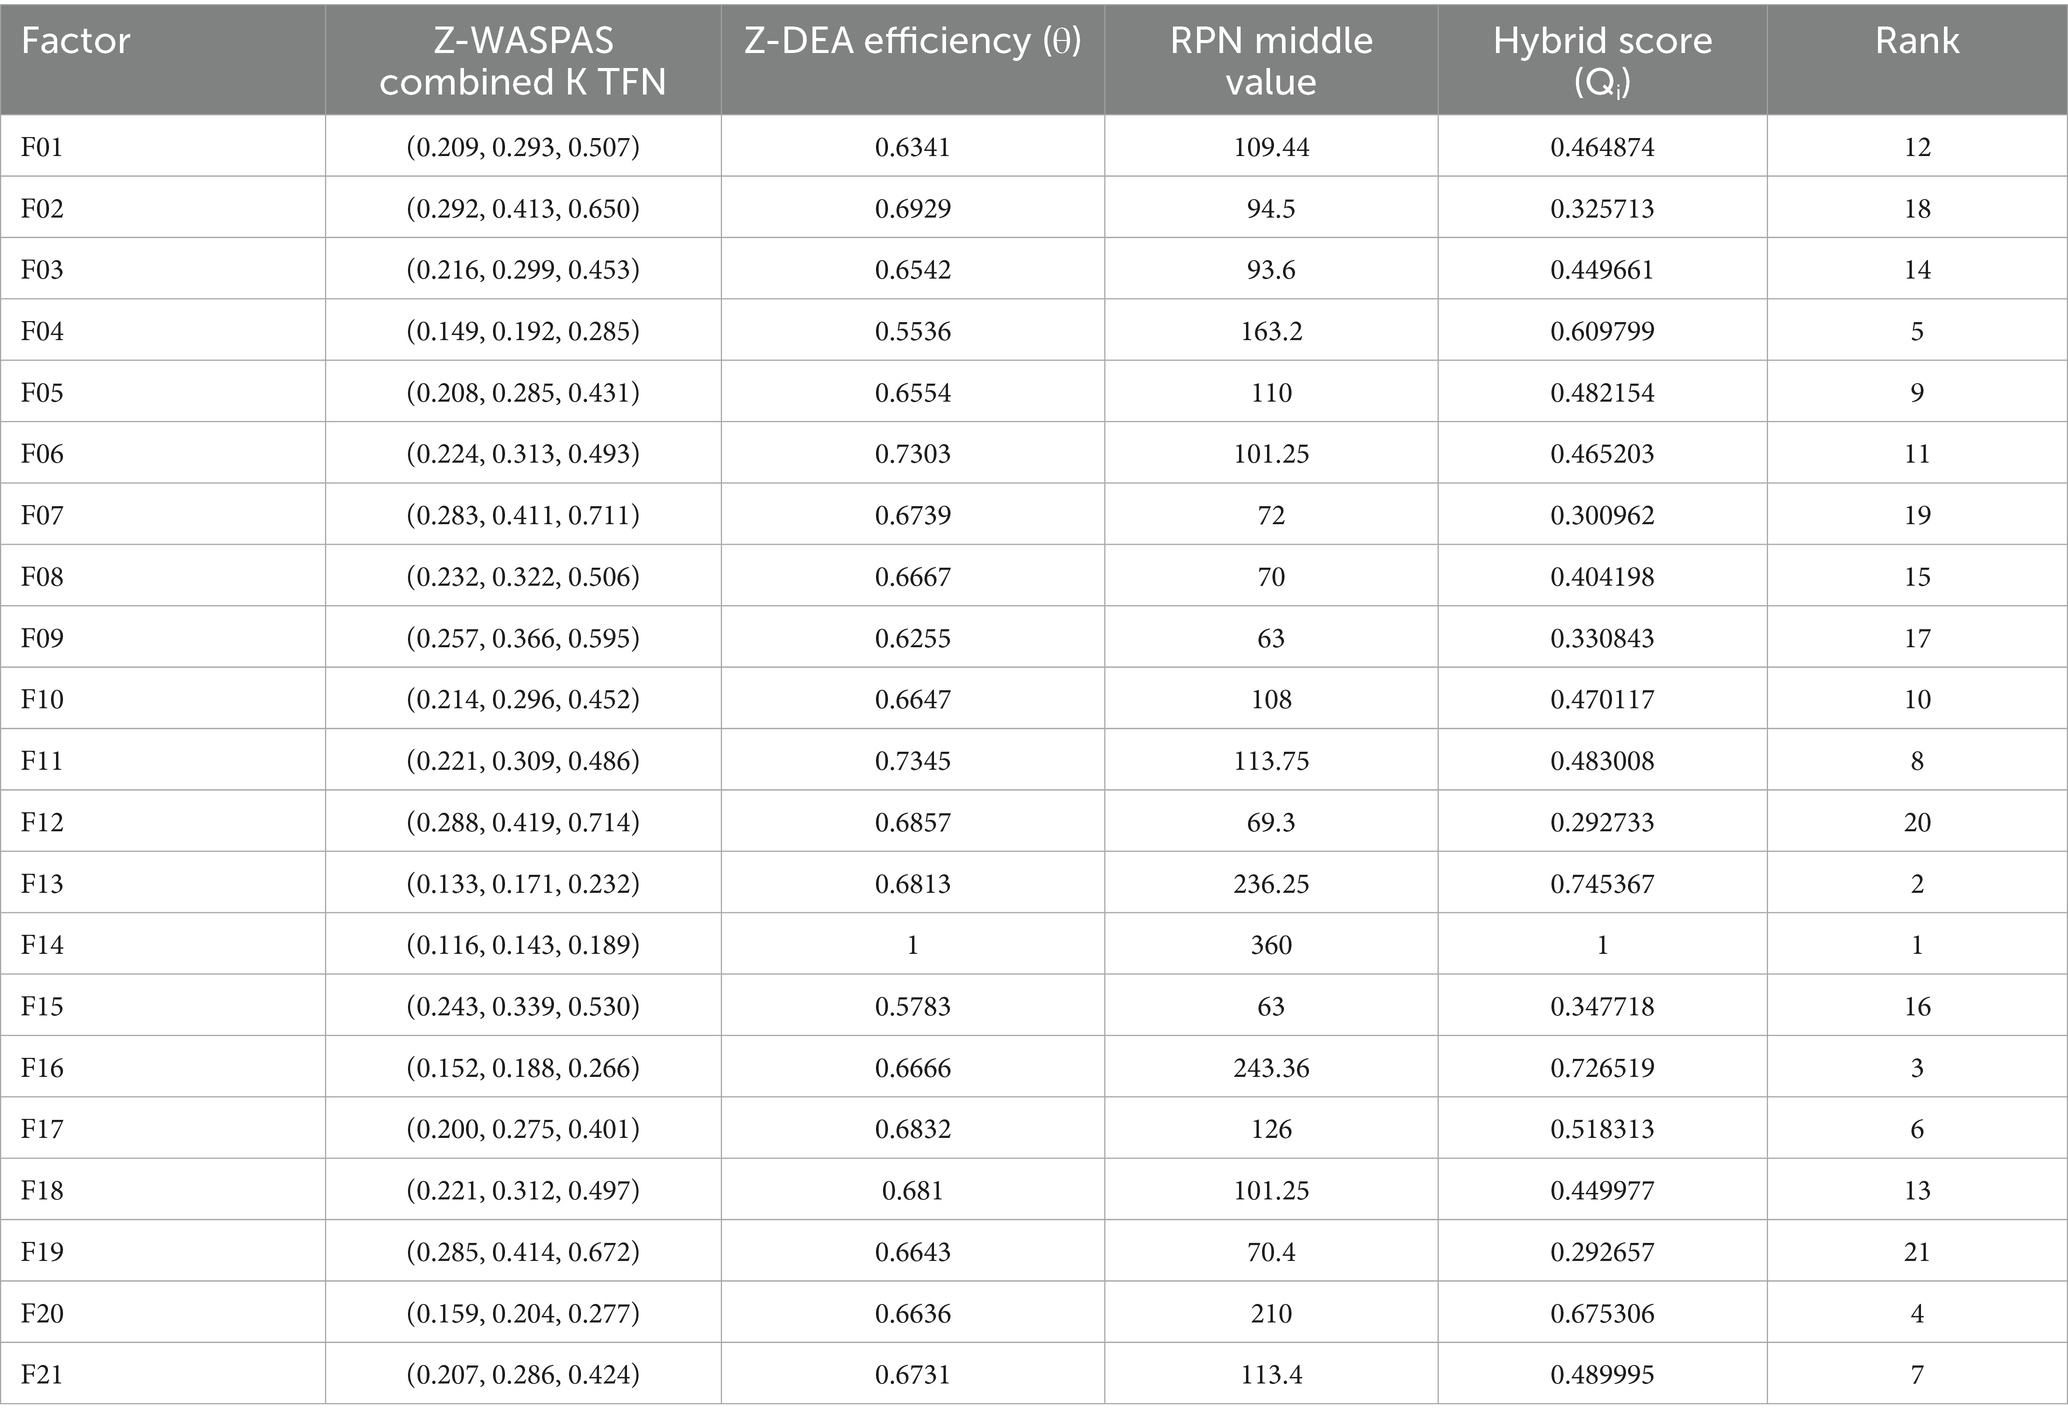
Table 6. Hybrid rankings for delivery to client date using Z-SWARA, Z-WASPAS, and Z-DEA-FMEA.
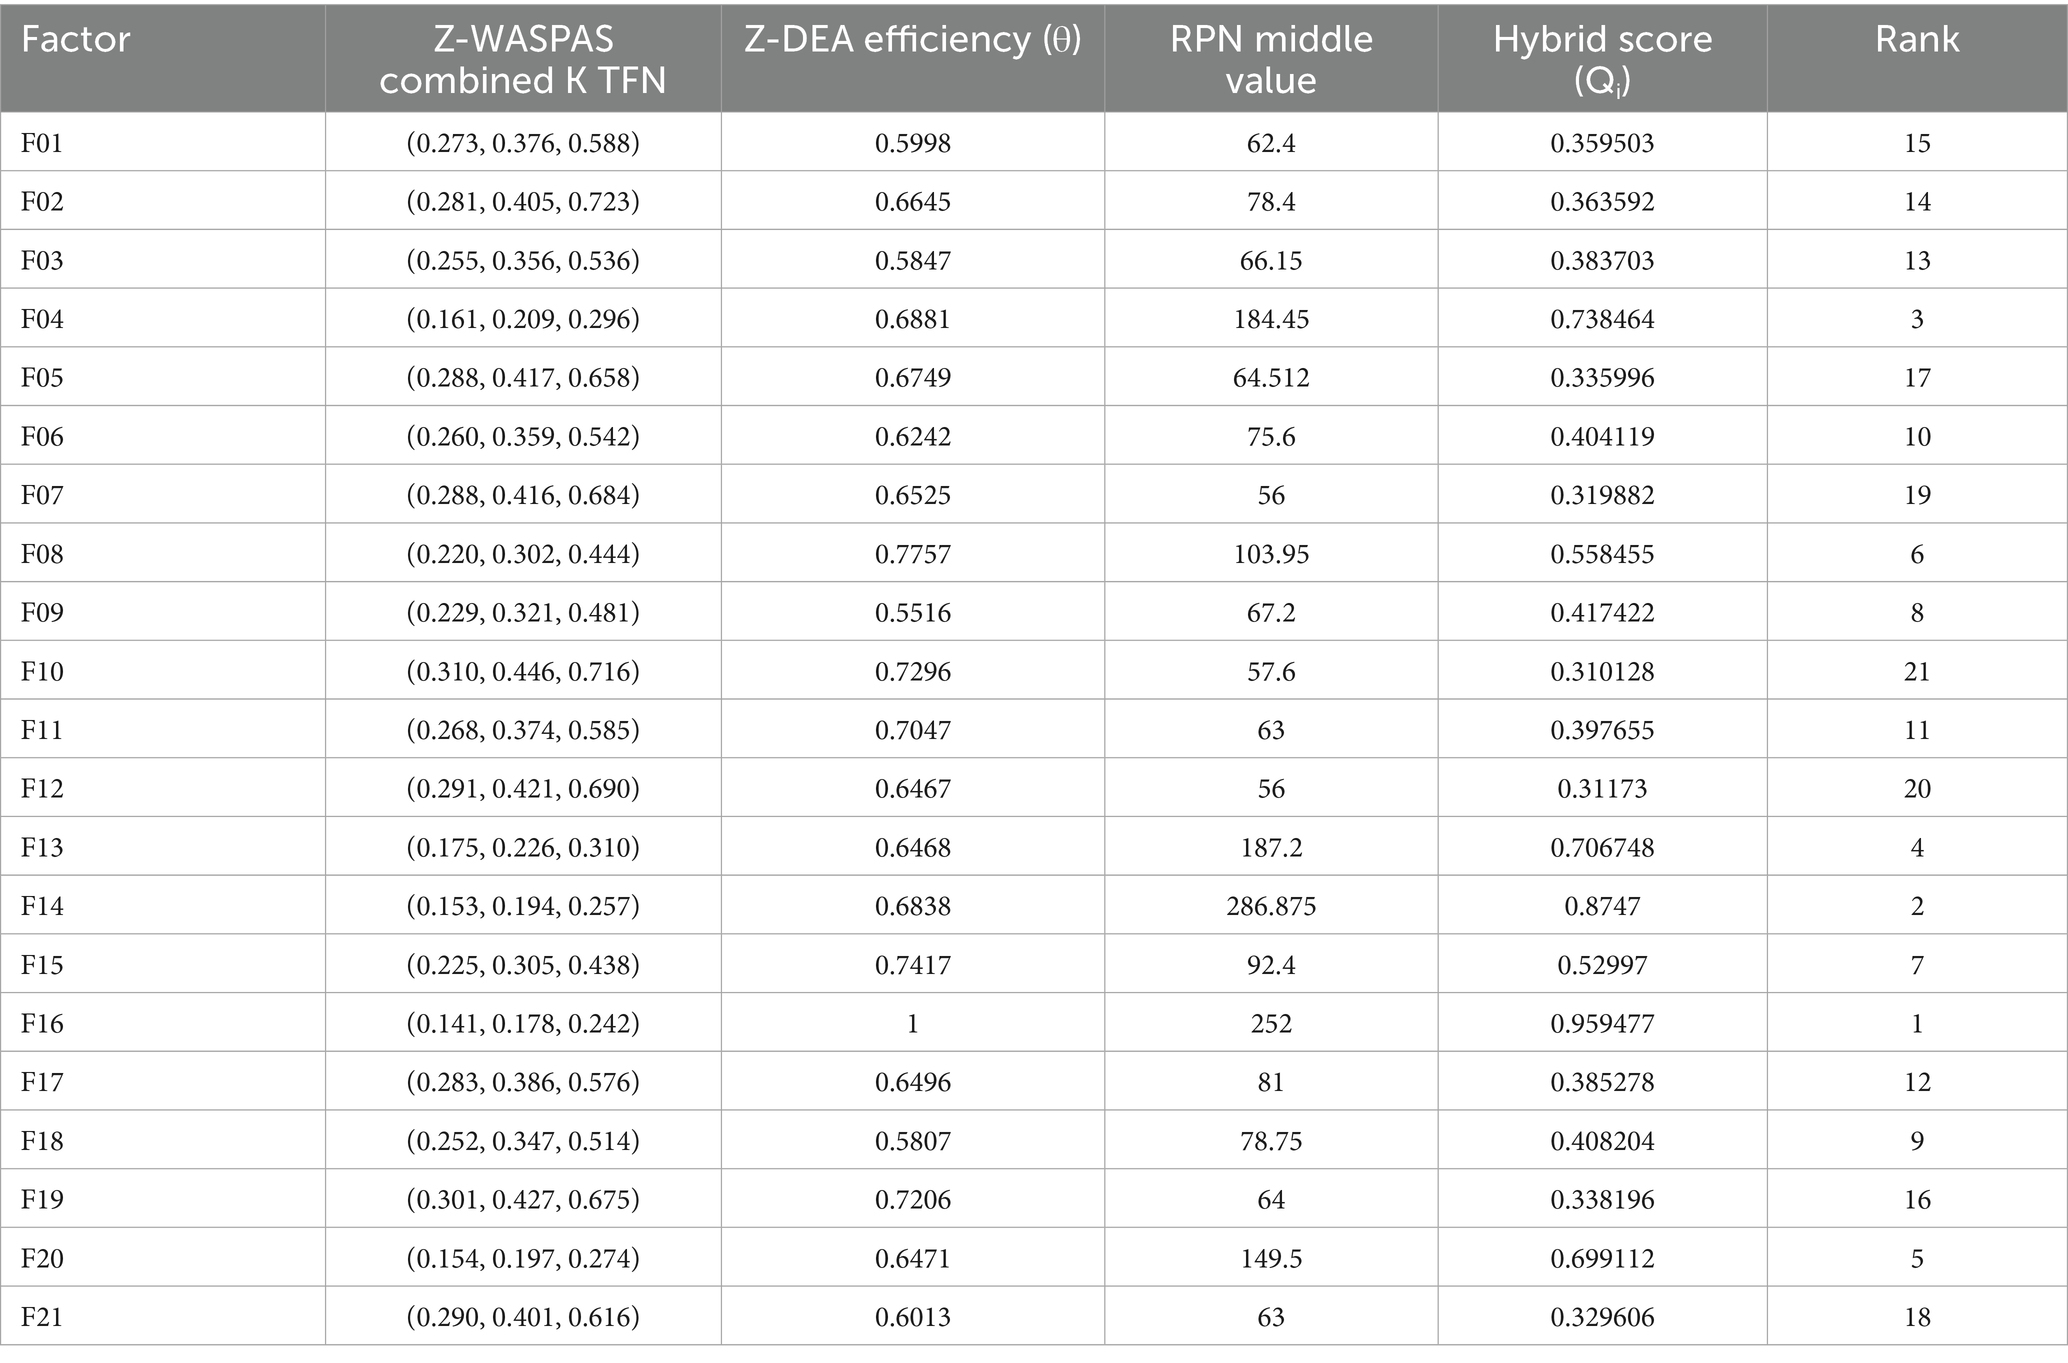
Table 7. Hybrid rankings for freight cost using Z-SWARA, Z-WASPAS, and Z-DEA-FMEA.
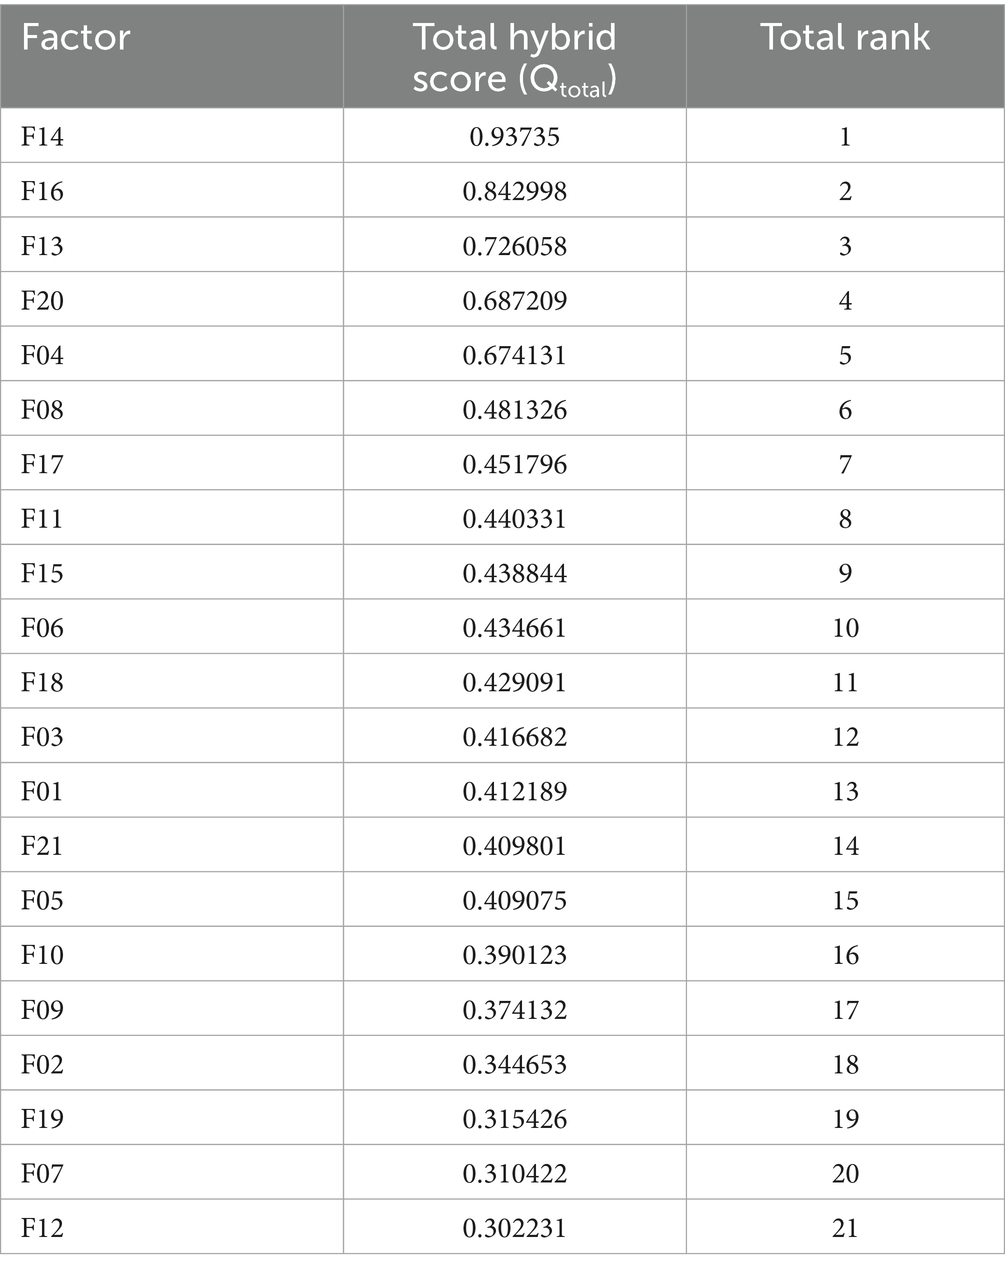
Table 8. Combined hybrid rankings for HIV drug supply chain failure modes using Z-SWARA, Z-WASPAS, and Z-DEA-FMEA.
Step 1: According to their judgment, professionals rank factors from most important to least important in descending order.
Step 2: Experts should assess each criterion’s linguistic quality according to its relevance to , based on their first judgment. According to Table 9, the quantity of the first component ( ) can be calculated. To calculate the dependability component ( ), it is necessary to refer to Table 10. Each circumstance is assigned a Z-number.
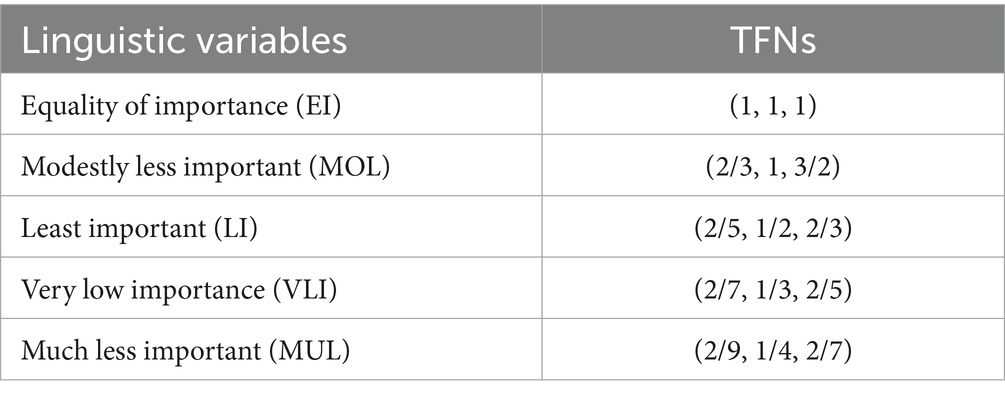
Table 9. Linguistic quality plays a significant role in weighting.
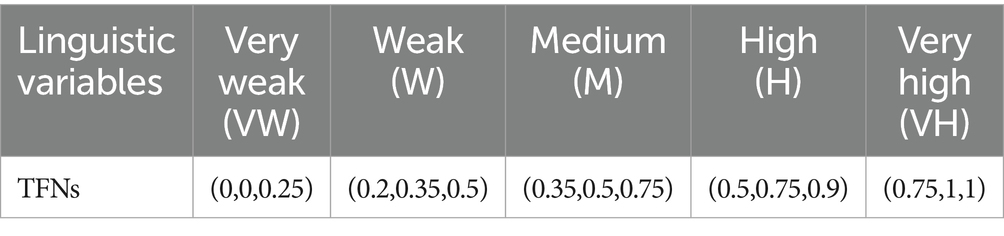
Table 10. Assessing reliability using linguistic variables.
Step 3: The Z-number from Step 2 is converted to a TFN using Equations 5, 6 (67). For example, a Z-number [(2/7, 1/3, 2/5), (0.35, 0.5, 0.75)] (VLI, M) is transformed into (0.21, 0.24, 0.29), as shown in Table 11.
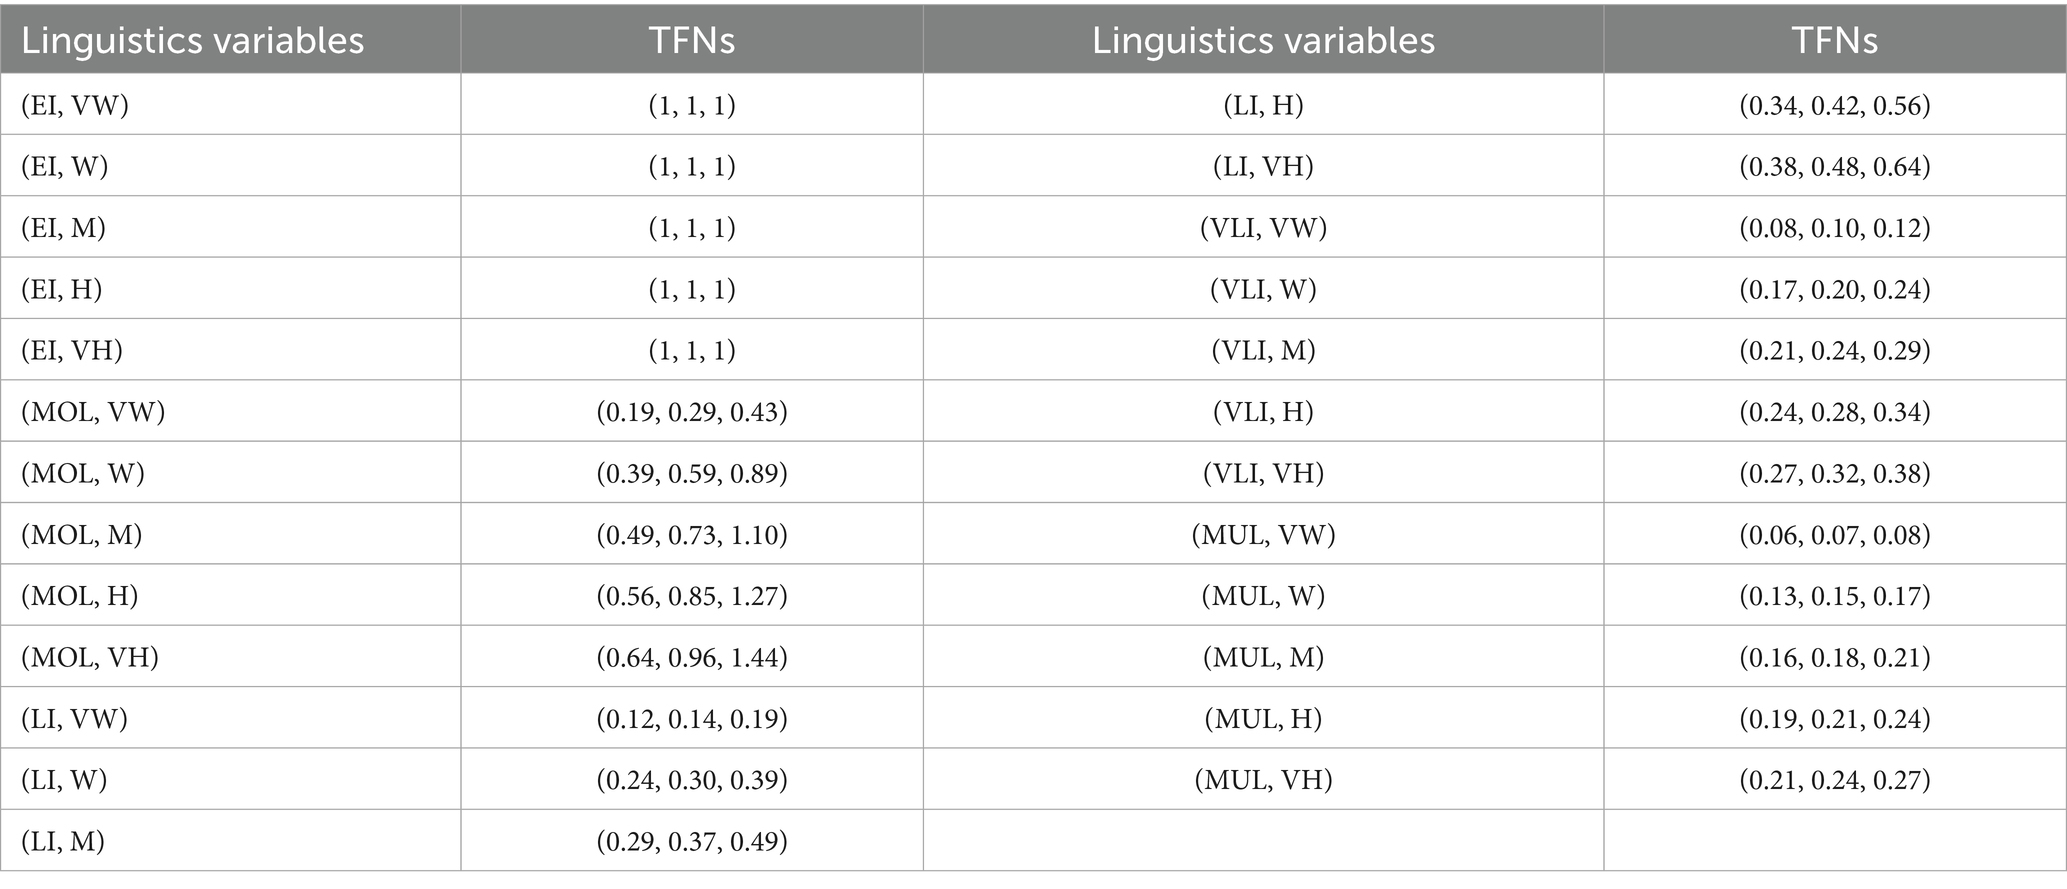
Table 11. In order to determine weighting criteria, Z-numbers are transformed to TFNs based on linguistic characteristics.
Step 4: Compute coefficients for each criterion, starting with 𝑞𝑆 = (1,1,1). For subsequent criteria, is calculated as Equation 7:
where is TFN from step 3, reflecting relative importance to the prior criterion.
Step 5: Normalize these coefficients into final weights using Equation 8:
where is a TFN.
3.5 Z-WASPAS method
The Weighted Aggregated Sum Product Assessment (WASPAS) method, introduced by Zavadskas et al. (70), combines Weighted Sum Model (WSM) and Weighted Product Model (WPM) scores for multi-criteria decision-making. Fuzzy WASPAS extends this by using TFNs to handle uncertainty (71). In this study, we further extend fuzzy WASPAS to Z-WASPAS by using Z-SWARA weights (Table 4), which incorporate reliability via Z-numbers (69). Z-WASPAS ranks failure modes based on their risk impact (Severity, Occurrence, Detection), with WSM and WPM scores (Table 5) used in Z-DEA-FMEA (Table 12) and hybrid rankings (Tables 6–8). The Z-WASPAS method involves the following steps:
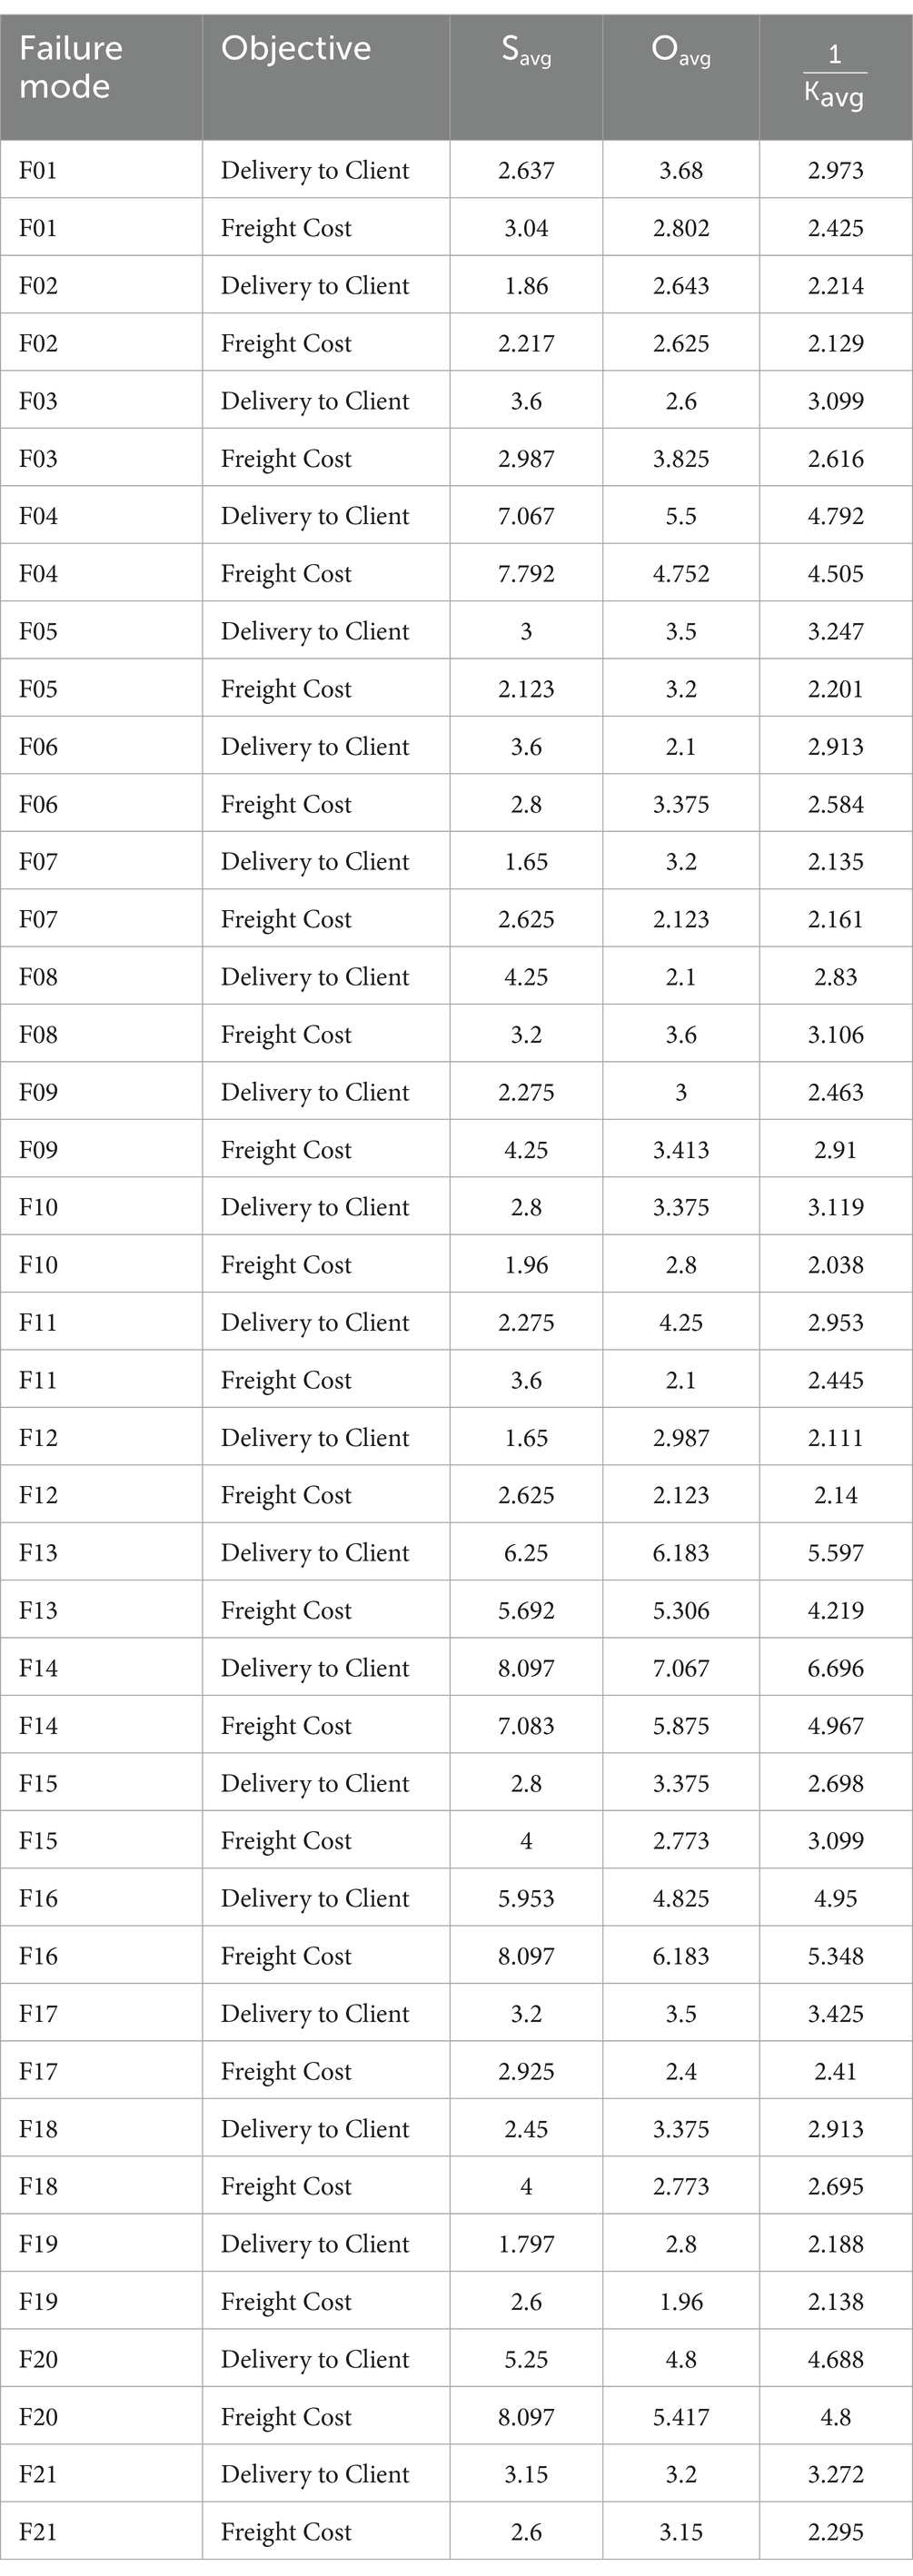
Table 12. Z-DEA-FMEA input and output averages for HIV drug supply chain failure modes.
Step 1: Use the matrices to normalize the non-beneficial components (67, 70) (Equation 9).
This ensures the least risky mode (lowest S, O, D) approaches (1,1,1), with riskier modes scoring <(1,1,1), aligning with FMEA risk prioritization.
Step 2: Calculate the following matrix to evaluate normalized fuzzy choices of made by the WSM ( TFN) and WPM ( TFN) using Equations 10, 11:
Examine each TFN’s region of decision-making to de-fuzzify performance assessment Equations 12–14:
Step 3: To order the failure modes for the 𝑖-th alternative, use the utility function Qi, where 𝜆 (typically set to 0.5 for balance) weights the WSM and WPM scores. Rank the failure modes from highest to lowest K𝑖 values to determine their priority (lower middle values indicate higher risk).
3.6 Data Envelopment Analysis (DEA) in Z-DEA-FMEA
In this study, the Z-DEA-FMEA model evaluates the efficiency of failure modes in the HIV drug supply chain, leveraging fuzzy Z-number attributes processed through a linear programming (LP) framework (58, 71) Z-DEA-FMEA assesses the efficiency of 42 failure modes (21 modes × 2 objectives, Delivery to Client Date and Freight Cost).
Inputs (Severity 𝑆, Occurrence 𝑂) and output (reciprocal Z-WASPAS 1/𝐾avg) are derived as Triangular Fuzzy Numbers (TFNs) from Z-numbers in Table 13. Table 13 presents Z-numbers for S, O, and D, derived from structured interviews with drug supply chain and HIV drug logistics experts. Experts rated these factors on a 1–10 scale as Z-numbers, reflecting severity, occurrence, and detection with associated reliability. Individual responses were aggregated by averaging, producing the Z-numbers shown, which were then converted to TFNs using Equations 5, 6 for analysis in Z-SWARA, Z-WASPAS, and Z-DEA-FMEA. Minor rounding was applied during aggregation for consistency, ensuring analytical precision. To enable crisp LP, TFNs are de-fuzzified into averages using Equation 15:
where 𝑥𝑖𝑗 is the 𝑖-th input (S or O) for mode 𝑗, and 𝑦𝑗 is the output (𝐾), with 𝑙, 𝑚, and 𝑢 as lower, middle, and upper TFN bounds. These averages (𝑆𝑎𝑣𝑔, 𝑂𝑎𝑣𝑔, 𝐾𝑎𝑣𝑔) are detailed in Table 12 for all modes. This study uses 1/𝐾avg scores as the output (low 𝐾𝑎𝑣𝑔 values indicate high risk due to non-beneficial criteria S, O, D), so high 1/𝐾𝑎𝑣𝑔 values reflect greater criticality) for Z-DEA-FMEA. To achieve robust differentiation among failure modes, super-efficiency DEA with Variable Returns to Scale (VRS) was employed using the “sdea()” function in “RStudio” (72). This method enhances standard DEA by allowing efficiency scores to exceed 1 for highly efficient modes, addressing the need for clear prioritization in supply chain risk management (73). The super-efficiency model is formulated as Equations 16–20:
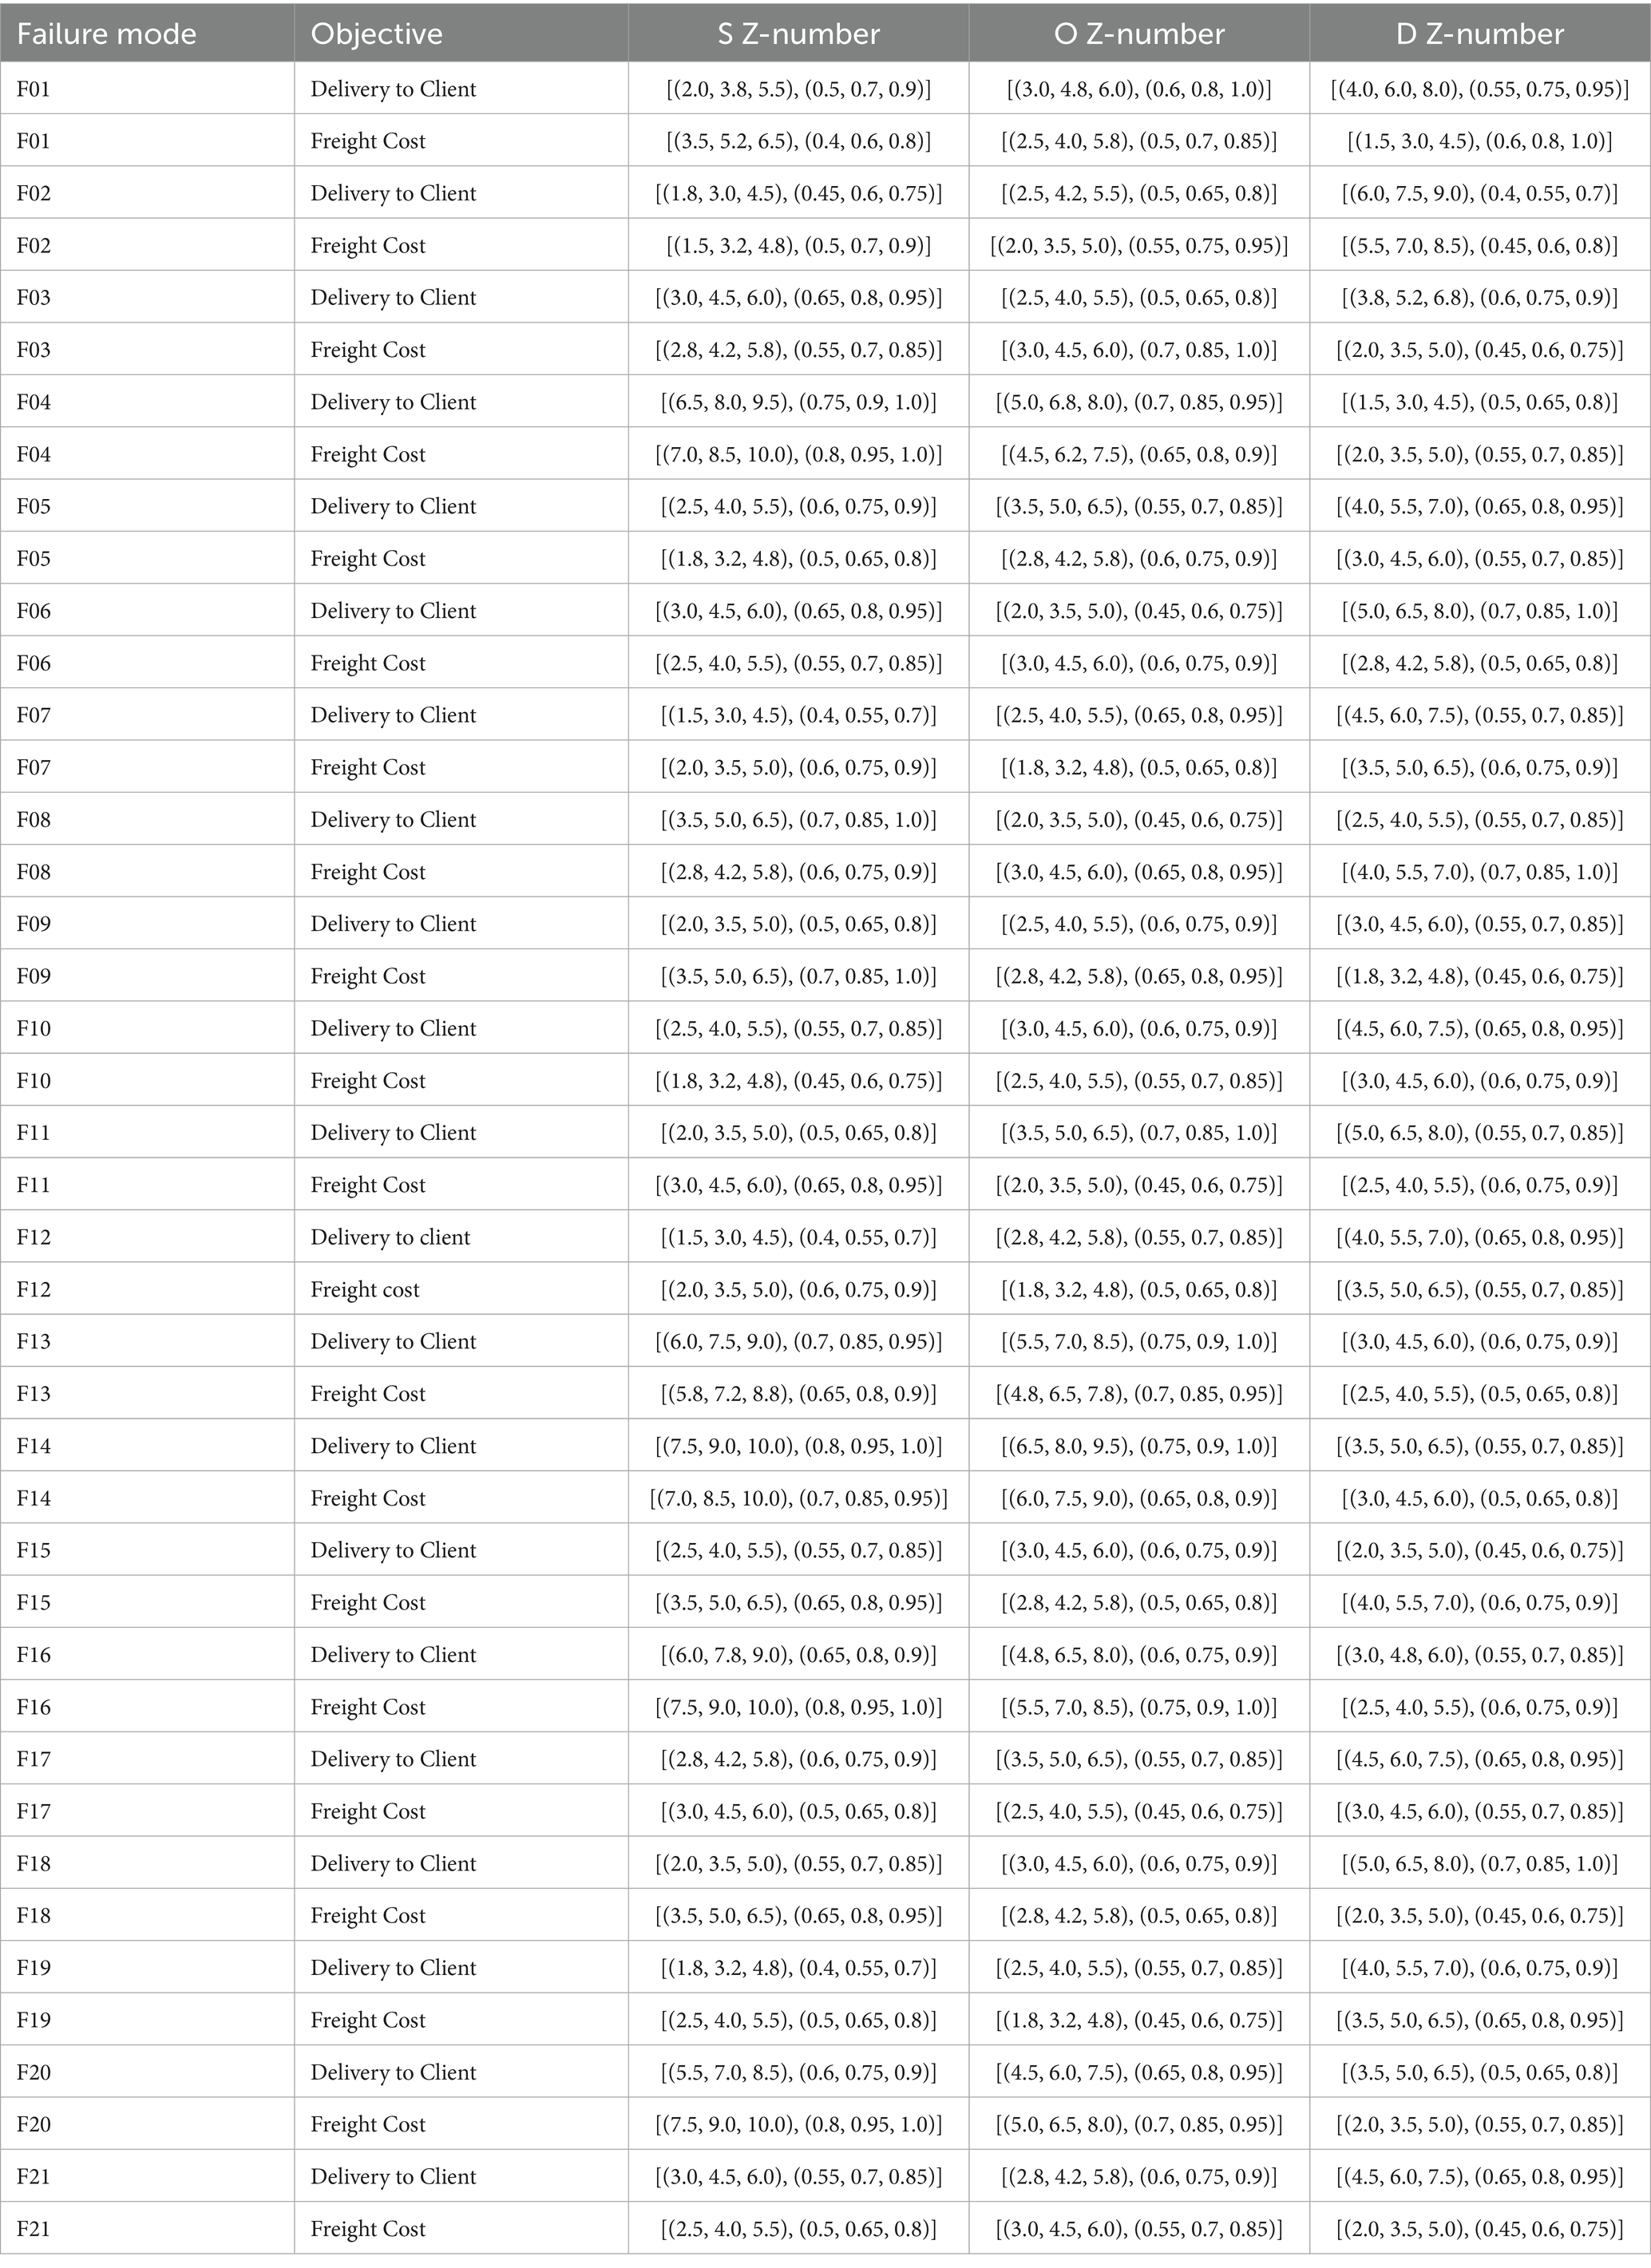
Table 13. Z-numbers describing the risk factors associated with identified failure modes for Delivery to Client Date and Freight Cost (USD).
Subject to:
Here, 𝜆𝑘 are weights for peer modes 𝑘 (42 total), ensuring Variable Returns to Scale (VRS) (73). Results are compiled in Table 14 for use in subsequent hybrid rankings, adapting traditional DEA to incorporate Z-number uncertainty (58).
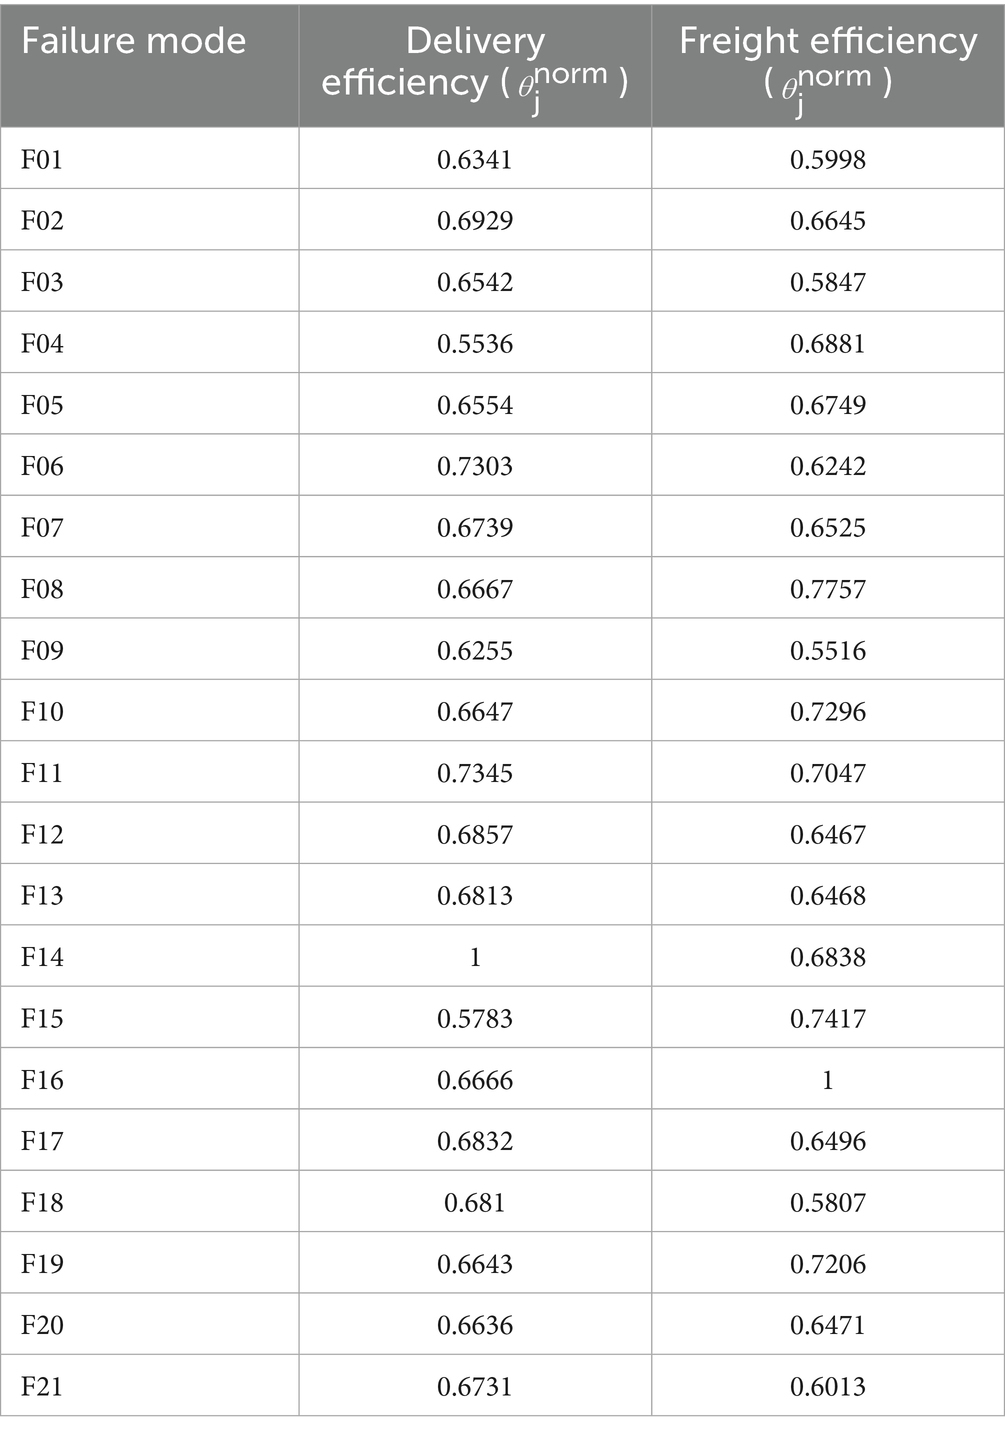
Table 14. Normalized super-efficiency scores for HIV drug supply chain failure modes across delivery and freight objectives.
As a common practice in DEA (72), super-efficiency scores producing infinite values for outliers (e.g., F14) were capped at 1.5 to ensure usability and prevent instability, then normalized relative to 1.5. This preserves rankings, enhancing compatibility with Z-SWARA and Z-WASPAS outputs (74).
Our Z-DEA-FMEA extension is informed by DEA applications in hospital efficiency. In their evaluation of Portuguese hospitals before and after COVID-19, Nunes and Ferreira (32) employed network DEA and discovered that, while efficiency decreased in 2020, recoveries surpassed pre-pandemic levels with enhanced safety, proving the importance of DEA for disruption resilience. Applying log-linear DEA for pay-for-performance optimization, Ferreira et al. (33) were able to link payments with efficiency and quality, which is pertinent to our freight cost risks, and achieve 30% cost savings. The DEA’s robustness in healthcare under uncertainty is highlighted by these and other research (27, 29, 31).
3.7 Hybrid rankings
This section outlines the hybrid ranking methodology, which integrates Z-DEA-FMEA with Z-SWARA and Z-WASPAS to provide a comprehensive prioritization of failure modes across two objectives: Delivery to Client Date and Freight Cost (74). The process combines three rankings: RPN (Table 15), Z-SWARA/Z-WASPAS (Table 5), and Z-DEA-FMEA efficiencies (Table 14). The scores are normalized and aggregated into a hybrid score for each failure mode 𝑖 using Equation 21:
where is the normalized RPN middle value (Table 15, divided by the maximum RPN), is the Z-WASPAS middle score, normalized across its range as (Table 5, reflecting higher risk with lower 𝐾𝑎𝑣𝑔) and is the Z-DEA-FMEA efficiency (Table 14).
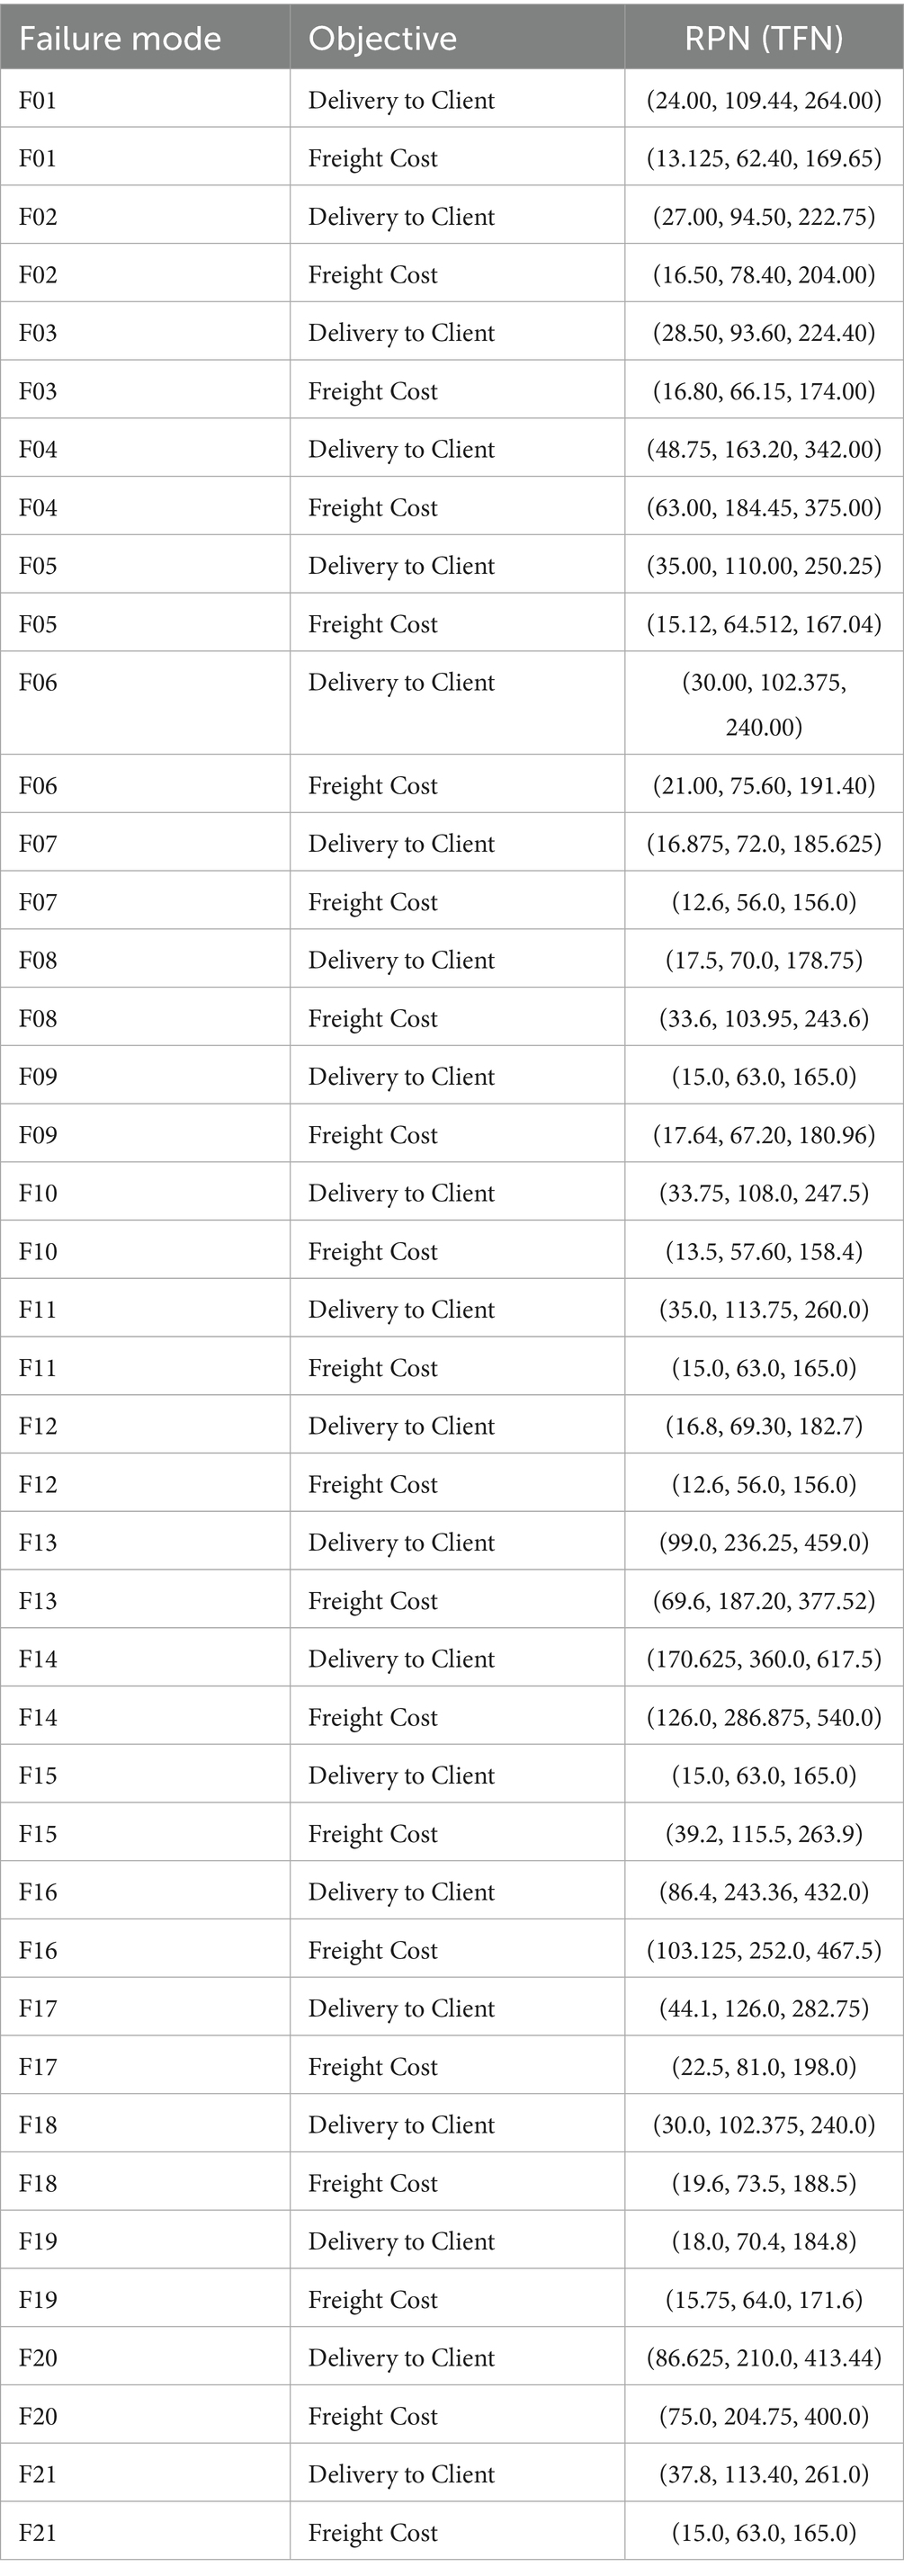
Table 15. Risk priority numbers (RPNs) for identified failure modes.
For combined rankings across the two objectives (Delivery to Client Date and Freight Cost), Equation 22 is defined to calculate the a total hybrid score:
where and are the hybrid scores for each objective.
4 Results
This study harnesses a mix of techniques, including multi-criteria decision-making (MCDM), Data Envelopment Analysis (DEA), and optimization strategies, combining Z-numbers, Failure Mode and Effects Analysis (FMEA), Z-SWARA, Z-WASPAS, and Z-DEA-FMEA methodologies into a hybrid ranking model. Data from ARV and HIV lab shipments, supplemented by expert insights, inform the findings.
Table 13 presents Z-number assessments for Severity (S), Occurrence (O), and Detection (D) across 21 failure modes, with values for Quantity Errors [F14, Delivery S = (7,8,9), O = (6,7,8)], Shipment Mode Selection [F04, Delivery S = (6,7,8)], and Unit Miscalculation [F13, Delivery S = (5, 6.25, 7.5)]. Table 15 lists RPN middle values (e.g., F14 Delivery = 360, F16 Freight = 252). Table 4 provides Z-SWARA weights, and Table 5 reports Z-WASPAS K scores [e.g., F14 Delivery K = (0.116, 0.143, 0.189), F16 Freight K = (0.141, 0.178, 0.242)]. Table 16 ranks failure modes based on RPN and Z-WASPAS rankings (e.g., F14 Delivery: RPN 1st, Z-WASPAS 1st; F16 Freight: RPN 2nd, Z-WASPAS 1st). Table 14 provides Z-DEA-FMEA efficiencies (e.g., F14 Delivery 𝜃=1.0, F06 Delivery 𝜃=0.7303).
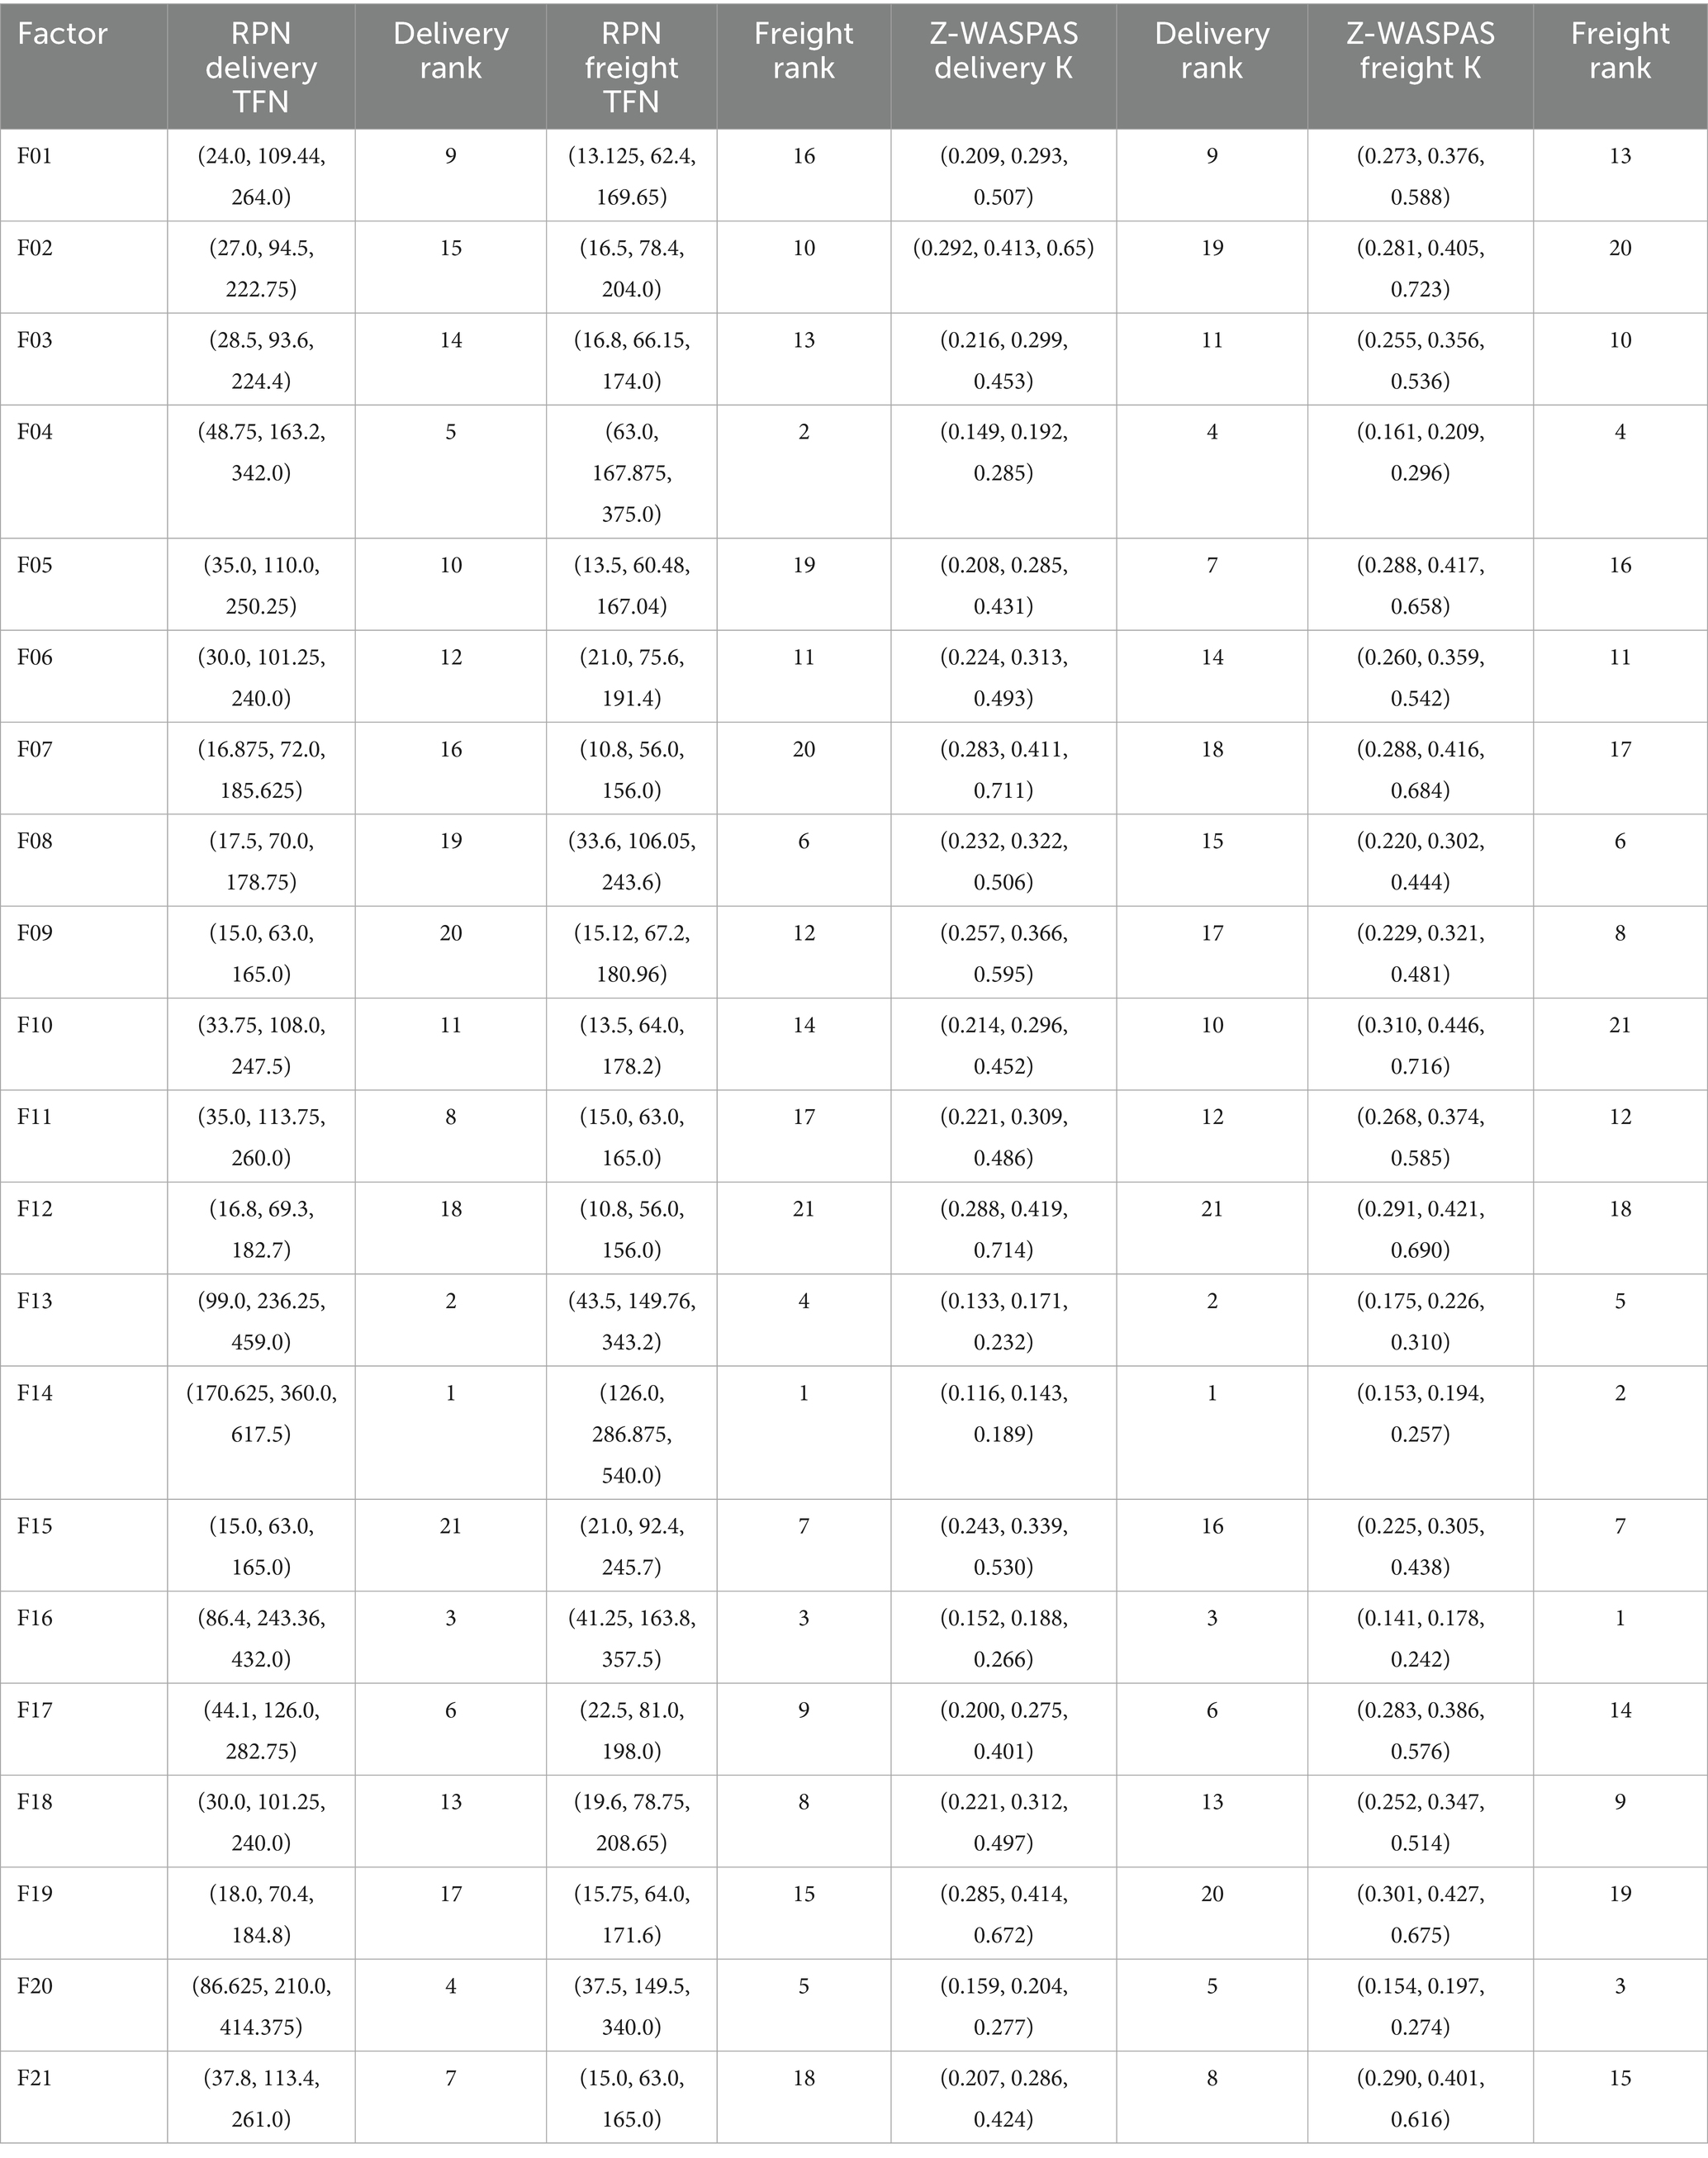
Table 16. Comparison of RPN and Z-SWARA-Z-WASPAS rankings for HIV drug supply chain factors by Delivery to Client and Freight Cost objectives.
Hybrid rankings (Tables 6, 7) show F14 at 𝑄𝑖=1.0 for Delivery and F16 at 𝑄𝑖=0.9595 for Freight. Combined rankings (Table 8) list F14 (𝑄𝑡𝑜𝑡𝑎𝑙=0.9374), F16 (𝑄𝑡𝑜𝑡𝑎𝑙=0.8430), F13 (𝑄𝑡𝑜𝑡𝑎𝑙=0.7261), F20 (𝑄𝑡𝑜𝑡𝑎𝑙=0.6872), F04 (𝑄𝑡𝑜𝑡𝑎𝑙=0.6741), and F06 (𝑄𝑡𝑜𝑡𝑎𝑙=0.4347). Figures 2–4 visualize RPN/Z-WASPAS, hybrid, and combined rankings, respectively.
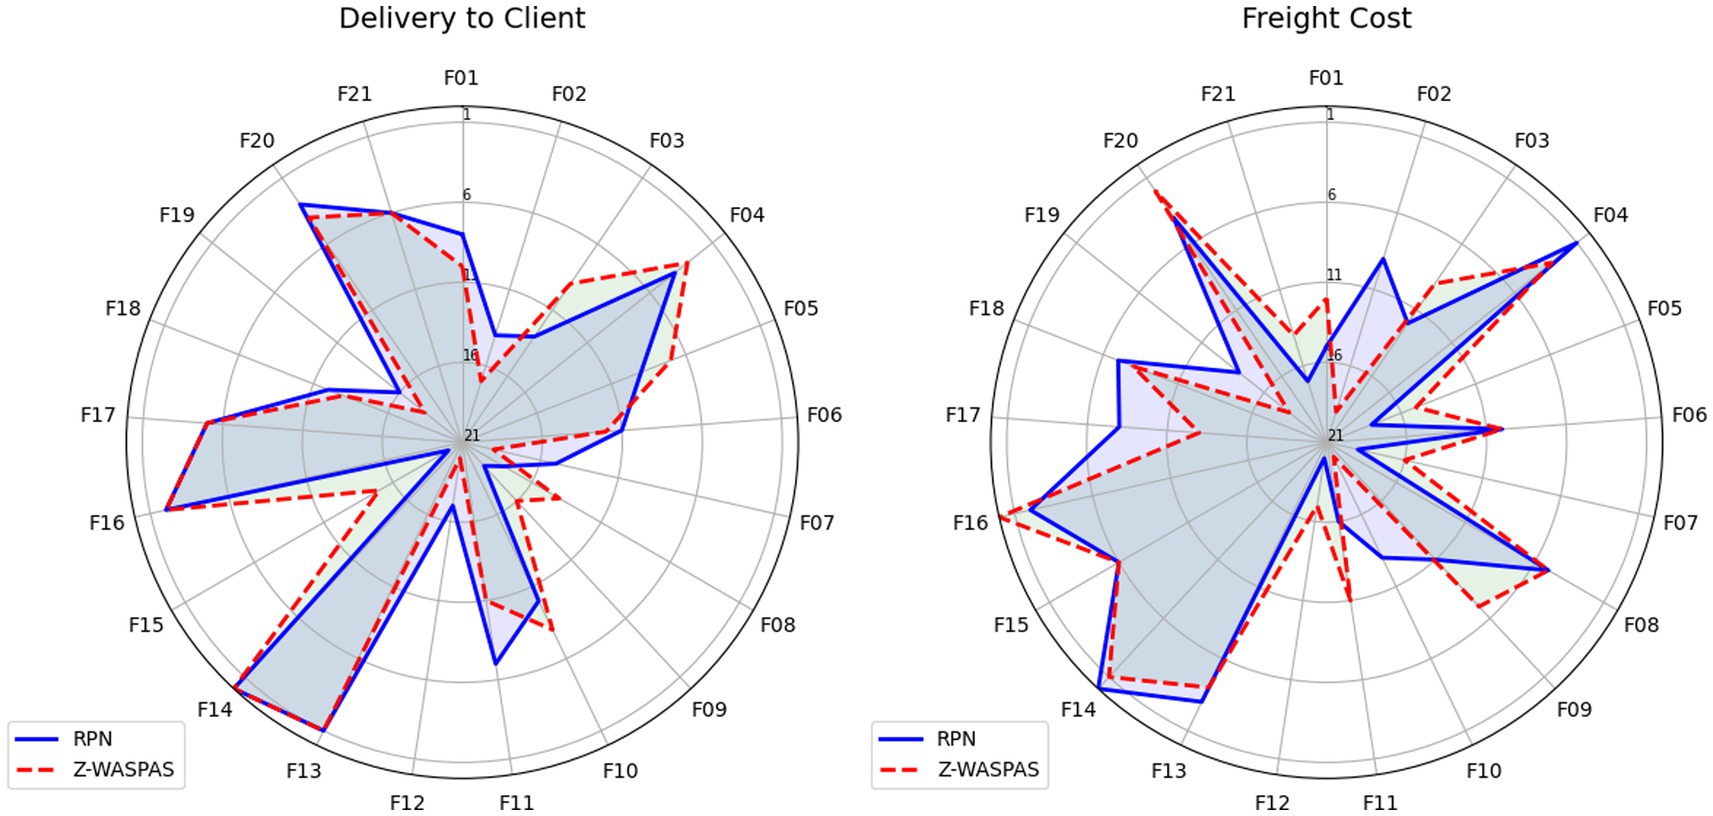
Figure 2. Comparison of RPN and Z-SWARA-Z-WASPAS rankings for HIV drug supply chain.
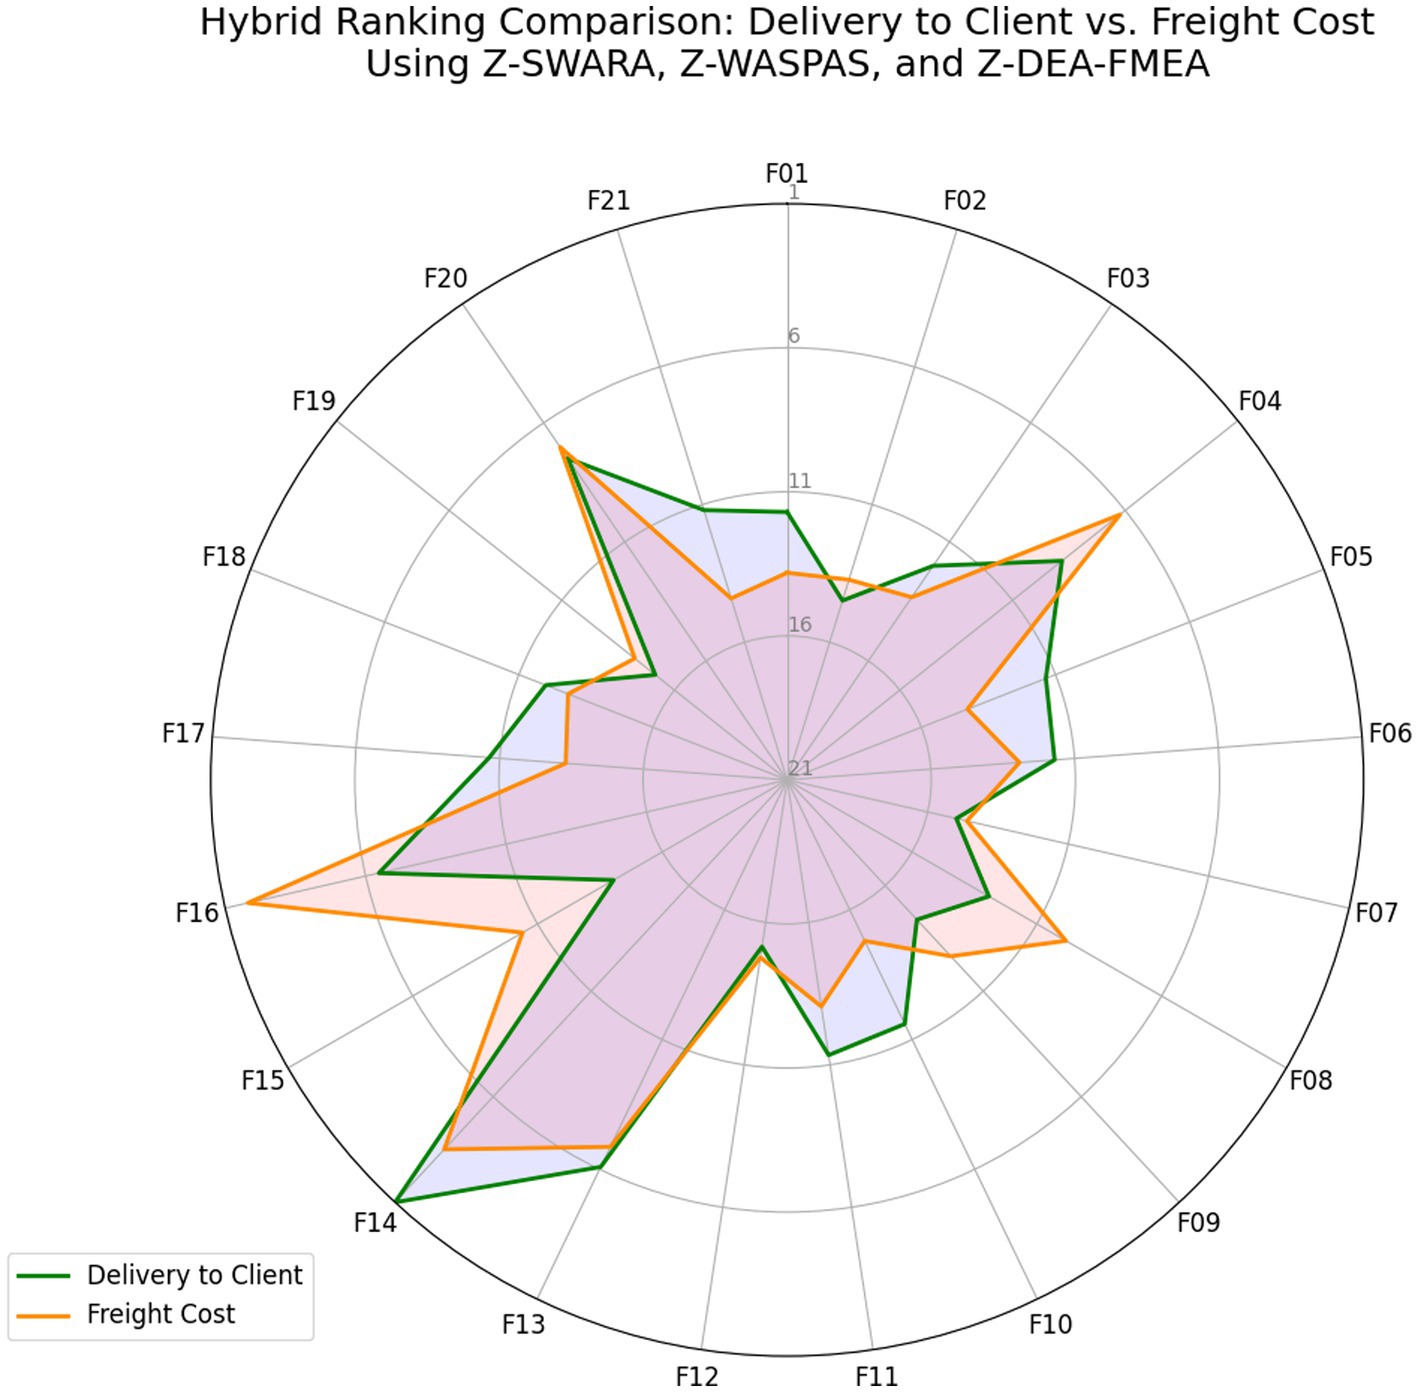
Figure 3. Hybrid rankings based on Delivery to Client date vs. freight cost using Z-SWARA, Z-WASPAS, and Z-DEA-FMEA.
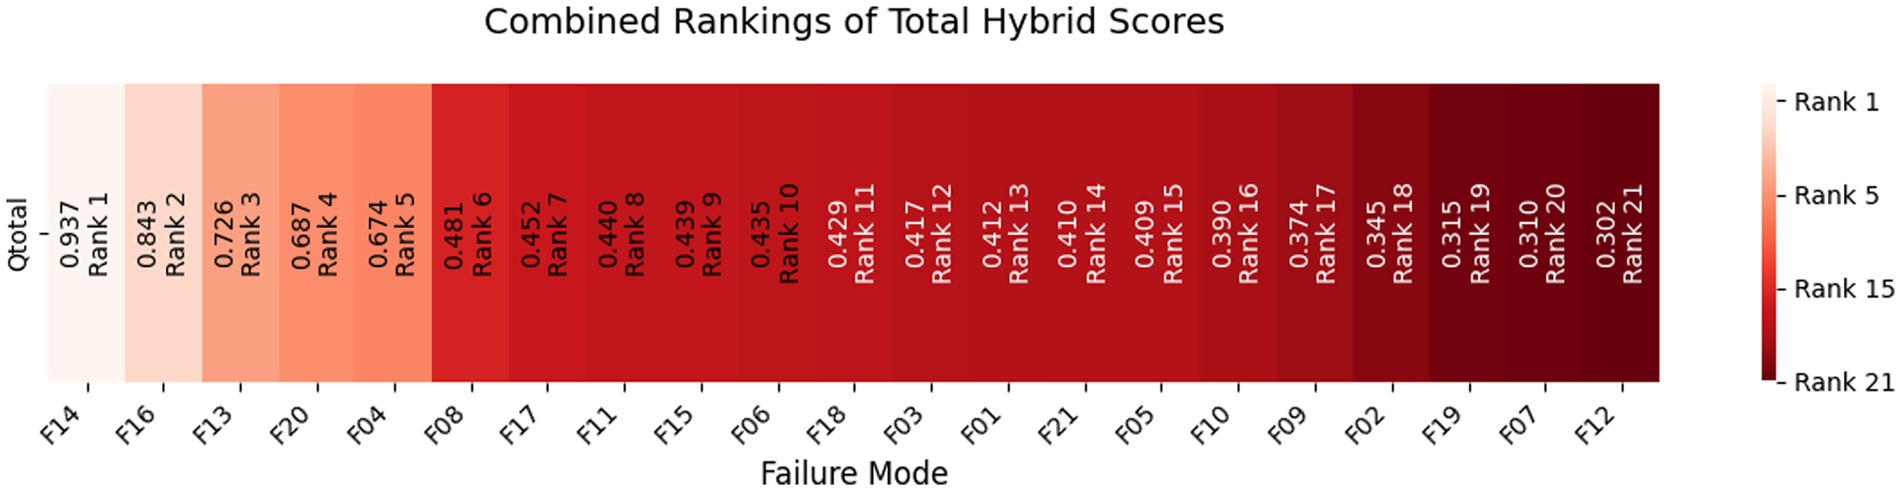
Figure 4. Combined rankings of total hybrid scores for HIV drug supply chain failure modes.
This study provides a detailed analysis of the HIV drug supply chain, identifying critical failure modes and their impact on delivery and cost objectives, setting the stage for targeted improvements. It also provides a robust framework for targeting critical failure modes, enhancing resilience and efficiency.
4.1 Analysis of the results of FMEA approach
Failure Mode and Effect Analysis (FMEA) serves as an effective tool for predicting potential system failures and preventing their occurrence. It has also been widely applied in healthcare settings to enhance safety and reliability (75). In this study, focusing on optimizing the HIV drug supply chain, FMEA is employed as the first step to identify risks (76, 77). Twenty-one failure modes that occurred in the ARV and HIV lab supply chain have been identified through a literature review, analysis of the dataset, and finalized approval by experts (78), with their risk factor values determined as Z-numbers, as shown in Table 13. These failure modes, assessed across two components: Delivery to Client Date and Freight Cost (USD) are introduced as follows: “Country Infrastructure” (Country Infrastructure Challenges, F01), “Coordination Failures” (Coordination Failures by Manager, F02), “INCO Term Misalignment” (Vendor INCO Term Misalignment, F03), “Shipment Mode Selection” (Inefficient Shipment Mode Selection, F04), “Delivery Scheduling” (Inaccurate Delivery Scheduling, F05), “Storage Conditions” (Improper Storage Conditions, F06), “Dosage Errors” (Dosage Specification Errors, F07), “Molecule Mismatch” (Molecule/Test Type Mismatch, F08), “Vendor Reliability” (Vendor Reliability Issues, F09), “Brand Delays” (Brand Availability Delays, F10), “Delivery Confirmation” (Delayed Delivery Confirmation, F11), “Product Misclassification” (Product Group Misclassification, F12), “Unit Miscalculation” (Unit of Measure Miscalculation, F13), “Quantity Errors” (Line Item Quantity Errors, F14), “Customs Delays” (Customs Clearance Delays, F15), “Pack Price Discrepancies” (Pack Price Discrepancies, F16), “Demand Forecasting” (Inaccurate Demand Forecasting, F17), “Site Distance Delays” (Manufacturing Site Distance Delays, F18), “First Line Delays” (First Line Designation Delays, F19), “Weight Failures” (Weight-Related Logistical Failures, F20), “Insurance Overruns” (Line Item Insurance Cost Overruns, F21). For brevity, we refer to these failure modes by their short names (e.g., “Country Infrastructure”) throughout this study, with brief designations provided in Table 17. The decision matrix, converted to Z-numbers using Tables 9, 10 (section 3), is presented in Table 13.

Table 17. Failure modes addressed by the integrated methodology.
It is important to note that the HIV drug supply chain is a multifaceted system that is affected by a number of factors. The delivery and distribution of essential medical supplies may be adversely affected by each variable. Understanding and mitigating these risks becomes essential for the efficient and reliable operation of the supply chain. Various variables, ranging from F01 to F21, are assessed using the Failure Modes and Effects Analysis (FMEA) method. In order to assess each variable, three dimensions are considered: severity, occurrence, and detection, rated by experts for both Delivery to Client Date and Freight Cost objectives. In mathematics, Z-numbers represent both deterministic information and uncertainty associated with that information (69). To provide a range of possible values for each variable, two sets of Z-numbers are presented.
4.1.1 Severity
The purpose of this assessment is to determine the potential impact of a failure of the variable. In the event of a failure or compromise of a variable, a higher value (0–10) indicates a greater negative impact.
4.1.2 Occurrence
Using this method, it is possible to determine the likelihood of a variable failure. In general, a higher value indicates a greater likelihood of the variable failing.
4.1.3 Detection
It is a measure of the capability of detecting and correcting failures before they have a negative impact on the outcome. In general, a higher value indicates that the issue is more difficult to detect or correct, while a lower value indicates that monitoring mechanisms are more effective.
The FMEA approach, enhanced by Z-numbers, offers a robust framework for assessing risk factors in the HIV drug supply chain. Table 13 outlines Z-number representations for Severity (S), Occurrence (O), and Detectability (D) across 21 failure modes for Delivery to Client Date and Freight Cost, with expert-validated values, capturing uncertainty.
4.2 Risk factor analysis
In this subsection, risk factors will be analyzed based on three dimensions: severity (S), occurrence (O), and detection (D). According to the results obtained from Table 13, values of risk factors for each Failure mode is determined in the form of Z-numbers which reflects uncertainty of information obtained from experts and the reliability of that information as well (69). Risk Priority Numbers (RPNs) are determined based on multiplication of Z-numbers of Severity, Occurrence, and Detection for each Failure Mode, following standard FMEA practices (78) and are presented in Table 15. Decision makers can prioritize failure modes considering RPNs and implement corrective actions based on failure modes with higher RPNs.
For Delivery to Client Date, F14 yields the highest RPN at (170.625, 360.0, 617.5), driven by its high order value and frequent issues, followed by F13 at (99.0, 236.25, 459.0) due to large quantities, and F16 at (86.4, 243.36, 432.0) from volume delays. For Freight Cost, F14 tops with (126.0, 286.875, 540.0), reflecting significant cost impact, closely followed by F16 at (103.125, 252.0, 467.5) and F04 at (63.0, 184.45, 375.0) due to logistics demands. Lower RPNs, like F09 Delivery (15.0, 63.0, 165.0), indicate less critical risks. These baseline RPNs highlight key vulnerabilities, with F14’s dominance across objectives guiding initial prioritization, while subsequent weighted analyses (e.g., Z-WASPAS) refine these rankings.
4.3 Z-WASPAS-based risk prioritization
This subsection reports Z-WASPAS-derived risk prioritization results for HIV drug supply chain failure modes across Delivery to Client Date and Freight Costs. Table 4 presents Z-SWARA weights, Table 5 lists Z-WASPAS K scores, and Table 16 provides rankings based on RPN and Z-WASPAS K middle values for 21 failure modes.
4.3.1. Role of Z-SWARA in Z-WASPAS
Here, we harness the Z-SWARA method to weigh the heartbeat of risk assessment, Severity (𝑆), Occurrence (𝑂), and Detection (𝐷) drawing from expert wisdom in the HIV drug supply chain (68, 69). Z-SWARA, an insightful twist on Step-wise Weight Assessment Ratio Analysis, weaves uncertainty and confidence into Triangular Fuzzy Numbers (TFNs) via Z-numbers, setting the stage for Z-WASPAS (Section 4.3.2). Experts crafted through their seasoned insights, employing ranking and fuzzy comparisons grounded in the Z-SWARA framework. Table 4 presents the resulting weights for each objective.
Table 4 reports Z-SWARA weights for Severity (S), Occurrence (O), and Detection (D) across Delivery to Client Date and Freight Costs, derived from expert assessments. For Delivery to Client Date, the weights are 𝑤𝑆=(0.47, 0.54, 0.62), 𝑤𝑂=(0.33, 0.36, 0.39), and 𝑤𝐷=(0.14, 0.17, 0.21), with middle values of 0.54, 0.36, and 0.17, respectively, indicating Severity’s higher priority. For Freight Cost, the weights are 𝑤𝑆=(0.42, 0.48, 0.54), 𝑤O = (0.32, 0.35, 0.39), and 𝑤𝐷=(0.15, 0.18, 0.20), with middle values of 0.48, 0.35, and 0.18. These weights inform Z-WASPAS K scores in Table 5.
4.3.1 Z-WASPAS rankings
The Z-WASPAS method is applied to rank failure modes (F01–F21) in the HIV drug supply chain, using the Z-SWARA weights from Table 4 and Z-numbers from Table 13. Z-WASPAS combines the Weighted Sum Model (WSM) and Weighted Product Model (WPM) to produce a combined score (K) for each failure mode, as detailed in section 3.5. Table 5 presents the WSM, WPM, and K scores as triangular fuzzy numbers (TFNs) for both objectives: Delivery to Client Date and Freight Cost.
The Z-WASPAS methodology is distinctive in its strong dependence on expert judgments. This table comes from experts’ opinions, covering factors F01 to F21. Examples include F14 Delivery K = (0.116, 0.143, 0.189), F16 Freight K = (0.141, 0.178, 0.242), F13 Delivery K = (0.133, 0.171, 0.232), and F20 Freight K = (0.154, 0.197, 0.274).
4.4 Comparative analysis and hybrid prioritization of risk factors
This section compares the risk prioritization methods applied in the HIV drug supply chain RPN and Z-WASPAS and integrates them with Z-DEA-FMEA to develop a hybrid ranking of failure modes across Delivery to Client Date and Freight Costs. The comparative analysis highlights the strengths and limitations of each method, while the hybrid approach leverages their combined insights to enhance decision-making. Table 16 compares RPN and Z-WASPAS rankings, Table 14 presents Z-DEA-FMEA efficiencies, and Tables 6–8 provide hybrid and combined rankings for 21 failure modes.
4.4.1 RPN and Z-WASPAS rankings
Table 16 reports RPN rankings (Table 15) and Z-WASPAS rankings (Table 5) for 21 HIV drug supply chain failure modes across Delivery to Client Date and Freight Costs, as defined in Table 17.
For Delivery, top ranks are F14 (RPN middle = 360.0, Z-WASPAS K middle = 0.143, 1st), F13 (236.25, 0.171, 2nd), F16 (243.36, 0.188, 3rd), F04 (163.2, 0.192, 4th), and F20 (210.0, 0.204, 5th). For Freight, top ranks are F16 (252.0, 0.178, 1st), F14 (286.875, 0.194, 2nd), F20 (149.5, 0.197, 3rd), F04 (184.45, 0.209, 4th), and F13 (187.2, 0.226, 5th). Failure mode F06 ranks 12th (101.25, 0.313) for Delivery and 11th (75.6, 0.359) for Freight. Rank differences across objectives include F16 (Delivery: RPN 3rd, Z-WASPAS 3rd; Freight: RPN 2nd, Z-WASPAS 1st) and F04 (Delivery: RPN 5th, Z-WASPAS 4th; Freight: RPN 2nd, Z-WASPAS 4th). Figure 2 visualizes these rankings.
4.4.2 Z-DEA-FMEA efficiency analysis
Sustainable healthcare projects, such as the HIV drug supply chain, demand robust evaluation methods to prioritize risks effectively. The Z-DEA-FMEA technique (section 3.6) addresses this by using Z-numbers to manage uncertainty in expert opinions, leveraging data from Table 13. It assesses how efficiently each failure mode converts risk inputs (Severity, Occurrence) into impact (output) across Delivery to Client Date and Freight Cost objectives, complementing the RPN and Z-WASPAS rankings in section 4.4.1.
Table 12 reports Z-DEA-FMEA inputs (Severity 𝑆𝑎𝑣𝑔, Occurrence 𝑂𝑎𝑣𝑔) from Table 13 and outputs (reciprocal Z-WASPAS 1/𝐾𝑎𝑣𝑔) from Table 5 for 21 HIV drug supply chain failure modes across Delivery to Client Date and Freight Costs. Examples include F14 (Delivery: 𝑆𝑎𝑣𝑔=8.097, 𝑂𝑎𝑣𝑔=7.067, 1/𝐾𝑎𝑣𝑔=6.696; Freight: 7.083, 5.875, 4.967), F20 (Delivery: 5.25, 4.8, 4.688; Freight: 8.097, 5.417, 4.8), and F06 (Delivery: 3.6, 2.1, 2.913; Freight: 2.8, 3.375, 2.584).
Table 14 lists the final efficiencies (𝜃) for 42 modes, with top values for F14 (Delivery: 1.0; Freight: 0.6838), F16 (Delivery: 0.6666; Freight: 1.0), F20 (Delivery: 0.6636; Freight: 0.6471), F04 (Delivery: 0.5536; Freight: 0.6881), and F06 (Delivery: 0.7303; Freight: 0.6242). F01 scores 0.6341 (Delivery) and 0.5998 (Freight).
4.4.3 Hybrid Rankings Using Z-SWARA, Z-WASPAS, and Z-DEA-FMEA integration.
To enhance the prioritization of failure modes within the HIV drug supply chain, we integrated Z-DEA-FMEA with Z-SWARA and Z-WASPAS, combining RPN (Table 15), Z-WASPAS scores with Z-SWARA weights (Tables 4, 5), and Z-DEA efficiencies (Table 14). For each failure mode, we compute a hybrid score as described in section 3:
Tables 6, 7 report hybrid rankings (𝑄𝑖) for 21 HIV drug supply chain failure modes across Delivery to Client Date and Freight Costs, combining RPN (Table 15), Z-WASPAS scores (Table 5), and Z-DEA-FMEA efficiencies (Table 14), ranging from 1.0 (F14 Delivery) to 0.2927 (F19 Delivery) and 0.9595 (F16 Freight) to 0.3101 (F10 Freight). Table 8 presents combined rankings (𝑄𝑡𝑜𝑡𝑎𝑙), averaging 𝑄𝑖 from both objectives, spanning 0.9374 (F14) to 0.3022 (F12). For Delivery (Table 6), ranks are F14 (𝑄𝑖=1.0, 1st), F13 (0.7454, 2nd), F16 (0.7265, 3rd), F20 (0.6753, 4th), F04 (0.6098, 5th), F11 (0.4830, 8th), and F08 (0.4042, 15th). For Freight (Table 7), ranks are F16 (0.9595, 1st), F14 (0.8747, 2nd), F20 (0.6991, 3rd), F04 (0.7385, 4th), F13 (0.7067, 5th), and F08 (0.5585, 6th). Table 8 lists combined ranks: F14 (0.9374, 1st), F16 (0.8430, 2nd), F13 (0.7261, 3rd), F20 (0.6872, 4th), F04 (0.6741, 5th), F08 (0.4813, 6th), and F15 (0.4388, 9th).
Table 6 shows Delivery rankings, with 𝑄𝑖 scores ranging from 1.0 (F14) to 0.2927 (F19), where F14, F13, and F16 lead, while F08 shifts from 13th in Z-WASPAS (Table 16) to 15th and F11 from 12th to 8th. Figure 3 visualizes these 𝑄𝑖 scores.
Table 7 lists Freight rankings, with 𝑄𝑖 scores spanning 0.9595 (F16) to 0.3101 (F10), highlighting F16, F14, and F20 as top risks, and F08 rising from 15th in Z-WASPAS (Table 16) to 6th. Figure 3 illustrates these 𝑄𝑖 rankings.
Table 8 reports combined rankings, with 𝑄𝑡𝑜𝑡𝑎𝑙 ranging from 0.9374 (F14) to 0.3022 (F12), where F14 and F16 dominate, F08 shifts from 15th in Z-WASPAS Delivery (Table 16) to 6th, and F15 reaches 9th. Figure 4 visualizes these 𝑄𝑡𝑜𝑡𝑎𝑙 scores.
This hybrid methodology, leveraging Z-numbers to address uncertainty, enhances the prioritization of failure modes in complex supply chains. The rankings in Tables 6–8 and visualized in Figure 4, provide a robust foundation for targeted interventions, optimizing both logistics and cost efficiency in the HIV drug supply chain.
5 Discussion
To ensure the distribution of antiretrovirals (ARVs) to millions globally, it is crucial to have effective HIV drug supply chains. The hybrid framework employed in this research tackles uncertainty in a manner that surpasses traditional Failure Mode and Effects Analysis (FMEA) by integrating Z-SWARA, Z-WASPAS, and Z-DEA-FMEA with Z-numbers. The primary risks identified concerning delivery timelines and freight costs include Quantity Errors (F14), Pack Price Discrepancies (F16), and Unit Miscalculation (F13), as detailed in Tables 6–8, 14, 16. This section evaluates the results from each method, elucidate their mathematical and practical significance, and highlight any limitations. This analysis offers a comprehensive view by linking data to tangible improvements in logistics.
5.1 Contribution of Z-SWARA in risk prioritization
Utilizing the expert weights outlined in Table 4, Z-SWARA assigns priority to risks, favoring severity with Delivery rated at 0.54 and Freight at 0.48. Consequently, F14 ranks first with a total 𝑄total of 0.9374 (Table 8), and its significant 𝑆𝑎𝑣𝑔 of 8.097 (Table 12) reflects stockouts that lead to delays in clinic treatments. The focus on Occurrence, particularly with Freight rated at 0.35, benefits F04, which ranks fifth with a 𝑄total of 0.6741, highlighting real transportation issues such as customs delays. While Z-SWARA’s triangular fuzzy number (TFN) weights enhance the raw scores of the Risk Priority Number (RPN), there is a risk that expert bias could skew the results if they are not cross-validated.
5.2 Z-WASPAS and uncertainty insights
Z-WASPAS occupies Triangular Fuzzy Numbers (TFNs) to quantify uncertainty, as Table 16 shows F14’s Delivery K (middle 0.143, 1st) indicates a high frequency of quantity discrepancies, with procurement errors negatively impacting the flow of ARVs in practice, in addition F16’s Freight K (0.178, 1st) exceeds F14 (0.194, 2nd) and captures the financial impact of price volatility, which is a major concern for suppliers in the global health sector. The range of TFNs (e.g., F16: 0.141–0.242) offers a mathematical framework for risk assessment, which is more thorough than the single-point method of the Risk Priority Number (RPN) in Table 15, and F20’s Freight K (0.197, 3rd) is linked to overweight shipments, which is a significant cost factor. Expert input shapes this precision, though context specificity may limit its reach.
5.3 Z-DEA-FMEA’S efficiency angle
Z-DEA-FMEA adds an efficiency angle, balancing risk with operational performance. This balance between risk and efficiency ensures that the hybrid framework provides actionable insights for optimizing resource use in the HIV drug supply chain. Table 14 measures risk-to-impact efficiency, revealing F14’s dominance (𝜃=1.0 Delivery, 0.6838 Freight) and F16’s Freight lead (𝜃=1.0). F06’s rise to 10th (𝑄𝑡𝑜𝑡𝑎𝑙=0.4347, Table 8) from 14th in Z-WASPAS (K = 0.313, Table 16) with 𝜃=0.7303 (Delivery) shows tracking efficiency, a practical fix for rural delays. F20’s Freight 𝜃=0.6471 (3rd, Table 7) flags weight costs, common in bulk shipping. Mathematically, 𝜃 balances inputs (Table 12, e.g., F14 𝑆𝑎𝑣𝑔 = 8.097) against 1/𝐾𝑎𝑣𝑔, unlike RPN’s risk-only lens, though it skips patient-level effects. Building on this, integrate ML-based optimization as in (79) to dynamically predict and resolve prioritized risks under constraints.
5.4 Method comparisons and rank shifts
This study outstrips traditional FMEA (75, 80), which lacks efficiency metrics, and standalone MCDM studies, often weak on uncertainty. Unlike studies (41), who cut vaccine costs via delivery redesign without risk ranking, our framework merges both, echoing sustainability focus with added Z-number precision (59, 60).
Table 16 presents a comparison between RPN and Z-WASPAS rankings, highlighting F14’s consistent first position in Delivery (RPN = 360.0, K = 0.143). This indicates that quantity errors significantly impact stock levels, posing a genuine challenge for remote clinics and healthcare facilities. Meanwhile, F16’s Freight ranking shifts from second place in RPN (252.0) to first in Z-WASPAS (K = 0.178), underscoring the financial implications of pricing, influenced by the Severity weight (Table 4, 𝑤𝑆=0.48) which differs from the straightforward RPN count. In Table 14, the Z-DEA-FMEA efficiencies redirect attention, with F06 advancing to 10th place overall (𝑄𝑡𝑜𝑡𝑎𝑙=0.4347, Table 8) from its previous 14th position in Z-WASPAS (K = 0.313). Its 𝜃 =0.7303 (Delivery) enhances efficiency compared to RPN’s risk-focused perspective (101.25). Additionally, F08 rises to 6th place in the Hybrid (𝑄𝑡𝑜𝑡𝑎𝑙=0.4813) from 13th in Z-WASPAS Delivery (K = 0.322), with its Freight 𝜃=0.7757 addressing clinical cost risks, molecule mismatches can delay treatment regimens, presenting a practical obstacle.
Tables 6, 7 refine this, F14’s Delivery 𝑄𝑖=1.0 and Freight 𝑄𝑖=0.8747 dominate, but F20’s Freight rise to 3rd (0.6991) from RPN 5th (149.5) highlights weight’s cost impact (Table 14, 𝜃=0.6471), a shipping burden in bulk ARV transport. The logistics risks have been mitigated by a reduction in F04’s freight, which has dropped from RPN 2nd (184.45) to 4th (0.7385) reflecting enhanced efficiency (𝜃 = 0.6881). Combined 𝑄𝑡𝑜𝑡𝑎𝑙 presented in Table 8 indicate that F14 (0.9374) and F16 (0.8430) represent the highest risks, while F13 (0.7261, 3rd) remains consistent, with ongoing unit errors noted in inventory records. The observed low efficiency across objectives (Table 14, 𝜃=0.6739, 0.6525) and K scores (0.419, 0.411) are evident in the lower rankings of F12 (0.3022, 21st) and F07 (0.3104, 20th), which reflect minor operational issues that are often overshadowed by procurement and logistical deficiencies.
From a mathematical perspective, the TFN range of Z-WASPAS (for instance, F16 Freight: 0.141–0.242) accounts for the uncertainties associated with RPN omissions, whereas Z-DEA-FMEA’s 𝜃 (for example, F08 Freight = 0.7757) introduces an efficiency dimension that is lacking in the straightforward calculations of RPN. Real-world analogies can be drawn, F14 corresponds to stock market crises, while F16 relates to budgetary pressures. However, variations such as F15 (9th, 𝑄𝑡𝑜𝑡𝑎𝑙 = 0.4388) from Z-WASPAS’s 16th (K = 0.339 Delivery) highlight the often-overlooked costs associated with customs, representing a subtle yet significant challenge in logistics.
5.5 Limitations
While the hybrid framework offers significant insights, it also presents certain limitations that warrant further investigation. Though we have boosted the method with Z-numbers, the research still leans on expert opinions for the Z-SWARA and Z-WASPAS techniques, and that might result in an element of subjectivity. Moreover, our data is limited to the HIV supply chain, so additional validation might be needed to make sure that the results are transferable to other scenarios, such as vaccine distributions. It is worth mentioning that, the framework tends to overlook downstream health outcomes, such as how the timely delivery of antiretroviral (ARV) medications influences patient adherence and viral suppression rates, focusing instead on supply chain efficiency metrics like delivery timelines and transportation costs.
6 Conclusion
This study advances HIV drug supply chain management by integrating Z-SWARA, Z-WASPAS, and Z-DEA-FMEA into a hybrid framework that outstrips traditional FMEA. Table 8 ranks Quantity Errors (F14, 𝑄𝑡𝑜𝑡𝑎𝑙=0.9374), Pack Price Discrepancies (F16, 0.8430), Unit Miscalculation (F13, 0.7261), Weight Failures (F20, 0.6872), and Shipment Mode Selection (F04, 0.6741) as top risks across delivery timelines and freight costs balancing substantivity and resilience as outlined in Section 1.
Z-numbers enhance prioritization over conventional methods, revealing critical stock shortages (F14) and pricing volatility (F16), often missed by RPN alone. Observations regarding efficiency, illustrated by the increase in F06 (𝑄𝑡𝑜𝑡𝑎𝑙 = 0.4347, 10th) with 𝜃=0.7303, show how monitoring and tracking can reduce delays. These insights enable managers to focus on significant inefficiencies, optimizing operations in areas most affected by disruptions. Furthermore, this research tackles a critical issue: each delay or budget overrun adversely impacts lives in resource-limited regions. Beyond prior studies, by pinpointing actionable priorities, this framework serves as a valuable resource to enhance access to ARVs, reduce expenses, and maximize limited resources, effectively addressing gaps in the global battle against HIV/AIDS with accuracy and intent.
6.1 Future work
Future study might improve this hybrid framework by using Neural Networks to stabilize price (F16, 2nd), Hybrid Salp Swarm approaches to optimize shipment schedules (F04, 5th), or Genetic Algorithms to increase quantity accuracy (F14, 𝑄𝑡𝑜𝑡𝑎𝑙 = 0.9374). While machine learning might modify logistics in response to regional bottlenecks, such the infrastructure concerns noted in F01, real-time analytics could be utilized to forecast unit delays (F13, 3rd). Assessing this method within the context of vaccine or emergency drug supply chains would determine its applicability beyond HIV logistics. Moreover, exploring the connections between key risks, like the delays highlighted in F14 and patient results, such as viral suppression levels, could tie supply chain performance directly to better health outcomes. Such steps aim to evolve the framework into a versatile, expandable tool that addresses bottlenecks and guarantees the prompt arrival of critical medications.
Data availability statement
The original contributions presented in the study are included in the article/supplementary material, further inquiries can be directed to the corresponding author.
Author contributions
AG: Conceptualization, Formal analysis, Investigation, Software, Methodology, Validation, Visualization, Writing – original draft, Writing – review & editing. BF: Conceptualization, Funding acquisition, Investigation, Validation, Visualization, Writing – original draft, Writing – review & editing. JF: Formal analysis, Methodology, Software, Supervision, Validation, Visualization, Writing – review & editing.
Funding
The author(s) declare that financial support was received for the research and/or publication of this article. This research was funded by the National Social Science Fund of China project: Research on the Modernization of Intellectual Property Governance for Digital Innovation (No. 22VRC064). It was also supported by Postgraduate Research and Practice Innovation Program of Jiangsu Province (No. KYCX22_0561).
Acknowledgments
We acknowledge the use of Grok 4, created by xAI, for grammar checking and spell checking during the preparation of this manuscript. The AI tool was used solely to enhance the clarity and correctness of the text and did not contribute to the content or scientific analysis.
Conflict of interest
The authors declare that the research was conducted in the absence of any commercial or financial relationships that could be construed as a potential conflict of interest.
Publisher’s note
All claims expressed in this article are solely those of the authors and do not necessarily represent those of their affiliated organizations, or those of the publisher, the editors and the reviewers. Any product that may be evaluated in this article, or claim that may be made by its manufacturer, is not guaranteed or endorsed by the publisher.
References
1. Avila-Rios, S, Parkin, N, Swanstrom, R, Paredes, R, Shafer, R, Ji, H, et al. Next-generation sequencing for HIV drug resistance testing: laboratory, clinical, and implementation considerations. Viruses. (2020) 12:617. doi: 10.3390/v12060617
2. Stevens, W, Gous, N, Ford, N, and Scott, LE. Feasibility of HIV point-of-care tests for resource-limited settings: challenges and solutions. BMC Med. (2014) 12:173. doi: 10.1186/s12916-014-0173-7
3. Vorkoper, S, Kupfer, LE, Anand, N, Patel, P, Beecroft, B, Tierney, WM, et al. Building on the HIV chronic care platform to address noncommunicable diseases in sub-Saharan Africa: a research agenda. AIDS. (2018) 32:S107–13. doi: 10.1097/QAD.0000000000001898
4. Kuupiel, D, Bawontuo, V, and Mashamba-Thompson, TP. Improving the accessibility and efficiency of point-of-care diagnostics services in low- and middle-income countries: lean and agile supply chain management. Diagnostics. (2017) 7:58. doi: 10.3390/diagnostics7040058
5. Borchers, A, and Pieler, T. Programming pluripotent precursor cells derived from Xenopus embryos to generate specific tissues and organs. Genes. (2010) 1:413–26. doi: 10.3390/genes1030413
6. World Bank. HIV/AIDS South Asia (2025). Available online at: http://go.worldbank.org/072CRWCFH0.
7. Paudel, T, Singh, N, Raj Banjara, M, Kafle, SP, Chandra Ghimire, Y, Pokharel, BR, et al. Epidemiology of HIV, programmatic progress and gaps in last 10 years in Nepal. J Virus Erad. (2016) 2:35–40. doi: 10.1016/S2055-6640(20)31099-2
8. Ullah, R, Ur Rehman, M, Noorul Hasan, T, Qadir, M, Ul Ain, Q, Perween, S, et al. Impact of COVID-19 pandemic on TB and HIV Services in Pakistan. Microbes Infect Dis. (2022) 4:5–7. doi: 10.21608/mid.2022.166863.1393
9. Hahn, PA, and Martins, MA. Adeno-associated virus-vectored delivery of HIV biologics: the promise of a "single-shot" functional cure for HIV infection. J Virus Erad. (2023) 9:100316. doi: 10.1016/j.jve.2023.100316
10. Rajabi-Kafshgar, A, Gholian-Jouybari, F, Seyedi, I, and Hajiaghaei-Keshteli, M. Utilizing hybrid metaheuristic approach to design an agricultural closed-loop supply chain network. Expert Syst Appl. (2023) 217:119504. doi: 10.1016/j.eswa.2023.119504
11. Lesego, A, Were, L, Tsegaye, T, Rafiu, I, Morrison, L, Peterson, T, et al. Lessons from the Global Fund-supported procurement and supply chain Investments in Zimbabwe: a mixed methods study. BMC Health Serv Res. (2024) 24:567. doi: 10.1186/s12913-024-11028-6
12. Shahi, A, Shrestha, S, C, BK, Acharya, K, and Pradhan, SK. Potential roles of pharmacists in HIV/AIDS care delivery in Nepal: a qualitative study. PLoS One. (2023) 18:e0280160. doi: 10.1371/journal.pone.0280160
13. Minior, T, Douglas, M, Edgil, D, Srivastava, M, Crowley, J, Firth, J, et al. The critical role of supply chains in preventing human immunodeficiency virus drug resistance in low- and middle-income settings. J Infect Dis. (2017) 216:S812–5. doi: 10.1093/infdis/jix403
14. Silabi, E, Sukums, F, and Paulo, H. Effect of IMPACT team approach implementation processes on health supply chain management data use in Singida region: a quantitative study. East Afr J Sci Technol Innov. (2023) 4:1–11. doi: 10.37425/eajsti.v4i2.587
15. Mishra, DA, Gupta, N, and Jha, GK. Supply chain resilience: adapting to global disruptions and uncertainty. International journal of innovative research. Engineering. (2024) 5:189–96. doi: 10.59256/ijire.20240502025
16. Katsaliaki, K, Galetsi, P, and Kumar, S. Supply chain disruptions and resilience: a major review and future research agenda. Ann Oper Res. (2022) 319:965–1002. doi: 10.1007/s10479-020-03912-1
17. Sugiono, A, Rahayu, A, Wibowo, LA, and Hurriyati, R. Developing models of environment uncertainty, incoterms on strategic alliance and competitive advantage. Uncertain Supply Chain Manag. (2024) 12:1083–96. doi: 10.5267/j.uscm.2023.12.001
18. Kazancoglu, Y, Ekinci, E, Mangla, SK, Sezer, MD, and Ozbiltekin-Pala, M. Impact of epidemic outbreaks (COVID-19) on global supply chains: a case of trade between Turkey and China. Socio Econ Plan Sci. (2023) 85:101494. doi: 10.1016/j.seps.2022.101494
19. Paul, A, and Saha, SC. A systematic literature review on flexible strategies and performance indicators for supply chain resilience. Glob J Flex Syst Manag. (2024) 26:207–31. doi: 10.1007/s40171-024-00415-x
20. Micheal, FD, and Onchweri, AN. Assessment of the impact of COVID-19 on access of HIV care and antiretroviral therapy at selected health facilities in Bushenyi District. Uganda INOSR Sci Res. (2023) 9:1–12.
21. Naidoo, I, Gumede, T, Manzini-Matebula, N, and Zungu, NP. Amplifying lessons learned from the implementation of the joint programme to strengthen integrated SRHR, and hiv and SGBV services. A case study in the eastern cape and KwaZulu-Natal. Pretoria: Human Sciences Research Council (2022).
22. Berhanemeskel, E, Beedemariam, G, and Fenta, TG. HIV/AIDS related commodities supply chain management in public health facilities of Addis Ababa, Ethiopia: a cross-sectional survey. J Pharm Policy Pract. (2016) 9:11. doi: 10.1186/s40545-016-0060-z
23. Masaba, R, Woelk, G, Siamba, S, Ndimbii, J, Ouma, M, Khaoya, J, et al. Antiretroviral treatment failure and associated factors among people living with HIV on therapy in Homa Bay, Kenya: a retrospective study. PLoS Glob Public Health. (2023) 3:e0001007. doi: 10.1371/journal.pgph.0001007
24. Attia, E-A, Alarjani, A, Uddin, MS, and Kineber, AF. Determining the stationary enablers of resilient and sustainable supply chains. Sustainability. (2023) 15:3461. doi: 10.3390/su15043461
25. Damtie, TA, Ibrahim, AJ, and Yikna, BB. Supply chain management performance of HIV/AIDS commodities and factors affecting it at health facilities of SNNPRS of Ethiopia; from the perspective of achieving 90-90-90 strategies. Integr Pharm Res Pract. (2020) 9:11–21. doi: 10.2147/IPRP.S228162
26. Thomas, D, Motomoke, E, Crawford, J, Defawe, O, Makaya, A, Ngwato, JW, et al. Optimized supply chain model reduces health system costs in DRC. Vaccine. (2021) 39:4166–72. doi: 10.1016/j.vaccine.2021.05.083
27. Lindlbauer, I, Schreyögg, J, and Winter, V. Changes in technical efficiency after quality management certification: a DEA approach using difference-in-difference estimation with genetic matching in the hospital industry. Eur J Oper Res. (2016) 250:1026–36. doi: 10.1016/j.ejor.2015.10.029
28. Li, H, and Dong, S. Measuring and benchmarking technical efficiency of public hospitals in Tianjin, China: a bootstrap-data envelopment analysis approach. Inquiry. (2015) 52:0046958015605487. doi: 10.1177/0046958015605487
29. O’Neill, L, Rauner, M, Heidenberger, K, and Kraus, M. A cross-national comparison and taxonomy of DEA-based hospital efficiency studies. Socio Econ Plan Sci. (2008) 42:158–89. doi: 10.1016/j.seps.2007.03.001
30. Chowdhury, H, Zelenyuk, V, Laporte, A, and Wodchis, WP. Analysis of productivity, efficiency and technological changes in hospital services in Ontario: how does case-mix matter? Int J Prod Econ. (2014) 150:74–82. doi: 10.1016/j.ijpe.2013.12.003
31. Li, X, Williams, D Jr, Lawrence, J, and Park, JM. Physician-hospital integration and hospital efficiency investigation. J Hosp Manag Health Policy. (2024) 8. doi: 10.21037/jhmhp-24-10
32. Nunes, AM, and Ferreira, DFC. Evaluating Portuguese public hospitals performance: any difference before and during COVID-19? Sustainability (2023) 15:294. doi: 10.3390/su15010294,
33. Ferreira, DC, Marques, RC, and Nunes, AM. Pay for performance in health care: a new best practice tariff-based tool using a log-linear piecewise frontier function and a dual–primal approach for unique solutions. Oper Res. (2021) 21:2101–46. doi: 10.1007/s12351-019-00502-3
34. Hillis, A, Germain, J, Hope, V, McVeigh, J, and Van Hout, MC. Pre-exposure prophylaxis (PrEP) for HIV prevention among men who have sex with men (MSM): a scoping review on PrEP service delivery and programming. AIDS Behav. (2020) 24:3056–70. doi: 10.1007/s10461-020-02855-9
35. Reed, JB, Patel, RR, and Baggaley, R. Lessons from a decade of voluntary medical male circumcision implementation and their application to HIV pre-exposure prophylaxis scale up. Int J STD AIDS. (2018) 29:1432–43. doi: 10.1177/0956462418787896
36. Gao, Y, Zhan, Y, Sun, Y, Zheng, W, Zhang, W, Fu, L, et al. Efficacy of voluntary medical male circumcision to prevent HIV infection among men who have sex with men: a randomized controlled trial. Ann Intern Med. (2024) 177:719–28. doi: 10.7326/M23-3317
37. Cremin, I, Alsallaq, R, Dybul, M, Piot, P, Garnett, G, and Hallett, TB. The new role of antiretrovirals in combination HIV prevention: a mathematical modelling analysis. AIDS. (2013) 27:447–58. doi: 10.1097/QAD.0b013e32835ca2dd
38. Alsallaq, RA, Baeten, JM, Celum, CL, Hughes, JP, Abu-Raddad, LJ, Barnabas, RV, et al. Understanding the potential impact of a combination HIV prevention intervention in a hyper-endemic community. PLoS One. (2013) 8:e54575. doi: 10.1371/journal.pone.0054575
39. Kates, J, Wexler, A, and Lief, E. Financing the response to HIV in low- and middle-income countries: International assistance from donor governments in 2013. Menlo Park, CA: Kaiser Family Foundation (2014).
40. Ying, R, Barnabas, RV, and Williams, BG. Modeling the implementation of universal coverage for HIV treatment as prevention and its impact on the HIV epidemic. Curr HIV/AIDS Rep. (2014) 11:459–67. doi: 10.1007/s11904-014-0232-x
41. Brown, ST, Schreiber, B, Cakouros, BE, Wateska, AR, Dicko, HM, Connor, DL, et al. The benefits of redesigning Benin's vaccine supply chain. Vaccine. (2014) 32:4097–103. doi: 10.1016/j.vaccine.2014.04.090
42. Assi, TM, Brown, ST, Kone, S, Norman, BA, Djibo, A, Connor, DL, et al. Removing the regional level from the Niger vaccine supply chain. Vaccine. (2013) 31:2828–34. doi: 10.1016/j.vaccine.2013.04.011
43. Datta, S, and Winfrey, B. One health tool: One health technical manual. Glastonbury, CT: Futures Institute (2012).
44. LLamasoft, I. Supply chain guru X. (2017). Available online at: https://help.llama.ai/release/native/modeling/modeling-topics/Home.htm.
45. Jamison, DT, Summers, LH, Alleyne, G, Arrow, KJ, Berkley, S, Binagwaho, A, et al. Global health 2035: a world converging within a generation. Lancet. (2013) 382:1898–955. doi: 10.1016/S0140-6736(13)62105-4
46. Alemnji, G, Fonjungo, P, Van Der Pol, B, Peter, T, Kantor, R, and Nkengasong, J. The centrality of laboratory services in the HIV treatment and prevention cascade: the need for effective linkages and referrals in resource-limited settings. AIDS Patient Care STDs. (2014) 28:268–73. doi: 10.1089/apc.2013.0356
47. Upfill-Brown, AM, Lyons, HM, Pate, MA, Shuaib, F, Baig, S, Hu, H, et al. Predictive spatial risk model of poliovirus to aid prioritization and hasten eradication in Nigeria. BMC Med. (2014) 12:92. doi: 10.1186/1741-7015-12-92
48. Anderson, SJ, Cherutich, P, Kilonzo, N, Cremin, I, Fecht, D, Kimanga, D, et al. Maximising the effect of combination HIV prevention through prioritisation of the people and places in greatest need: a modelling study. Lancet. (2014) 384:249–56. doi: 10.1016/S0140-6736(14)61053-9
49. Reiser, H, Editor making new drugs available to all. Fourth international HIV treatment as prevention workshop (2014). Vancouver.
50. Biza, A, Jille-Traas, I, Colomar, M, Belizan, M, Requejo Harris, J, Crahay, B, et al. Challenges and opportunities for implementing evidence-based antenatal care in Mozambique: a qualitative study. BMC Pregnancy Childbirth. (2015) 15:200. doi: 10.1186/s12884-015-0625-x
51. UNICEF. Accelerating access to innovative point-of-care HIV diagnostics – lessons learned from UNICEF. New York, NY: United Nations Children’s Fund (2021).
52. Heidt, B, Siqueira, WF, Eersels, K, Dilien, H, van Grinsven, B, Fujiwara, RT, et al. Point of care diagnostics in resource-limited settings: a review of the present and future of PoC in its Most needed environment. Biosensors. (2020) 10:133. doi: 10.3390/bios10100133
53. Kuupiel, D, Tlou, B, Bawontuo, V, Drain, PK, and Mashamba-Thompson, TP. Poor supply chain management and stock-outs of point-of-care diagnostic tests in upper east region's primary healthcare clinics, Ghana. PLoS One. (2019) 14:e0211498. doi: 10.1371/journal.pone.0211498
54. Katoba, J, Kuupiel, D, and Mashamba-Thompson, TP. Toward improving accessibility of point-of-care diagnostic Services for Maternal and Child Health in low- and middle-income countries. Point Care. (2019) 18:17–25. doi: 10.1097/POC.0000000000000180
55. Velloza, J, Roche, S, Concepcion, T, and Ortblad, KF. Advancing considerations of context in the evaluation and implementation of evidence-based biomedical HIV prevention interventions: a review of recent research. Curr Opin HIV AIDS. (2023) 18:1–11. doi: 10.1097/COH.0000000000000768
56. Levine, R, Pickett, J, Sekhri, N, and Yadav, P. Demand forecasting for essential medical technologies. Am J Law Med. (2008) 34:225–55. doi: 10.1177/009885880803400206
57. Engel, N, and Wolffs, PFG. Aligning diagnostics to the point-of-care: lessons for innovators, evaluators and decision-makers from tuberculosis and HIV. BMJ Glob Health. (2020) 5:e003457. doi: 10.1136/bmjgh-2020-003457
58. Yazdanparast, R, Tavakkoli-Moghaddam, R, Heidari, R, and Aliabadi, L. A hybrid Z-number data envelopment analysis and neural network for assessment of supply chain resilience: a case study. Cent Eur J Oper Res. (2021) 29:611–31. doi: 10.1007/s10100-018-0596-x
59. Karuppiah, K, Virmani, N, and Sindhwani, R. Toward a sustainable future: integrating circular economy in the digitally advanced supply chain. J Bus Ind Mark. (2024) 39:2605–19. doi: 10.1108/JBIM-12-2023-0742
60. Karuppiah, K, Sankaranarayanan, B, and Ali, SM. A novel quality function deployment based integrated framework for improving supply chain sustainability. Eng Manag J. (2022) 35:285–98. doi: 10.1080/10429247.2022.2097575
61. Khadem, M, Khadem, A, and Khadem, S. Application of artificial intelligence in supply chain: revolutionizing efficiency and optimization. Int J Ind Eng. (2023) 5:19–28.
62. Muysinaliyev, A, and Aktamov, S. Supply chain management concepts: literature review. IOSR J Bus Manag. (2014) 15:60–6. doi: 10.9790/487X-1566066
63. U.S. Agency for International Development. Supply chain shipment pricing dataset. Washington, DC: USAID (2024).
65. Chen, C-T. Extensions of the TOPSIS for group decision-making under fuzzy environment. Fuzzy Sets Syst. (2000) 114:1–9. doi: 10.1016/S0165-0114(97)00377-1
67. Kang, B, Wei, D, Li, Y, and Deng, Y. A method of converting Z-number to classical fuzzy number. J Inform Comput Sci. (2012) 9:703–9.
68. Keršulienė, V, Zavadskas, EK, and Turskis, Z. Selection of rational dispute resolution method by applying new step-wise weight assessment ratio analysis (Swara). J Bus Econ Manag. (2010) 11:243–58. doi: 10.3846/jbem.2010.12
69. Yager, RR. On Z-valuations using Zadeh's Z-numbers. Int J Intell Syst. (2012) 27:259–78. doi: 10.1002/int.21521
70. Zavadskas, EK, Turskis, Z, and Antucheviciene, J. Optimization of weighted aggregated sum product assessment. Electron Electri Eng. (2012) 122:3–6. doi: 10.5755/j01.eee.122.6.1810
71. Zavadskas, EK, Turskis, Z, and Antucheviciene, J. Selecting a contractor by using a novel method formultiple attribute analysis: weighted aggregated sumproduct assessment with grey values (WASPAS-G). Stud Inform Control. (2015) 24:141–50. doi: 10.24846/v24i2y201502
72. Andersen, P, and Petersen, NC. A procedure for ranking efficient units in data envelopment analysis. Manag Sci. (1993) 39:1261–4. doi: 10.1287/mnsc.39.10.1261
73. Banker, RD, Charnes, A, and Cooper, WW. Some models for estimating technical and scale inefficiencies in data envelopment analysis. Manag Sci. (1984) 30:1078–92. doi: 10.1287/mnsc.30.9.1078
74. Zavadskas, EK, Govindan, K, Antucheviciene, J, and Turskis, Z. Hybrid multiple criteria decision-making methods: a review of applications for sustainability issues. Econ Res Ekon Istraž. (2016) 29:857–87. doi: 10.1080/1331677X.2016.1237302
75. Vecchia, M, Sacchi, P, Marvulli, LN, Ragazzoni, L, Muzzi, A, Polo, L, et al. Healthcare application of failure mode and effect analysis (FMEA): is there room in the infectious disease setting? A scoping review. Healthcare. (2025) 13:82. doi: 10.3390/healthcare13010082
76. Chin, K-S, Wang, Y-M, Ka Kwai Poon, G, and Yang, J-B. Failure mode and effects analysis using a group-based evidential reasoning approach. Comput Oper Res. (2009) 36:1768–79. doi: 10.1016/j.cor.2008.05.002
77. Mangla, SK, Kumar, P, and Barua, MK. Risk analysis in green supply chain using fuzzy AHP approach: a case study. Resour Conserv Recycl. (2015) 104:375–90. doi: 10.1016/j.resconrec.2015.01.001
78. Stamatis, DH. FMEA a general overview. Failure mode and effect analysis: FMEA from theory to execution. Milwaukee, WI: ASQ Quality Press (2003).
79. Ghazvinian, A, Feng, B, and Feng, J. Enhancing efficiency in the healthcare sector through multi-objective optimization of freight cost and delivery time in the HIV drug supply chain using machine learning. Systems. (2025) 13:91. doi: 10.3390/systems13020091
80. Liu, H-C, Liu, L, and Liu, N. Risk evaluation approaches in failure mode and effects analysis: a literature review. Expert Syst Appl. (2013) 40:828–38. doi: 10.1016/j.eswa.2012.08.010
81. Oluwadare, A, Akintayo, BD, Babatunde, OM, and Olanrewaju, OA. Assessing the impact of healthcare 4.0 technologies on healthcare supply chain management: a multi-criteria evaluation framework. Logistics. (2024) 8:44. doi: 10.3390/logistics8020044
82. Sawik, B. Space Mission risk, sustainability and supply chain: review, multi-objective optimization model and practical approach. Sustainability. (2023) 15:11002. doi: 10.3390/su151411002
83. Karbassi Yazdi, A, Mehdiabadi, A, Wanke, PF, Monajemzadeh, N, Correa, HL, and Tan, Y. Developing supply chain resilience: a robust multi-criteria decision analysis method for transportation service provider selection under uncertainty. Int J Manag Sci Eng Manag. (2022) 18:51–64. doi: 10.1080/17509653.2022.2098543
84. Shakibaei, H, Farhadi-Ramin, MR, Alipour-Vaezi, M, Aghsami, A, and Rabbani, M. Designing a post-disaster humanitarian supply chain using machine learning and multi-criteria decision-making techniques. Kybernetes. (2023) 53:1682–709. doi: 10.1108/K-10-2022-1404
85. Boonsothonsatit, G, Vongbunyong, S, Chonsawat, N, and Chanpuypetch, W. Development of a hybrid AHP-TOPSIS decision-making framework for technology selection in hospital medication dispensing processes. IEEE Access. (2024) 12:2500–16. doi: 10.1109/ACCESS.2023.3348754
86. Abhilasha, A, and Danish, F. Optimization for a sustainable supply chain using fuzzy VIKOR method: an application on a real dataset. IEEE Access. (2024) 12:131882–91. doi: 10.1109/ACCESS.2024.3460589
87. Senapati, T, Sarkar, A, and Chen, G. Enhancing healthcare supply chain management through artificial intelligence-driven group decision-making with Sugeno–weber triangular norms in a dual hesitant q-rung orthopair fuzzy context. Eng Appl Artif Intell. (2024) 135:108794. doi: 10.1016/j.engappai.2024.108794
88. Moosivand, A, Rangchian, M, Zarei, L, Peiravian, F, Mehralian, G, and Sharifnia, H. An application of multi-criteria decision-making approach to sustainable drug shortages management: evidence from a developing country. J Pharm Health Care Sci. (2021) 7:14. doi: 10.1186/s40780-021-00200-3
Keywords: HIV drugs, supply chain optimization, multi-criteria decision-making, Z-number, FMEA, Z-DEA, global health logistics
Citation: Ghazvinian A, Feng B and Feng J (2025) Z-DEA-FMEA: identifying effective strategies for optimizing the HIV drugs supply chain using multi-criteria decision-making approaches. Front. Public Health. 13:1446073. doi: 10.3389/fpubh.2025.1446073
Edited by:
Xiaozhen Lai, Peking University, ChinaReviewed by:
Karuppiah Koppiahraj, Saveetha University, IndiaAlexandre Morais Nunes, University of Lisbon, Portugal
Copyright © 2025 Ghazvinian, Feng and Feng. This is an open-access article distributed under the terms of the Creative Commons Attribution License (CC BY). The use, distribution or reproduction in other forums is permitted, provided the original author(s) and the copyright owner(s) are credited and that the original publication in this journal is cited, in accordance with accepted academic practice. No use, distribution or reproduction is permitted which does not comply with these terms.
*Correspondence: Bo Feng, MTE5MjEyMTZAbmp1c3QuZWR1LmNu