 Zelalem Tilahun Muche1*
 Awgichew Behaile Teklemariam2
 Endeshaw Chekol Abebe3
 Melaku Mekonnen Agidew2
 Tekile Mengie Ayele4
 Edgeit Abebe Zewde1
 Anemut Tilahun Mulu2
 Gebrehiwot Ayalew Tiruneh5
 Demewoz Kefale6
 Deribew Abebaw Abuhay1
 Milkessa Bayissa Midekssa7
 Nega Dagnew Baye8
- 1Department of Medical Physiology, College of Health Sciences, Debre Tabor University, Debre Tabor, Ethiopia
- 2Department of Medical Biochemistry, College of Health Sciences, Debre Tabor University, Debre Tabor, Ethiopia
- 3University of South Australia, Adelaide, SA, Australia
- 4Department of Pharmacy, College of Health Sciences, Debre Tabor University, Debre Tabor, Ethiopia
- 5Department of Midwifery (Clinical Midwifery), Debre Tabor University, Debre Tabor, Ethiopia
- 6Department of Pediatrics and Child Health Nursing, Debre Tabor University, Debre Tabor, Ethiopia
- 7Department of Sport Science, Sport Science Academy, Haramaya University, Haramaya, Ethiopia
- 8Department of Human Anatomy, School of Medicine, College of Medicine and Health Science, University of Gondar, Gondar, Ethiopia
Background: Physical inactivity (PI) increases the risk of cardiovascular diseases, cancer, diabetes, cognitive impairment, poor sleep, poor bone health, obesity, economic crises, and premature mortality. Globally, 31% of adults are physically inactive, indicating that this is the major public health issue of this century. Physical inactivity prevalence varies among countries, regions, and cities. In addition, data were scarce in the study area.
Objective: This study identified the prevalence and determinants of PI among adults in Northwest Ethiopia.
Method: A community-based cross-sectional study was conducted from February to March 2024. Participants were recruited via multistage sampling, and the data were collected via WHO stepwise standard questionnaires. Binary and multivariable logistic regressions were used to identify the predictors of physical inactivity.
Results: This study involved 592 participants, with a mean age of 36.2 ± 12.6 years, 56.4% of whom were males. Nearly three-fourths (71.5%) of the respondents had no awareness of physical activity guidelines. The prevalence of PI was 46.1%. Increasing age, being female, being a government or nongovernment employee, having a high level of education, having a high family monthly income, currently smoking, chewing khat, drinking alcohol, being overweight or obese, unawareness of physical activity guidelines, and lacking a plan to do physical activity were associated with PI.
Conclusion: 46.1% of adults were physically inactive, highlighting a significant public health concern. Thus, we emphasize improving physical activity by promoting its health benefits, raising awareness about the guidelines, and encouraging adults to have a plan to do physical activity.
1 Introduction
Physical activity (PA) is any bodily movement (during leisure time, transport, and work or domestic activities) produced by skeletal muscles that requires energy expenditure. Regular PA improves health and overall well-being. It is vital for the prevention and management of non-communicable diseases (NCDs) (1–3) and increases life expectancy (4). However, many people remain physically inactive (PIA) (3, 5).
Physical inactivity (PI) is one of the leading risk factors for NCDs and mortality (1, 5, 6). It increases the risk of cardiovascular diseases, cancer, diabetes, depression, anxiety, cognitive impairment, poor sleep, poor bone health, obesity, and economic crises (1–6). A meta-analysis revealed that PI increased the risk of breast cancer by 14%, colon cancer by 21%, diabetes by 28%, ischemic heart disease by 25%, and ischemic stroke by 26% (7). PI increases the risk of death by 20%−30% (1), causes more than 1.3 million deaths (4), and costs 27 billion dollars annually (1).
PI is a pandemic and the main health challenge of the twenty-first century (3, 4, 8). The World Health Organization (WHO) reported that 31% (1.8 billion) of adults are PIA globally (1, 8). A study conducted in 2020 revealed that PI is highest in high-income Asian–Pacific countries (48.1%) and lower-middle-income countries (38.2%), and the country-specific prevalence ranged from 2.7% to 66.1% (8). Although the global target is to reduce the PI by 15% by 2030 from the 2010 baseline, it increased by 5% between 2010 and 2022 and will rise to 35% by 2030 (1, 8).
A study performed among 38 Muslim countries worldwide reported that the prevalence of PI was 32.3% (28.6% for non-Arabs and 43.7% for Arabs), indicating that it is higher in the Muslim world (9). The prevalence rates were 66.1% in the United Arab Emirates (8), 43.3% in Nepal (10), 41.1% in Brazil (11), 36.7% in India (12), 36.3% in Malaysia (13), 41.4% in university students in Malaysia (14), 30%−70% in Iran (15), 22.3% in China (16), and 21.6% in Armenia (17).
In Africa, nearly one-fourth (22%) of adults are PIA, and this number is projected to increase. In sub-Saharan Africa, the PI is one of the 10 risk factors for NCD, indicating a wicked problem (3). Several studies have shown that the prevalence of PI is 57.4% in South Africa (18), 52% in Nigeria (19), 49.8% in Umuahia, Nigeria (20), 37.6% in Uganda (21), 53.8% in Khartoum, Sudan (22), 7.7% in Kenya (23), and 2.7% in Malawi (8).
In Ethiopia, a national NCD survey conducted in 2015 revealed that the prevalence of PI is 6% (24). According to the WHO 2022 report on the global status of PA: country profile, 12% of men and 20% of women in Ethiopia are PIA (25). However, other individual studies on different cities in Ethiopia have shown a higher prevalence, ranging from 29.5% to 65.6% (26–33). In addition, the PI among patients with chronic conditions in Ethiopia ranges from 30% to 68% (34–36).
Moreover, many studies have indicated that sociodemographic factors (age, sex, occupation, educational status, marital status, residence, and monthly income), behavioral factors (khat chewing and alcohol consumption), health factors (diabetes, heart disease, cancer, chronic respiratory diseases, and hypertension), overweight or obesity, and having no information about PA guidelines are associated with PI (13, 14, 16, 17, 29–34).
The prevalence of PI in Ethiopia is high and increasing. Its prevalence varies across regions and cities. Many studies conducted in Ethiopia have indicated that the magnitude of PI among adults is 45.1% in Dire Dawa City (32), 45.5% in Harar City (30), 44.1% in Wolaita Sodo City (28), Haramaya University (49.1%) (27), and Southwest Ethiopia (61.2%) (29). Two studies done in Northwest Ethiopia revealed that 65.6% of older adults in Gondar City (33) and 37.9% of adults in Bahir Dar city are PIA (31). Moreover, there are limited data in our study area. Therefore, this study assessed the prevalence and associated factors of PI among adults in towns and City of South Gondar Zone, Northwest Ethiopia.
2 Materials and methods
2.1 Study setting, design, and period
A community-based cross-sectional study was conducted among adults residing in South Gondar Zone, Amhara regional state, Northwest Ethiopia (https://www.mindat.org/loc-406543.html) from March to April 2024. This zone has 14 district towns and one metropolitan city (Debre Tabor) that contains three sub cities or woredas. The city is located 665 km from Addis Ababa and 100 km from Bahir Dar city. According to the 2007 census conducted by the Central Statistical Agency of Ethiopia, this zone has a total population of 2,051,738 and an area of 14,095.19 square kilometers. It has one tertiary hospital and nine primary hospitals.
2.2 Population
The source of population were all adults ≥18 years old who lived in towns and cities of the South Gondar Zone in Northwest Ethiopia. The study population were all adults ≥18 years old who lived in the study area, and were available during the data collection. Adults aged ≥18 years old and who lived for ≥6 months in the study area were included in the study, whereas pregnant women, lactating women, severely sick individuals, and disabled people were excluded from the study.
2.3 Sample size determination and sampling procedure
The sample size was determined via a single population proportion formula, where the prevalence of PI among adults in Dire Dawa City (the capital city of Dire Dawa in East Ethiopia) was 45.1% (32).
where n = sample size, z = standard normal variable at the 95% confidence level (1.96), p = the prevalence of PI in Dire Dawa City (0.451), and d = margin of error (0.05).
Considering the design effect 1.5, n = 381 × 1.5 = 571.5 ≈ 572, then adjusted for non-response rate (5%) and n = 572 + 572 × 5/100 = 600.6 ≈ 601.
Multistage sampling was employed to select the participants. Among 14 towns and one metropolitan city that contains three sub cities, 6 towns and one metropolitan city that contains 36 kebeles (lowest level of local government in Ethiopia) with 12,600 households (Hh) were randomly selected. From these, we randomly selected 19 kebeles, which contains 7,420 Hh. Of these we selected 601 Hh proportionally via systematic random sampling from each kebele. Finally, participants were randomly selected from each Hh (Figure 1).
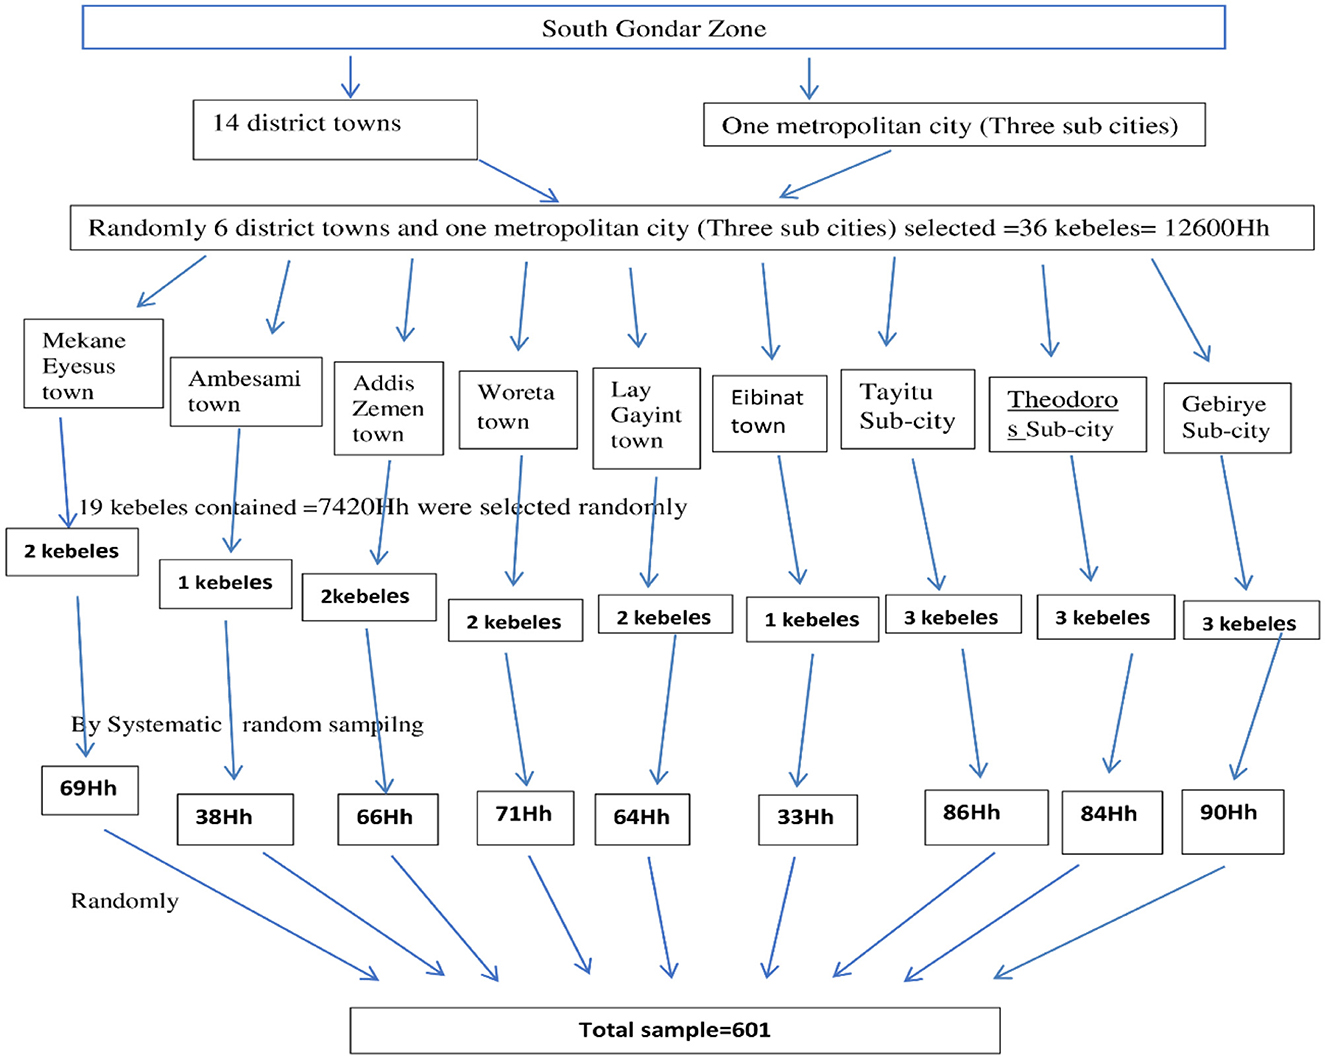
Figure 1. Sampling procedure for the selection of participants in the South Gondar Zone, Northwest Ethiopia, 2024 (n = 592). Hh, House hold.
2.4 Study variables
Physical inactivity was the dependent variable. Sociodemographic factors (age, sex, occupation, educational status, marital status, and monthly income), behavioral factors (smoking, khat chewing, and alcohol consumption), overweight or obesity, central obesity, presence of community PA program, having a plan to do PA, time for PA, and having no information about PA guidelines were independent variables.
2.5 Operational and term definitions
BMI (kg/m2) was classified into the following categories: underweight (< 18.5 kg/m2), normal (18.5–24.9 kg/m2), overweight (25.0–29.9 kg/m2), or obese (≥30.0 kg/m2) (5).
Central obesity: Male participants with a waist circumference of > 94 cm and female participants with a waist circumference of > 80 cm were classified as having central obesity (5).
High physical activity: a person fulfilling any of the following criteria:
• Vigorous-intensity activity on at least 3 days, achieving a minimum of at least 1,500 metabolic equivalents (MET)-minutes per week or,
• Seven or more days of any combination of walking, moderate- or vigorous-intensity activities achieve a minimum of at least 3,000 MET-minutes per week (5).
Moderate physical activity: a person not meeting the criteria for the “high” category but meet any of the following criteria:
• Three or more days of vigorous-intensity activity of at least 20 min per day or,
• 5 or more days of moderate-intensity activity or walking for at least 30 minutes per day or,
• Five or more days of any combination of walking, moderate- or vigorous-intensity activities achieve a minimum of at least 600 MET-minutes per week (5).
Low physical activity: not meeting any of the abovementioned criteria under moderate- or high-intensity physical activities (5).
Physically Active: A person who performs at least 150 min of moderate-intensity physical activity or 75 min of vigorous-intensity physical activity (fulfills the WHO recommendation on the PA of adults) (5). Physically Inactive: A person who does not perform at least 150 min of moderate-intensity physical activity or 75 min of vigorous-intensity PA (does not fulfill the WHO recommendation on the PA of adults) (5). Past smoker: a person with a history of use of any tobacco product (5). Current smoker: an adult who smoked a cigarette at least once in the last 30 days before the data collection time (5).
Past alcohol drinker: a person with a history of any type of alcohol use (5). Current alcohol drinker: a person with a history of any type of alcohol use in the past 30 days (5). Past khat chewer: a person with a history of use of any tobacco product (5). Current khat chewer: a person with a history of chewing khat in the past 30 days (5).
2.6 Data collection and measurement
Data were collected, and parameters were measured via the WHO stepwise approach to NCD risk factor surveillance (instrument v.3.2) standard questionnaires and measurement principles (5). All sociodemographic, health-related, and behavioral data were collected through face-to-face interviews conducted by six trained nurses over a period of 30 days, and the information was documented by the data collectors. Following the collection of this data, anthropometric measurements were taken. Height was measured using a stadiometer to the nearest 0.1 cm with the subjects positioned on the Frankfurt plane without shoes or a cap. The back of the head, shoulder blades, buttocks, and heels touch the stadiometer. Weight was measured via a digital glass weight scale to the nearest 0.1 kg, with the subjects wearing light clothes and shoes removed. Waist circumference was measured at the midpoint between the lowest costal margin at the midclavicular line and the anterior superior iliac spine via fixed tension tape. All anthropometric measurements were performed in triplicate, and the average value was used. BMI was calculated as weight in kilograms (kg) divided by height in meters squared (kg/m2). Physical activity questions, which focus on three domains (work, transport, and recreation) were gathered using the WHO stepwise approach to NCD risk factor surveillance, part five, Section 2 (question-by-question guide, version 3.2, pages 5-2-10 to 5-2-11) (5). We utilized the core aspects of the PA questions to obtain essential information about the types of activities (both vigorous and moderate-intensity), the number of days each type of activity is performed per week, and the duration of each activity conducted during the week.
2.7 Data processing and statistical analysis
The data were checked for completeness, cleaned, entered into Epi Info version 7, and exported to SPSS version 25. The categorical and continuous data were summarized by frequency and percentage and means ± standard deviations, respectively, and were presented in tables and graphs. Univariable and multivariable logistic regression were performed to identify the predictors. During binary logistic regression, variables with P-values < 0.25 were entered into a multivariable logistic regression. The model's fitness was determined via the Hosmer–Lemeshow goodness-of-fit statistic. Homogeneity of variances, collinearity, and outliers were checked. The degree of association was assessed via the crude odds ratio (COR) and adjusted odds ratio (AOR) with their respective 95% CIs, and a P-value < 0.05 indicated statistical significance.
2.8 Data quality control and management
We used the WHO stepwise standard questionnaires, which were translated from English into the local Amharic language by English teachers at Debre Tabor University. A pretest was undertaken in 5% of the study population at Woreta town to check the completeness of the questionnaire, clarity of language, and consistency. The completeness of the data was checked during data collection, entry, and analysis.
3 Results
3.1 Sociodemographic characteristics of the participants
A total of 592 respondents participated, with a response rate of 98.5%. The mean age of the respondents was 36.2 ± 12.6 years, and the majority (51%) were 30–44 years. The majority were male (56.4%), married (67.1%), Orthodox Christian (85.5%), and Amhara ethnic (92%). 25.1% of the participants had no formal education (Table 1).
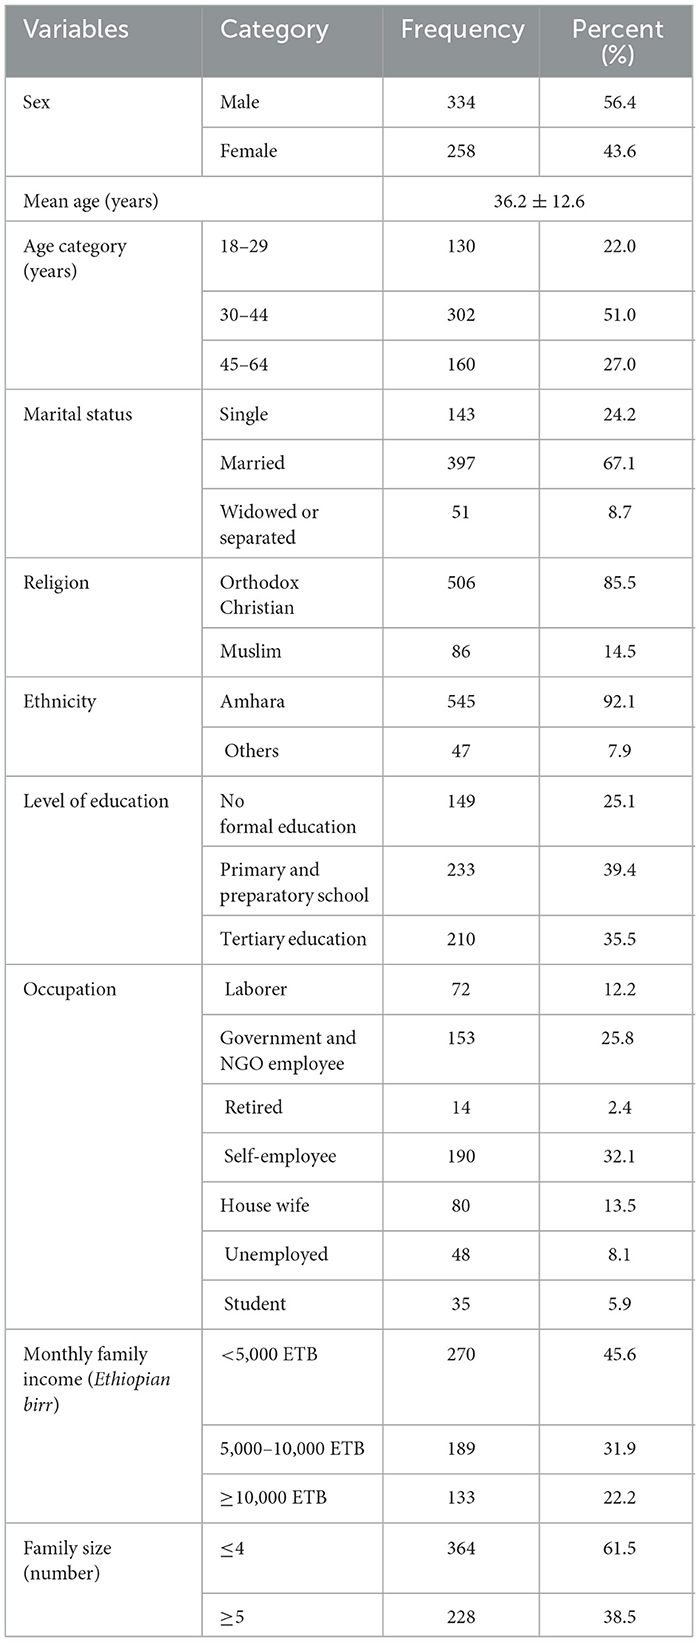
Table 1. Sociodemographic characteristics of adults aged 18–64 years in Northwest Ethiopia, 2024 (n = 592).
3.2 Behavioral and anthropometric characteristics of the respondents
This study revealed that 65 (10.5%), 118 (19.9%), and 501 (84.6%) of the participants were current smokers, khat chewers, and alcohol drinkers, respectively. The majority of the participants had central obesity (35.1%), had no information about PA guidelines (71.5%), and had time for PA (66.9%) (Table 2).
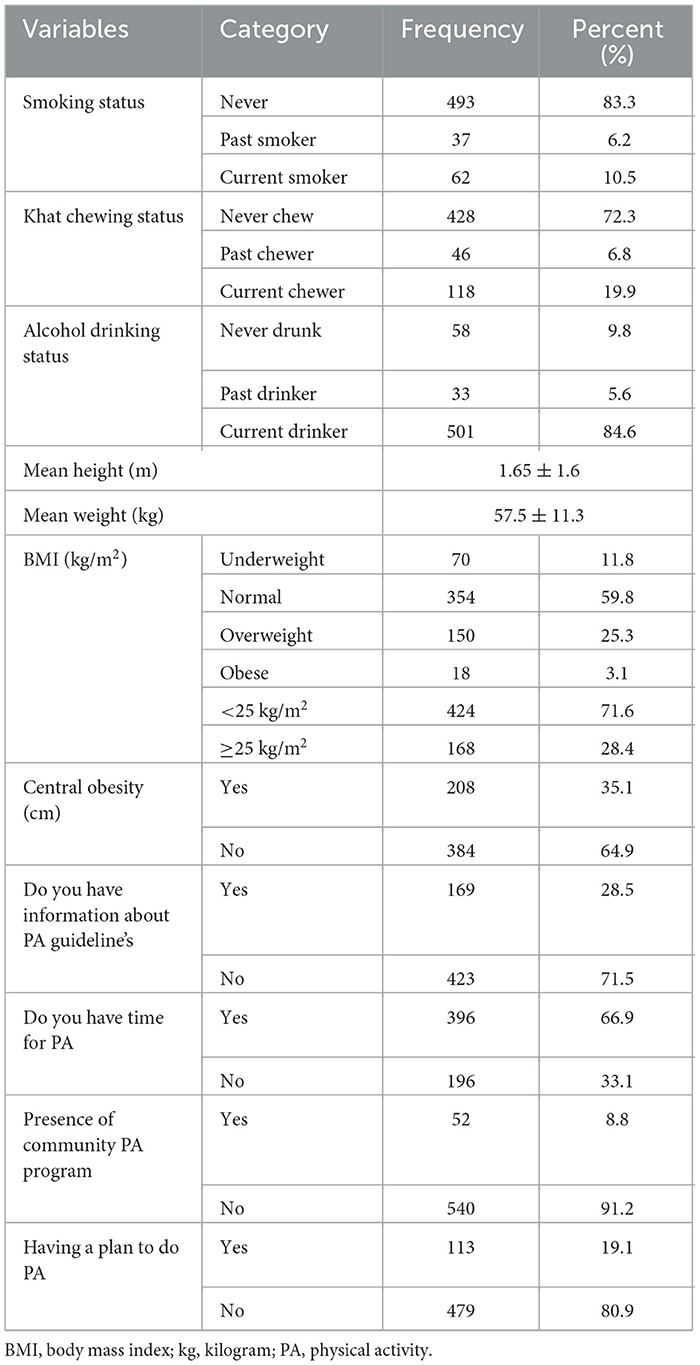
Table 2. Behavioral and anthropometric characteristics of adults aged 18–64 years in Northwest Ethiopia, 2024 (n = 592).
3.3 Health-related characteristics of the participants
Among all the participants, 79 (13.3%), 48 (8.1%), and 22 (3.7%) had hypertension, diabetes, and chronic kidney disease, respectively (Table 3).
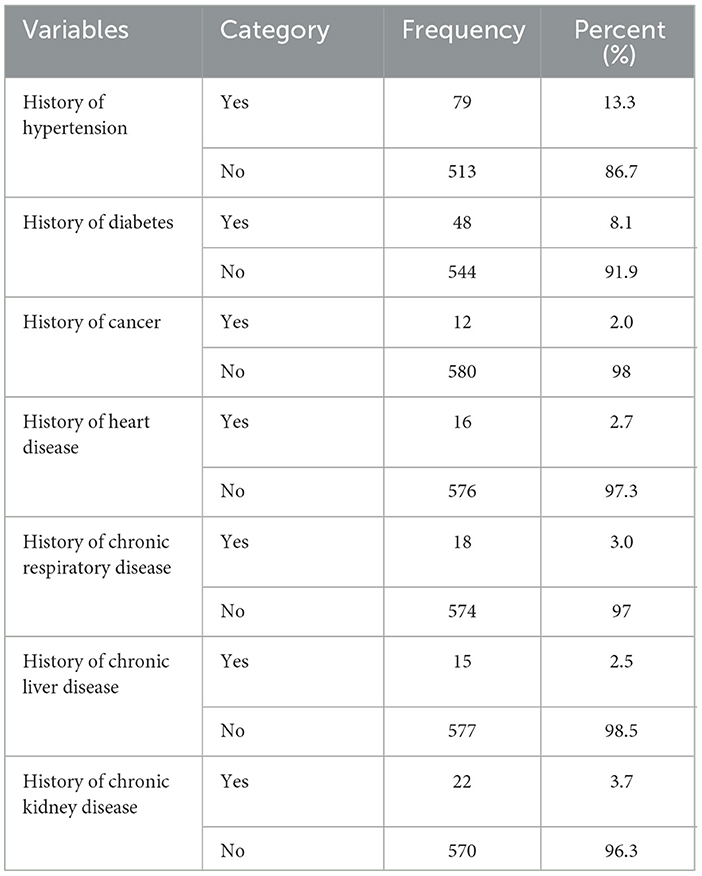
Table 3. Health-related characteristics of adults aged 18–64 years in Northwest Ethiopia, 2024 (n = 592).
3.4 Prevalence of PI among respondents
This study revealed that 98 (16.6%), 221 (37.3%), and 273 (46.1%) of the participants had high, moderate, and low levels of PA, respectively. The prevalence of PI was 273 (46.1%) (Figure 2).
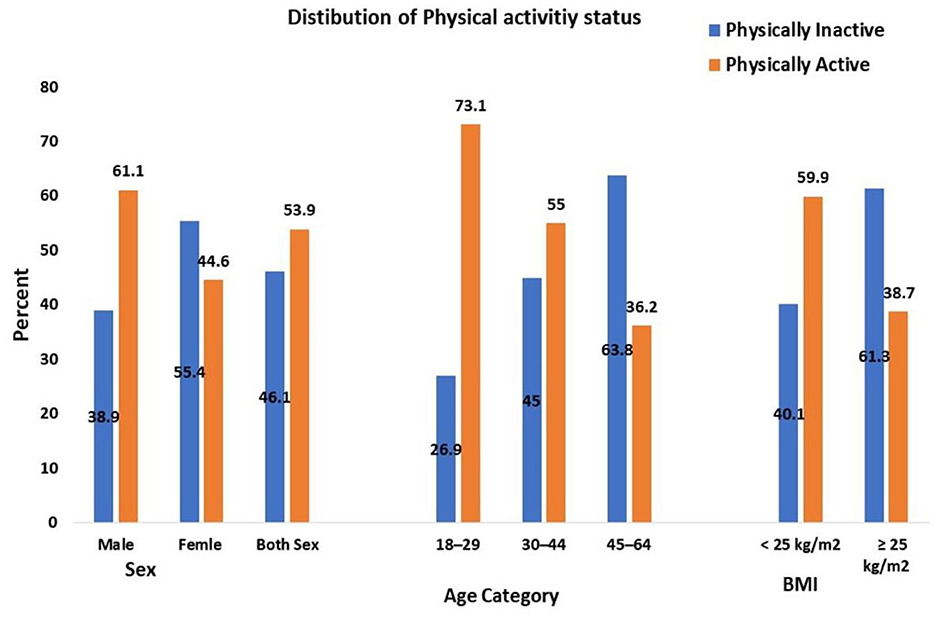
Figure 2. Physical activity status of adults aged 18–64 years in Northwest Ethiopia, 2024 (n = 592). BMI, Body mass index, kg/m2, kilogram per meter square, age expressed in years.
3.5 Factors associated with PI
The odds of PI among participants aged 30–44 and 45–64 years were four and seven times greater than those among participants aged 18–29 years, respectively (adjusted odds ratio (AOR) = 4.2, 95% CI: 2.89, 10,34; AOR = 7.1, 95% CI: 4.53, 12.16). Women were 3.7 times more likely to have PI than men (AOR = 3.7, 95% CI: 2.48, 10.82). Those who have attended tertiary education, government and NGO employees and those with a family monthly income ≥10,000 Ethiopian Birr (ETB) were 4.75, 3.1, and 3.7 times more likely to have PI than single, those who had no formal education, laborers, and those with a family monthly income < 5,000 ETB, respectively. Current smokers, khat chewers, and alcohol drinkers were 6.26, 5.79, and 8.05 times more likely to have PI than non-smokers, never chewed khat, and non-drinkers, respectively. Respondents who had no information about PA guidelines and lacked plans to perform PA were five and seven times more likely to have PI than their counterparts (Table 4).
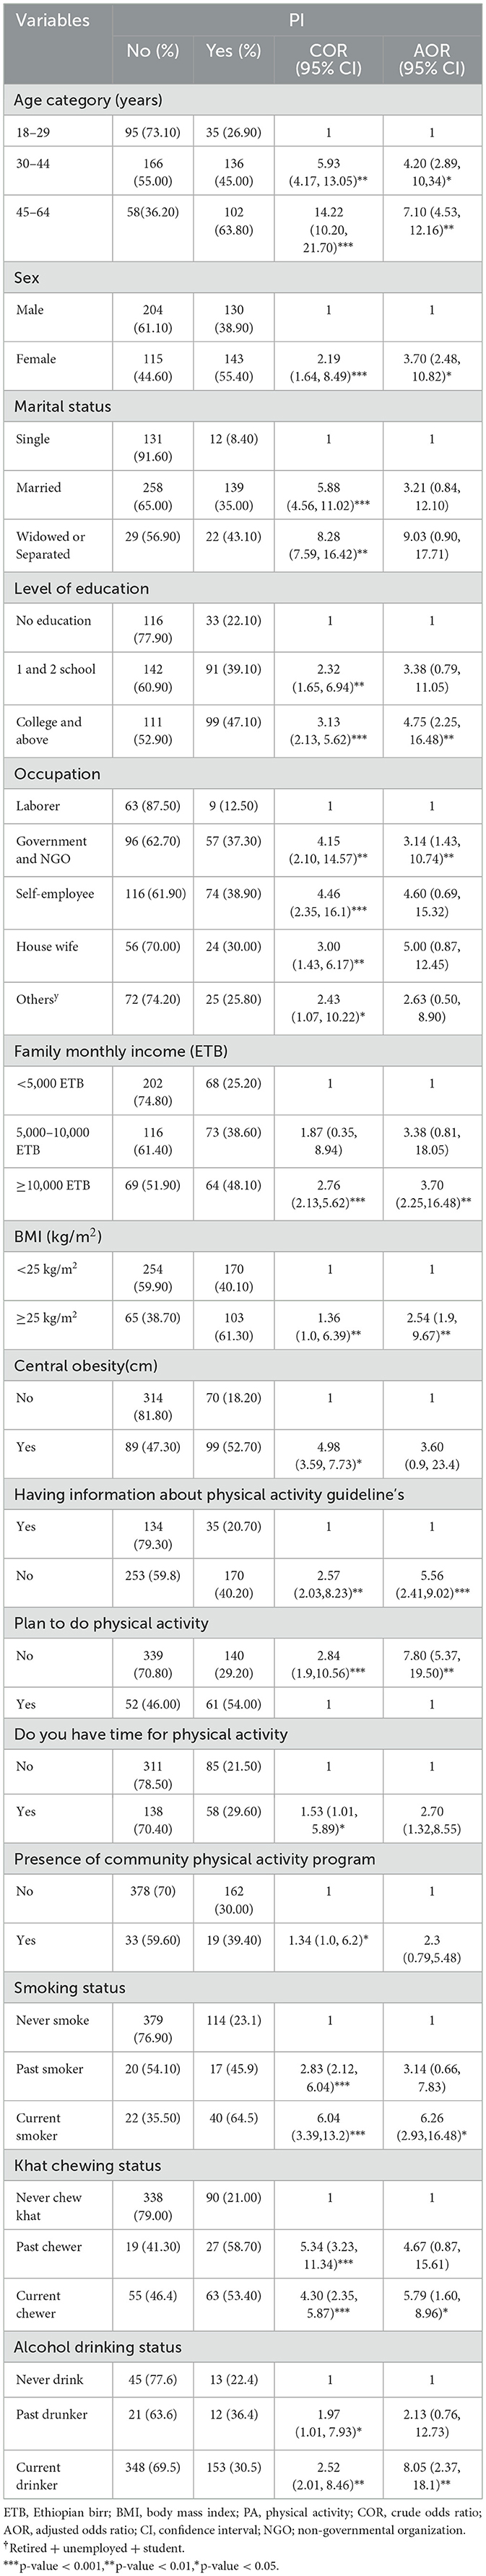
Table 4. Binary and multivariable logistic regression analysis of factors associated with physical inactivity among adults aged 18–64 years in Northwest Ethiopia, 2024 (n = 592).
3 Discussion
The current study revealed that the proportion of PI among adults was 46.1%. This finding is consistent with other studies that reported 45.5% in Harar City, Ethiopia (30); 45.1% in Dire Dawa City, Ethiopia (32); and 44.1% in Wolaita Sodo City, Ethiopia (28).
Our finding is lower than the studies conducted in the United Arab Emirates (66.1%) (8), the United Kingdom (64%) (37), South Africa (57.4%) (18), Khartoum, Sudan (22), Nigeria (52%) (19), Umuahia, Nigeria (49.8%) (20), Iran (30–70%) (15), Southwest Ethiopia (61.2%) (29), Haramaya University, Ethiopia (49.1%) (27), and Gondar City, Ethiopia (65.6%) (33). This inconsistency could be due to differences in the study area, study period, sociodemographic characteristics, behavioral and anthropometric characteristics, and health-related factors. For example, in the United Arab Emirates (8) and the United Kingdom (37), there may be high income and high urbanization, and people may use vehicles for transport, which can increase the odds of PI (12, 14, 16, 30). One study reported that the PI exceeded 50% in the United Arab Emirates, Kuwait, Cuba, Lebanon, South Korea, Panama, Qatar, Iraq, Portugal, and Saudi Arabia (8). Another explanation is that participant occupation differences between studies can cause the above variation (27).
However, the prevalence of PI in this study is higher than other studies that showed the magnitude of PI was 43.3% in Nepal (10), 41.1% in Brazil (11), 36.7% in India (12), 36.3% in Malaysia (13), 22.3% in China (16), 21.6% in Armenia (17), 37.6% in Uganda (21), 7.7% in Kenya (23), 2.7% in Malawi (8), 6% to 20% in Ethiopia (24, 25), 29.5% in Bale zone towns, Ethiopia (26), 37.9% in Bahir Dar City, Ethiopia (31). This difference could be due to differences in the study area, study period, sociodemographic characteristics, behavioral and anthropometric characteristics, and health-related factors. For example, the Ethiopia National NCD survey revealed that the PI was 6%; this survey was conducted 9 years ago, and it included both urban and rural residents (24). The PI varies across countries, regions, and cities (1, 3, 8). In the present study, almost five out of every 10 adults were PIA. This finding suggests the need to promote PA, which in turn requires a collaborative public health response targeting older, female, and employed adults (12, 26, 32).
The present study revealed that the likelihood of PI increases as age increases. The odds of PI among those aged 30–44 years and 45–64 years were 4.2 and 7.1 times greater than those aged 18–29 years, respectively. This finding is consistent with several previous studies (10, 29, 30, 33, 34). This can be explained by aging, which causes a reduction in muscle strength, flexibility, agility, changes in body fat percentage, and endurance, which impacts PA (38). Age increases the odds of PI, which emphasizes the need for community-based PA programs targeting older adults (12, 29, 33, 38).
In this study, being female increased the odds of PI by 3.7 times. This finding is similar to the previous studies showing that being female increases the odds of PI (10, 13, 17, 29, 30, 32, 34). This can be explained by females spending more time engaging in sedentary behavior than males do, either due to cultural or other factors. One study revealed that the global prevalence of PI in 2022 was 5% higher in females than in males. However, this difference can be >10% in one-third of countries and >20% in six countries such as Afghanistan (8). This finding warrants encouraging women to do PA by avoiding gender role variations and increasing the availability of physical infrastructures suitable for women (26, 29).
Our study revealed that participants who have attended tertiary education were 4.75 times more likely to have PI than those who had no formal education. This may be because as the level of education increases, there will be more chances to be employed in organizations that need sedentary behavior to do their work. This is supported by many other studies (10, 24, 29, 33). However, other studies did not report such an association (27, 32). The present study showed that being a government or NGO employee increases the odds of PI by 3.1 times as compared to a laborer. This result is similar to studies that showed that being a government employee (10, 16, 22, 32) and being a non-manual worker (27) increases the odds of PI. Conversely, a study performed in southeast Ethiopia showed that being unemployed increases the odds of PI (26). The participants who had a family monthly income ≥10,000 ETB were 3.7 times more likely to have PI than those who had < 5,000 ETB (32). This finding is consistent with several studies that indicated that high income increases the likelihood of PI (12, 14, 16, 18, 20, 30). Generally, as the level of education and income increase, sedentary behavior increases, which can increase the odds of PI. This highlights the need to increase the PA by inspiring the adults to have a plan to do PA (20, 29).
In this study, overweight or obesity increased the likelihood of PI by 2.54 times. This finding is supported by other studies that showed that overweight or obesity increases the odds of PI (10, 20–22, 26, 27). The results of our study indicated that respondents who had no information about PA guidelines were five times more likely to have PI than their counterparts. This finding is consistent with another study conducted in Harar City, Ethiopia, which revealed that having no information about PA guidelines increases the likelihood of PI by 3.5 times (30, 39). This can be explained by a study conducted in Ethiopia that showed that only 27% of participants had good knowledge of the PA guidelines (40). Some studies revealed that increasing unawareness about the PA guidelines decreases the likelihood of PI (29, 30, 39, 40).
In our finding having time is not significantly associated with PI.
The present findings revealed that current khat chewers and alcohol drinkers were more than five and eight times more likely to have PIs than never chewed khat and non-drinkers, respectively. This finding coincides with studies that reported that khat chewing (27) and alcohol consumption (20, 27) increase the odds of PI. This could be due to sedentary behavior during khat chewing and alcohol consumption and the consequences of these habits. Hence avoiding smoking and alcohol drinking may increase PA.
4 Strength and limitations of the study
This study stands out for its novelty as the first of its kind in the area, offering valuable insights, a baseline data for informing future research and public health intervention, we used standard tools, and questionnaires were pretested. However, the study has potential limitations. First, the study design was a cross-sectional study, which does not explain the cause-effect relationship. Second, the study was done in a specific study area (Northwest Ethiopia) rather than at the national level, making it difficult to generalize the findings to other regions. Third recall bias might be introduced in the study as we rely on self-reporting data. Hence, longitudinal studies should be done to understand the dynamics and the causation of the observed factors.
5 Conclusion
This study revealed a high prevalence of PI among adults in Northwest Ethiopia, indicating that it is an epidemic in the community. Being a government or non-government employee, having a high level of education, having a high family monthly income, current smoking, khat chewing, alcohol drinking, being overweight or obese, having no information about PA guidelines, and lacking a plan to perform PA were associated with PI. As a result of high PI, the majority of adults are at a greater risk of developing NCDs, other health problems, and premature death. Consequently, community-based interventions are essential to increase PA. Priority should be given to specific groups, including older adults, women, government and non-government employees, those who have attended tertiary education, those with high income, smokers, khat chewers, and alcohol drinkers. Besides, we should emphasize increasing PA by increasing awareness about PA guidelines via health education and encouraging adults to have a plan to do PA.
Data availability statement
The original contributions presented in the study are included in the article/supplementary material, further inquiries can be directed to the corresponding author.
Ethics statement
The studies involving humans were approved by Debre Tabor University's, Research and Ethical Review Committee. The studies were conducted in accordance with the local legislation and institutional requirements. The participants provided their written informed consent to participate in this study.
Author contributions
ZT: Conceptualization, Data curation, Formal analysis, Investigation, Methodology, Project administration, Software, Supervision, Validation, Visualization, Writing – original draft, Writing – review & editing. AB: Conceptualization, Data curation, Formal analysis, Investigation, Methodology, Project administration, Software, Supervision, Validation, Visualization, Writing – original draft, Writing – review & editing. EC: Conceptualization, Formal analysis, Software, Validation, Writing – original draft, Writing – review & editing. MA: Conceptualization, Investigation, Writing – original draft, Writing – review & editing. TM: Formal analysis, Investigation, Methodology, Writing – original draft, Writing – review & editing. EZ: Formal analysis, Methodology, Software, Supervision, Validation, Writing – original draft, Writing – review & editing. AT: Formal analysis, Investigation, Methodology, Writing – original draft, Writing – review & editing. GA: Data curation, Formal analysis, Investigation, Writing – original draft, Writing – review & editing. DK: Data curation, Investigation, Writing – original draft, Writing – review & editing. DA: Conceptualization, Data curation, Formal analysis, Writing – original draft, Writing – review & editing. MB: Data curation, Investigation, Writing – original draft, Writing – review & editing. ND: Data curation, Formal analysis, Methodology, Writing – original draft, Writing – review & editing.
Funding
The author(s) declare that no financial support was received for the research and/or publication of this article.
Acknowledgments
We would like to express our deepest gratitude to Debre Tabor University's Research and Ethical Review Committee, the study participants for their cooperation, and the data collectors.
Conflict of interest
The authors declare that the research was conducted in the absence of any commercial or financial relationships that could be construed as a potential conflict of interest.
Generative AI statement
The author(s) declare that no Gen AI was used in the creation of this manuscript.
Publisher's note
All claims expressed in this article are solely those of the authors and do not necessarily represent those of their affiliated organizations, or those of the publisher, the editors and the reviewers. Any product that may be evaluated in this article, or claim that may be made by its manufacturer, is not guaranteed or endorsed by the publisher.
Abbreviations
AOR, Adjusted odds ratio; BMI, Body mass index; COR, Crude odds ratio; ETB, Ethiopian Birr; MET; metabolic equivalents; NCD, non-communicable diseases; PA, Physical activity; PI, Physical inactivity; PIA, Physically inactive; WHO, World Health Organization.
References
1. WHO. Physical Activity Key Facts. (2024), 1–5. Available from: https://www.who.int/news-room/fact-sheets/detail/physical-activity (accessed July 14, 2024).
3. Onagbiye SO, Bester P. Physical inactivity as a wicked problem in Sub-Sahara Africa: overview and recommendations. Open Public Health J. (2022) 15:1–6. doi: 10.2174/18749445-v15-e2202010
4. Lee I-M, Shiroma EJ, Lobelo F, Puska P. Impact of physical inactivity on the world's major non- communicable diseases. Lancet. (2012) 380:219–29. doi: 10.1016/S0140-6736(12)61031-9
5. WHO. The WHO STEPwise approach to noncommunicable disease risk factor surveillance.Q-by-Q Guide v.3.2. (2017). Geneva: WHO (Last Updated: 26 January 2017).
6. Markus L, Sandison B. Impact of physical inactivity as a risk factor for chronic conditions: Australian Burden of Disease Study Australian Burden of Disease Study series no 15 Canberra. (2017). Canberra: Australian Institute of Health and Welfare
7. Kyu HH, Bachman VF, Alexander LT, Mumford JE, Afshin A, Estep K, et al. Physical activity and risk of breast cancer, colon cancer, diabetes, ischemic heart disease, and ischemic stroke events: systematic review and dose-response meta-analysis for the Global Burden of Disease Study 2013. BMJ. (2016) 354:1–10. doi: 10.1136/bmj.i3857
8. Strain T, Flaxman S, Guthold R, Semenova E, Cowan M, Riley LM, et al. National, regional, and global trends in insufficient physical activity among adults from 2000 to 2022: a pooled analysis of 507 population-based surveys with 5–7 million participants. Lancet Glob Heal. (2024) 12:e1232–43. doi: 10.1016/S2214-109X(24)00150-5
9. Kahan D. Adult physical inactivity prevalence in the Muslim world: analysis of 38 countries. Prev Med Reports. (2025) 2:71–5. doi: 10.1016/j.pmedr.2014.12.007
10. Vaidya A, Krettek A. Physical activity level and its sociodemographic correlates in a peri-urban Nepalese population: a cross-sectional study from the Jhaukhel-Duwakot health demographic surveillance site. Int J Behav Nutr Phys Act. (2014) 11:39. doi: 10.1186/1479-5868-11-39
11. Hallal PC, Victora CG, Lima C, Charles J, Wells K. Physical inactivity prevalence and associated variables in Brazilian adults. Med Sci Sport Exerc. (2003) 35:11. doi: 10.1249/01.MSS.0000093615.33774.0E
12. Pengpid S, Peltzer K. Prevalence and associated factors of aged physical inactivity among middle—and older adults in India: results of a national cross-sectional community survey. Br Med J Open. (2022) 12:e058156. doi: 10.1136/bmjopen-2021-058156
13. Tan KL. Factors influencing physical inactivity among adults in Negeri Sembilan, Peninsular Malaysia. Med J Malaysia. (2019) 74:389–93.
14. Goje M, Salmiah MS, Ahmad Azuhairi A, Jusoff K. Physical inactivity and its associated factors among university students of Malaysia. IOSR J Dent Med Sci. (2014) 13:119–30. doi: 10.9790/0853-13101119130
15. Fakhrzadeh H, Djalalinia S, Mirarefin M, Arefirad T, Asayesh H, Safiri S. Prevalence of physical inactivity in Iran: a systematic review. J Cardiovasc Thorac Res. (2016) 8:92–7. doi: 10.15171/jcvtr.2016.20
16. Xingxing G, Limin W, Xiao Z, Zhenping Z, Chun L, Zhengjing H, et al. The prevalence of insufficient physical activity and the influencing factors among Chinese adults in 2018. Chin J Epidemiol. (2023) 44:1190–7. doi: 10.3760/cma.j.cn112338-20221125-01000
17. Tcymbal A, Andreasyan D, Whiting S, Mikkelsen B. Prevalence of physical inactivity and sedentary behavior among adults in Armenia. Front Public Heal. (2020) 8:157. doi: 10.3389/fpubh.2020.00157
18. Mlangeni L, Makola L, Naidoo I, Chibi B, Sokhela Z. Factors associated with physical activity in south africa: evidence from a national population based survey. Open Public Heal J. (2018) 11:516–25. doi: 10.2174/1874944501811010516
19. Adeloye D. Ige-elegbede JO, Auta A, Ale BM, Ezeigwe N, Omoyele C, et al. Epidemiology of physical inactivity in Nigeria: a systematic review and meta-analysis. J Public Health. (2021) 44:595–605. doi: 10.1093/pubmed/fdab147
20. Ukegbu PO, Ortutu BF, Uche PC, Ukegbu U. Factors associated with physical inactivity among community dwelling adults in Umuahia, Nigeria. World Nutr J. (2022) 6:2:49–57. doi: 10.25220/WNJ.V06.i1.0008
21. Wamani H, Fadnes LT, Broeck J Van Den, Sciences B. Physical activity and associated factors among adults in peri-urban and rural Eastern Uganda: a population-based study. J Phys Act Health. (2016) 13:1243–54. doi: 10.1123/jpah.2016-0025
22. Khalil S, Almobarak AO, Awadalla H, Wadie M. Low levels of physical activity in Sudanese individuals with some features of metabolic syndrome: population based study. Diabetes Metab Syndr Clin Res Rev. (2017) 11:S551–4. doi: 10.1016/j.dsx.2017.04.003
23. Gichu M, Asiki G, Juma P, Kibachio J, Kyobutungi C, Ogola E. Prevalence and predictors of physical inactivity levels among Kenyan adults (18–69 years): an analysis of STEPS survey 2015. BMC Public Health. (2018) 18:1217. doi: 10.1186/s12889-018-6059-4
24. Amenu K, Gelibo T, Getnet M, Taddele T, Getachew T, Defar A. Magnitude and determinants of physical inactivity in Ethiopia: evidence form 2015 Ethiopia National NCD Survey. Ethiop J Heal Dev. (2017) 31:348–54.
25. WHO. Global Status Report on Physical Activity 2022.Country Profiles. (2022) Available from: https://www.who.int/publications/i/item/9789240059153
26. Tekalegn Y, Solomon D, Sahiledengle B, Beressa G, Desta F, Tolcha F, et al. Level of physical activity and its associated factors among adults in based southeast Ethiopia: a community—cross-sectional study. BMJ Open. (2022) 12:1–11. doi: 10.1136/bmjopen-2022-063333
27. Motuma A, Gobena T, Roba KT, Berhane Y. Sedentary behavior and associated factors among working adults in Eastern Ethiopia. Front Public Heal. (2021) 9:693176. doi: 10.3389/fpubh.2021.693176
28. Kumma WP, Lindtjørn B, Loha E. Modifiable cardiovascular disease risk factors among adults in southern Ethiopia: a community- based cross-sectional study. BMJ Open. (2022) 12:e05793. doi: 10.1136/bmjopen-2021-057930
29. Zenu S, Abebe E, Reshad M, Dessie Y, Debalke R, Berkessa T. Non-adherence to the World Health Organization' s physical activity recommendations and associated factors among healthy adults in urban centers of Southwest Ethiopia. PLOS Glob PUBLIC Heal. (2023) 3:1–10. doi: 10.1371/journal.pgph.0001451
30. Abdeta C, Teklemariam Z, Seyoum B. Prevalence of physical inactivity and associated factors among adults in Harar town, Eastern Ethiopia. Balt J Heal Phys Act. (2018) 10:72–80. doi: 10.29359/BJHPA.10.2.08
31. Alamnia TT, Sargent GM, Kelly M. Noncommunicable disease risk factors and cardiovascular risk among adults in Ethiopia: a cross-sectional study. Public Heal Chall. (2023) 2:e133. doi: 10.1002/puh2.133
32. Mengesha MM, Roba HS, Ayele BH. Level of physical activity among urban adults and the socio-demographic correlates: a population-based cross-sectional study using the global physical activity questionnaire. BMC Public Health. (2019) 19:1160:1–11. doi: 10.1186/s12889-019-7465-y
33. Shiferaw KB, Yalew ES, Zemed A, Yitayal MM, Belay GJ. Prevalence of physical inactivity and associated factors among older adults in Gondar town, Northwest Ethiopia: a community-based cross-sectional study. BMC Geriatr. (2024) 24:1–9. doi: 10.1186/s12877-024-04701-2
34. Enyew A, Nigussie K, Mihrete T, Jemal M, Alemu E, Mohammed B. Prevalence and associated factors of physical inactivity among adult diabetes mellitus patients in Felege Hiwot Referral Hospital, Bahir Dar, Northwest Ethiopia. Sci Rep. (2023) 13:1–11. doi: 10.1038/s41598-022-26895-4
35. Muche T, Sisay D, Mekuriaw B, Hussen R. Physical inactivity and its association with hypertension among adults in Ethiopia: a systematic review and meta-analysis. Heliyon. (2022) 8:e12023. doi: 10.1016/j.heliyon.2022.e12023
36. Tegene Y, Mengesha S, Starre C Van Der, Lako S, Toma A, Spigt M. Physical activity level and associated factors among adult HIV patients in Ethiopia. BMC Infect Dis. (2022) 22:123:1–8. doi: 10.1186/s12879-022-07120-z
37. Ndupu LB, Faghy M, Staples V, Lipka S, Bussell C. Exploring the predictors of physical inactivity in a university setting. BMC Public Health. (2023) 23:59. doi: 10.1186/s12889-022-14953-5
38. Milanović Z, Pantelić S, Trajković N, Sporiš G, Kostić R, James N. Age-related decrease in physical activity and functional fitness among elderly men and women. Clin Interv Aging. (2013) 8:549–56. doi: 10.2147/CIA.S44112
39. Mohammed E, Kaba M. Perception of regular physical activities and factors affecting physical activities among adult government office worker in Adama Town, Ethiopia: qualitative Study. Am J Heal Res. (2021) 9:190–97. doi: 10.11648/j.ajhr.20210905.17
Keywords: physical inactivity, associated factors, non-communicable diseases, adults, Northwest Ethiopia
Citation: Muche ZT, Teklemariam AB, Abebe EC, Agidew MM, Ayele TM, Zewde EA, Mulu AT, Tiruneh GA, Kefale D, Abuhay DA, Midekssa MB and Baye ND (2025) Prevalence and associated factors of physical inactivity among adults in Northwest Ethiopia: a multicenter study. Front. Public Health 13:1513600. doi: 10.3389/fpubh.2025.1513600
Received: 18 October 2024; Accepted: 22 April 2025;
Published: 16 May 2025.
Edited by:
Demitri Constantinou, University of the Witwatersrand, South AfricaReviewed by:
Naveen Kumar Kodali, Central University of Tamil Nadu, IndiaNatalia Neophytou, University of the Witwatersrand, South Africa
Copyright © 2025 Muche, Teklemariam, Abebe, Agidew, Ayele, Zewde, Mulu, Tiruneh, Kefale, Abuhay, Midekssa and Baye. This is an open-access article distributed under the terms of the Creative Commons Attribution License (CC BY). The use, distribution or reproduction in other forums is permitted, provided the original author(s) and the copyright owner(s) are credited and that the original publication in this journal is cited, in accordance with accepted academic practice. No use, distribution or reproduction is permitted which does not comply with these terms.
*Correspondence: Zelalem Tilahun Muche, dGlsYWh1bnoyMDE4QGdtYWlsLmNvbQ==